
Investigation on the Flow in a Rotor-Stator Cavity with Centripetal Through-Flow †


Abstract
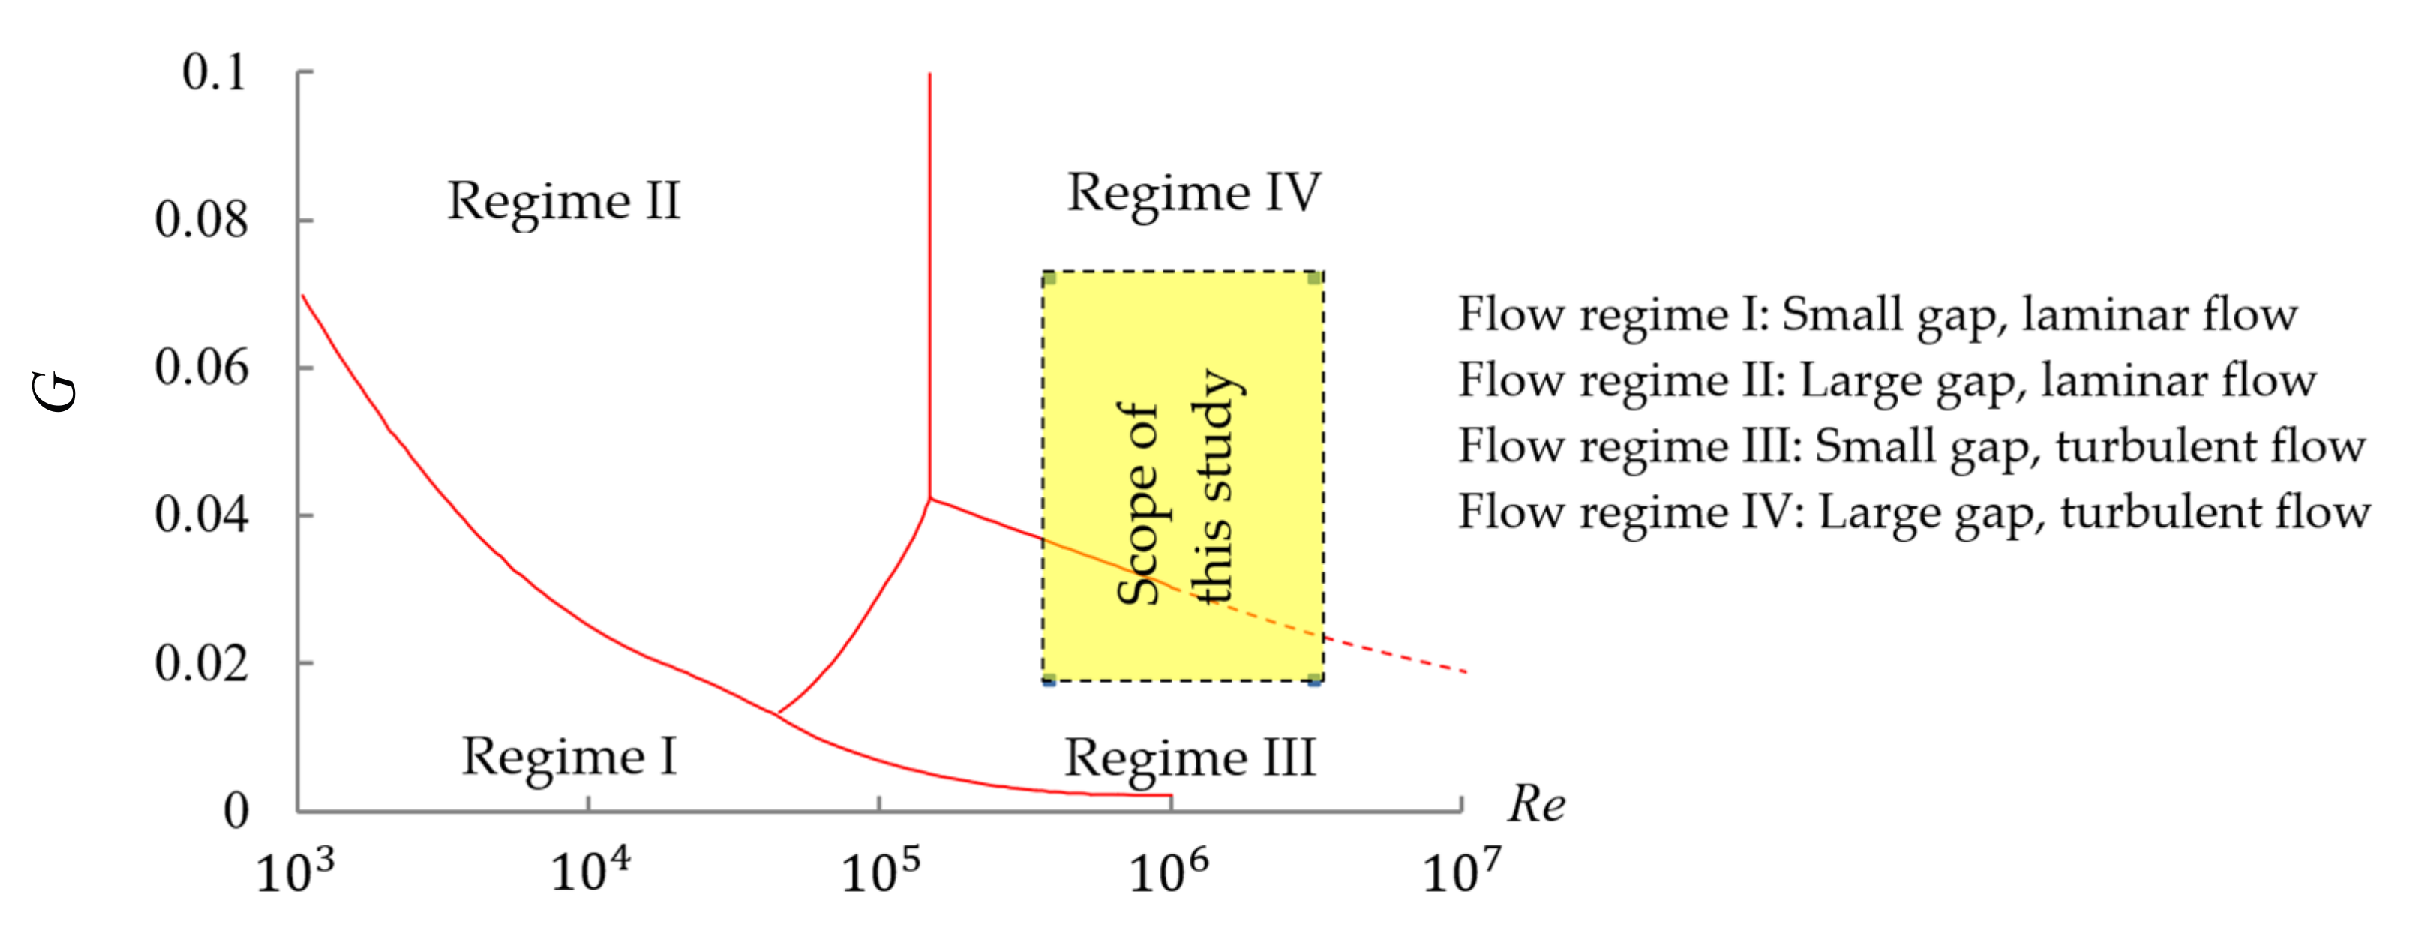
1. Introduction
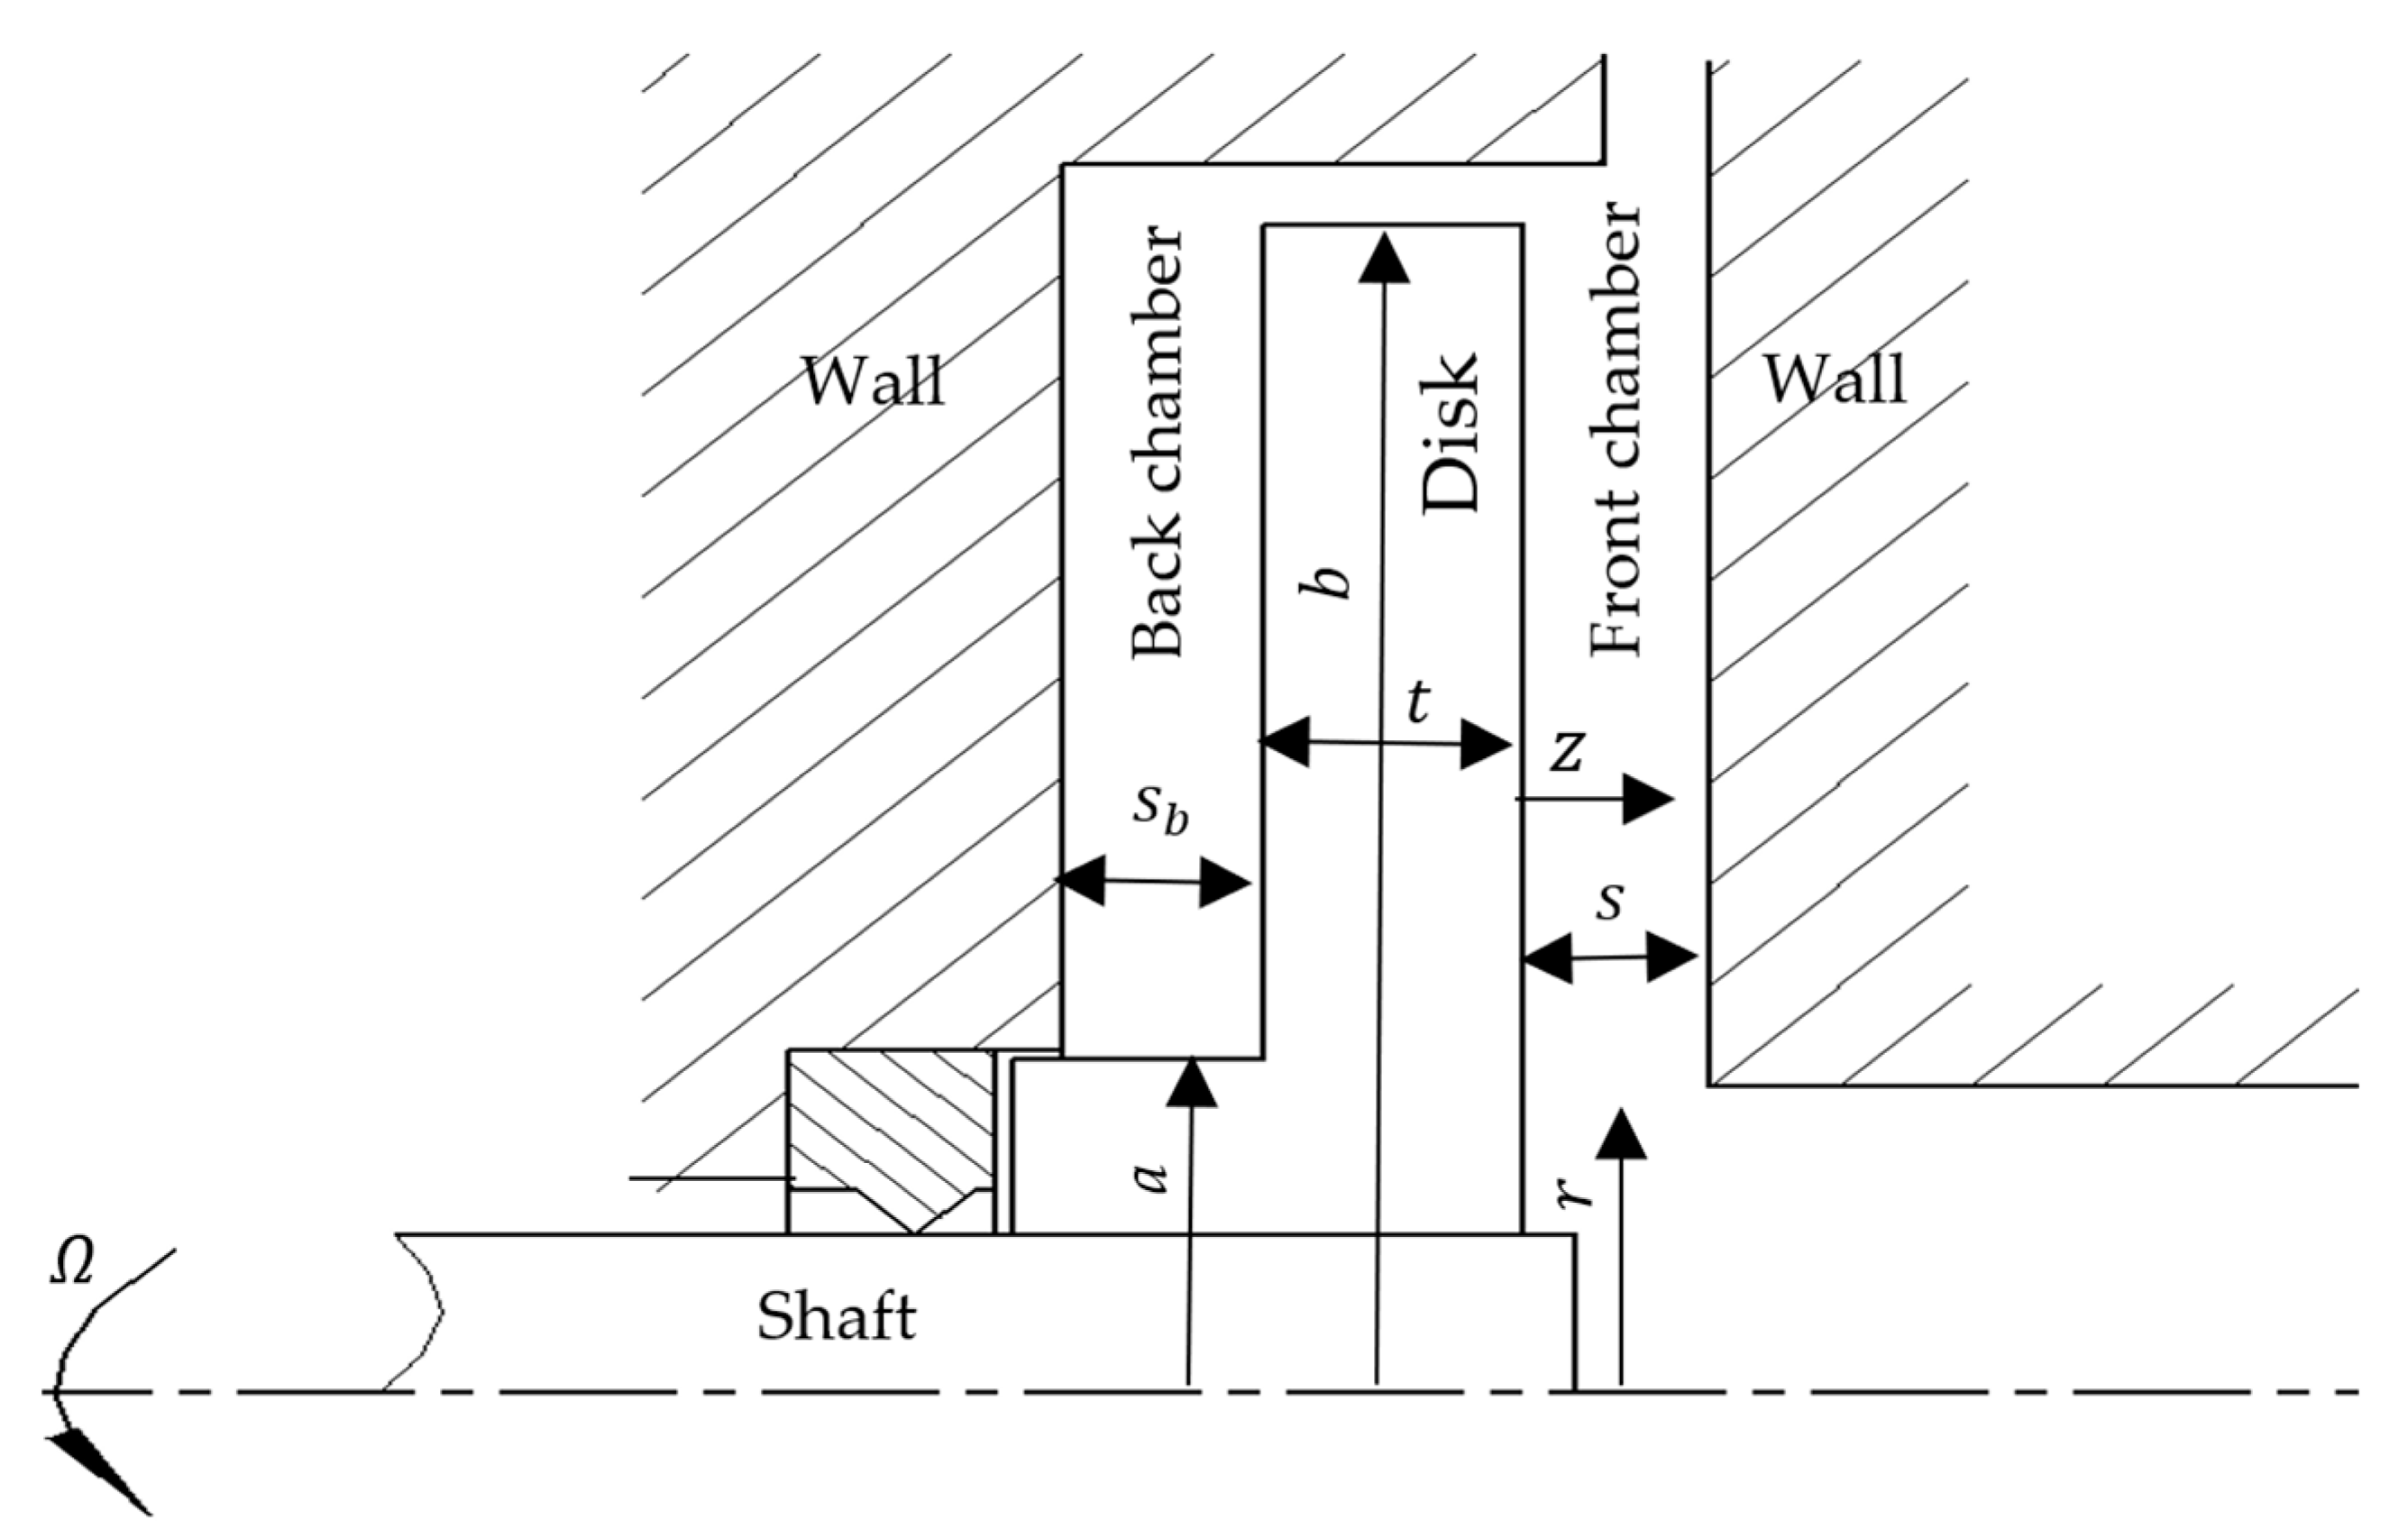
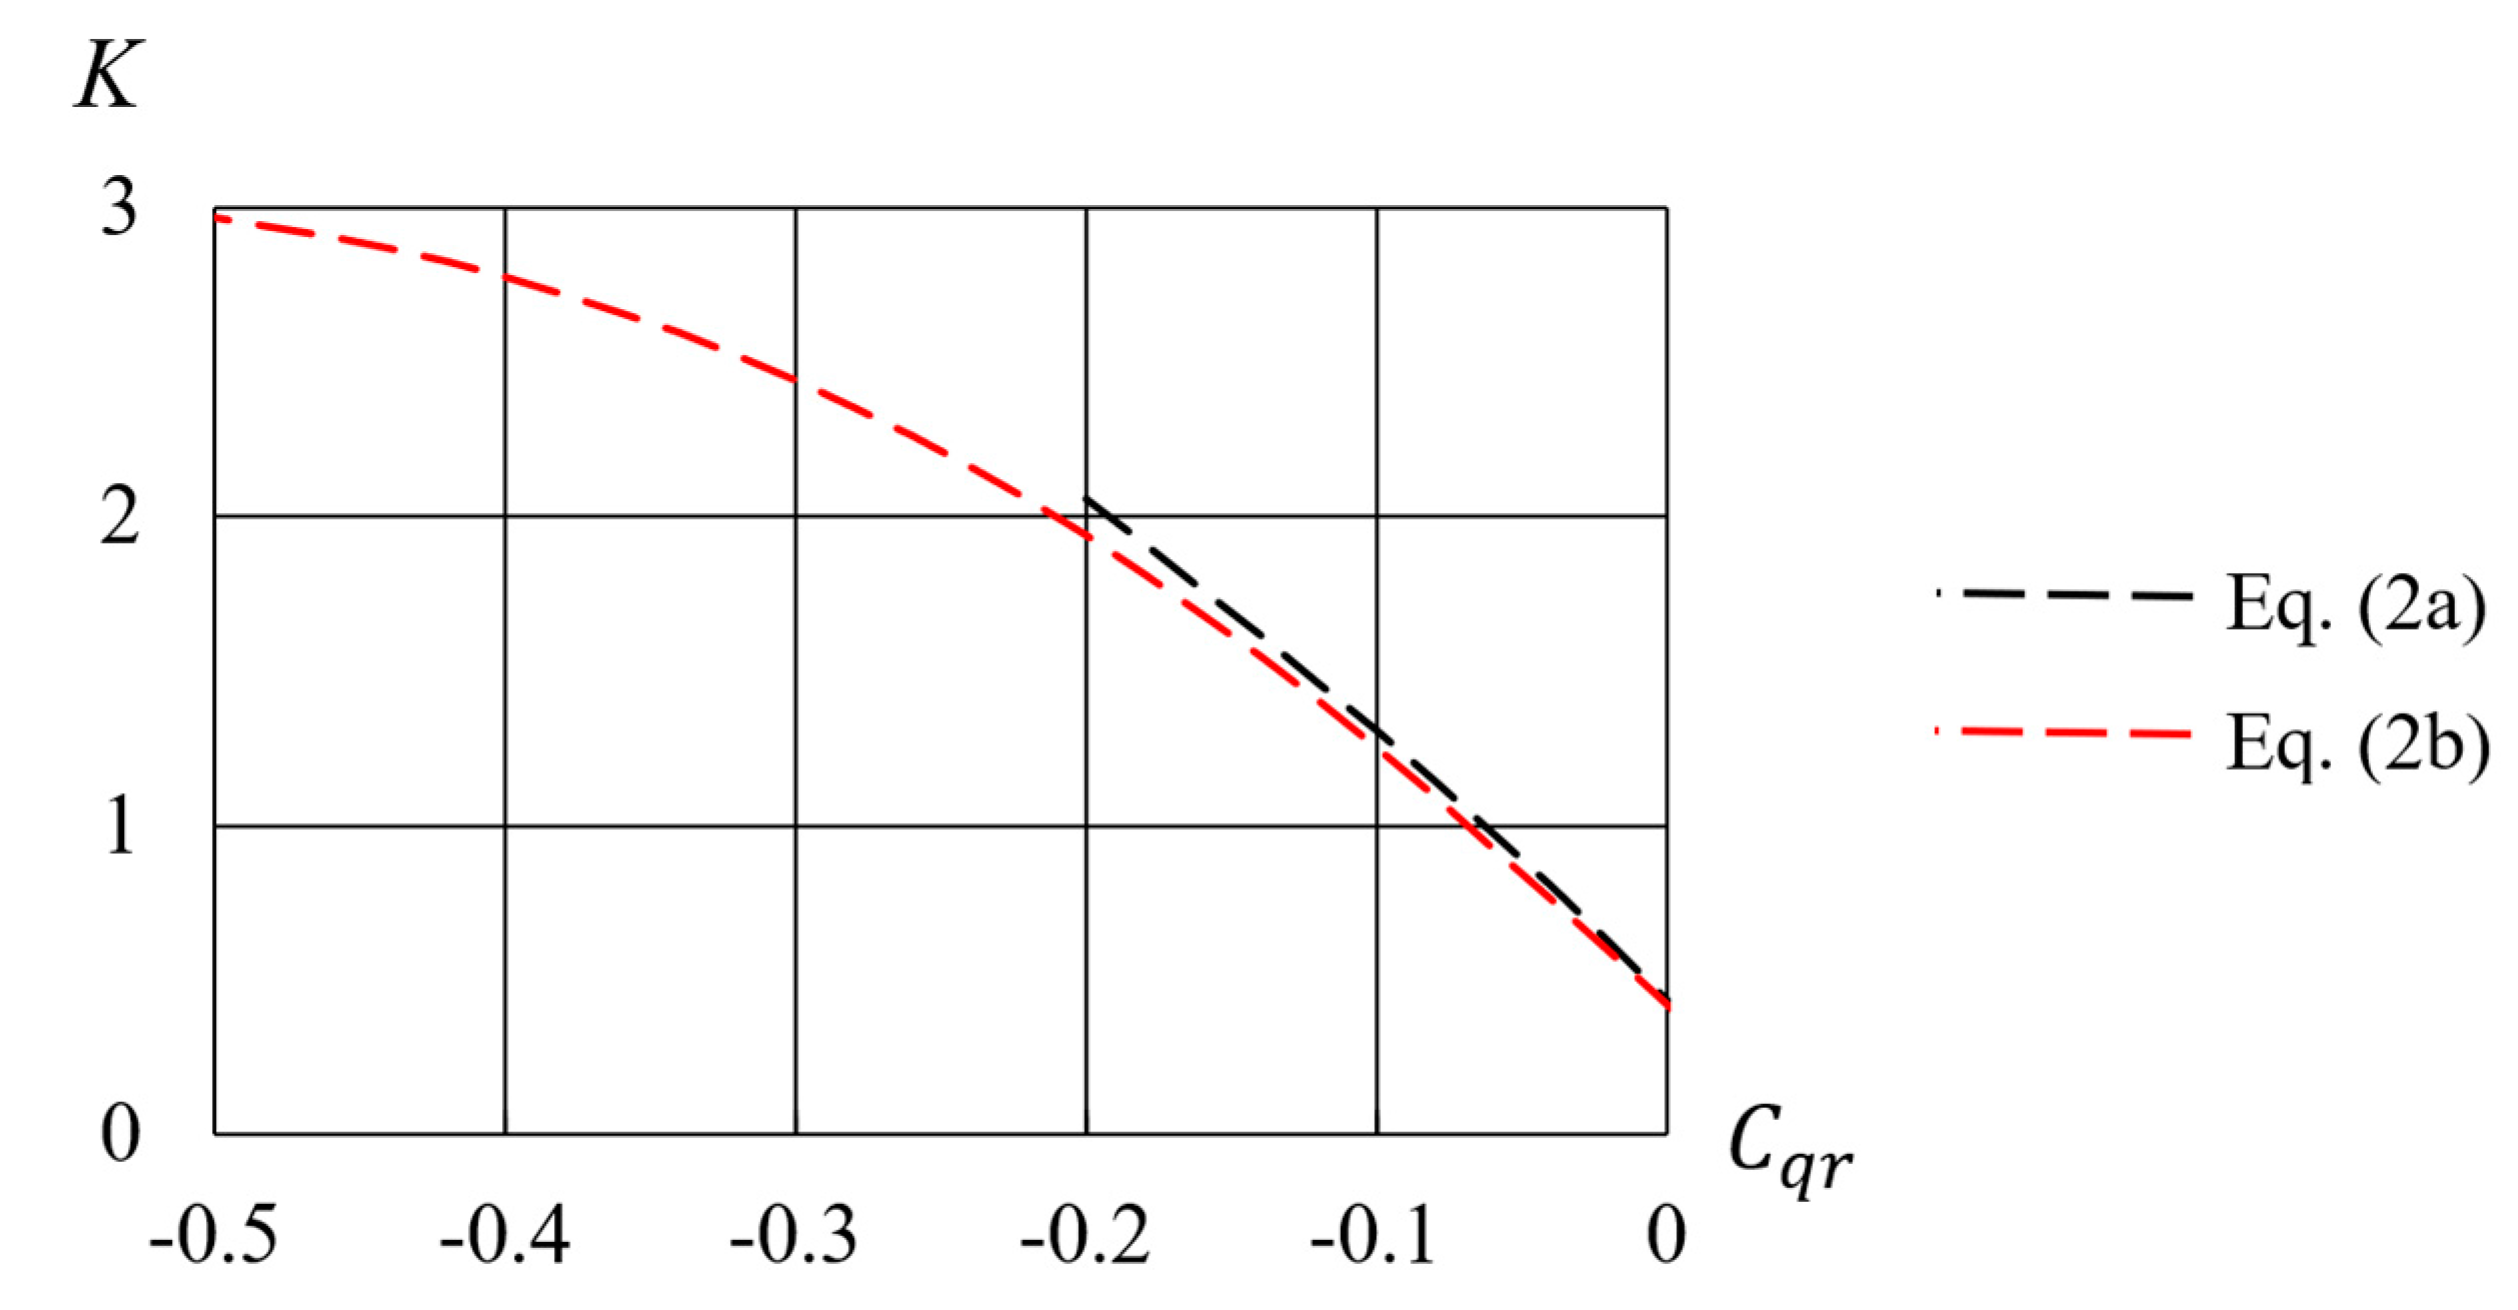
2. Theoretical Analysis
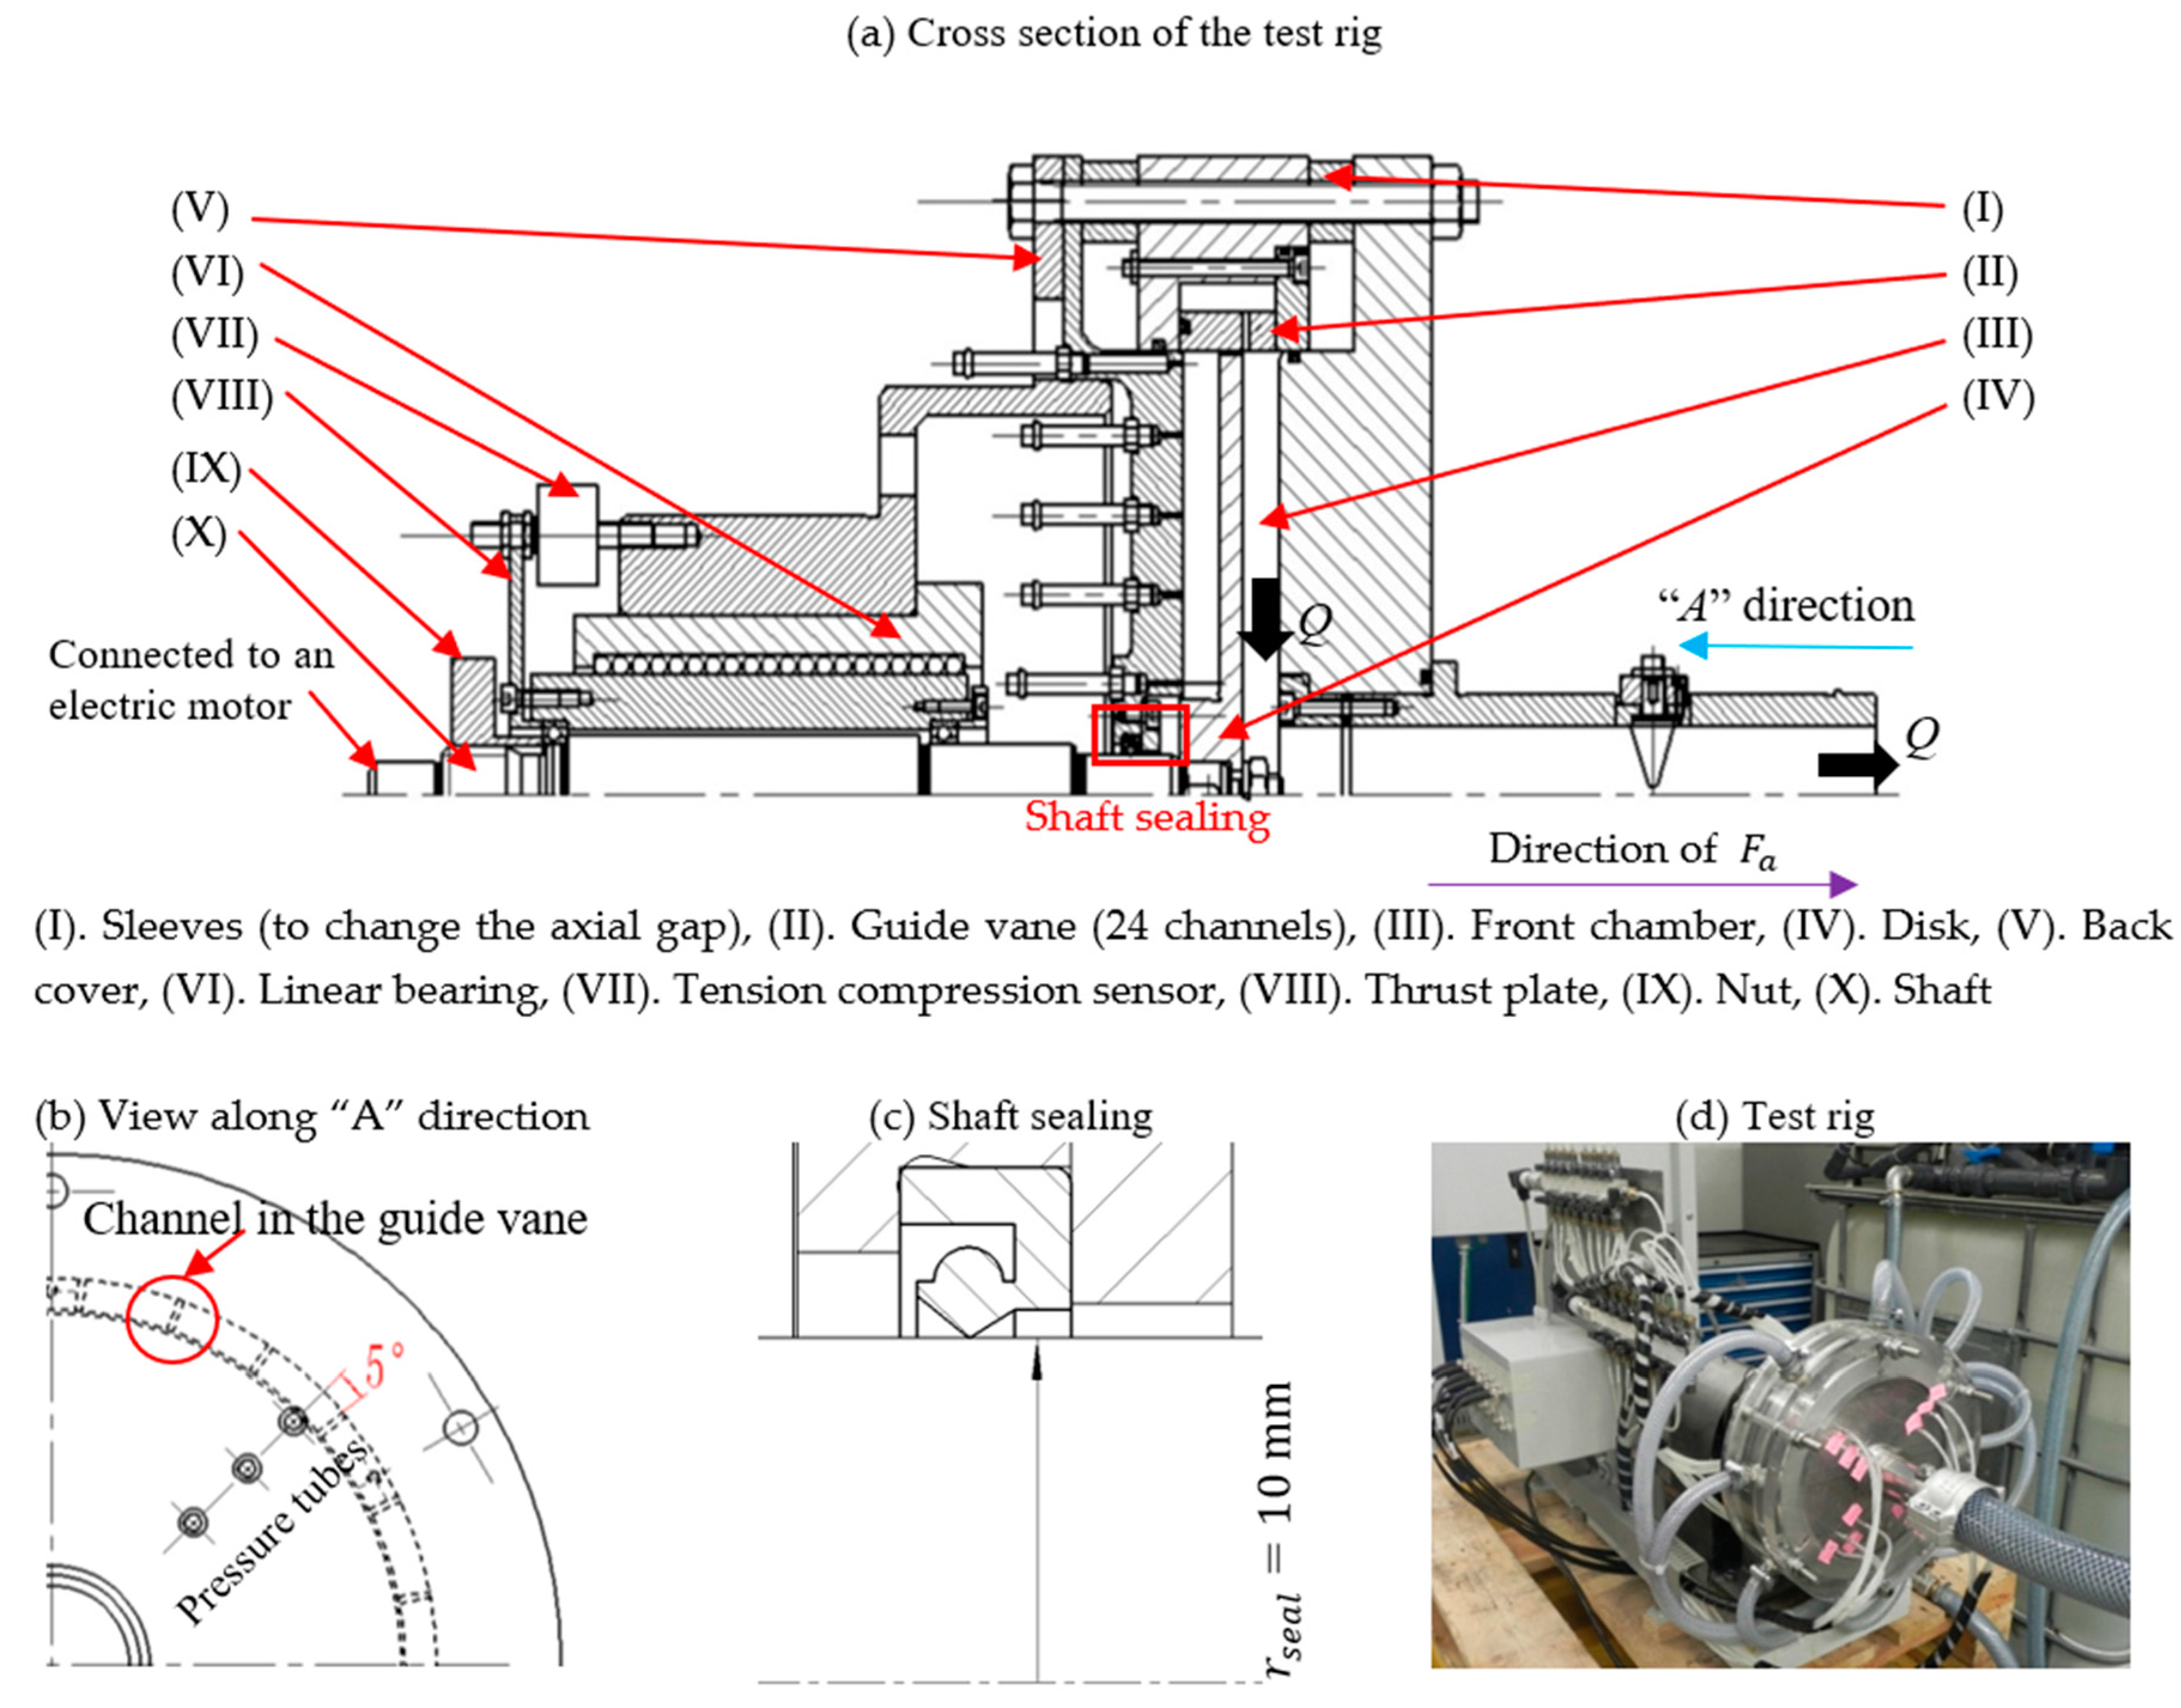
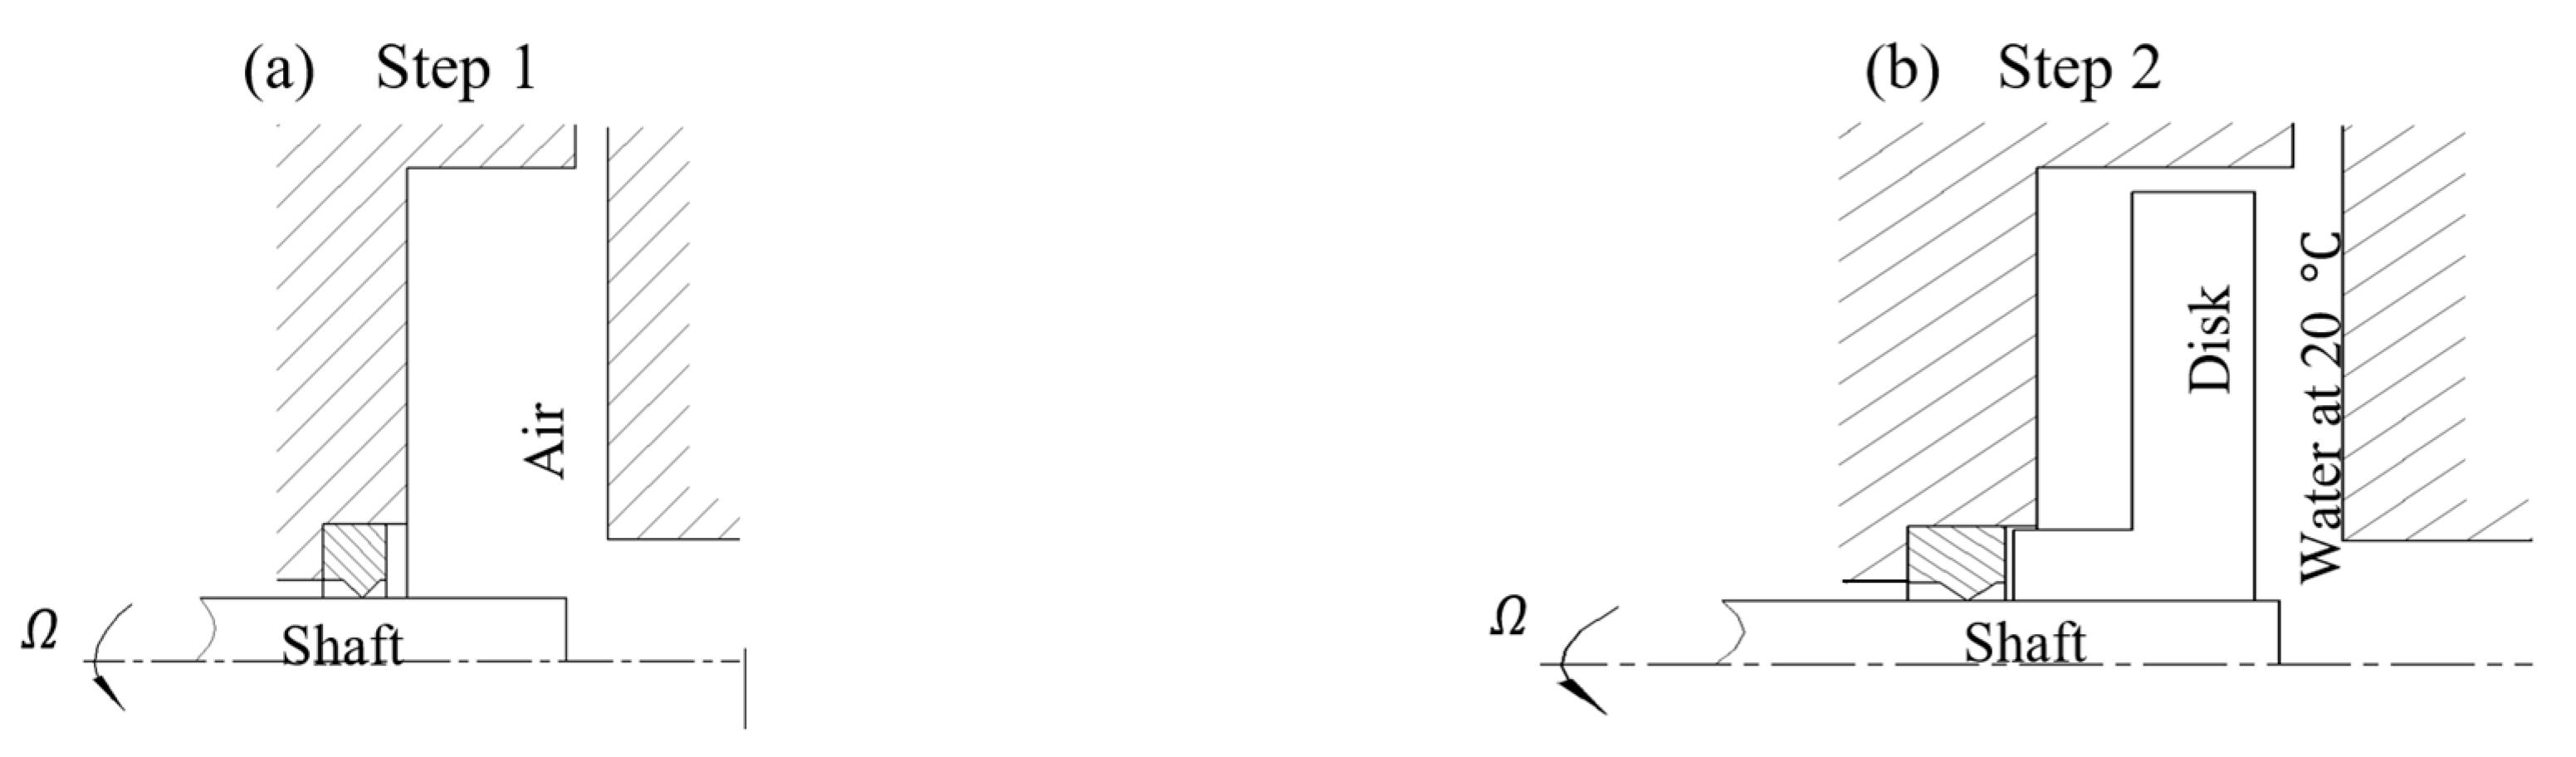
3. Test Rig Design and Experimental Set-Up
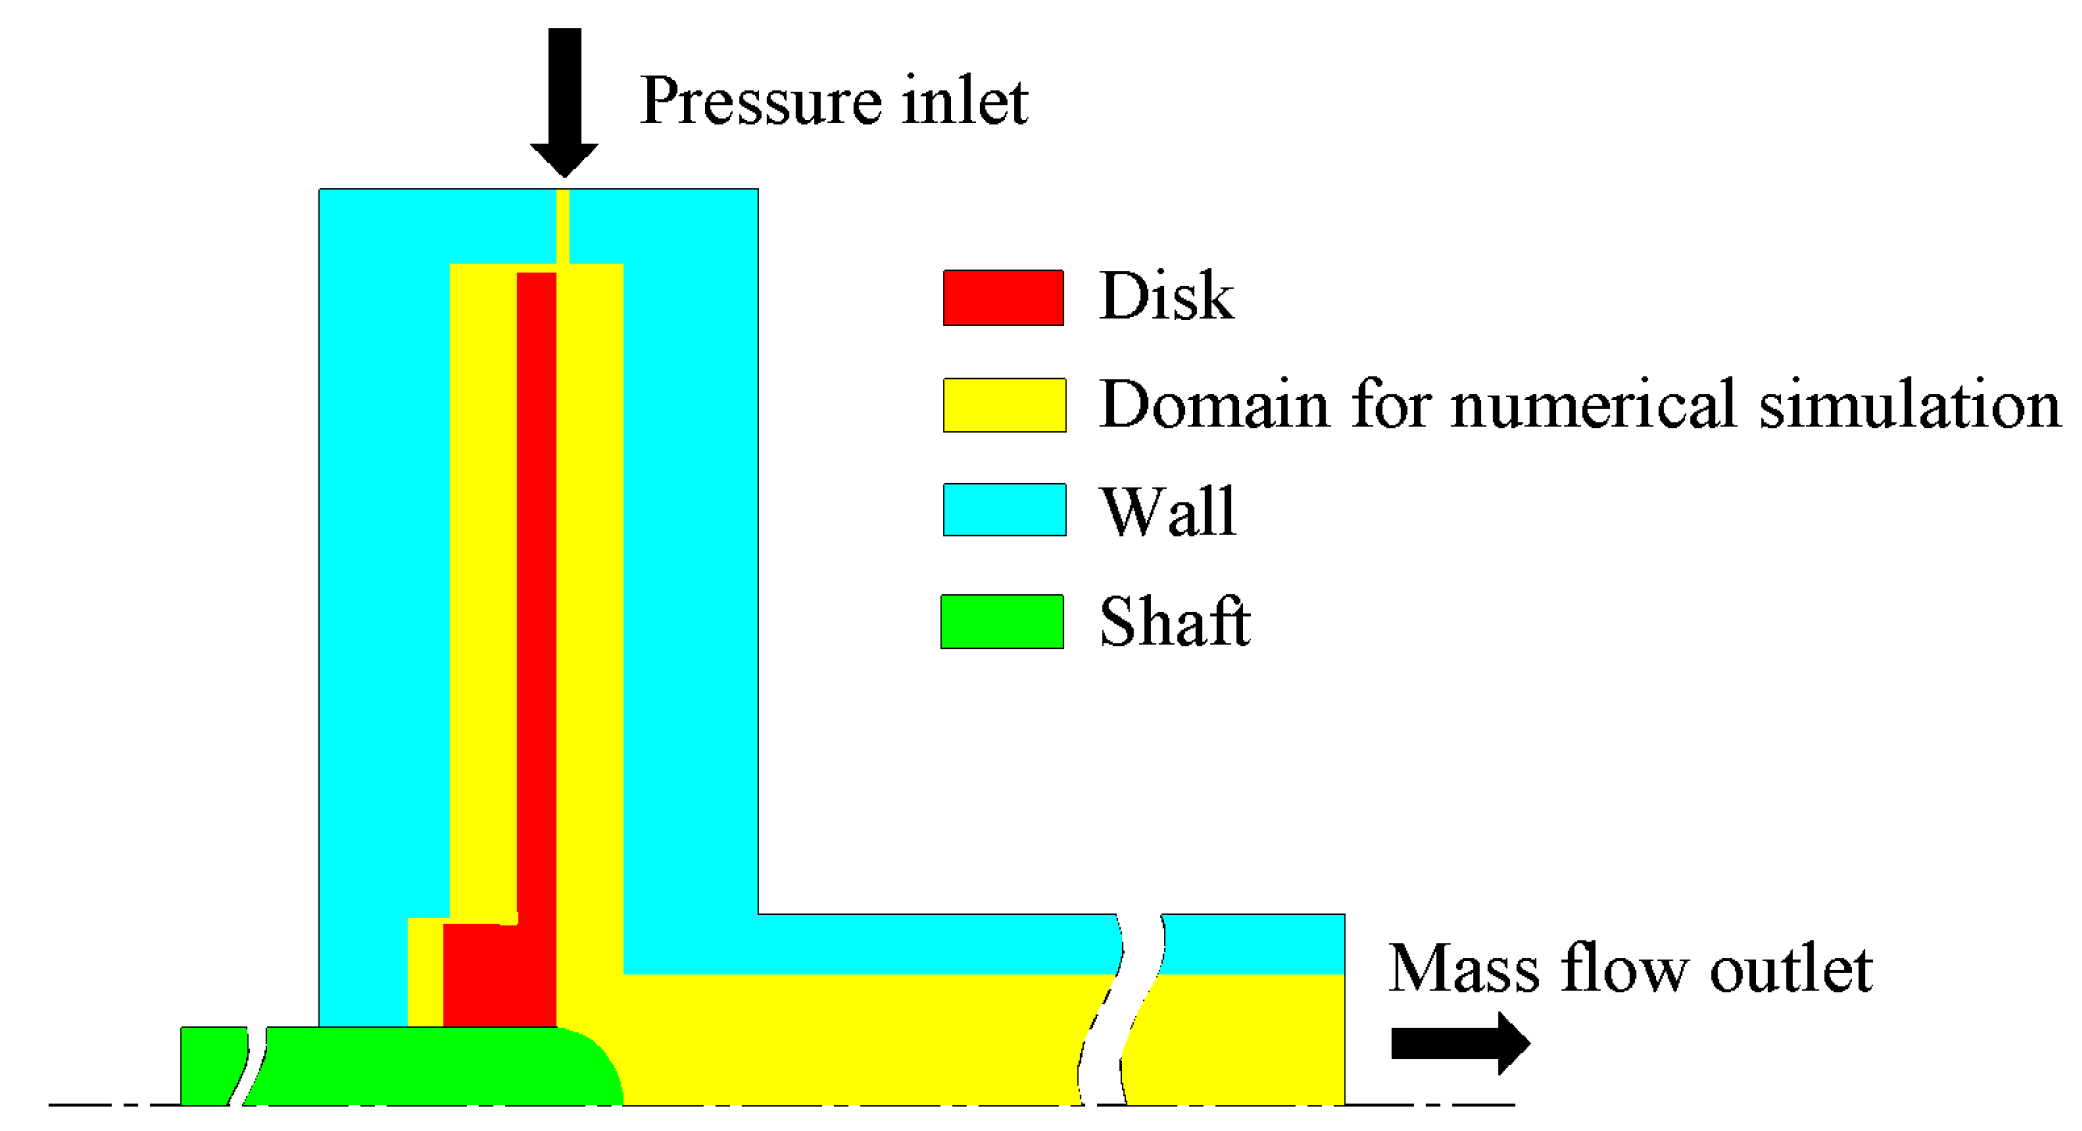
4. Numerical Simulation
5. Results and Discussion
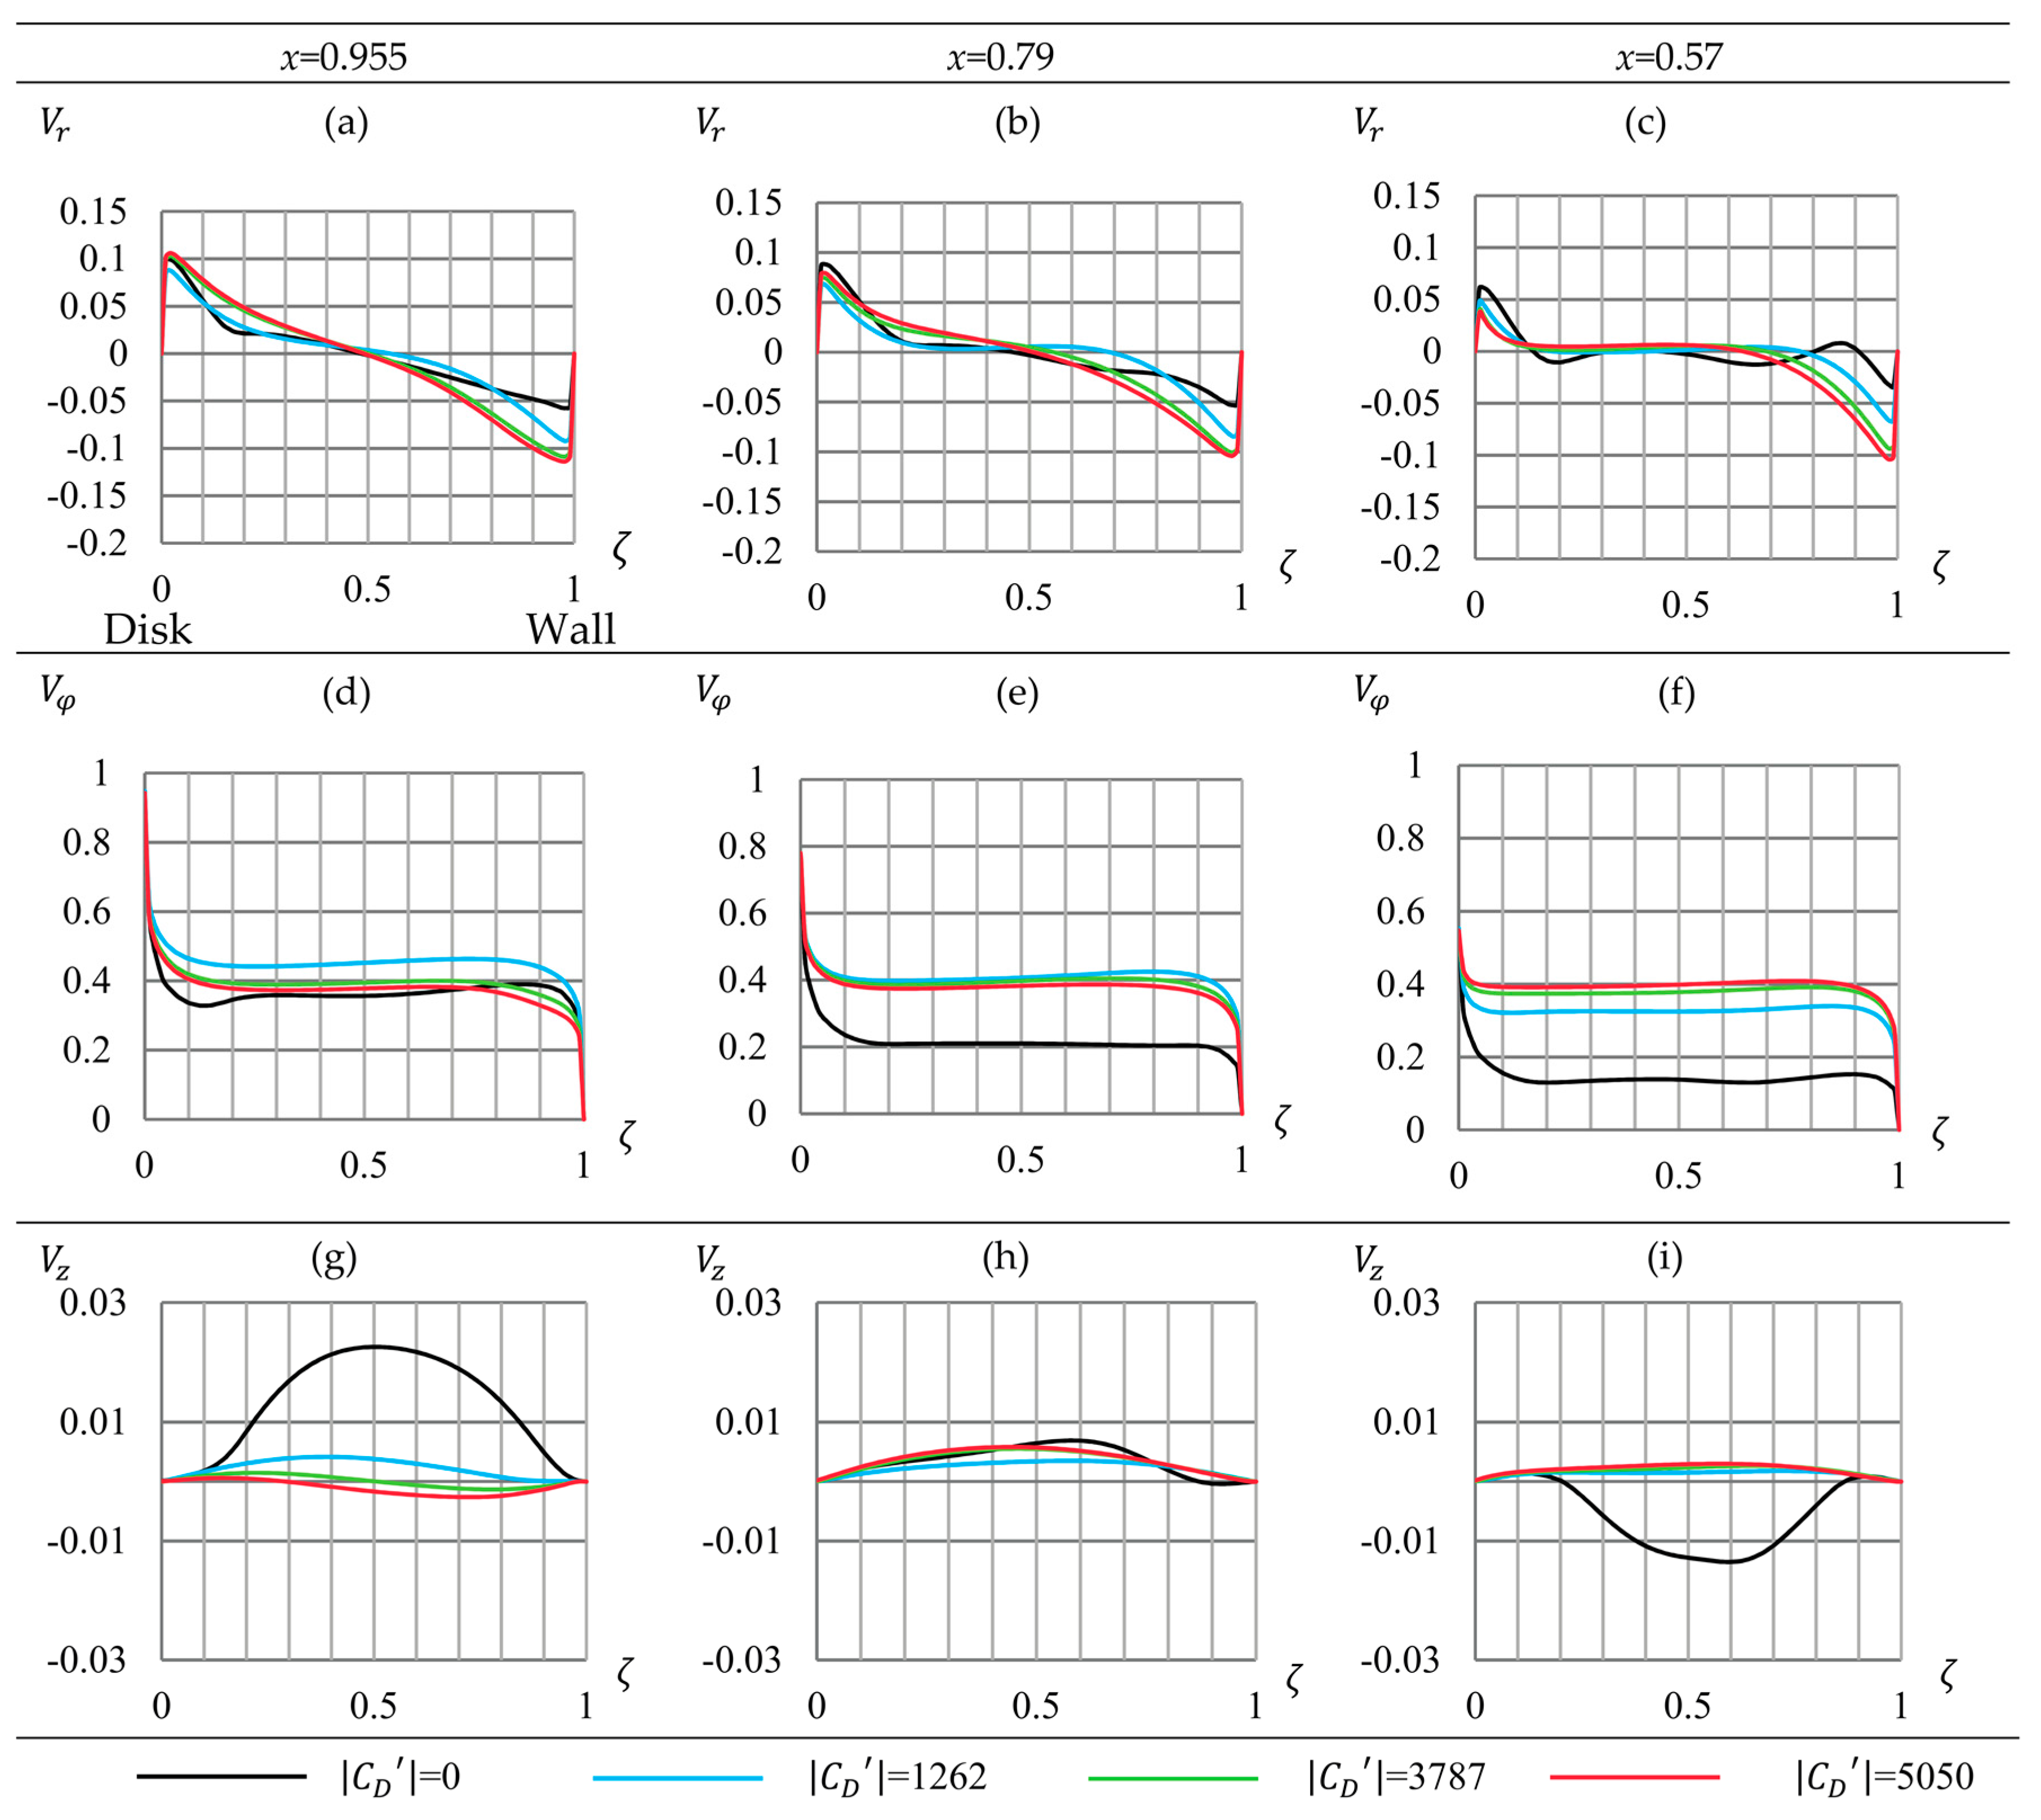
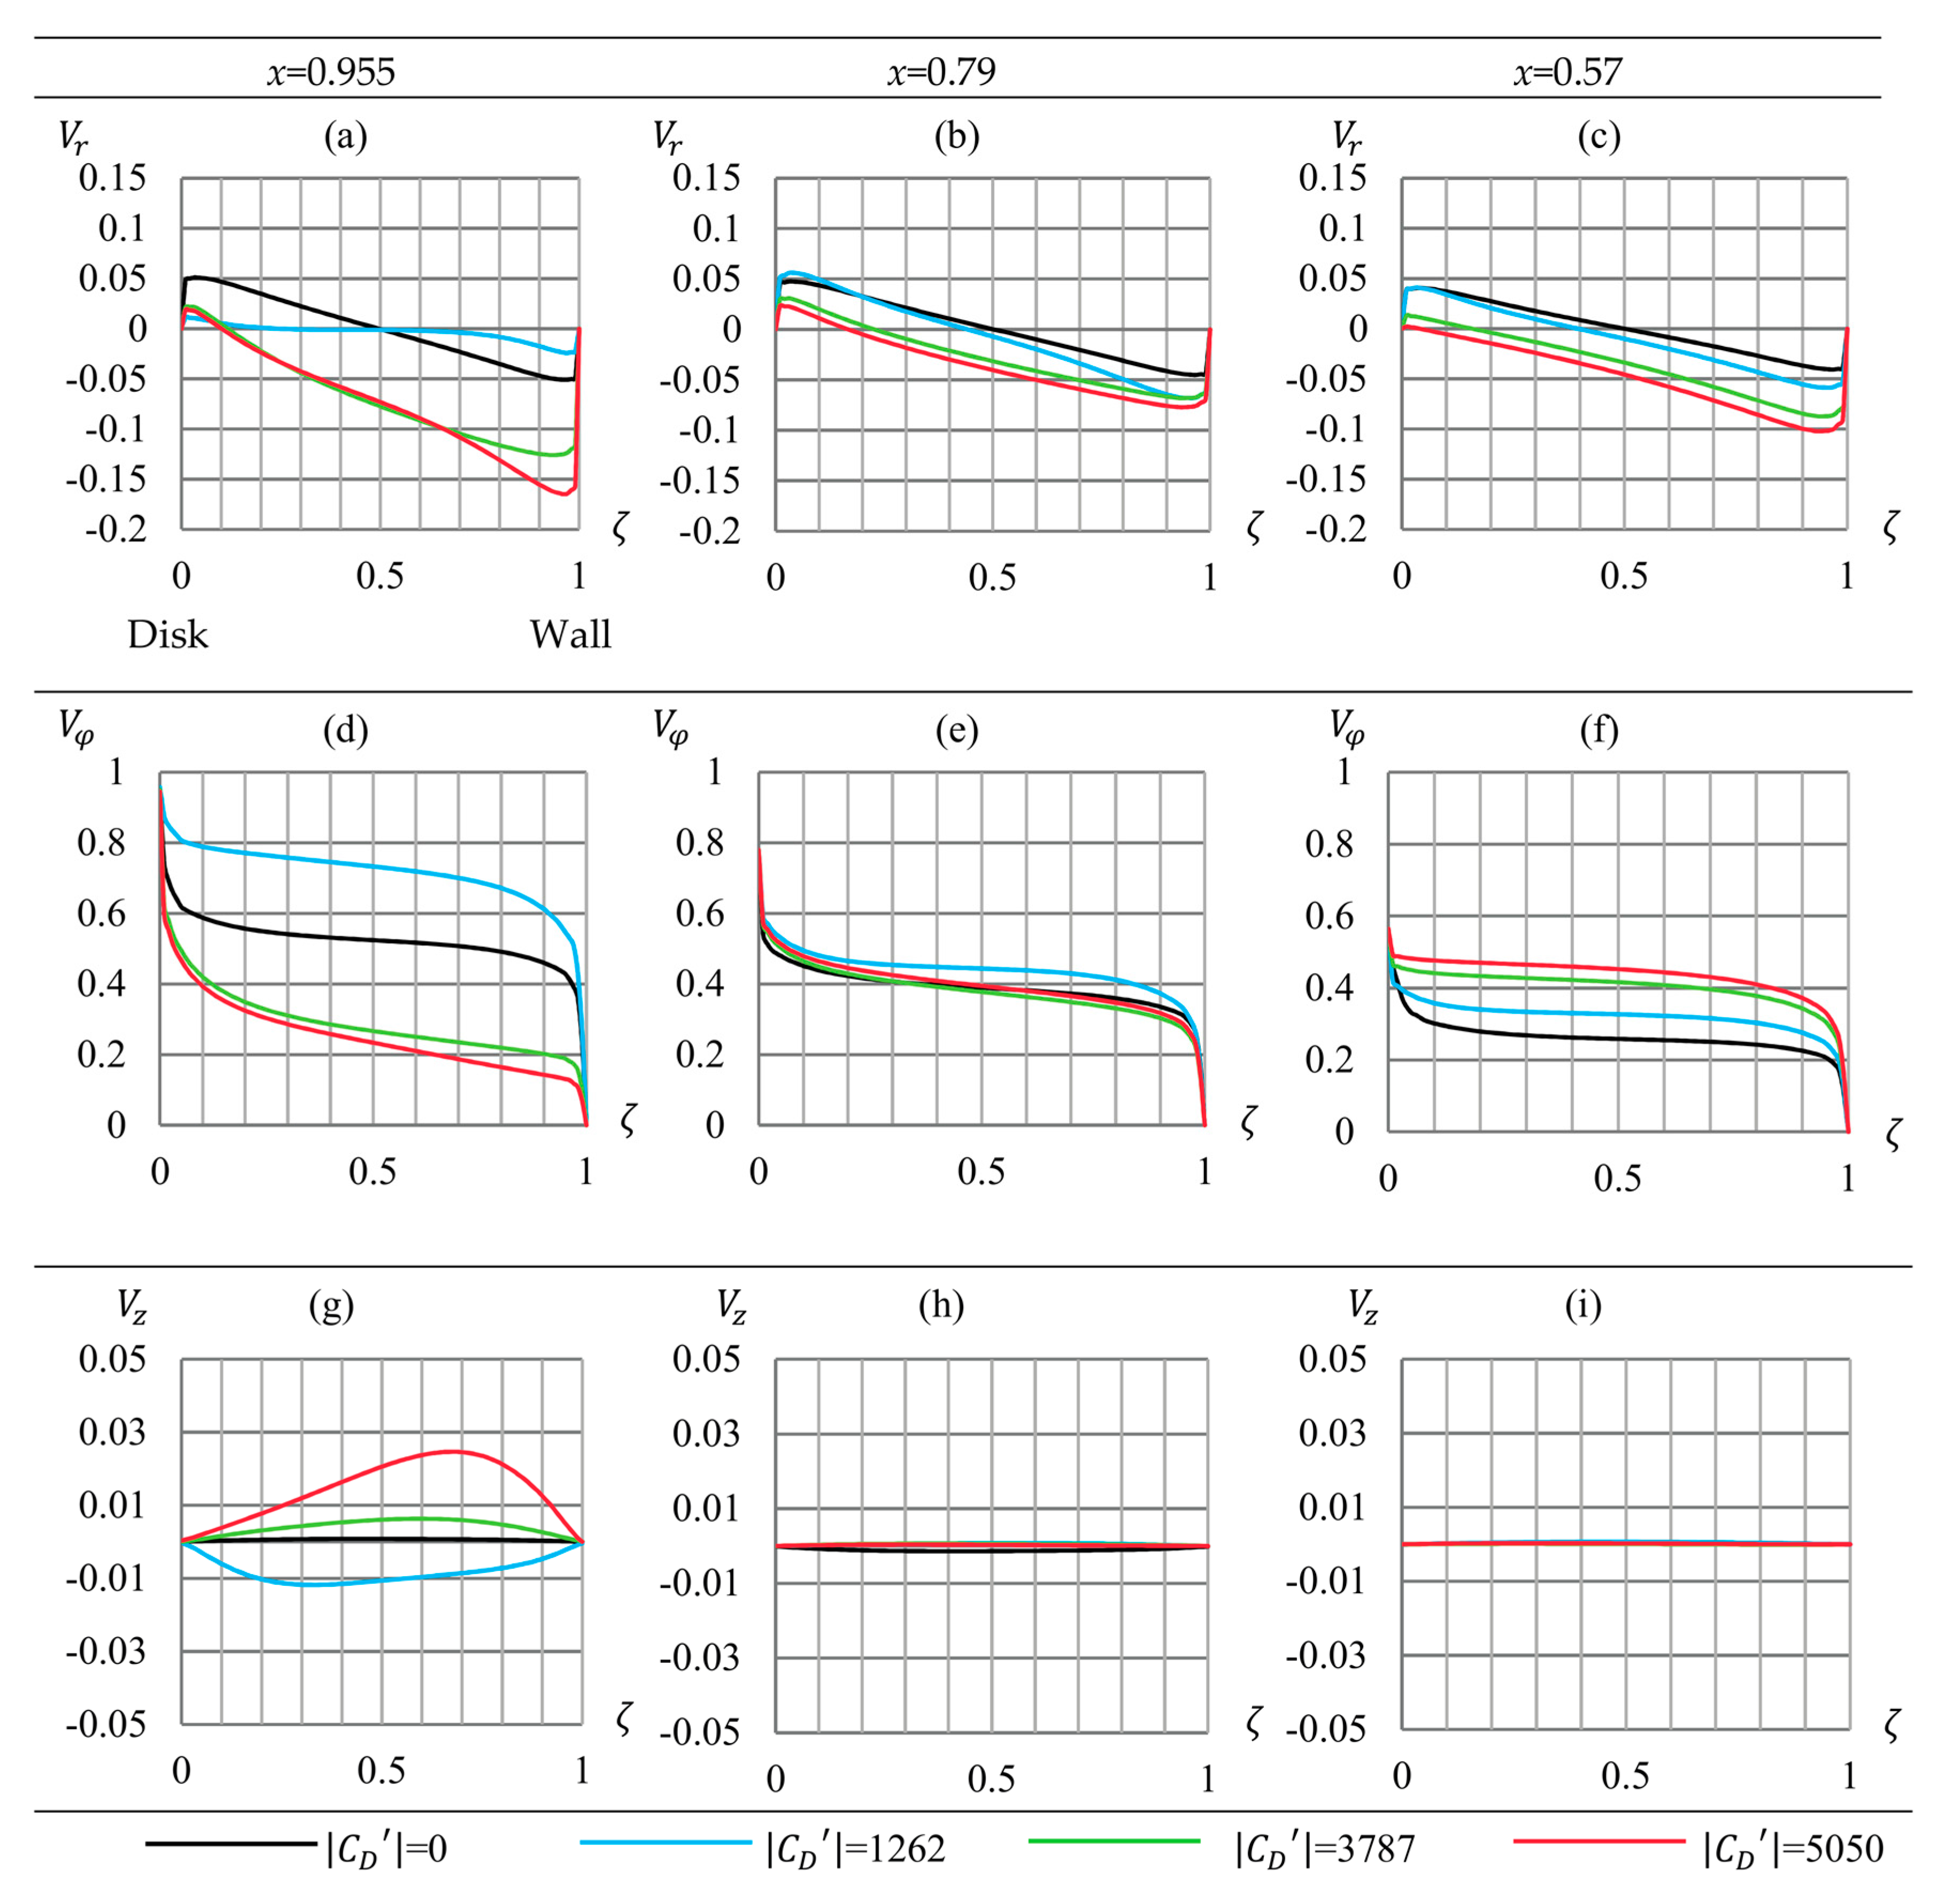
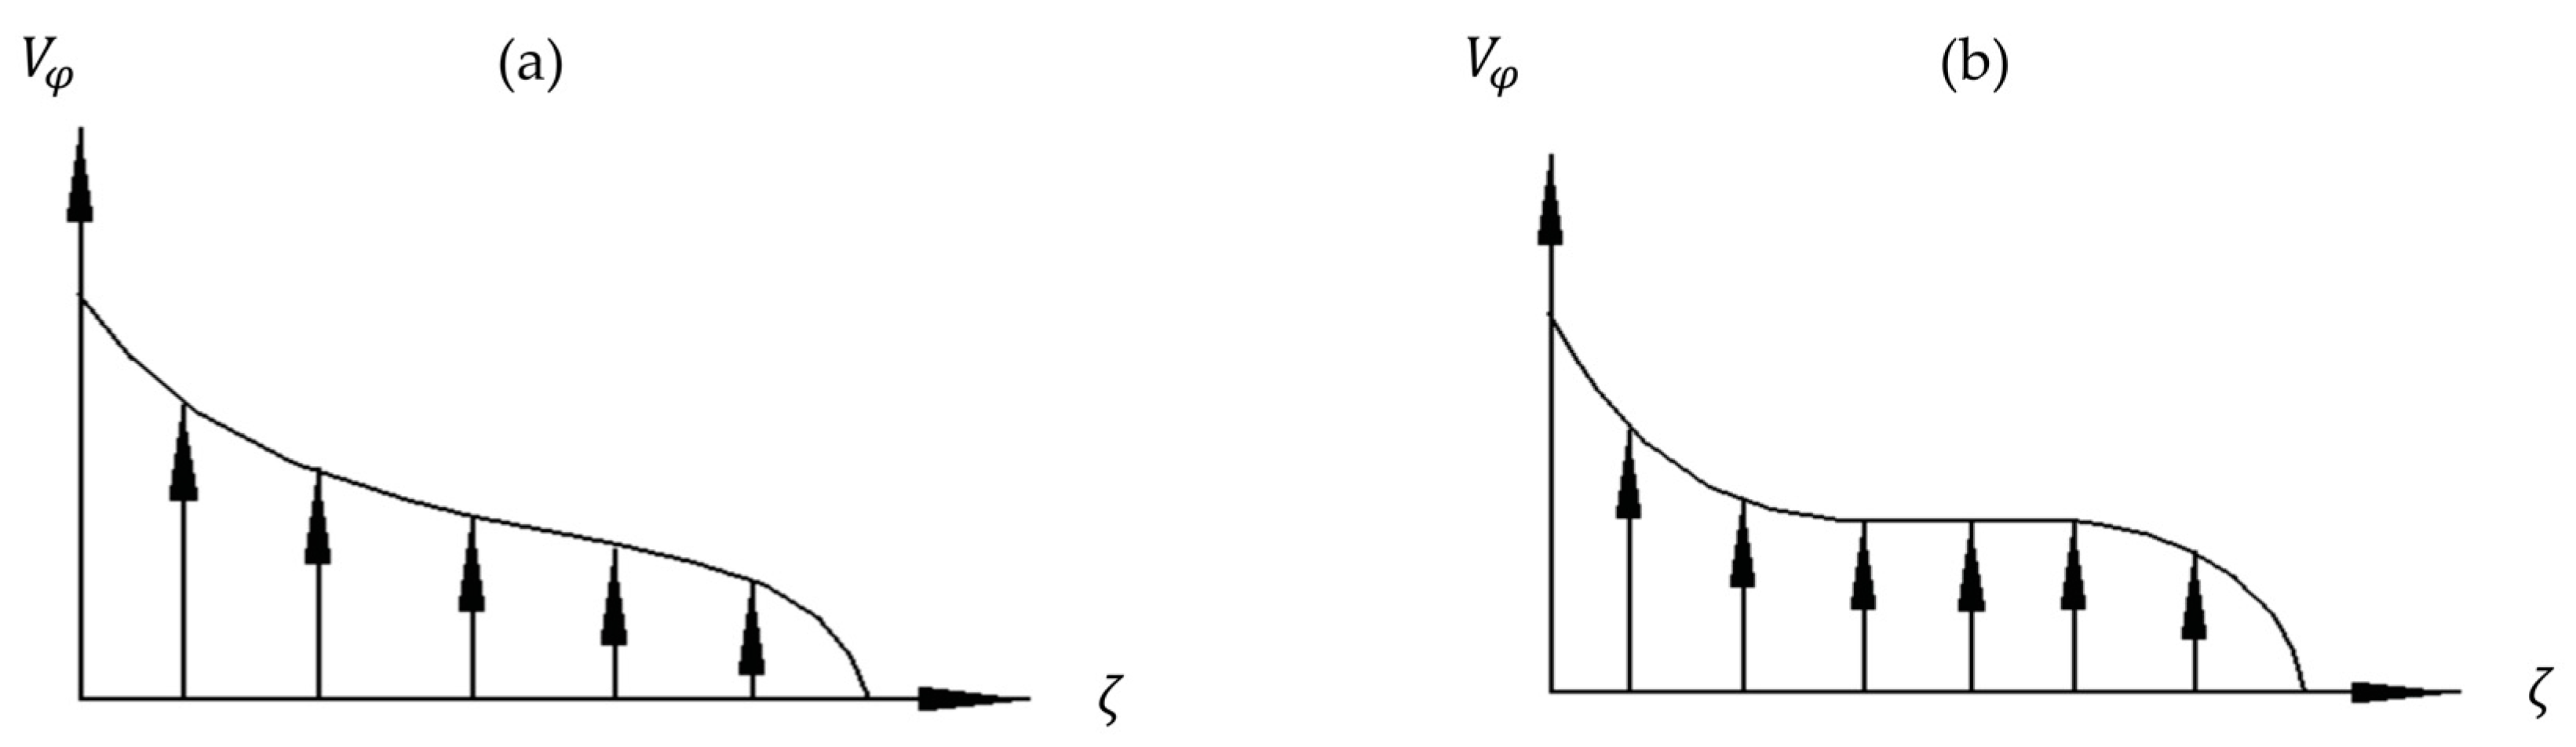
5.1. Simulation Results of Velocity Distributions
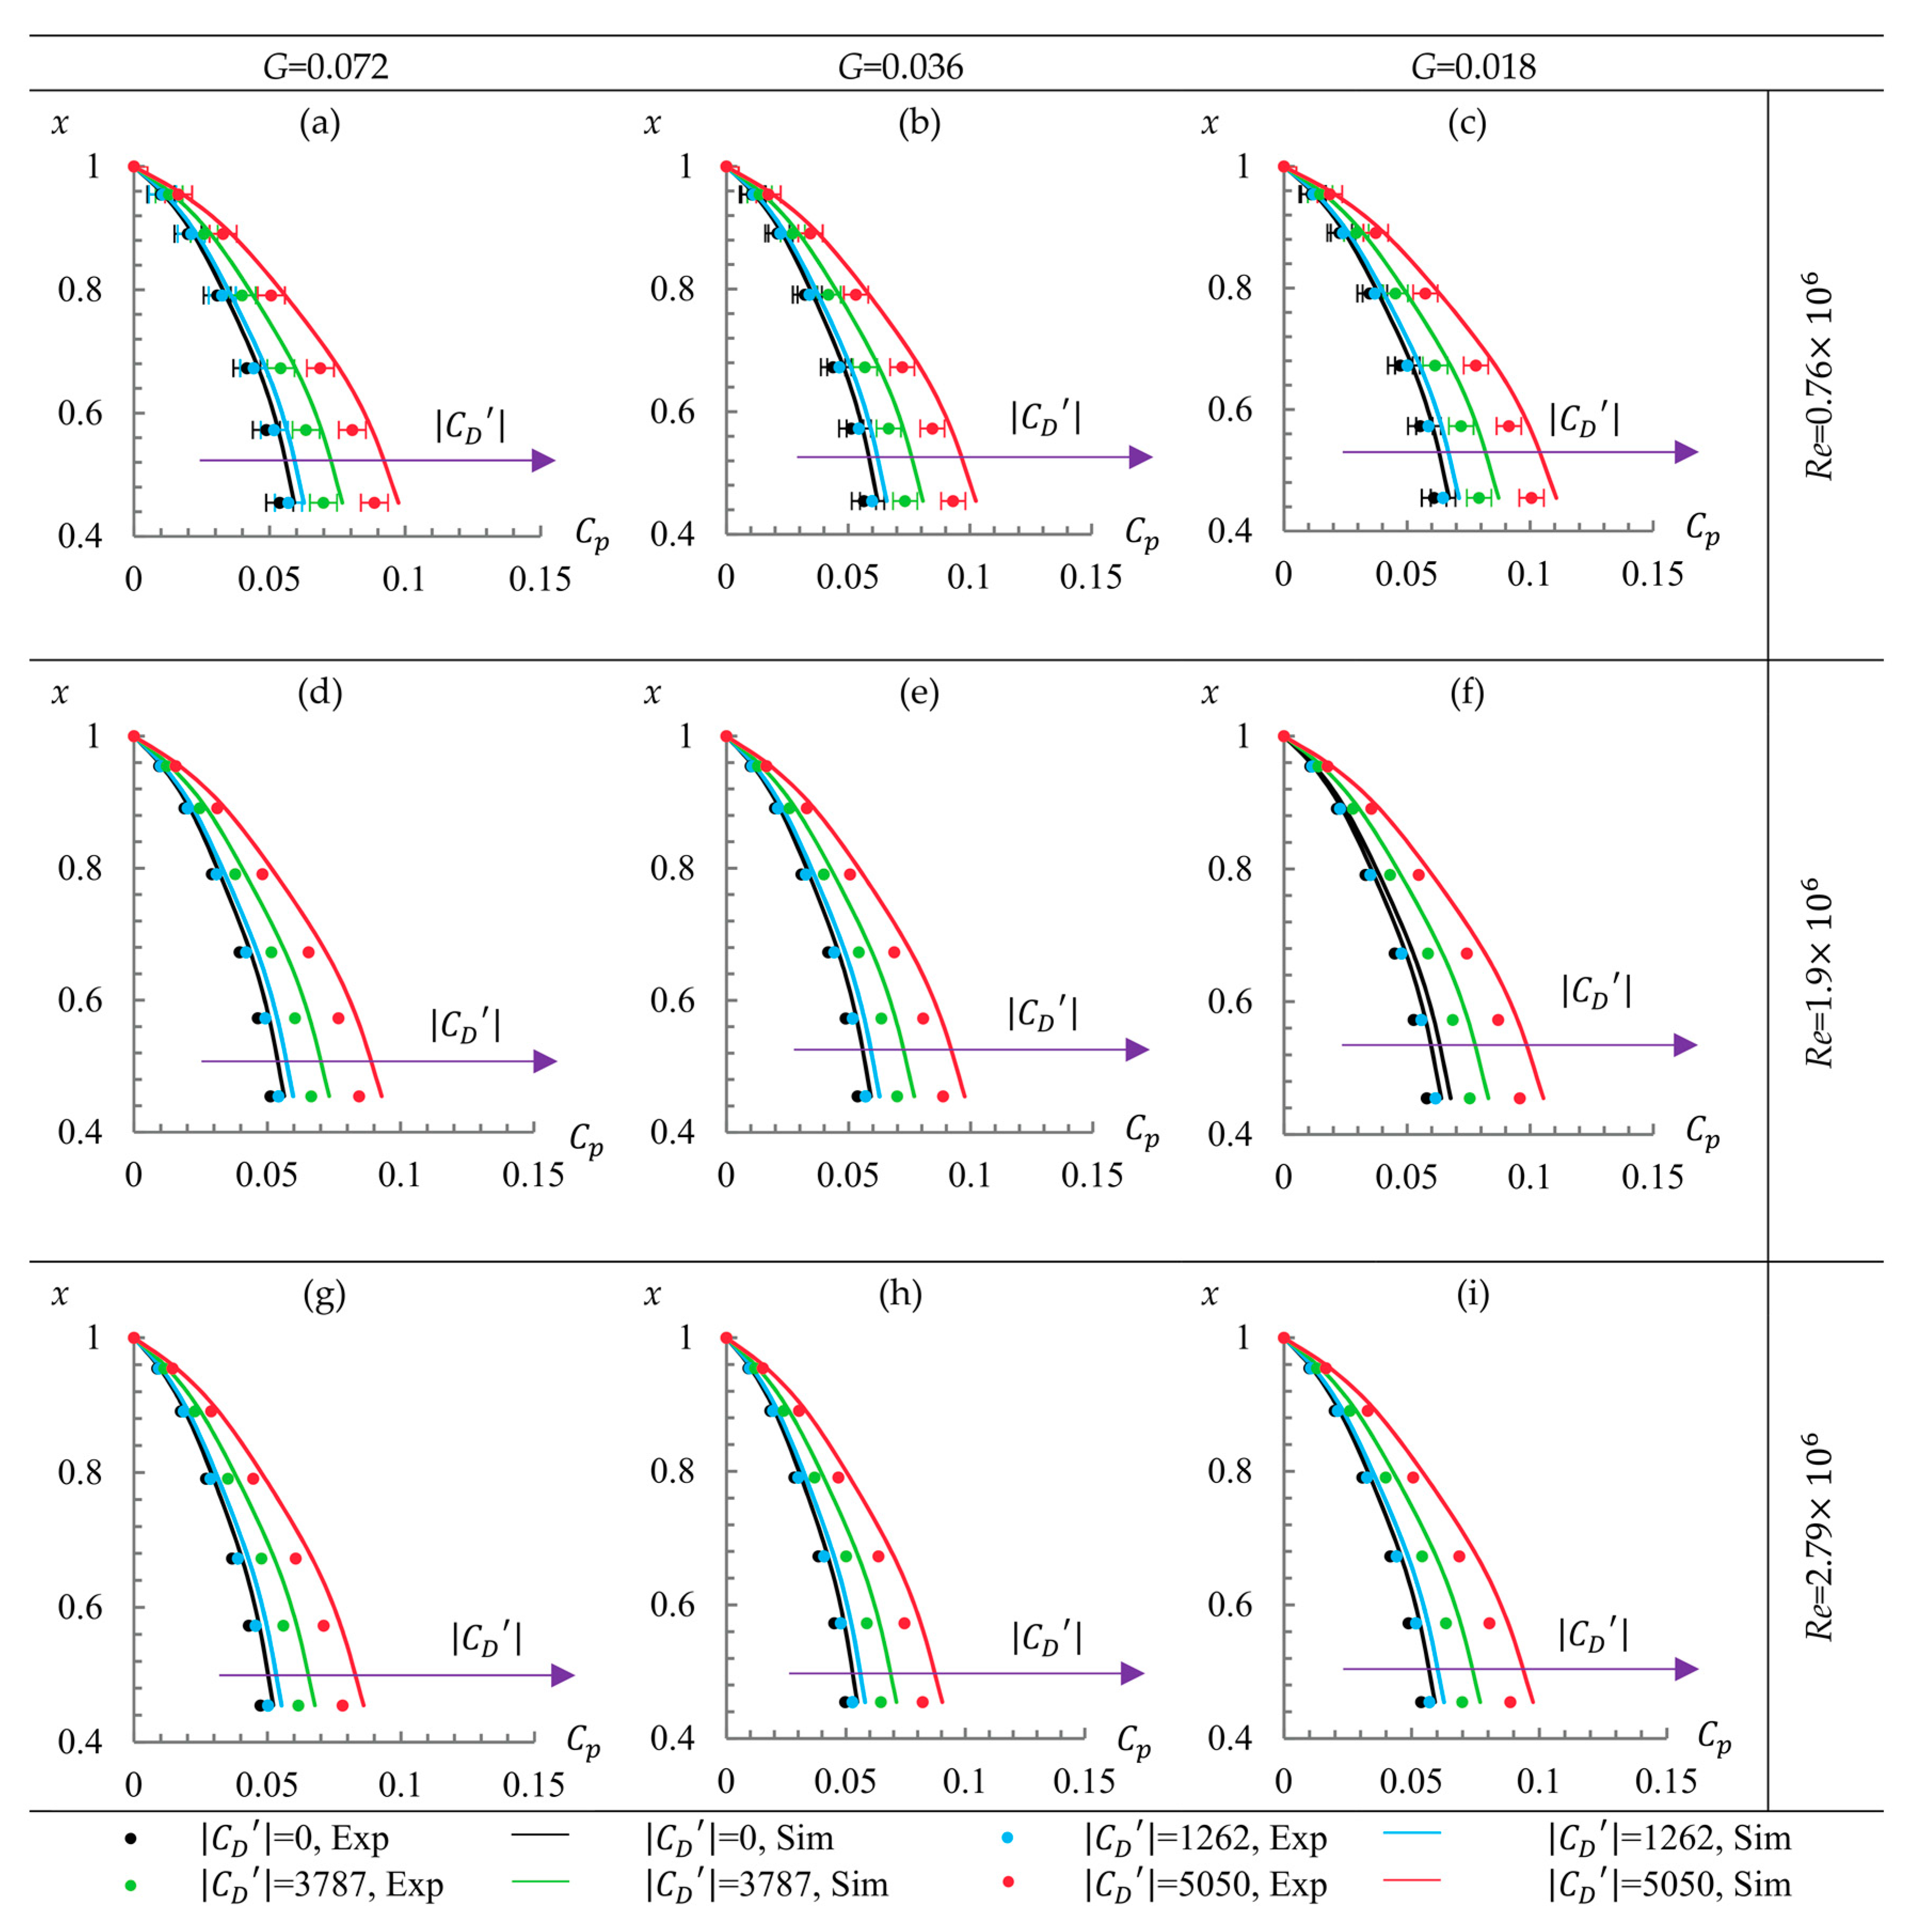
5.2. Pressure Distributions
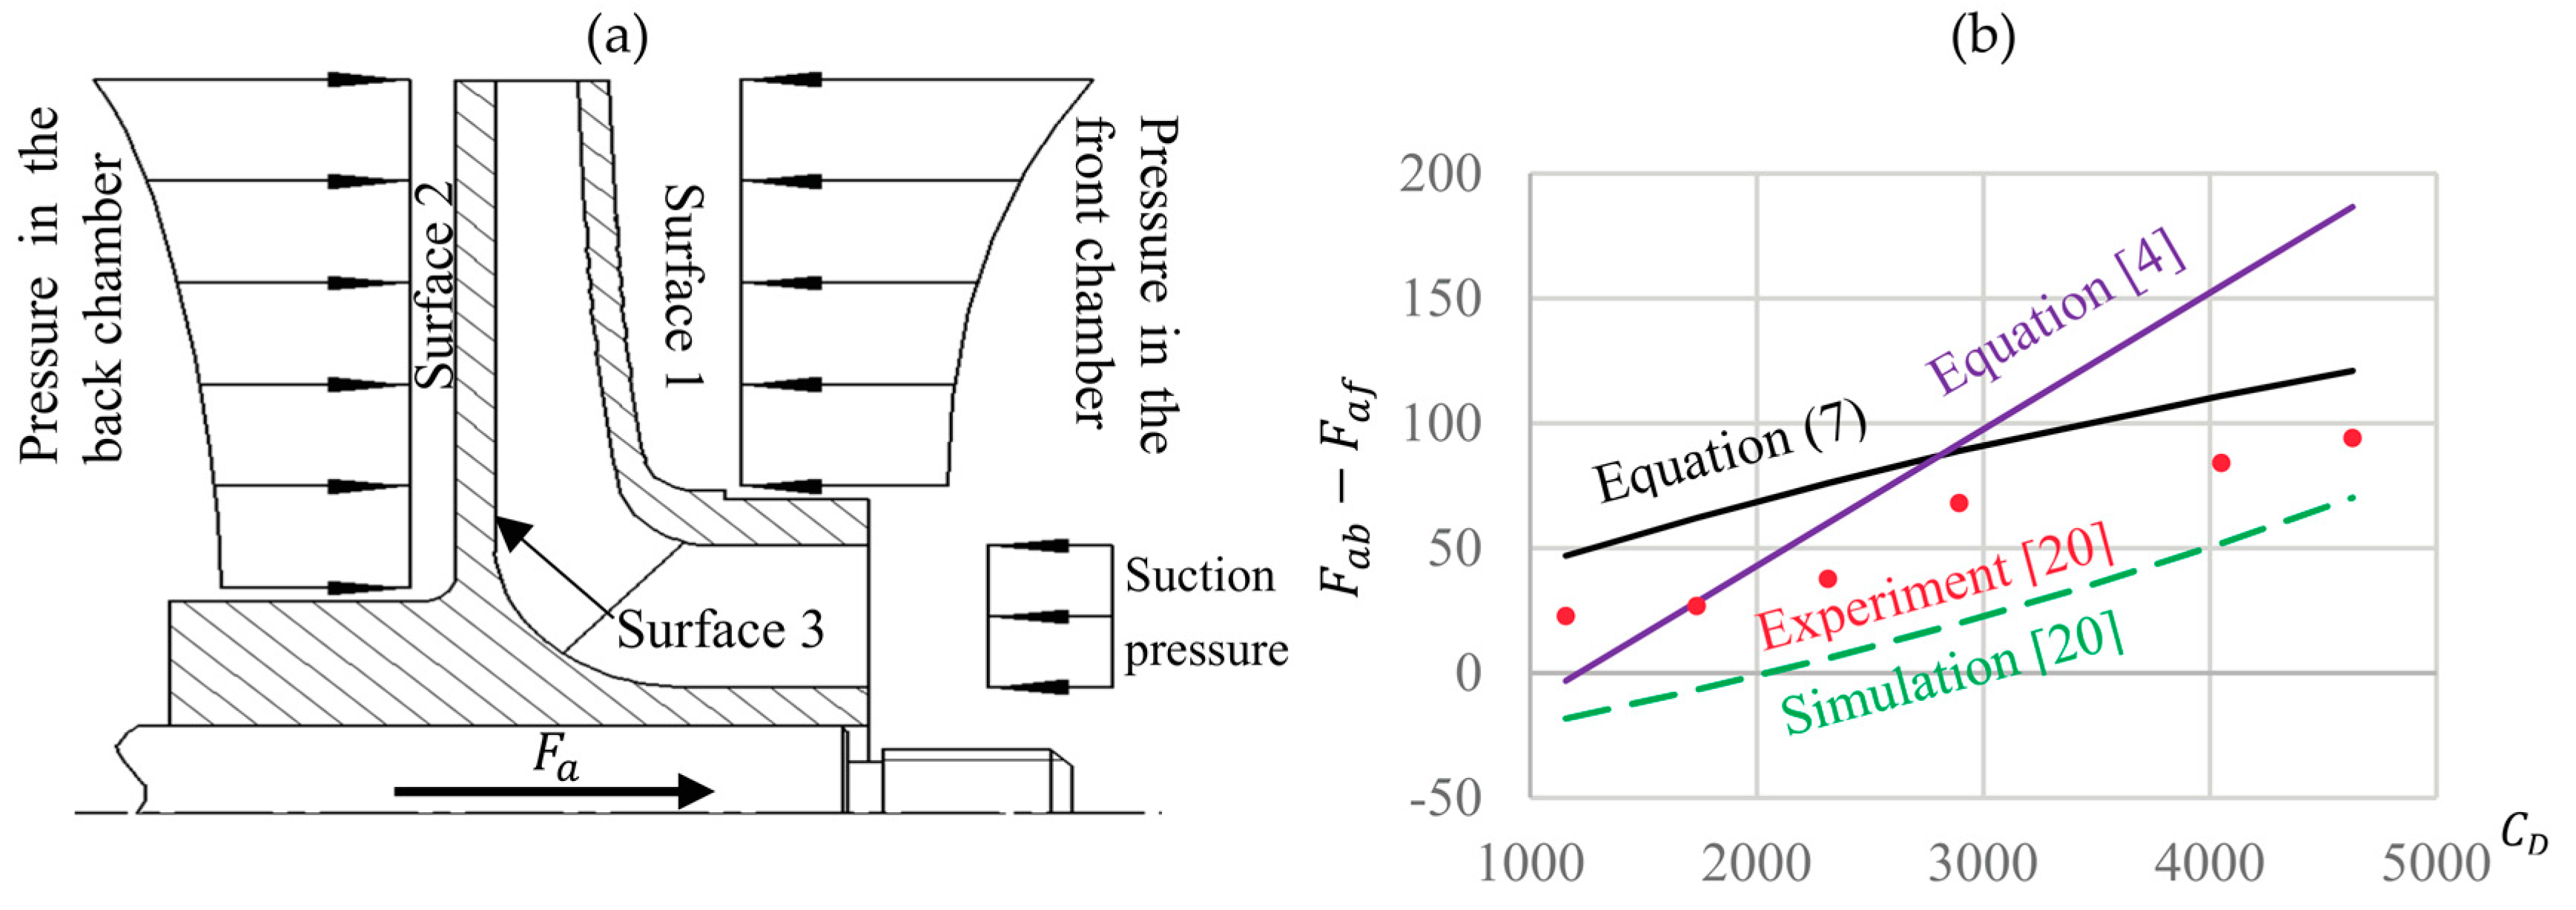
5.3. Axial Thrust Coefficient
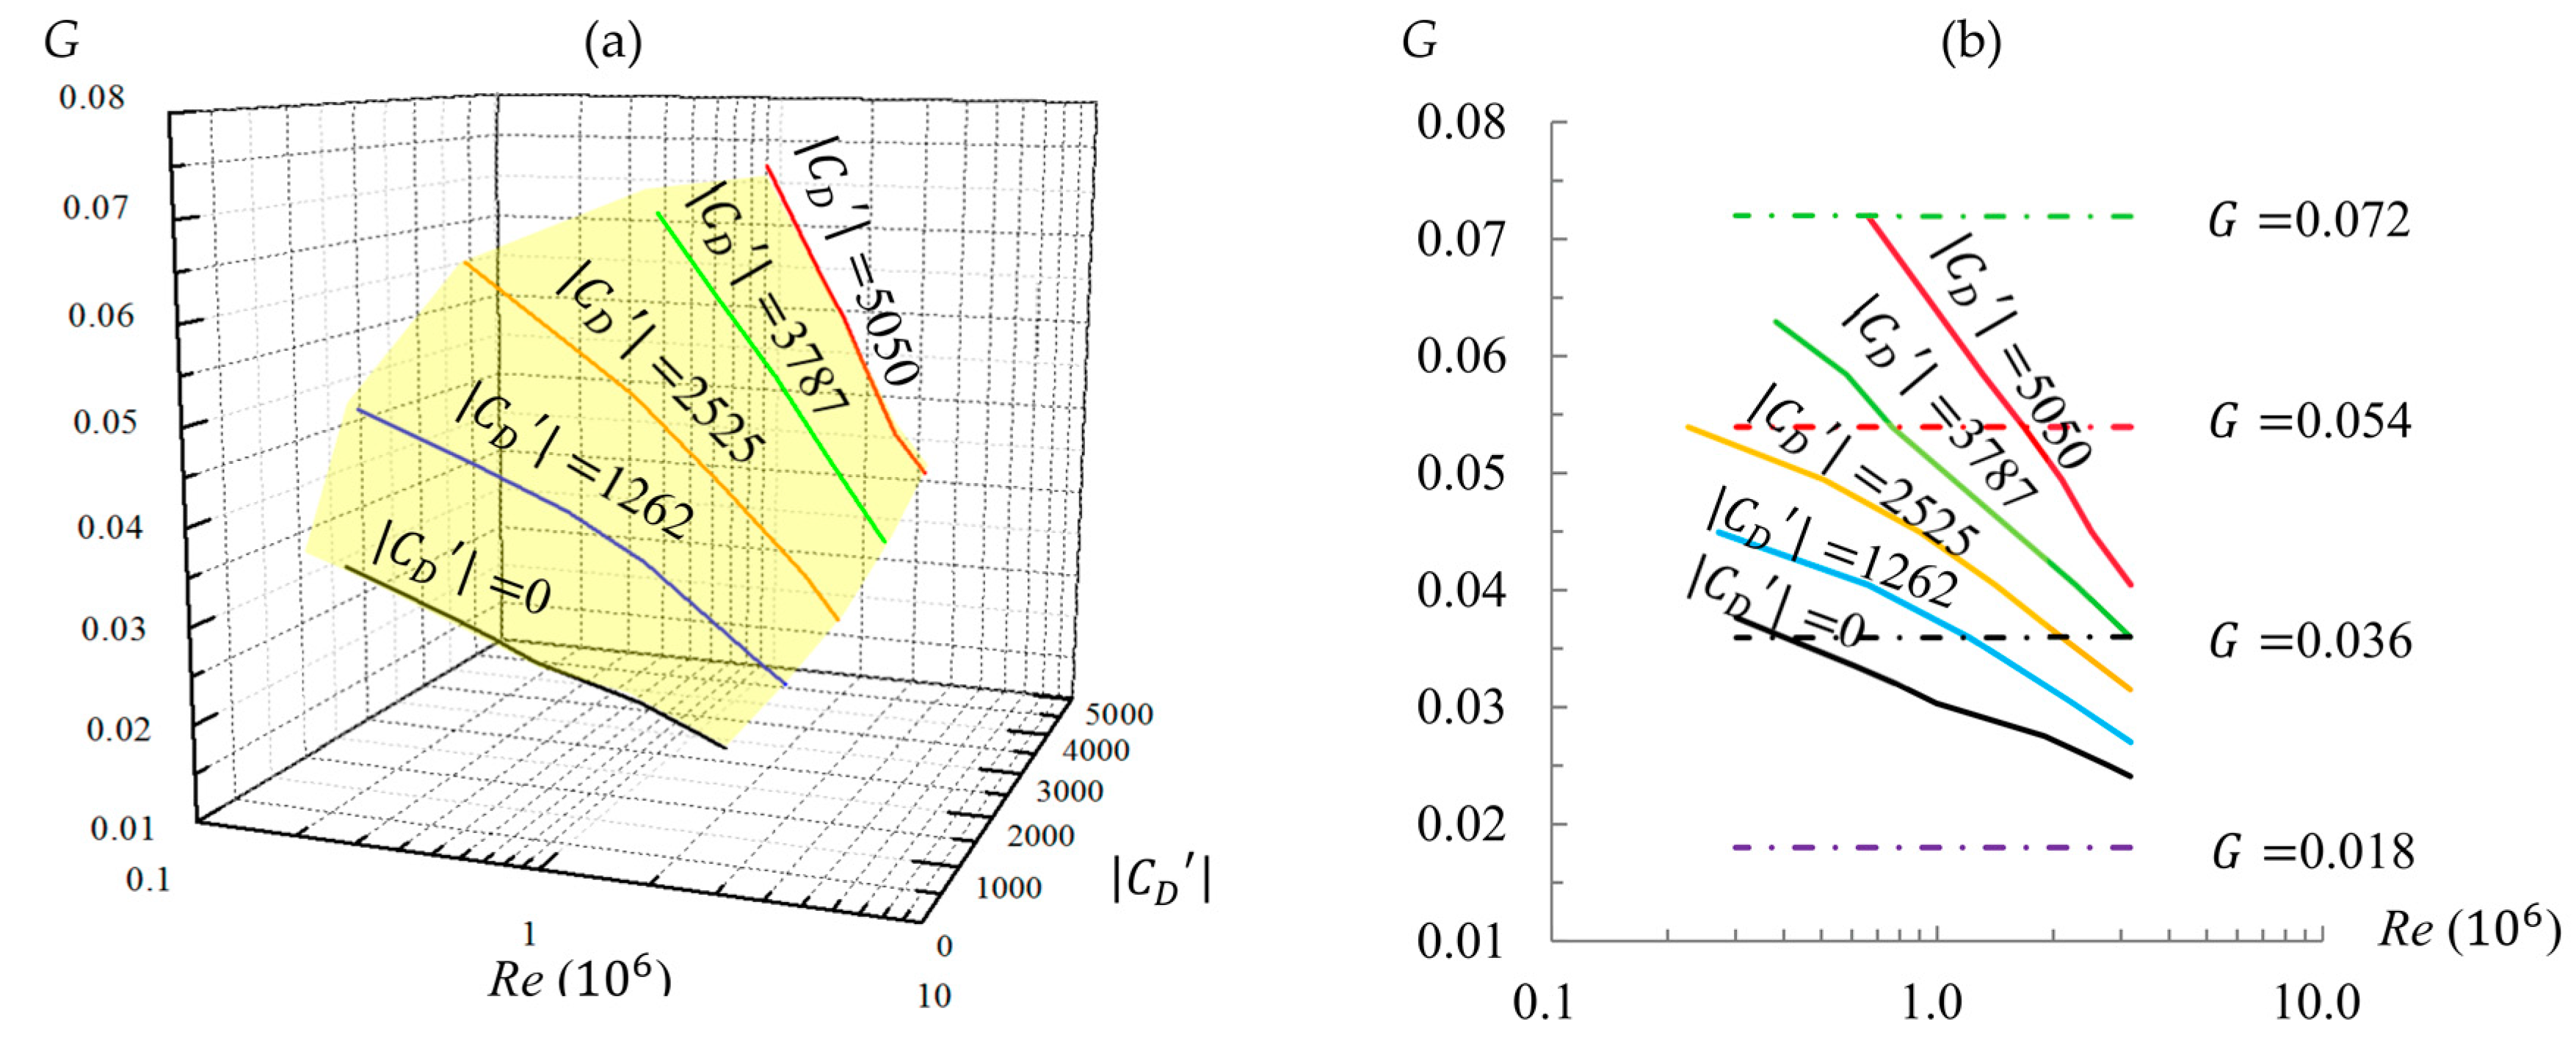
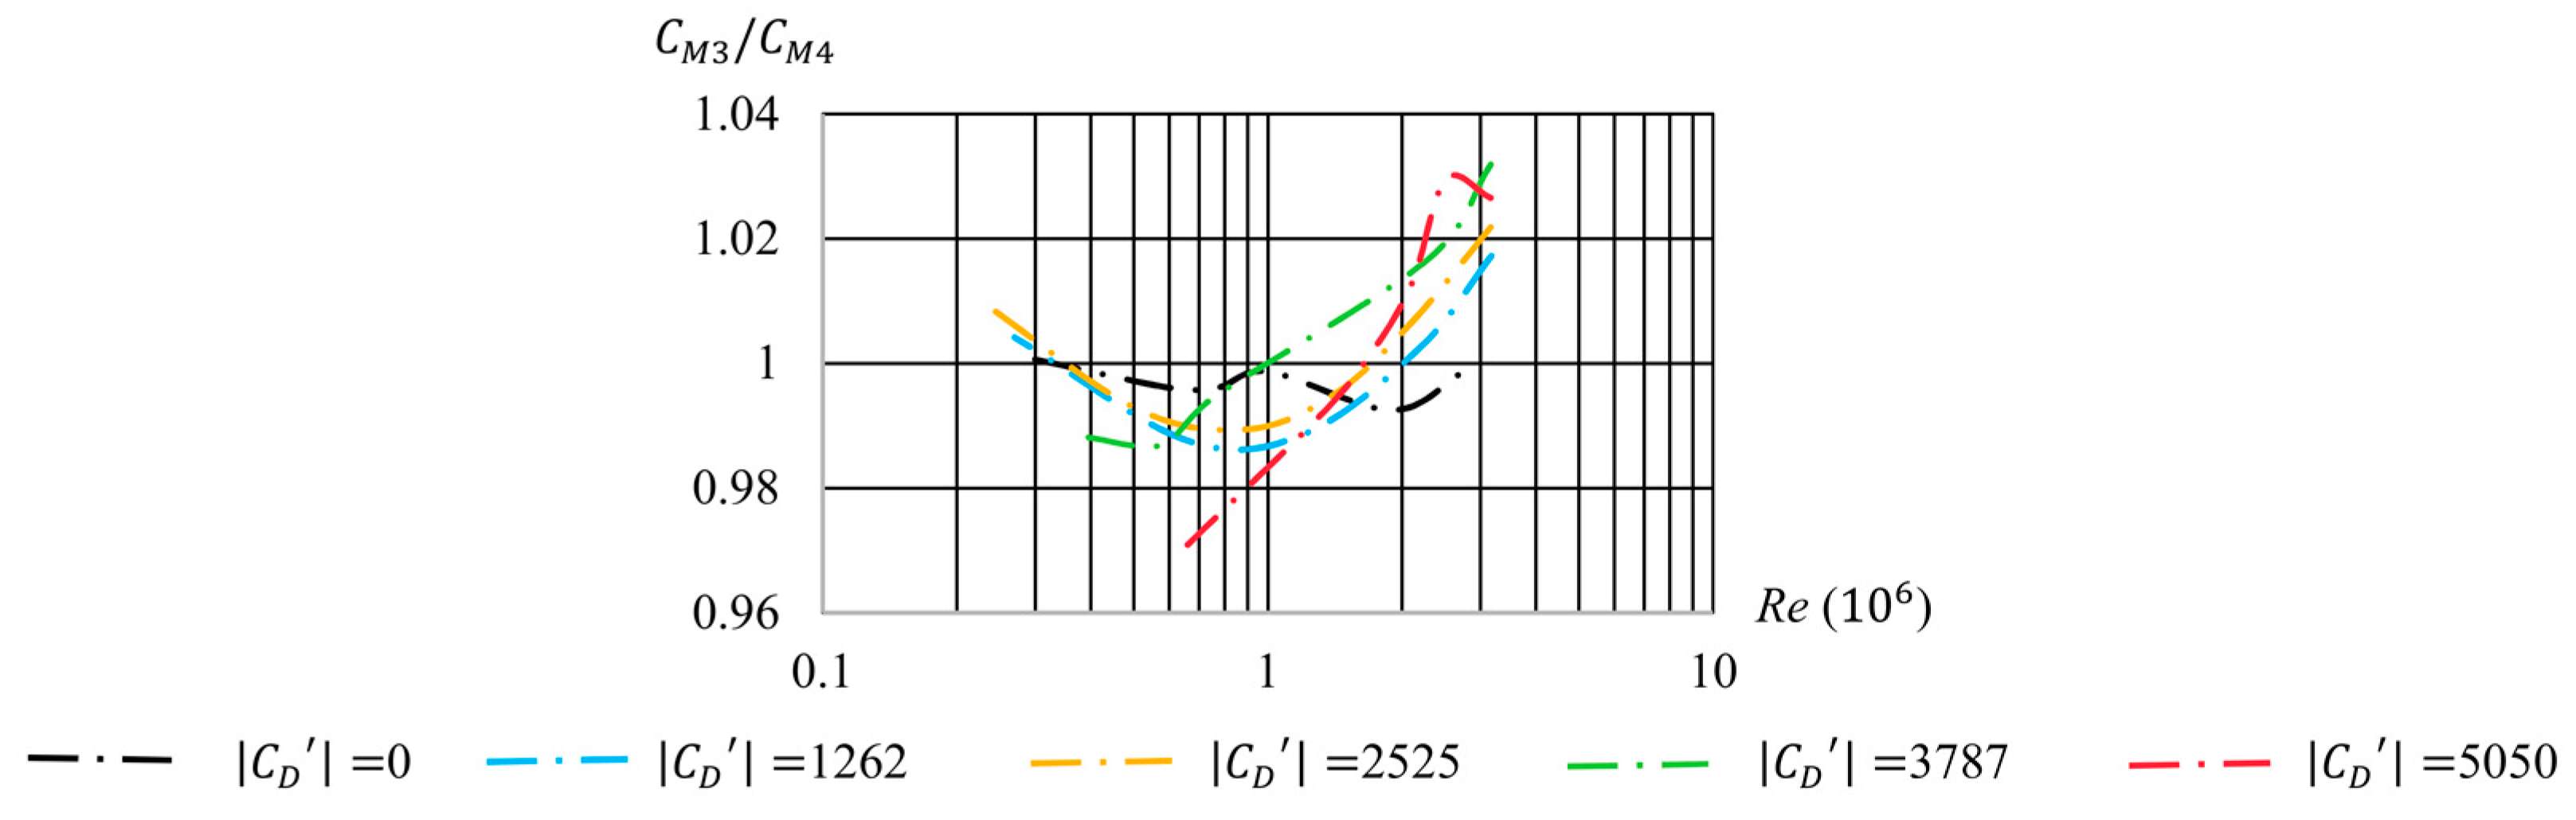
5.4. The 3D Daily and Nece Diagram
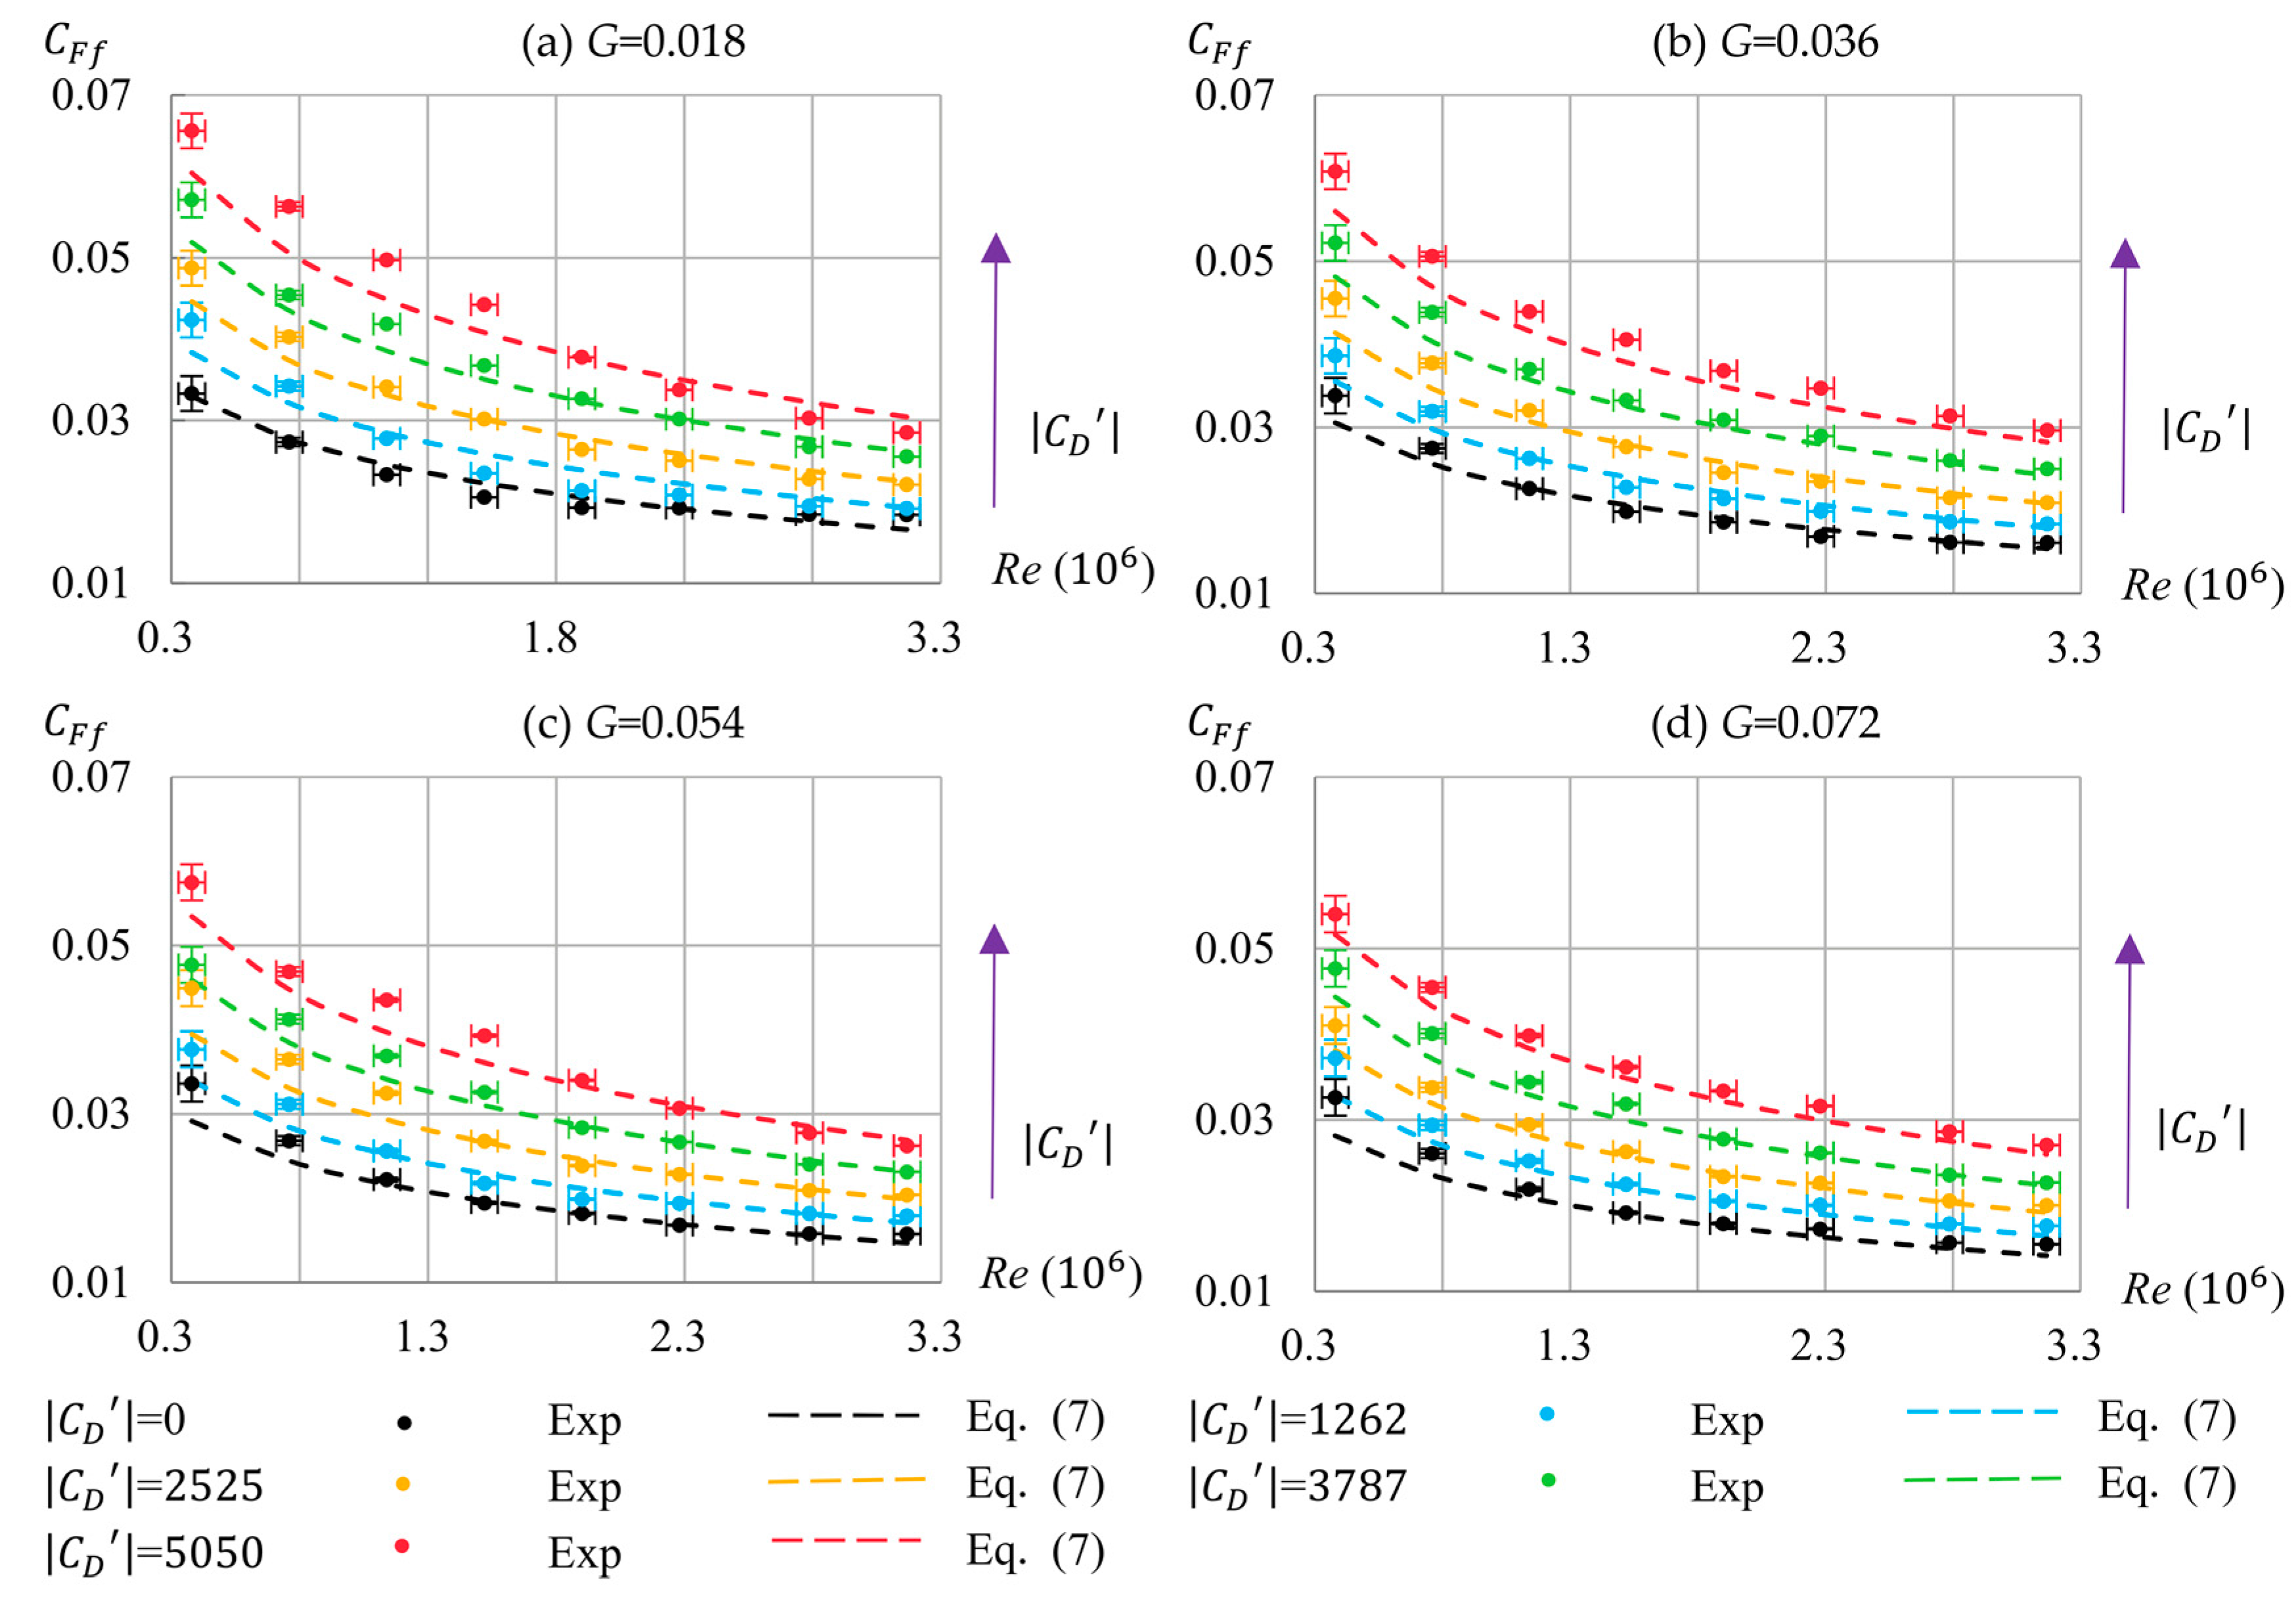
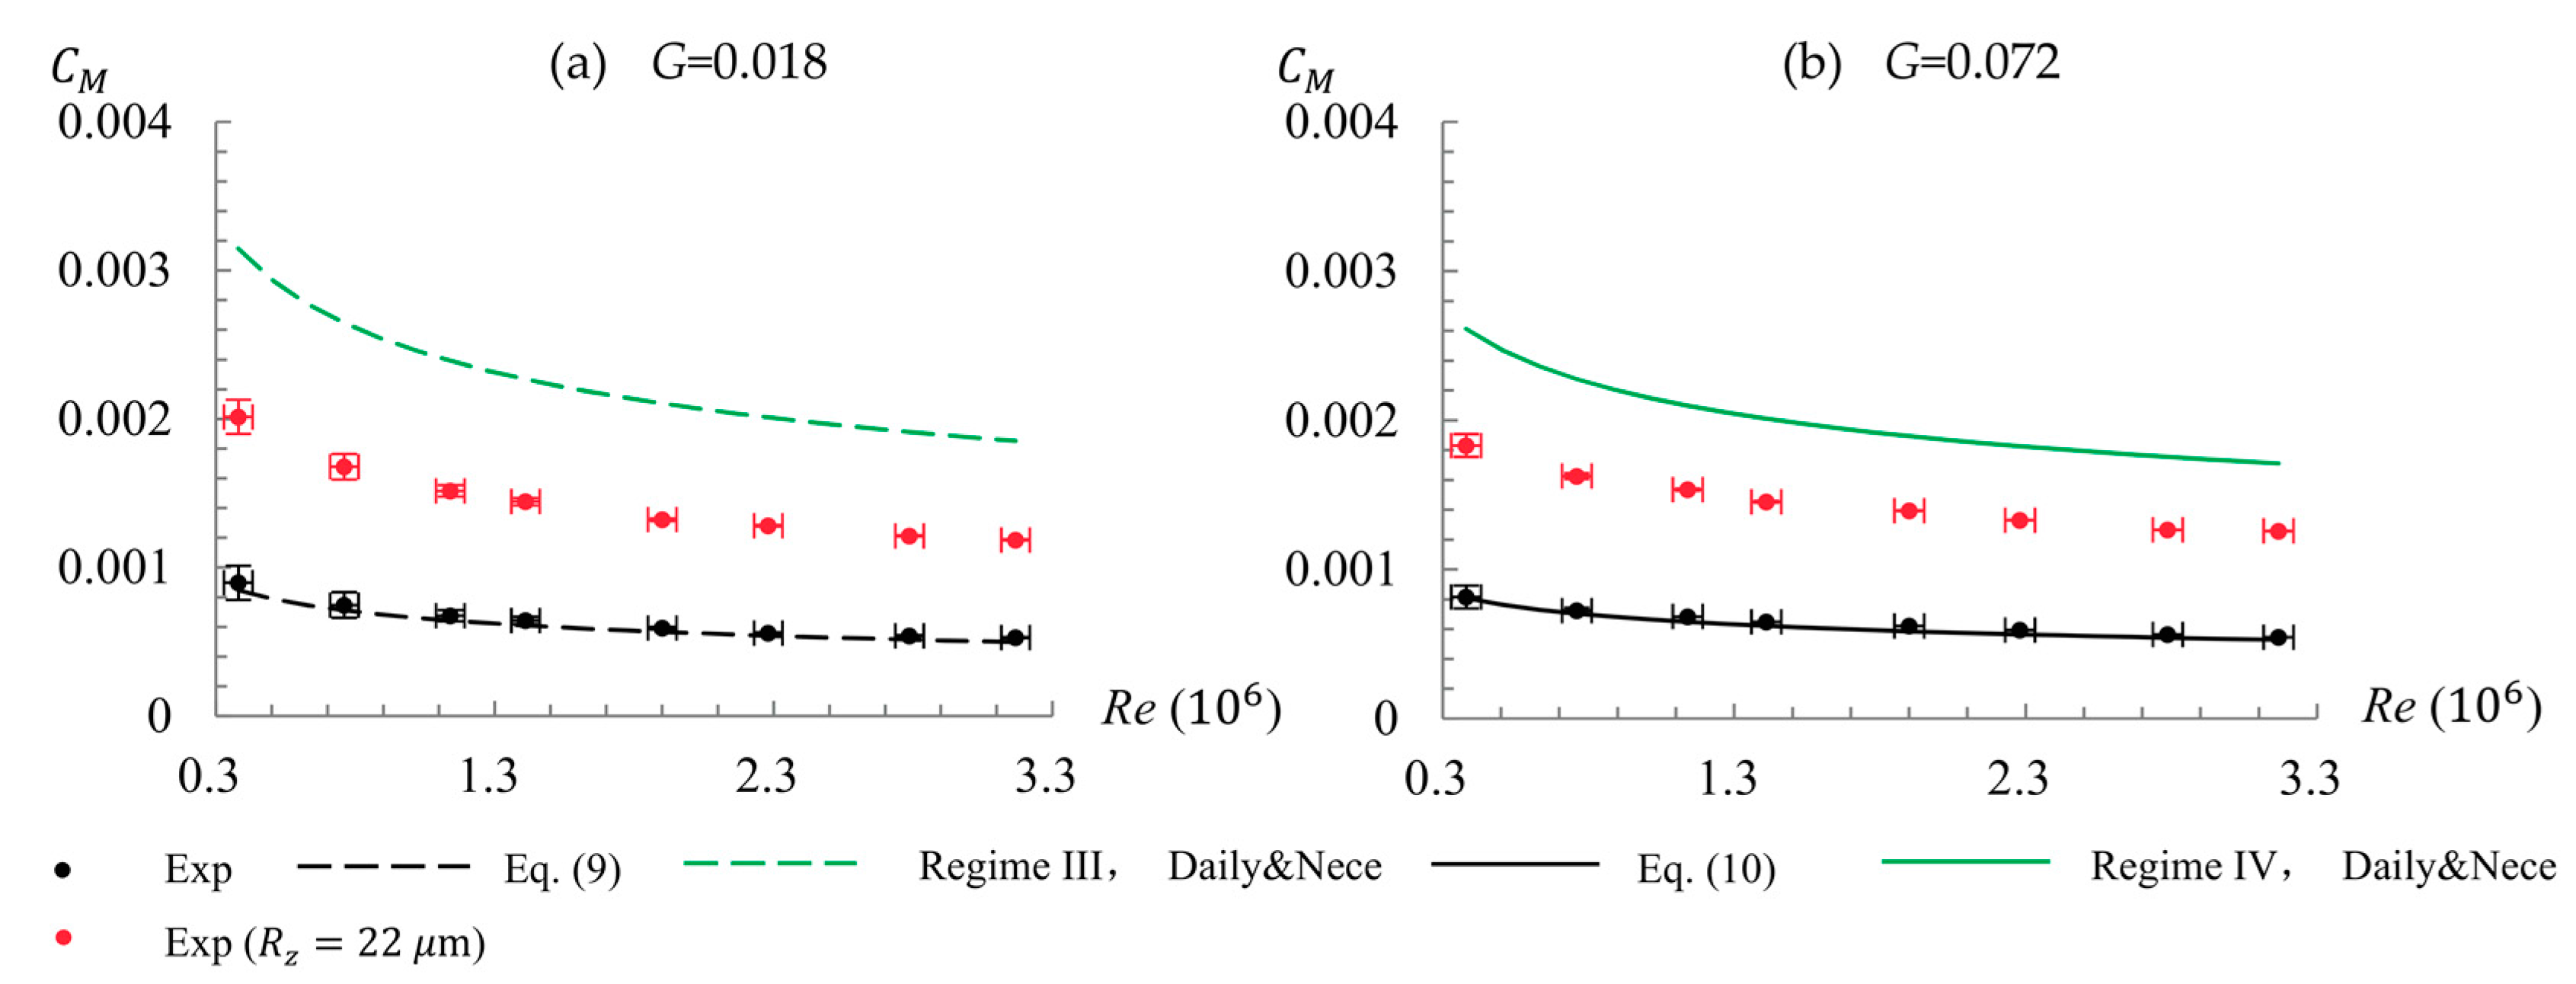
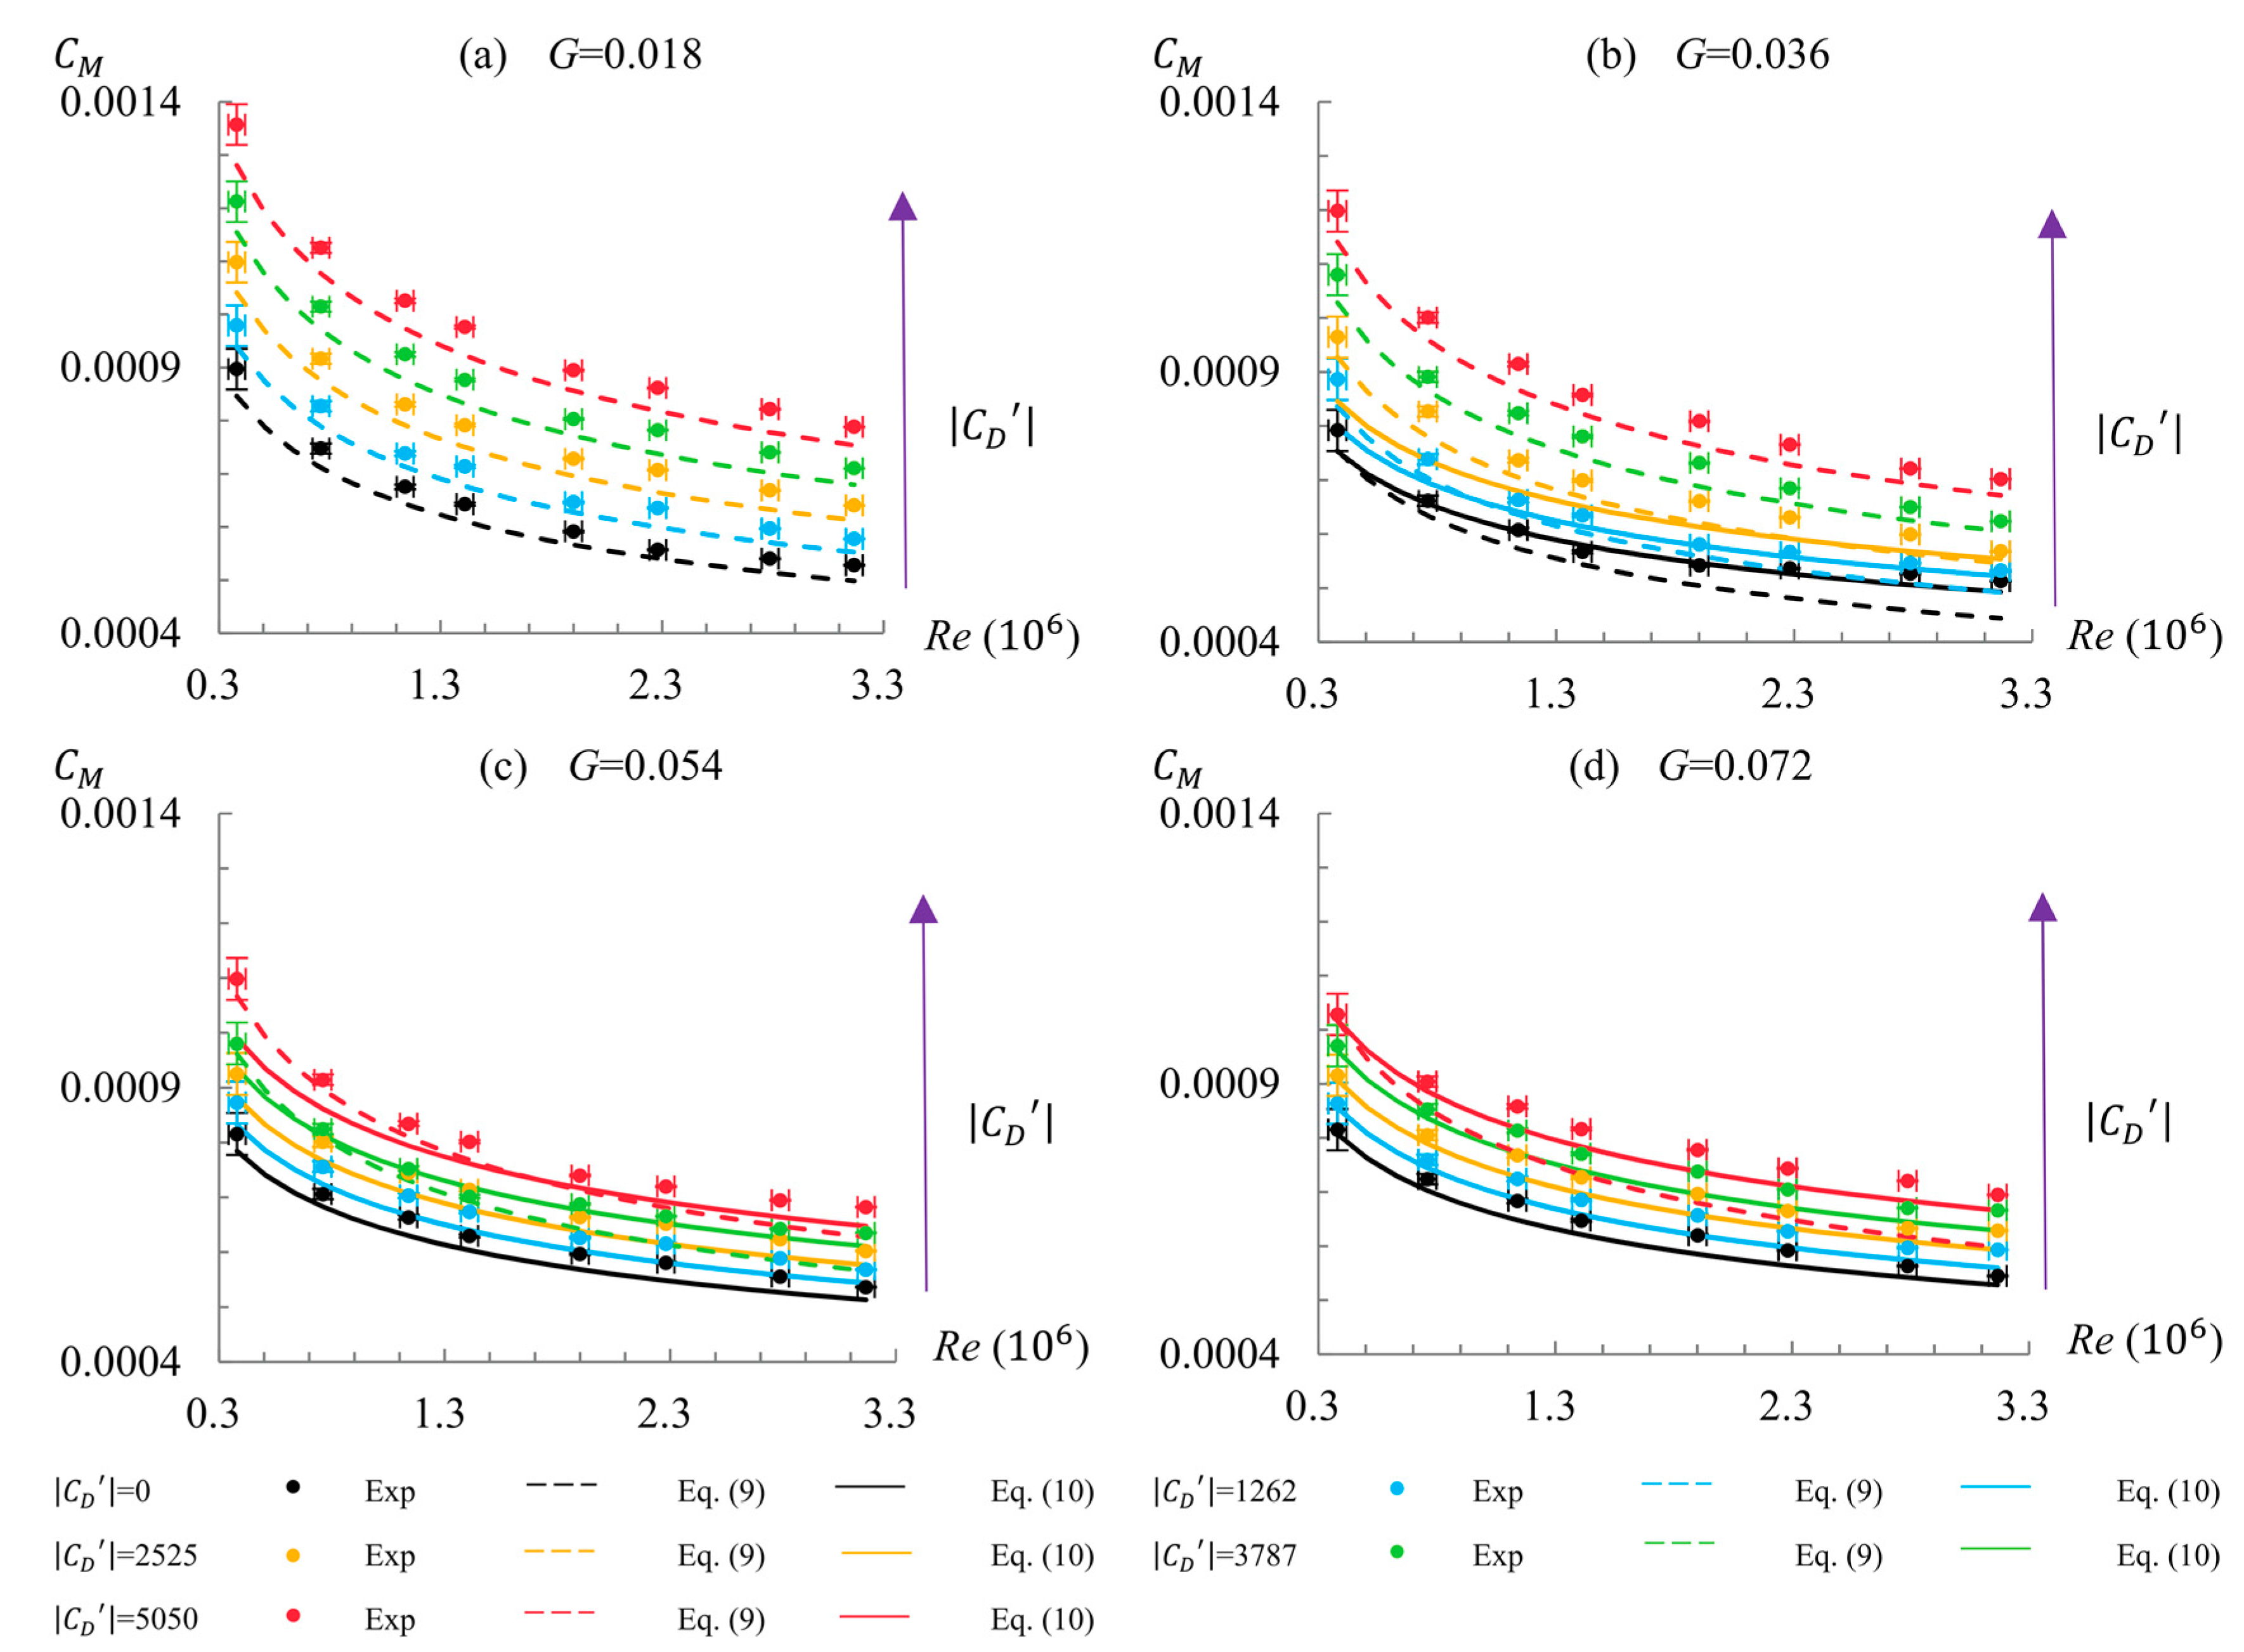
5.5. Moment Coefficient
6. Conclusions
Acknowledgments
Author Contributions
Conflicts of Interest
Nomenclature
| Latin Symbols | |
| a | Hub radius |
| b | Outer radius of the disk |
| Through-flow coefficient | |
| Axial thrust coefficient | |
| on the front surface | |
| on the back surface | |
| Moment coefficient | |
| Moment coefficient on the cylinder surface of the disk | |
| for regime III | |
| for regime IV | |
| Pressure coefficient | |
| Local flow rate coefficient | |
| Relative error of the transducer | |
| Relative error due to the data acquisition device | |
| Axial thrust | |
| Force on the front surface of the disk | |
| Force on the back surface of the disk | |
| G | Dimensionless axial gap |
| K | Core swirl ratio at = 0.5 |
| Equivalent surface roughness | |
| Limitation of for hydraulic smooth wall | |
| Frictional torque | |
| Frictional resistance on the cylinder surface of the disk | |
| Measured range | |
| Mass flow rate | |
| Uncertainty of the data acquisition system | |
| Uncertainty of the transducer | |
| Uncertainty of the measured results | |
| n | Speed of rotation |
| Number of transducers | |
| Measuring times to obtain one result | |
| p | Pressure |
| Pressure at r = b | |
| Dimensionless pressure | |
| Q | Volumetric through-flow rate |
| Re | Global circumferential Reynolds number |
| Reφ | Local circumferential Reynolds number |
| r | Radial coordinate |
| Radius of shaft seal | |
| s | Axial gap of the front chamber |
| Axial gap of the back chamber | |
| t | Thickness of the disk |
| Dimensionless radial velocity | |
| Dimensionless axial velocity | |
| Dimensionless tangential velocity | |
| x | Dimensionless radial coordinate |
| Axial coordinate | |
| Greek Symbols | |
| Diameter of spheres | |
| Dimensionless axial coordinate | |
| Dynamic viscosity of water | |
| Kinematic viscosity of water | |
| Density of water | |
| Angular velocity of the disk | |
| Abbreviations | |
| FS | Full scale |
| LDA | Laser Doppler Anemometer |
| LDV | Laser Doppler Velocimetry |
| SST | Shear Stress Transport |
References
- Kármán, T.V. Über laminare und turbulente Reibung. Z. Angew. Math. Mech. 1921, 1, 233–252. [Google Scholar] [CrossRef]
- Cochran, W.G. The flow due to a rotating disk. Proc. Camb. Philos. Soc. 1934, 30, 365–375. [Google Scholar] [CrossRef]
- Daily, J.W.; Nece, R.E. Chamber dimension effects on induced flow and frictional resistance of enclosed rotating disks. J. Basic Eng. 1960, 82, 217–232. [Google Scholar] [CrossRef]
- Kurokawa, J.; Toyokura, T. Study on axial thrust of radial flow turbomachinery. In Proceedings of the 2nd International JSME Symposium Fluid Machinery and Fluid Mechanics, Tokyo, Japan, September 1972; pp. 31–40. [Google Scholar]
- Kurokawa, J.; Toyokura, T. Axial Thrust, Disc Friction Torque and Leakage Loss of Radial Flow Turbomachinery. In Proceedings of the International Conference on Pump and Turbine Design and Development, Glasgow, UK, 1–3 September 1976. [Google Scholar]
- Kurokawa, J.; Toyokura, T. Roughness Effects on the Flow along an Enclosed Rotating Disc. Bull. JSME 1978, 21, 1725–1732. [Google Scholar] [CrossRef]
- Schlichting, H.; Gersten, K. Grenzschicht-Theorie; Springer: Berlin, Germany, 2006. [Google Scholar]
- Goldstein, S. On the resistance to the rotation of a disc immersed in a fluid. Proc. Camb. Philos. Soc. 1935, 31, 232–241. [Google Scholar] [CrossRef]
- Poncet, S.; Chauve, M.P.; Le Gal, P. Turbulent rotating disk flow with inward throughflow. J. Fluid Mech. 2005, 522, 253–262. [Google Scholar] [CrossRef]
- Batchelor, G.K. Note on a class of solutions of the Navier-Stokes equations representing steady rotationally-symmetric flow. Q. J. Mech. Appl. Math. 1951, 4, 29–41. [Google Scholar] [CrossRef]
- Debuchy, R.; Abdel Nour, F.; Bois, G. On the flow behavior in rotor-stator system with superimposed flow. Int. J. Rotating Mach. 2008, 2008, 719510. [Google Scholar] [CrossRef]
- Launder, B.; Poncet, S.; Serre, E. Laminar, Transitional, and Turbulent Flows in Rotor-Stator cavities. Annu. Rev. Fluid Mech. 2010, 42, 229–248. [Google Scholar] [CrossRef]
- Coren, D.; Childs, P.R.N.; Long, C.A. Windage sources in smooth-walled rotating disc systems. Proc. Inst. Mech. Eng. Part C 2009, 223, 873–888. [Google Scholar] [CrossRef]
- Long, C.A.; Miles, A.L.; Coren, D.D. Windage Measurements in a Rotor Stator Cavity with Rotor Mounted Protrusions and Bolts. In Proceedings of the ASME Turbo Expo 2012: Turbine Technical Conference and Exposition, Copenhagen, Denmark, 11–15 June 2012. [Google Scholar]
- Barabas, B.; Clauss, S.; Schuster, S.; Benra, F.-K.; Dohmen, H.J. Experimental and numerical determination of pressure and velocity distribution inside a rotor-stator cavity at very high circumferential Reynolds numbers. In Proceedings of the 11th European Conference on Turbomachinery, Madrid, Spain, 23–27 March 2015. [Google Scholar]
- Will, B.C.; Benra, F.K. Investigation of the Fluid Flow in a Rotor-Stator Cavity with Inward Through-Flow. In Proceedings of the FEDSM2009, ASME Fluids Engineering Conference, Vail, CO, USA, 2–6 August 2009. [Google Scholar]
- Will, B.C.; Benra, F.-K.; Dohmen, H.J. Numerical and Experimental Investigation of the Flow in the Side Cavities of a Centrifugal Pump. In Proceedings of the 12th International Symposium on Transport Phenomena and Dynamics of Rotating Machinery, Honolulu, HI, USA, 4–7 April 2010. [Google Scholar]
- Will, B.C.; Benra, F.-K.; Dohmen, H.J. Investigation of the Flow in the Side Chambers of a Centrifugal Pump with Volute Casing. In Proceedings of the 10th International Symposium on Experimental Computational Aerothermodynamics of Internal Flows, Brussels, Belgium, 4–7 July 2011. [Google Scholar]
- Han, H.; Gao, S.; Li, J.; Zhang, Y. Exploring fluid resistance of disk rotor based on boundary layer theory. Mech. Sci. Technol. Aerosp. Eng. 2015, 34, 1621–1625. [Google Scholar]
- Shi, W.-D.; Wang, H.-L.; Zhou, L.; Zou, P.-P.; Wang, C. The Estimation and Experiment of Axial Force in Deep Well Pump Basing on Numerical Simulation. Int. J. Mod. Educ. Comput. Sci. 2010, 2, 53–61. [Google Scholar] [CrossRef]


| b (mm) | n (/min) | Q (m3/s) | s (mm) | (mm) | a (mm) | t (mm) |
|---|---|---|---|---|---|---|
| 110 | 0~2500 | −5.56 × 10⁻⁴~0 | 2~8 | 8 | 23 | 10 |
| p (Bar) | (N) | M (Nm) | Re | ||
|---|---|---|---|---|---|
| 4.1 | |||||
| 1 | 3 | 1 | 1 | 1 | |
| 1 | 3 | 3 | 3 | 1 |
© 2017 by the authors. Licensee MDPI, Basel, Switzerland. This article is an open access article distributed under the terms and conditions of the Creative Commons Attribution (CC BY-NC-ND) license (https://creativecommons.org/licenses/by-nc-nd/4.0/).
Share and Cite
Hu, B.; Brillert, D.; Dohmen, H.J.; Benra, F.-K. Investigation on the Flow in a Rotor-Stator Cavity with Centripetal Through-Flow. Int. J. Turbomach. Propuls. Power 2017, 2, 18. https://doi.org/10.3390/ijtpp2040018
Hu B, Brillert D, Dohmen HJ, Benra F-K. Investigation on the Flow in a Rotor-Stator Cavity with Centripetal Through-Flow. International Journal of Turbomachinery, Propulsion and Power. 2017; 2(4):18. https://doi.org/10.3390/ijtpp2040018
Chicago/Turabian StyleHu, Bo, Dieter Brillert, Hans Josef Dohmen, and Friedrich-Karl Benra. 2017. "Investigation on the Flow in a Rotor-Stator Cavity with Centripetal Through-Flow" International Journal of Turbomachinery, Propulsion and Power 2, no. 4: 18. https://doi.org/10.3390/ijtpp2040018
APA StyleHu, B., Brillert, D., Dohmen, H. J., & Benra, F.-K. (2017). Investigation on the Flow in a Rotor-Stator Cavity with Centripetal Through-Flow. International Journal of Turbomachinery, Propulsion and Power, 2(4), 18. https://doi.org/10.3390/ijtpp2040018