Article

A Multi-Point Preliminary Design Method for Centrifugal Compressor Stages of Fuel Cell-Based Propulsion Systems †

1
Propulsion and Power, Faculty of Aerospace Engineering, Delft University of Technology, Kluyverweg 1, 2629 HS Delft, The Netherlands
2
Liebherr-Aerospace Toulouse SAS, Avenue des Etats-Unis 408, 31016 Toulouse, France
*
Author to whom correspondence should be addressed.
This paper is an extended version of our paper ETC16-339 published in Proceedings of the 16th European Turbomachinery Conference, Hannover, Germany, 24–28 March 2025.
Int. J. Turbomach. Propuls. Power 2025, 10(4), 39; https://doi.org/10.3390/ijtpp10040039
Submission received: 23 April 2025 / Revised: 30 July 2025 / Accepted: 19 August 2025 / Published: 3 November 2025

Abstract

The successful implementation of an airborne propulsion system based on hydrogen-powered fuel cell technology highly depends on the development of an efficient, lightweight and compact air supply compressor. Meeting these requirements by designing the compressor using conventional single-point preliminary design methods can be challenging, due to the very wide range of corrected mass flow rate and pressure ratio values that the air supply compressor must be able to accommodate. This article presents a multi-point design methodology for the preliminary design of centrifugal compressors of air supply systems. The method is implemented in an in-house code, called TurboSim, and allows to perform single- and multi-objective constrained optimization of vaneless centrifugal compressors. Furthermore, an automatic design point selection method is also available. The accuracy of the compressor lumped-parameter model is validated against experimental data obtained on a high-pressure-ratio single-stage vaneless centrifugal compressor from the literature. Subsequently, the design methodology is applied to optimize the compressor of the air supply system of an actual fuel cell powertrain. The results, compared to those obtained with a more conventional single-point design method, show that the multi-point method provides compressor designs that feature superior performance and that better comply with the specified constraints at the target operating points.

1. Introduction

Climate change, witnessed by several indicators, among which includes the uninterrupted near-surface global average temperature increase [1], demands tangible actions to mitigate its causes. The global aviation sector contributes to these both via CO 2 and non- CO 2 forcing emissions, representing few percentage points of the anthropogenic radiative forcing [2,3]. While these data may lead to conclude that the aviation sector is responsible for a modest contribution to the global climate change, only a minor share of the world’s population (estimated at about 10% in 2018) has access to air transportation ref. [4]. Thus, as the disparity in air transportation usage reduces, aviation contribution will inevitably increase, requiring new propulsive technologies to attenuate its environmental footprint.
In this context, the FAME project (Fuel cell propulsion system for Aircraft Megawatt Engines), funded by the Clean Aviation Joint Undertaking program of the European Union ref. [5], aims at developing a ground demonstrator of a megawatt-scale fuel-cell propulsion system operating with liquid hydrogen (LH2), and intended for short to medium range aircraft. The operation of such a propulsion system requires a dedicated air supply line, to feed the fuel cell with fresh air. A motorized turbo-compressor provides such air in all flight conditions required by the mission, from the ground to the top of the climb.
The design of such a compressor is particularly challenging due to the very wide range of operating conditions to be covered, both in terms of mass flow rate and pressure ratio, and due to the large variations of the inlet air properties with altitude.
Several works in the published literature address the multi-point design optimization of compressor via CFD-based shape optimization techniques, both for axial compressors and for centrifugal impellers, either imposing constraints over more than one operating point [6], or via proper multi-point evaluation, defining an objective function as a weighted sum over the various points [7,8]. While these methodologies are very effective, they entail a large computational cost because of several CFD evaluations required by the optimizer. Furthermore, the cost of the additional adjoint solutions should be added if this technique is adopted for the gradient evaluation. On the other hand, targeting a multi-point design at the conceptual design phase, leveraging a lumped-parameter model for the evaluation of performance, e.g., ref. [9], could reduce the number of design iterations required for the subsequent CFD-based shape optimization. Additionally, the low computational cost of the lumped-parameter approach enables coupled system–component calculations, giving the designer the opportunity to account for mutual influences [10].
Several works can be found in the published literature concerning preliminary design methods for centrifugal compressors, e.g., ref. [11]. Some of these also take into account the operating range of the compressor via optimization algorithms [12,13]. As an example, Giuffre’ et al. [13] adopted a gradient-free multi-objective optimization, considering as objective functions the weighted average total-to-total efficiency and the operating range (OR) over the design speedline. Although this method provides an increased operating range at the design speedline, it cannot guarantee that the optimal performance and constraints are met at other off-design conditions of interest. Thus, when the design specification must account for operating points featuring largely different values of mass flow rate and pressure ratio, either a conventional trial-and-error approach must be used, or an ad hoc automated methodology has to be developed.
In the case of a multi-point design problem, the ultimate goal can be regarded as finding a feasible compressor design whose performance in terms of m ˙ corr , β tt , η tt fits a set of specified requirements, and that satisfies a prescribed stall margin on the operating speed lines.
This article documents a novel methodology for the preliminary multi-point design of single-stage centrifugal compressors, in which the design mass flow rate m ˙ des and the design-point pressure ratio β tt des are treated as optimization variables. The methodology is used to answer the following research questions:
  • How does a multi-point preliminary design methodology for centrifugal compressors compare to traditional single-point methods in terms of meeting the design targets and achieving optimal efficiency across the operating range?
  • Can an automated methodology for the selection of the design point be developed, treating the design mass flow rate m ˙ des and the design pressure ratio β tt des as optimization variables?
This article is an extended version of the paper ETC16-339, published in the Proceedings of the 16th European Turbomachinery Conference, Hannover, Germany, 24–28 March 2025 [14].

2. Methodology

The multi-point design optimization method of single-stage centrifugal compressors presented in this work is based on a lumped-parameter turbomachinery model documented in refs. [13,15,16]. The methodology is implemented in an in-house code, called TurboSim, that can be operated both in design analysis mode and in design optimization mode.
In the foregoing description, the preliminary design system methodology is recalled first; subsequently, the additional challenges with respect to a single-point-design approach are addressed, starting from the multi-point evaluation of a single design.

2.1. Single-Point Design

The starting point of the compressor preliminary design system in single-point mode is a set of design specifications that define the total inlet conditions, p t des and T t des , and the working fluid, together with a set of design variables, such as X = Φ t , 1 , ψ is , α 2 , m ˙ des , β tt des , Ξ as presented in Table 1. The swallowing capacity Φ t , 1 , the work coefficient ψ is , and the absolute flow angle at diffuser inlet α 2 set the velocity triangles. In this regard, the absolute flow angle at the diffuser inlet is preferred over the degree of reaction R * , as the former is strictly related to diffuser stability. The design point mass flow rate m ˙ des and total-to-total pressure ratio β tt des determine the design point of the compressor, while Ξ collects the main geometrical characteristics of the compressor, such as diffuser radius ratio R 3 / R 2 , impeller shape factor κ , total blade count Z, diffuser pinch blade height ratio H r , pinch , and diffuser pinch radius ratio R r , pinch . Based on the design variable values, the compressor design and design point calculation are performed, establishing the main dimensional parameter of the compressor, such as inlet and outlet blade heights and blade metal angles, and the design rotational speed, Ω des .
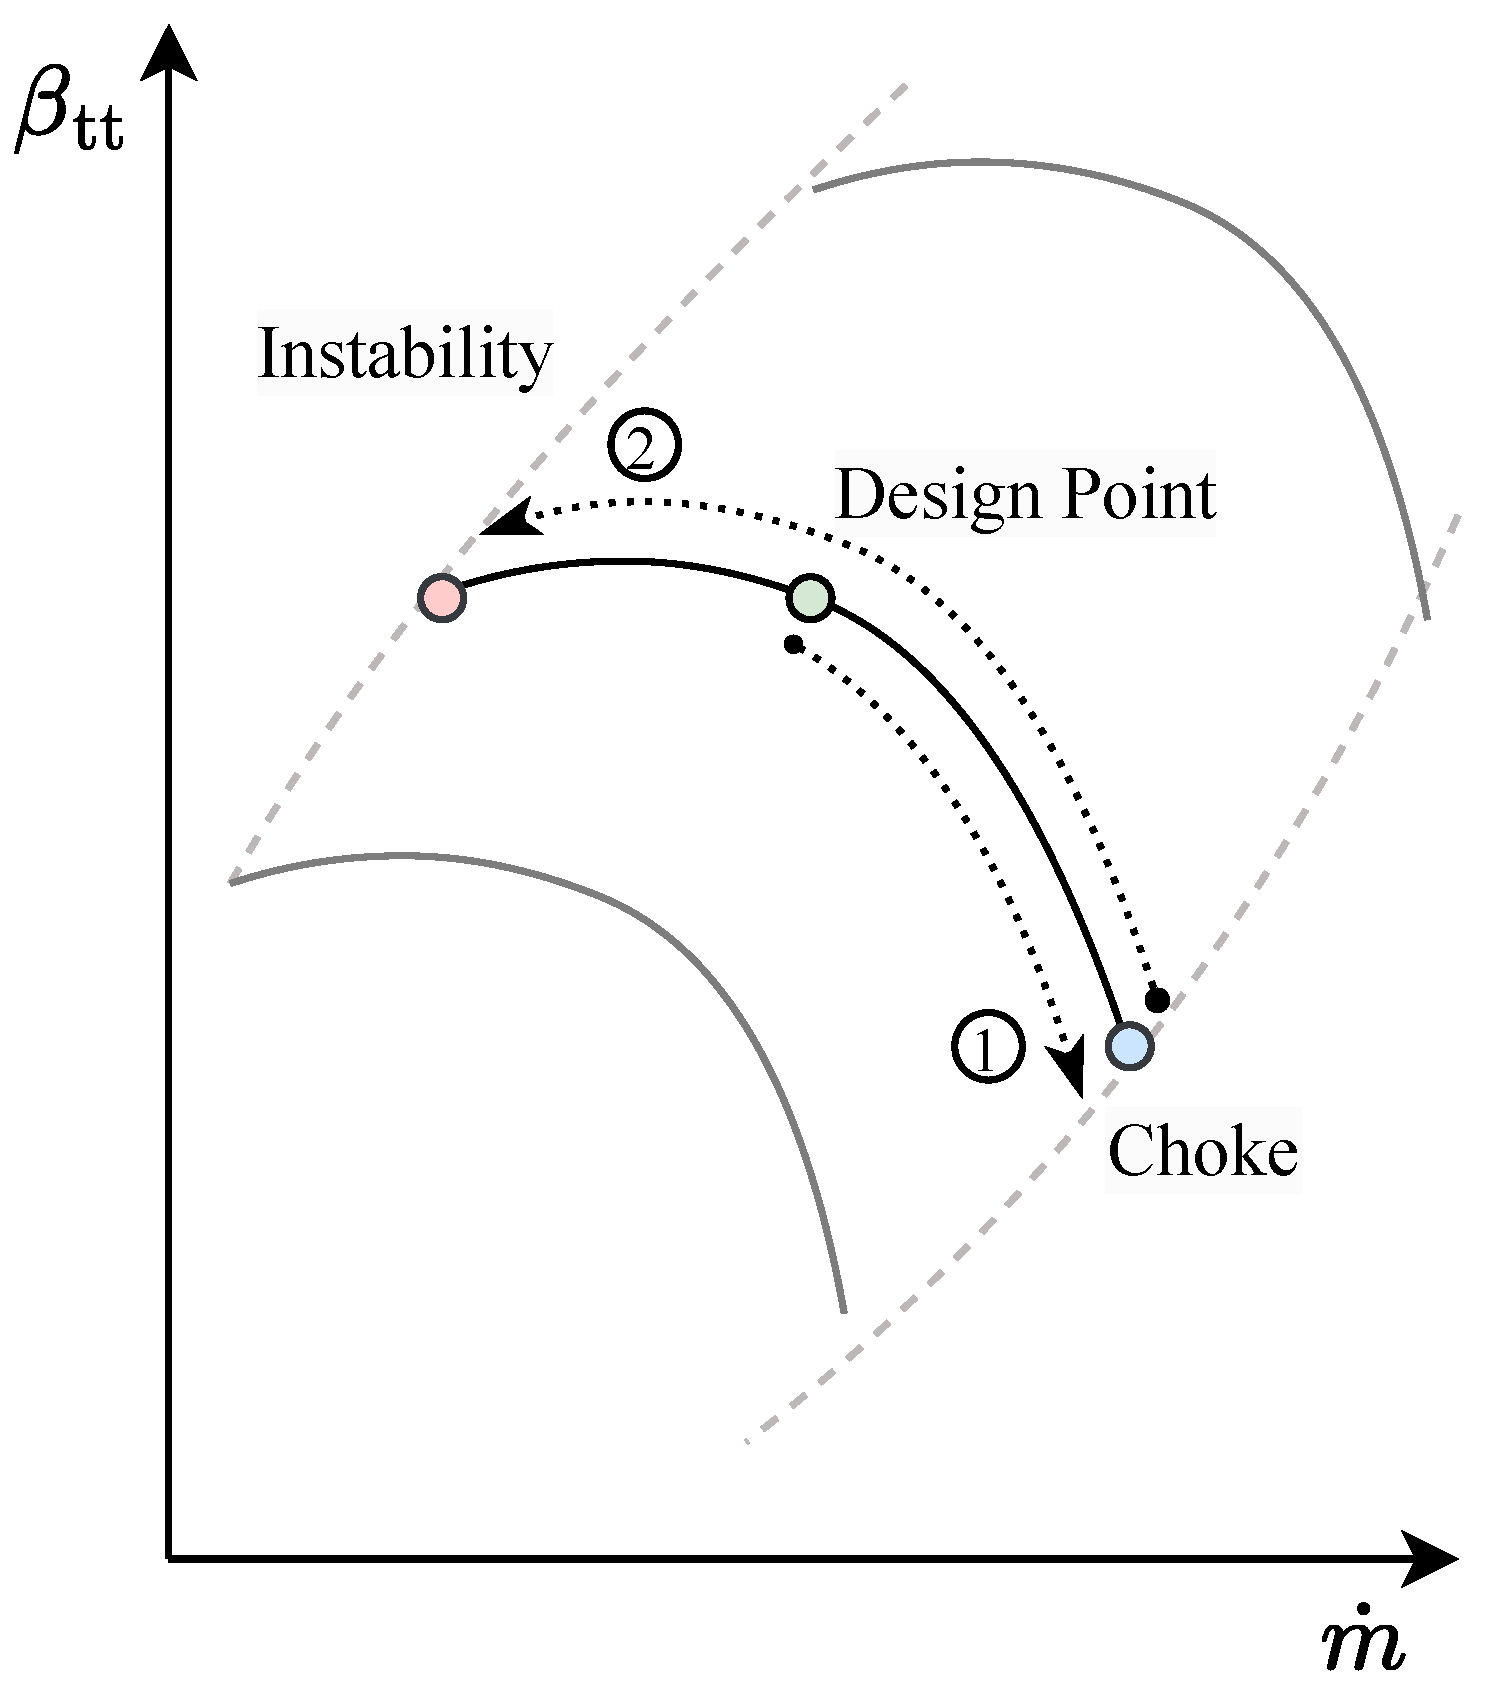
Once a compressor design is available, the compressor performance map is computed, discretizing it by means of six speedlines ranging from 80% to 125% of the design speed. Each speedline is evaluated from choking point up to the left-hand side boundary of the speedline, where stall take places, following the procedure schematically shown in Figure 1. Starting from the design point, the mass flow rate is increased until the choking point is found. This is evaluated by checking at each mass flow rate value the meridional component of the impeller outlet Mach number and the relative Mach number at the impeller throat. For the latter, isentropic balances of mass, momentum, and energy between the inlet and throat sections are solved at each section used to discretize the blade inlet span, and the impeller throat is assumed to be choked when the flow is at sonic conditions at all the above-mentioned sections. The choking point is, therefore, identified by the condition that is met first, such as
m ˙ choke : M m , 2 = 1 or M rel , th span   =   1
Once the choking point is identified, the left-hand side boundary of the speedline, i.e., the instability limit, is to be identified. This condition can be determined by surge or the onset of rotating stall. In the reduced-order model the former is conservatively estimated by the slope of the curve d β / d m ˙ 0 , the latter is identified by a semi-empirical correlation based on the diffuser inlet flow angle larger than a critical value, α 2 , c , as presented in ref. [17]. Alternatively, a limit is set at a minimum efficiency value. So, the mass flow rate is progressively lowered until one of the following conditions is met:
m ˙ stall : d β / d m ˙ 0 or α 2 α 2 , c or η tt 50 %
Repeating the same procedure for each speedline leads to the estimated compressor map that is computed at the reference conditions, T ref and p ref .

2.2. Multi-Point Evaluation

Similarly to the single-point case described in the previous section, to start a multi-point design evaluation, a set of design specifications and a set of design variables are needed. Additionally, an operating point list (OP list) describing the points at which the compressor design will be evaluated is necessary; see Table 1. Every operating point OP i in the OP list is defined by the inlet total conditions p t OP i , T t OP i , a real mass flow rate value m ˙ OP i , a required total-to-total pressure ratio β tt OP i , a required stall margin S M OP i , and a weight ω OP i used to prioritize one point over the others. Based on the design variable values, the compressor design and design point calculation are performed in the same manner of a single-point case.
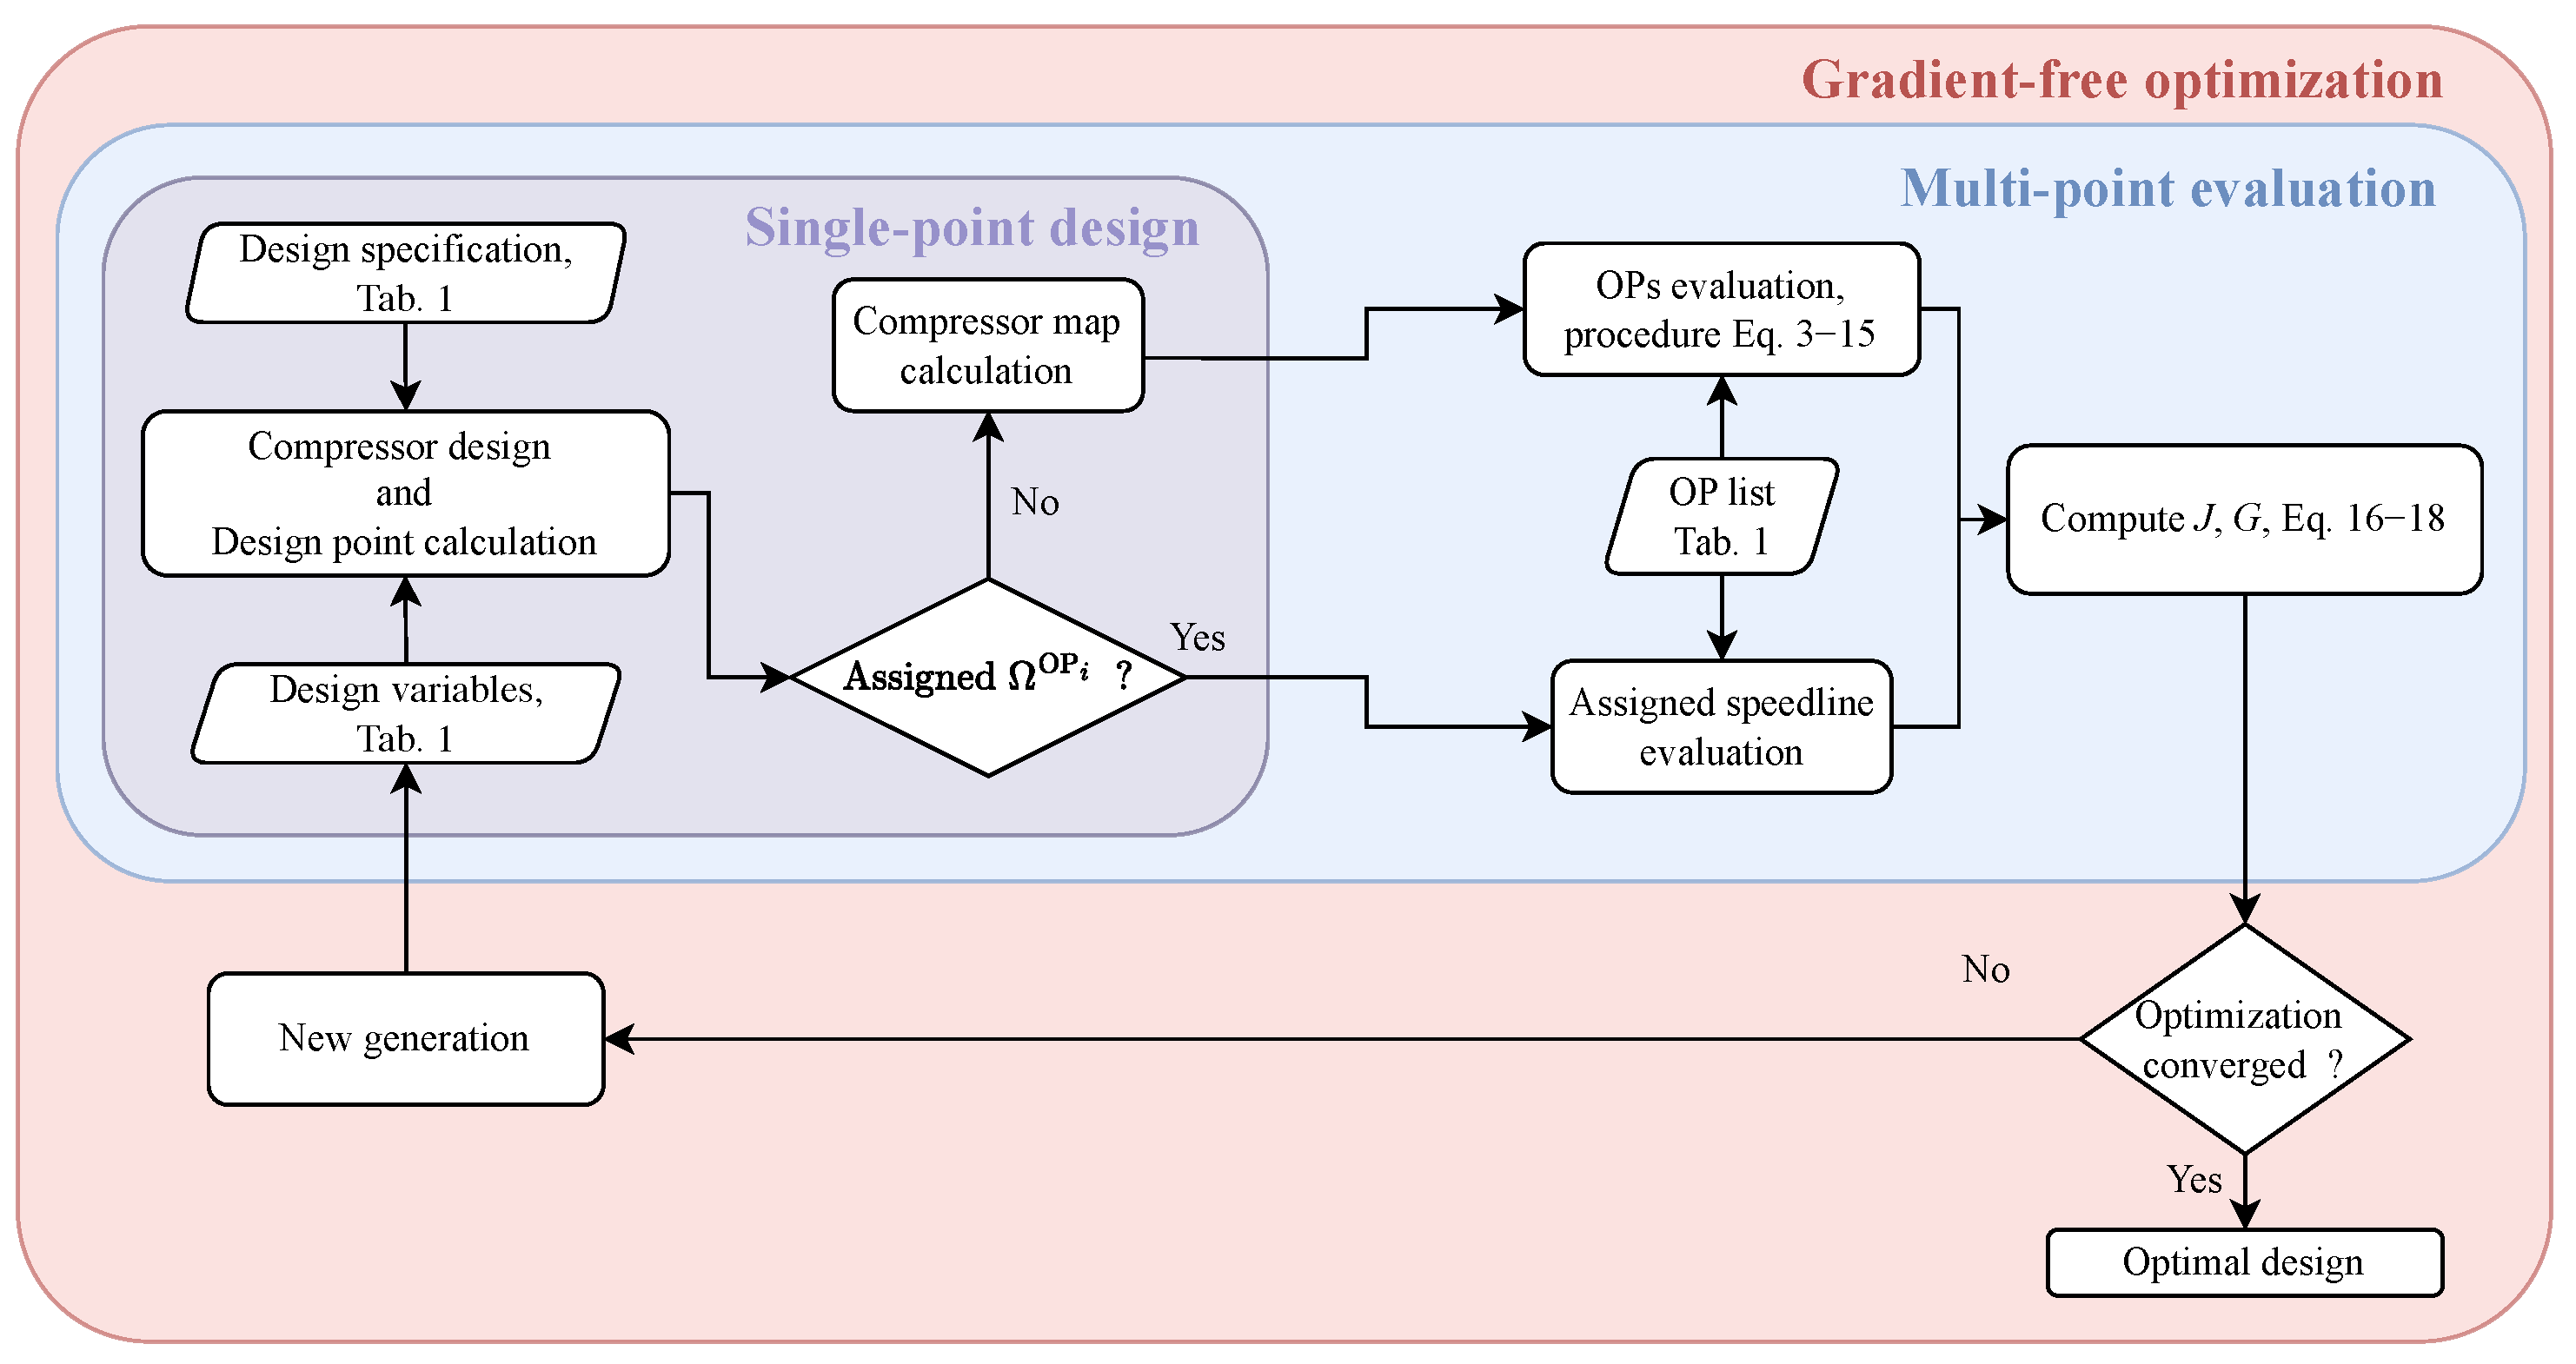
As represented in Figure 2, which depicts the flow chart of the multi-point design procedure, if the rotational speed values are prescribed at each OP in the OP list, the compressor performance map is directly evaluated at these user-specified rotational speed values. Conversely, if the rotational speed value at each OP is to be determined during the design (optimization), the compressor map is computed as described in the single-point case, and a dedicated procedure, referred to as multi-point evaluation, is subsequently followed.
Once the compressor map is available, the polynomial fits of the β tt , η tt and S M curves as a function of m ˙ corr are computed for each of the six speedlines (used to represent the compressor map), obtaining the fitted quantities β ^ tt , η ^ tt and S M ^ . Then, the following procedure is established to perform the multi-point evaluation.
For every OP i in the operating point list, we have the following:
  • The corrected mass flow rate is computed as
    m ˙ corr OP i = m ˙ OP i · p ref p t OP i · T t OP i T ref
  • A minimization problem is solved by means of a root finding algorithm from Scipy [18,19], to estimate the necessary rotational speed, Ω , to reach the target pressure ratio β tt OP i :
    min Ω β ^ tt ( m ˙ corr OP i , Ω corr ) β tt OP i β tt OP i Ω corr OP i , *
    If such a rotational speed value exists, this step returns the value of Ω corr OP i , * that minimizes the difference with respect to the target β tt OP i .
  • The actual rotational speed and blade tip peripheral speed at the impeller outlet, corresponding to the corrected rotational speed Ω corr OP i , * are computed as
    Ω OP i * = Ω corr OP i * · T t , ref T t OP i
    U 2 OP i * = Ω OP i * · 2 π 60 · R 2
  • Each quantity of interest χ , e.g., η tt , at the OP i , identified via Ω corr OP i * , m ˙ corr OP i and β tt OP i , is computed via a double linear interpolation on the two speedlines, Ω and Ω + . These Ω and Ω + values are chosen from the original set of six speedlines used in the compressor map discretization such that Ω is the last one smaller than Ω corr OP i * , and Ω + is the first one greater than Ω corr OP i * :
    Ω Ω corr OP i * Ω + .
    This leads to:
    χ ^ Ω = μ · χ ^ Ω , m ˙ corr + μ + · χ ^ Ω , m ˙ corr +
    χ ^ Ω + = μ + · χ ^ Ω + , m ˙ corr + μ + + · χ ^ Ω + , m ˙ corr +
    χ ^ = γ · χ ^ Ω + γ + · χ ^ Ω + .
    Similarly to Ω and Ω + , m ˙ corr and m ˙ corr + are the discrete m ˙ values used to resolve the speedline, and they are the values immediately preceding and following m ˙ corr OP i , such that
    m ˙ corr < m ˙ corr OP i < m ˙ corr + .
    The coefficients μ k j are instead weight factors, where the μ j values refer to the speedline Ω , while μ + j values refer to Ω + , taken proportional to
    μ k 1 / m ˙ corr OP i m ˙ corr
    μ k + 1 / m ˙ corr + m ˙ corr OP i ,
    and γ and γ + are weight factors proportional to
    γ 1 / Ω corr OP i * Ω
    γ + 1 / Ω + Ω corr OP i * ,
    respectively.
The methodology is complemented with an additional speedline calculation procedure that allows to compute the speedline at the estimated rotational speed Ω corr OP i , * resulting from step 2 of the multi-point evaluation. This functionality is used to reduce the uncertainty associated to the double linear interpolation.
Finally, a simple method is implemented to guarantee the robustness of the methodology, namely to prevent that the double linear interpolation leads to unfeasible operating conditions for the compressor. Specifically, if an operating point, OP i , features a corrected mass flow rate, m ˙ corr OP i , less than the stall mass flow rate, or greater than the choke mass flow rate at both the two selected rotational speed values, Ω and Ω + , the evaluation is discarded and, in optimization mode, the design under evaluation is penalized assigning a zero-value to β tt , η tt and S M .

2.3. Optimization

To perform multi-point design optimization of single-stage centrifugal compressors, the multi-point evaluation method presented previously, is coupled with a gradient-free optimization suite called pymoo [20,21]. Given the nature of the optimization problem that features many constraints at each operating point, the use of a gradient-free method relieves the burden of computing the gradients of all the constraints. The resulting compressor design optimization package allows performing single and multi-objective constrained optimizations, with a flexible number of constraints, depending on the input data provided by the user.
In particular, when an OP list is provided by the user, the weighted average of the total-to-total efficiency values η ¯ tt over the N OPs is computed according to Equation (16), in which the ω OP i are a set of weights specified by the user. As an example, the weights can be used to reflect the time that the system, and hence the compressor, is expected to operate at each operating point. The average total-to-total efficiency is then used to compute the objective function to minimize 1 η ¯ tt .
If a stall margin value, S M , Equation (17), is specified for each OP in the list, the optimization is formulated as a single-objective problem, solved by means of a Genetic Algorithm (GA), and the N stall margin values S M OP i are added to the list of constraints; see Table 2. Alternatively, if the required S M values at each OP i are not specified by the user, the weighted average of the S M values over the N OPs (based on the same weights used for η ¯ tt ), Equation (18), is used to define the second objective function, that is 1 S M ¯ . In this case, the NSGA-II algorithm is used [22]. However, while this functionality has been introduced for the sake of generality of the methodology, in the present study, the minimum required stall margin values are always specified as part of the OP list for every OP i .
If no OP list is specified as part of the optimization input, the conventional optimization mode of TurboSim is used, formulating a multi-objective optimization problem that is solved by means of the NSGA-II algorithm [22]. In this case, the first objective function is set as a function of the operating range, 1 O R (19). The second objective function is set to 1 η ¯ tt . Both the objectives are evaluated at the design speedline and, differently from the previous case, the weights for the calculation of η ¯ tt are inversely proportional to the distance from the design point [13]:
η ¯ tt = i = 1 N ω OP i · η tt OP i
S M = 1 β tt · m ˙ stall β tt , stall · m ˙ · 100
S M ¯ = i = 1 N ω OP i · S M OP i
O R = m ˙ choke m ˙ stall m ˙ des
In the multi-point optimization case, the optimization problem is mathematically formulated as:
min X J X = 1 η ¯ tt
s . t . G k X 0 k = 1 , . . . , n ineq
X L X X U .
Conversely, for the “standard” optimization mode, the optimization problem is mathematically formulated as:
min X J X = 1 η ¯ tt , 1 O R
s . t . G k X 0 k = 1 , . . . , n ineq
X L X X U
where J and G k are the objective function(s) and constraints, Table 2, while X is the design variable vector that can vary within the lower and upper bounds mathematically represented by X L and X U . All design variables are treated as real quantities, except for the blade count, Z, that is treated as an integer design variable.
Achieving a multi-point-optimal compressor design can be considered the task of shaping and positioning the compressor map so that all operating points fall within the map, and, at the same time, meeting all the required constraints. In addition to the usual design variables, the position of the compressor map in the m ˙ corr β tt space is also a function of the design point mass flow rate m ˙ des and pressure ratio β tt des values. Therefore, within the framework of a multi-point optimization, these parameters must be treated as optimization variables. For this reason, depending on the user specification, in multi-point optimization mode, the design mass flow rate m ˙ des and design pressure ratio β tt des can be included in the design variable vector, Table 1, offering an automatic design point selection method. In this case, suitable bounds must also be provided for m ˙ des and β tt des . Considerations about the operating envelope that the compressor is expected to cover can guide the designer in the choice of suitable bounds. In turn, this may relieve the designer from the task of selecting the appropriate design point, which is instead required in conventional design iterations and single-point optimizations.

2.4. Validation

To verify the accuracy of the the compressor map calculation of the ROM, part of the single-point design in Figure 2, at high pressure ratio values, the experimental validation presented in refs. [15,16] is extended to a high-pressure ratio centrifugal compressor. In particular, the measured performance map of the NASA High Efficiency Centrifugal Compressor (HECC) in a vaneless (Baseline Metal Inlet) configuration [23,24], designed to be representative of centrifugal compressors of aero-engine cores of hybrid architecture (axial-radial), is considered for this purpose.
When a preliminary design of a new centrifugal compressor is sought, a set of design variables (Table 1) must be provided. Instead, in validation mode, the accuracy of the loss models embedded in the ROM is to be evaluated against measured data of an experimental compressor. As a consequence, no design variable must be provided. Conversely, the geometrical data of the experimental compressor used for the validation must be specified, and the corresponding compressor map is computed by TurboSim. This operation allows for the comparison of the predicted and experimental operating maps. Specifying the geometric data of the compressor is, therefore, alternative to the compressor design step, marked in Figure 2, which would instead be executed in design mode. For the sake of completeness, the geometrical data of the HECC are reported in Table A1 as part of Appendix A.
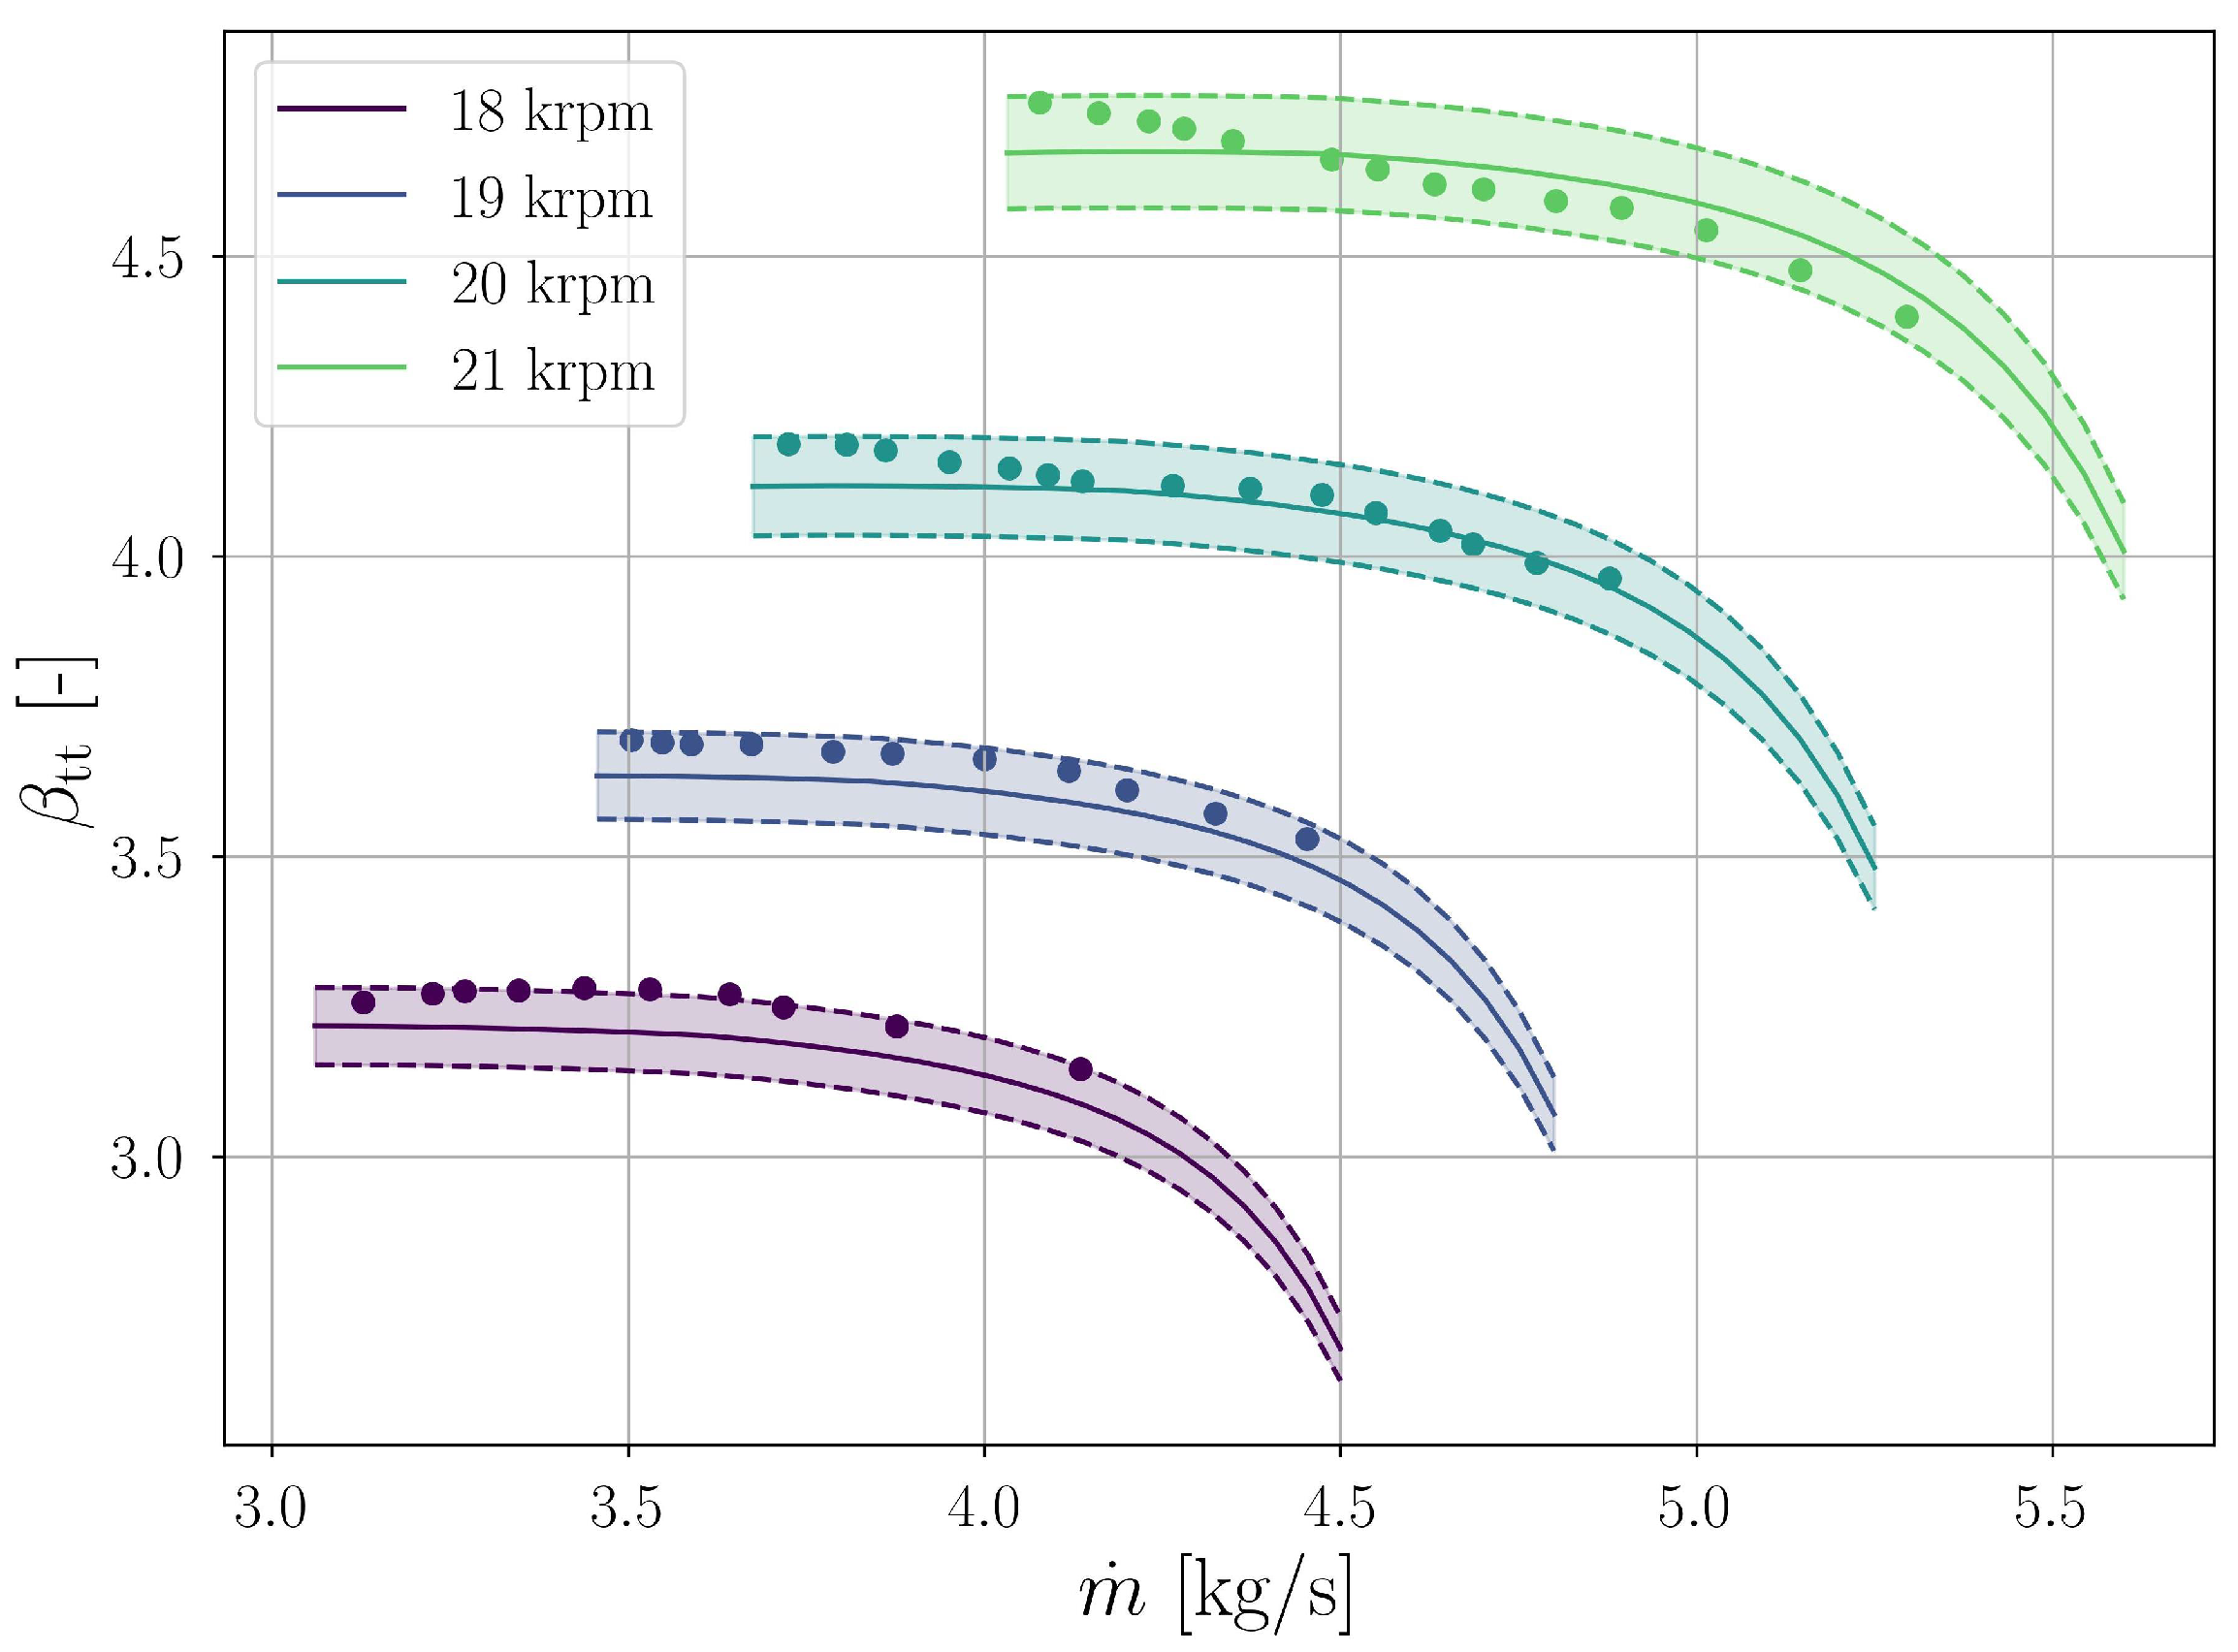
The results of the validation are collected in Figure 3 and Figure 4 that display the total-to-total pressure ratio, β tt , and the total-to-total efficiency, η tt , predicted by TurboSim as a function of the corrected mass flow rate against the experimental data from refs. [23,24]. Four rotational speed values are available, with 21 krpm being the nominal one. TurboSim predictions are presented with solid lines, while the experimental data are shown by means of points. Finally, to ease the comparison of numerical and experimental results, a shaded region representing a ±2% band with respect to TurboSim results is added. The numerical predictions and experimental data of β tt and η tt are in excellent agreement, with the vast majority of experimental data being located well within the TurboSim results ± 2 % bands.

2.5. Application

The methodology presented previously was applied to a test case representative of the air supply compressor of the fuel cell (FC) powertrain under development in the FAME project. A compressor configuration constituted by a single stage with a vaneless diffuser was chosen. The three operating points specified, named Ground, Cruise 1 and Cruise 2, target operating conditions that vary in a wide range of corrected mass flow rate and target pressure ratio values; see Table 3. In particular, the Cruise 1 point features corrected mass flow rate and pressure ratio values that are more than double of those featured by the Ground point, making the selection of the design point conditions non-intuitive.
Starting from these operating conditions and design requirements, three test cases were conceived:
  • A first test case was set up as a multi-point optimization (MPO), treating β tt des and m ˙ des as optimization variables. The multi-point optimization was performed adopting a population of 100 individuals per generation, with a maximum number of generation equal to 350. This test case aims at verifying the capability of the automatic design point selection method and of the multi-point optimization.
  • A benchmark for the MPO was obtained performing a single-point, multi-objective optimization (SPO) adopting the conventional operating mode of TurboSim. In this case, β tt des and m ˙ des were chosen equal to the values obtained from the MPO design. An optimization encompassing 80 individuals per generation and a maximum of 280 generations was selected. A lower number of individuals than in the MPO was chosen due to the lower number of design variables used in the SPO. This test case aims at verifying the capability of the multi-point optimization method.
  • As a further benchmark, an additional single-point optimization was made (SPO-CG), assuming the barycenter of the three OPs as design point. For the SPO-CG optimization, the same numerical setup of the SPO optimization was used. This test case aims at assessing the automatic design point selection method.

3. Results and Discussion

3.1. MPO

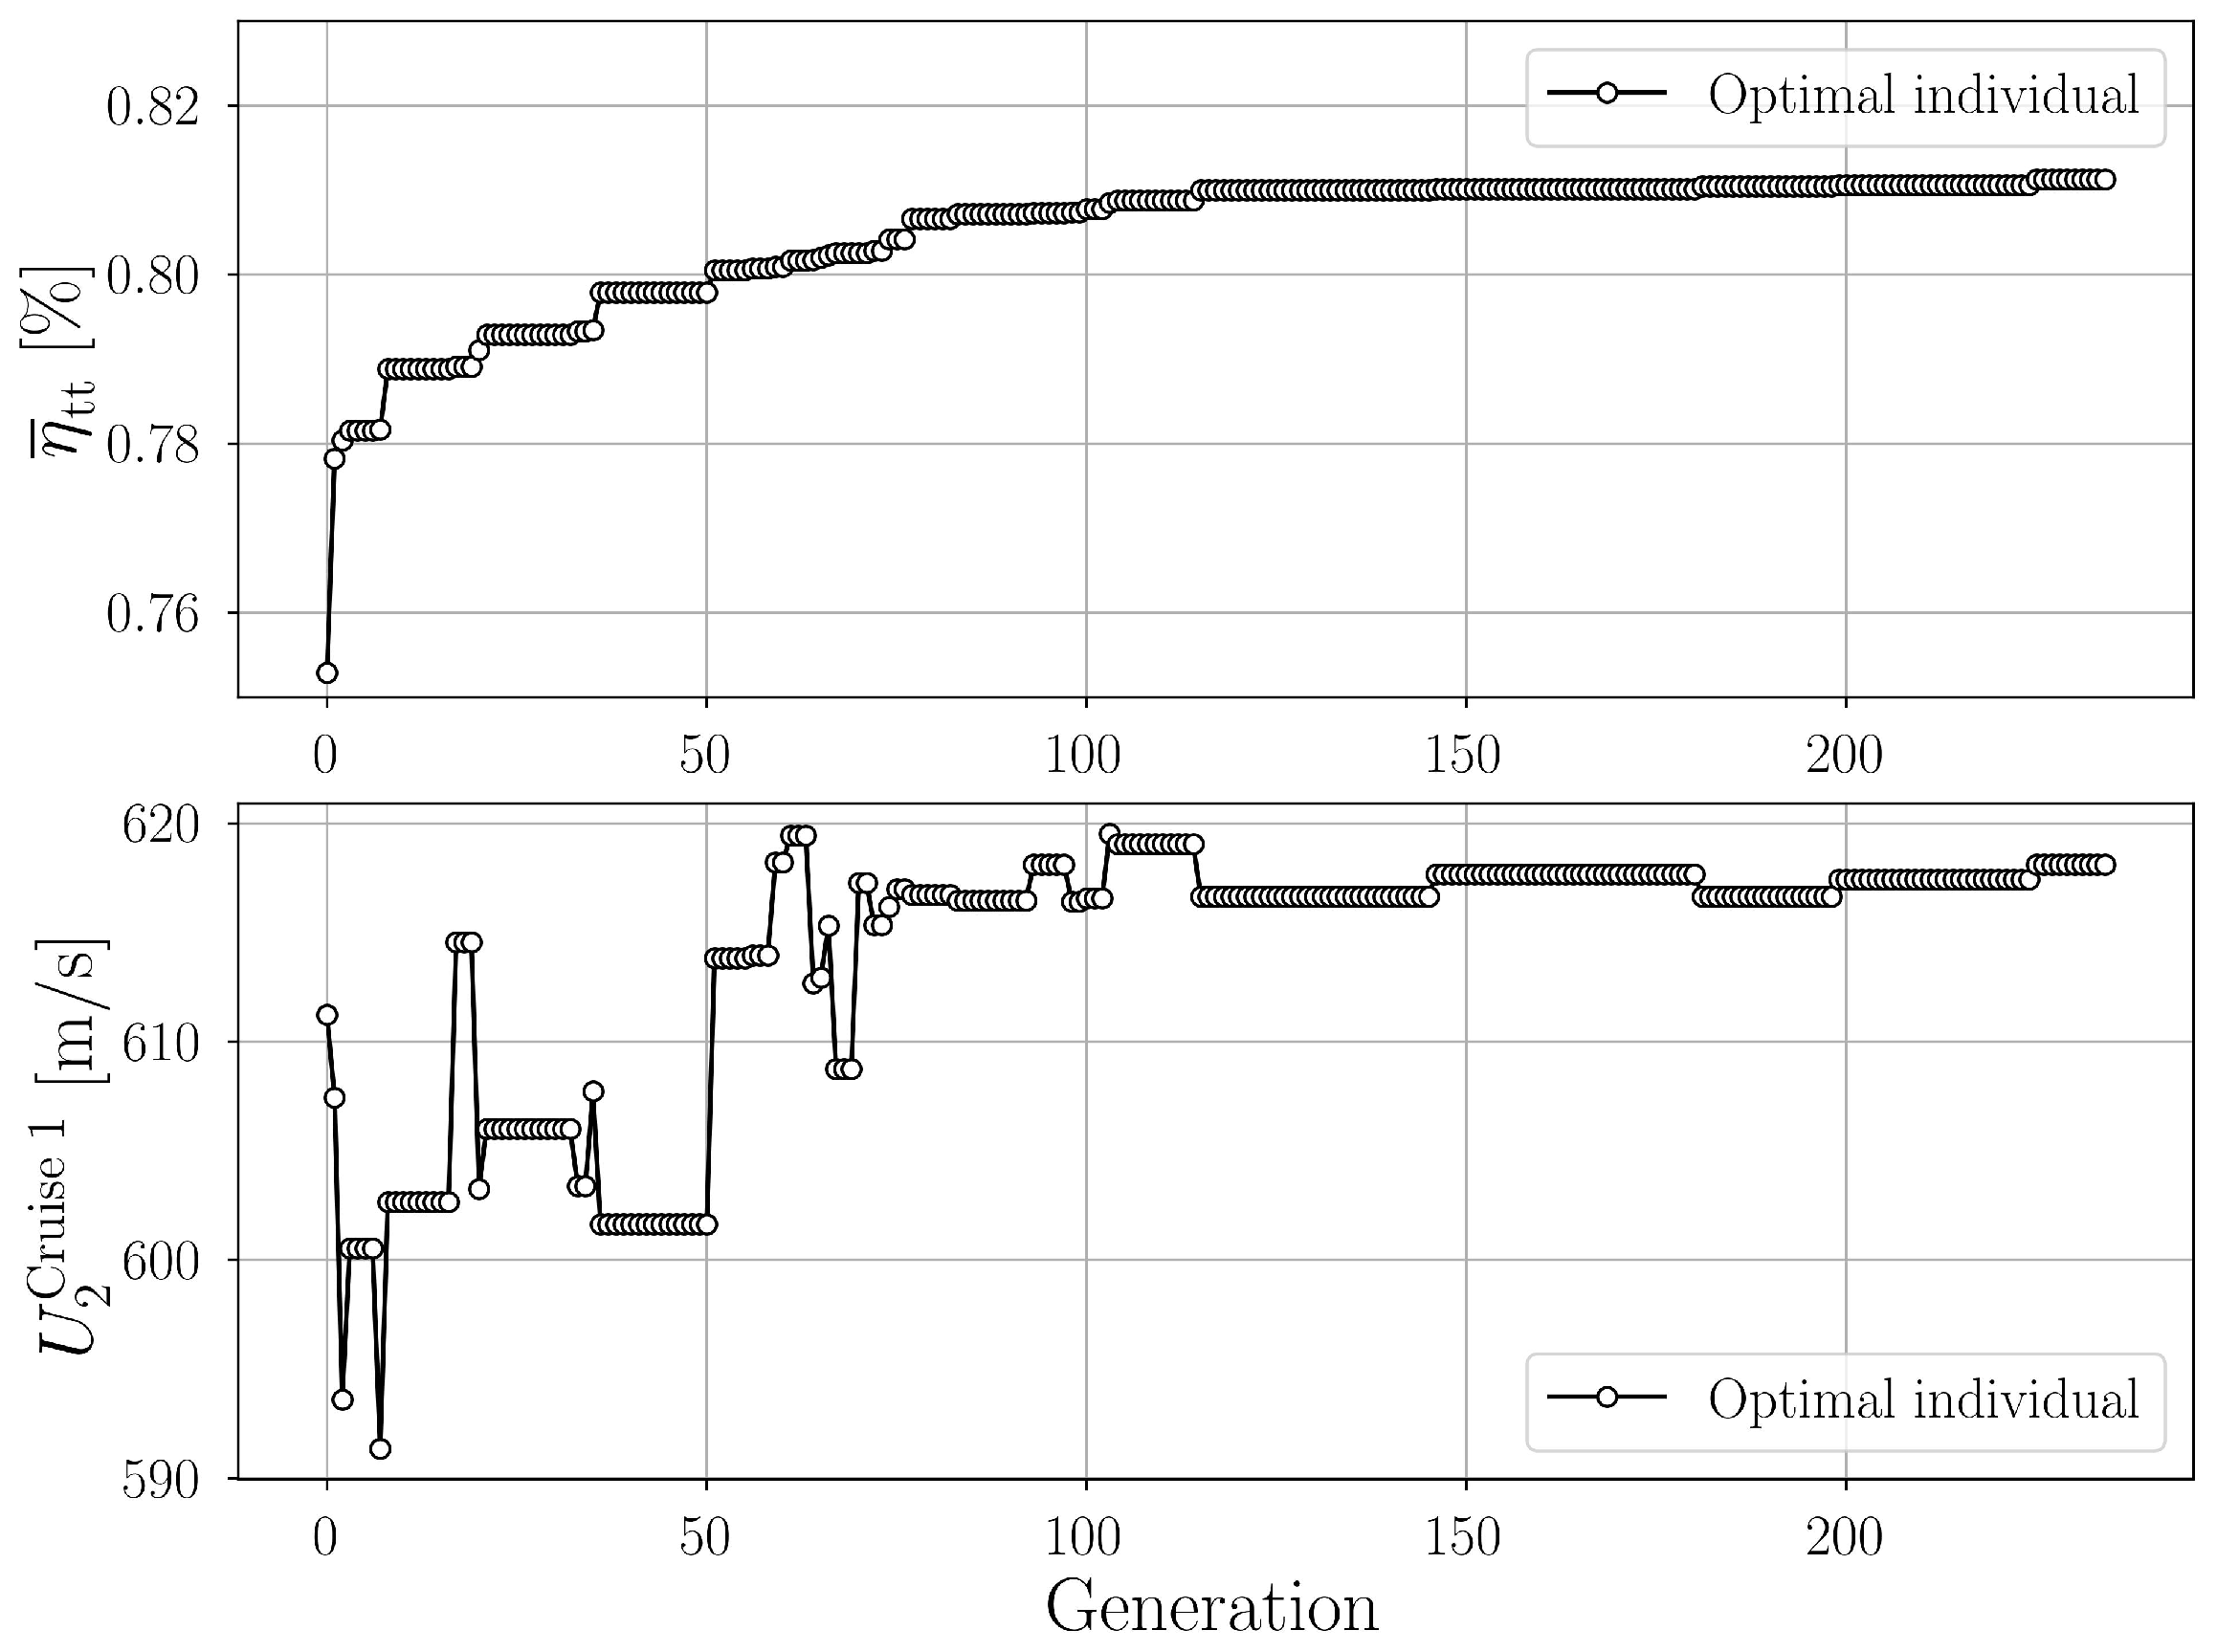
Figure 5 shows the convergence history of the MPO, presenting the value of average total-to-total efficiency, η ¯ tt (16) (top), and the value of the blade peripheral speed for the second operating point (bottom) for the best-fitness individual of each generation. A continuous increase in the objective function is detected throughout the optimization history, until convergence is reached at an average efficiency value of ≈81%. At the same time, the values of the blade peripheral speed at the second operating point (Cruise 1) show that the constraint is active, and that the optimizer is capable of maintaining its value below the requested maximum (620 m/s).
Interestingly, during the optimization process, both β tt des and m ˙ des were active optimization variables as confirmed by Figure 6, which shows their change through the optimization history. Both β tt des and m ˙ des converge towards the higher end of the range defined by their bounds, without reaching their upper bounds.
The corrected map of the optimal MPOed compressor, is shown in Figure 7, together with the superposition of the design point marked by a star , and the specified OPs, marked by triangle , square and circle . While the speedline recalculation procedure was active during the optimization process, only the original speedlines used for the initial compressor map discretization are displayed for clarity. Furthermore, the corrected mass flow rate axis is scaled by the required mass flow rate at Ground point to preserve the confidentiality of the design.
Notably, all the points specified as optimization targets (despite remarkably different mass flow rate and pressure ratio values) fall well within the compressor map. Furthermore, all of them reach the desired pressure ratio β tt specified in Table 3.

3.2. SPO

The non-dominated solutions at the last generation from the SPO test case are presented in Figure 8. Being that the two optimization objectives ( η tt and O R ) are conflicting, a typical Pareto front arises, represented by black symbols and a solid line.
To compare the results of the MPO and SPO optimizations, all non-dominated solutions obtained in the SPO, were post-processed by means of the multi-point evaluation procedure described in Section 2.2. In this regard, it is worth recalling that the SPO does not involve any metric associated to the performance at the target OPs, as only the design speedline is involved in the SPO.
The multi-point evaluation post-processing of the SPO shows that out of the 80 non-dominated solutions defining the Pareto front in Figure 8, 68 designs were able to deliver the required β tt at the three OPs. However, only 11 design candidates featured no constraint violation, while the other 37 showed a negligible cumulated constraint violation, Equation (26), with respect to the values listed in Table 3. The remaining solutions were either unable to reach the required targets, or unable to process a range of mass flow rate values wide enough to incorporate all the OPs:
k g k Target g k Achieved g k Target 100 ,

3.3. SPO-CG

Figure 8 also shows the non-dominated solutions of the SPO-CG optimization, red triangles and solid line. Similarly to the SPO case, the SPO-CG non-dominated solutions have been post-processed by means of the multi-point evaluation procedure described previously.
The results of the multi-point evaluation show that out of the 80 non-dominated solutions, only 3 designs met the specified constraints, and another 17 showed a negligible cumulated constraints violation with respect to the values listed in Table 3. The remaining solutions were, also in this case, either unable to meet the required constraints, or unable to accommodate a range of mass flow rate values wide enough to incorporate all the OPs.
One should also notice that, in comparison to the SPO case, a considerably smaller number of SPO-CG optimal designs are capable of meeting the multi-point design requirements at the 3 OPs. Finally, the comparison of the Pareto fronts of the single-point optimizations highlights that the SPO Pareto front dominates the SPO-CG optimal solutions. These results further suggest the effectiveness of the automatic design point selection method.

3.4. Comparison of the Optimal Solutions

The constraint and efficiency values obtained for the three optimal solutions (MPO, SPO and SPO-CG) at the various operating points are collected in Table 4. While in the multi-point optimization case (MPO), a single optimal solution was computed, a set of non-dominated solutions was obtained for each single-point optimization (SPO and SPO-CG). In these two cases, the optimal solution was therefore selected by choosing the highest η ¯ tt (computed adopting the same weights used for the MPO, ω OP i ), among the designs that did not violate the constraints.
For confidentiality reasons, the S M values are not disclosed, whereas only the change with respect to the target value is presented (27). Therefore, a positive value indicates that the constraint has been met:
Δ S M OP i = S M Achieved OP i S M Target OP i
Results show that the MPO compressor features η tt values above 80% at all OPs. The SPOed design exhibits slightly lower η tt values at Ground and Cruise 1 OPs, and a comparable value at Cruise 2. In contrast, the SPO-CG optimal solution presents the lowest efficiency values at the three OPs. Furthermore, it must be noted that the SPO-CG solution provides a β tt at the Ground OP that is 2% larger than the required value, which causes an unnecessary excess of power demand. These results support the conclusion that the MPO method provides globally larger efficiency values at the various OPs, and also allows to identify a suitable design point. The latter observation is also confirmed by the multi-point analysis performed on the SPO and SPO-CG Pareto fronts. Particularly, this analysis shows better performance for the SPO compressor, which was optimized at the same design point found by the MPO.
In Table 5, a comparison between the design variables of the optimal single-point cases against the MPO case is provided. First of all, the SPO and the optimal MPO solutions feature a different set of design variables (as highlighted by the first column in Table 5), despite the two solutions featuring the same design point. This difference in design variables explains the higher performance offered by the MPO design. Secondly, the largest differences between the three designs lay in the design variables controlling the shape of the diffuser pinch. In both single-point optimization cases, a more enhanced pinch is required as a result of the greater value of H r , pinch . This occurrence could be explained by the slightly larger absolute flow angle at the diffuser inlet α 2 required by the SPO and SPO-CG cases. In contrast, the two single-point optimized designs show an opposite requirement in the location of the pinch. In the SPO case, the pinch occurs much more upstream (at lower R r , pinch ) than in the MPO design, while it occurs further downstream (at higher R r , pinch ) for the SPO-CG case.
While the MPO strategy proved to be superior in terms of achievable efficiency, constraints management at the various operating points, and design point selection, it also entails a larger computational cost. First of all, only the design speedline is required by the single-point method, instead, the MPO method requires the calculation of the full compressor map. Increasing the number of speedlines used for the compressor map discretization increases the accuracy, at the expense of computational cost. In the present work, six speedlines are used. However, this parameter may be application dependent, as a larger (or lower) number of speedlines may be necessary for operating points further away from (or closer to) each other.
Moreover, an additional step is required by the MPO method for the multi-point evaluation, although of modest computational cost in comparison to the map calculation. The computational cost associated to the multi-point evaluation scales with the number of operating points provided. The accuracy of the multi-point evaluation can be increased via the recalculation of the speedline corresponding to the estimated rotational speed at step 2, Equation (4) of Section 2.2. In this regard, it should be highlighted that a better trade-off between the number of speedlines used for the compressor map calculation and the speedline recalculation may exist, although this is deemed beyond the scope of the work.
Finally, when the automatic design point selection method is employed, two additional design variables are introduced. In turn, this may require a larger population size, leading to a longer evaluation time per generation.
In the present work, the computational time of the MPO with automatic design point selection method and speedline recalculation, performed on 21 cores for 230 generations of 100 individuals each is 51.8 h. This corresponds to an average computational time of ≈13.5 min/generation, equal to 8.10 s/individual. In contrast, the computational time of the SPO case is 1.66 min/generation, equal to 1.25 s/individual.
4. Conclusions

In the present work a novel multi-point optimization methodology based on a preliminary design system for vaneless centrifugal compressor stages is presented. The method is implemented in an in-house code called TurboSim, and can be operated both in design analysis and design optimization mode.
The method allows to specify an arbitrary number of target operating points, characterized by required total-to-total pressure ratio β tt , corrected mass flow rate m ˙ corr and minimum stall margin S M values. A flexible number of constraints can be enforced, including minimum and maximum rotational speed, maximum blade peripheral speed, etc., to be respected at all operating points. Nonetheless, an automatic design point selection method is available, requiring the user to specify only a range of values for design point m ˙ des and β tt des . When this mode is activated, these quantities defining the design point are treated as optimization variables, and the optimizer becomes in charge of identifying the optimal design point.
The methodology is applied to a challenging test case representative of the air supply compressor for fuel cell-based aviation propulsive concept, currently investigated in the FAME project. The design specification encompasses three operating points, whose β tt ranges from ≈2.7 up to ≈5.6, with a maximum corrected mass flow rate being 2.14 times the minimum one, as well as stringent requirements on the stall margin values.
The results of the multi-point optimization show that the novel methodology allows to achieve an optimized compressor design that features a total-to-total efficiency above 80% at all specified operating points, also meeting all the constraints. Furthermore, the optimization variables used to identify the design point ( m ˙ des and β tt des ) are active during the optimization history.
The results obtained by means of the multi-point optimization (MPO) method are compared against two optimizations performed by means of the conventional single-point strategy, referred to as SPO and SPO-CG. The first single-point optimization (SPO) is performed adopting the same design point provided by the automatic design point selection method embedded in the MPO. The second single-point optimization (SPO-CG) is performed selecting as the design point the barycenter of the three OPs representing the multi-point design specification. Therefore, the SPO allows to benchmark the capabilities of the multi-point optimization, whereas the SPO-CG allows to assess the effectiveness of the automatic design point selection method.
The research documented in this article allows to answer the research questions mentioned in the introductory Section 1, with the following in particular:
  • The multi-point optimization allows meeting the many constraints specified at the target operating points. Furthermore, it provides superior compressor performance in comparison with single-point design methods.
  • The treatment of m ˙ des and β tt des as optimization variables proves to be viable, as both were active during the optimization. The comparison of the two single-point optimizations confirms that the single-point design carried out at the automatically determined design point outperforms the one carried out at the barycenter of the three OPs.
This aspect is considered particularly relevant, as it can lower the experience level required of the designer to deal with a multi-point compressor design.
Future work will be devoted to the investigation of the compressor aerodynamic performance obtained with the MPO with RANS and URANS CFD analyses, and to improving its design by means of shape optimization methods.

Author Contributions

Conceptualization, A.C. and M.P.; methodology, A.C.; software, A.C.; validation, A.C.; formal analysis, A.C. and M.P.; investigation, A.C.; resources, A.C. and M.P.; data curation, A.C.; writing—original draft preparation, A.C.; writing—review and editing, M.P.; visualization, A.C.; supervision, M.P. and V.C.; project administration, M.P. and V.C.; funding acquisition, M.P. and V.C. All authors have read and agreed to the published version of the manuscript.

Funding

The project 101140559—FAME is supported by the Clean Aviation Joint Undertaking and its members. Funded by the European Union. Views and opinions expressed are however those of the author(s) only and do not necessarily reflect those of the European Union or Clean Aviation Joint Undertaking. Neither the European Union nor the granting authority can be held responsible for them.

Data Availability Statement

The original contributions presented in this study are included in the article. Further inquiries can be directed to the corresponding author.

Acknowledgments

The authors wish to thank Andrea Giuffré for many insightful conversations about the development of the numerical models.

Conflicts of Interest

Author Viviane Ciais was employed by the company Liebherr-Aerospace Toulouse SAS. The remaining authors declare that the research was conducted in the absence of any commercial or financial relationships that could be construed as a potential conflict of interest.

Nomenclature

m ˙                     mass flow rate
X design variable vector
b f back face
G k k-th inequality constraint
Hmeridional channel height
Jobjective function
Llength
ppressure
Rradius
S M stall margin
Ttemperature
t c tip clearance
t h thickness
Ublade peripheral velocity
wrelative velocity
Zblade count
Acronyms
CFDComputational Fluid Dynamics
OPOperating Point
ROMReduced Order Model
Greek Symbols
α abs. flow angle
β rel. flow angle
β metal angle
β tt total-to-total pressure ratio
η tt total-to-total efficiency
μ , γ linear interpolation weights
ε absolute roughness
ρ fluid density
σ solidity
Ω impeller rotational speed
ω weight factor
Superscripts
des design point
L lower
U upper
¯ averaged quantity
^ fitted quantity
Subscripts
1compressor inlet
2impeller outlet/diffuser inlet
3vaneless diffuser outlet
axaxial
blblade
ccritical
corrcorrected quantity
hhub
mmeridional component
midmid span
refreference point
sshroud
splitsplitter blade
ttotal quantity
ththroat

Appendix A

The main geometrical quantities of the NASA HECC [23,24] used for validation are reported in Table A1.
Table A1. Main geometrical quantities of the NASA HECC used for validating the ROM.
QuantityUnitValue
R h , 1 [ m ] 0.0406
R s , 1 [ m ] 0.1077
R 2 [ m ] 0.2159
H 2 [ m ] 0.0152
L ax [ m ] 0.1339
Z blade [ ] 15
Z split [ ] 15
β h , 1 [ ] −33
β mid , 1 [ ] −44
β s , 1 [ ] −56
β 2 [ ] −30
R 3 / R 2 [ ] 1.415
H pinch [ m ] 0.0107
R pinch [ m ] 0.2418
t c 1 [ m ] 2.35 × 10 4
t c 2 [ m ] 3.04 × 10 4
ε [ m ] 1.5 × 10 6
t h 1 , min [ m ] 0.00076
t h 1 , max [ m ] 0.00305
t h 2 , min [ m ] 0.00089
t h 2 , max [ m ] 0.00317

References

  1. Morice, C.P.; Kennedy, J.J.; Rayner, N.A.; Winn, J.P.; Hogan, E.; Killick, R.E.; Dunn, R.J.H.; Osborn, T.J.; Jones, P.D.; Simpson, I.R. An Updated Assessment of Near-Surface Temperature Change From 1850: The HadCRUT5 Data Set. J. Geophys. Res. Atmos. 2021, 126, e2019JD032361. [Google Scholar] [CrossRef]
  2. Lee, D.; Fahey, D.; Skowron, A.; Allen, M.; Burkhardt, U.; Chen, Q.; Doherty, S.; Freeman, S.; Forster, P.; Fuglestvedt, J.; et al. The contribution of global aviation to anthropogenic climate forcing for 2000 to 2018. Atmos. Environ. 2021, 244, 117834. [Google Scholar] [CrossRef] [PubMed]
  3. Ritchie, H.; Rosado, P.; Roser, M. Energy. Our World in Data. 2023. Available online: https://ourworldindata.org/energy (accessed on 18 September 2024).
  4. Gössling, S.; Humpe, A. The global scale, distribution and growth of aviation: Implications for climate change. Glob. Environ. Change 2020, 65, 102194. [Google Scholar] [CrossRef]
  5. FAME Project. Available online: https://clean-aviation.eu/sites/default/files/2024-01/Work-Programme-and-Budget-2024-2025-December-2023.pdf (accessed on 29 November 2024).
  6. Châtel, A.; Verstraete, T. Multidisciplinary optimization of the SRV2-O radial compressor using an adjoint-based approach. Struct. Multidiscip. Optim. 2023, 66, 112. [Google Scholar] [CrossRef]
  7. Luo, J.; Zhou, C.; Liu, F. Multipoint Design Optimization of a Transonic Compressor Blade by Using an Adjoint Method. J. Turbomach. 2013, 136, 051005. [Google Scholar] [CrossRef]
  8. Aissa, M.H.; Verstraete, T. Metamodel-Assisted Multidisciplinary Design Optimization of a Radial Compressor. Int. J. Turbomach. Propuls. Power 2019, 4, 35. [Google Scholar] [CrossRef]
  9. Casey, M.; Robinson, C. A Method to Estimate the Performance Map of a Centrifugal Compressor Stage. J. Turbomach. 2012, 135, 021034. [Google Scholar] [CrossRef]
  10. Giuffre’, A.; Ascione, F.; Servi, C.D.; Pini, M. Data-driven modeling of high-speed centrifugal compressors for aircraft Environmental Control Systems. Int. J. Refrig. 2023, 151, 354–369. [Google Scholar] [CrossRef]
  11. Aungier, R.H. Centrifugal Compressor Stage Preliminary Aerodynamic Design and Component Sizing. In Proceedings of the ASME 1995 International Gas Turbine and Aeroengine Congress and Exposition, Houston, TX, USA, 5–8 June 1995; Volume 1: Turbomachinery. American Society of Mechanical Engineers: Little Falls Township, NJ, USA, 1995. [Google Scholar] [CrossRef]
  12. Keskin, A.; Bestle, D. Application of multi-objective optimization to axial compressor preliminary design. Aerosp. Sci. Technol. 2006, 10, 581–589. [Google Scholar] [CrossRef]
  13. Giuffre, A.; Colonna, P.; Pini, M. The Effect of Size and Working Fluid on the Multi-Objective Design of High-Speed Centrifugal Compressors. Int. J. Refrig. 2022, 143, 43–56. [Google Scholar] [CrossRef]
  14. Cappiello, A.; Ciais, V.; Pini, M. A multi-point preliminary design method for centrifugal compressor stages of fuel cell-based propulsion systems. In Proceedings of the 16th European Turbomachinery Conference, paper n. ETC2025-339. Hannover, Germany, 24–28 March 2025; Available online: https://www.euroturbo.eu/publications/conference-proceedings-repository/ (accessed on 18 August 2025).
  15. Giuffre’, A.; Colonna, P.; Pini, M. Design Optimization of a High-Speed Twin-Stage Compressor for Next-Gen Aircraft Environmental Control System. J. Eng. Gas Turbines Power 2022, 145, 031017. [Google Scholar] [CrossRef]
  16. Giuffré, A. Integrated Design Optimization of Electrically-Driven Vapor Compression Cycle Systems for Aircraft. Ph.D. Thesis, TU Delft, Delft, The Netherlands, 2023. [Google Scholar] [CrossRef]
  17. Kobayashi, H.; Nishida, H.; Takagi, T.; Fukushima, Y. A study on the rotating stall of centrifugal compressors. II-Effect of vaneless diffuser inlet shape on rotating stall. JSME Trans. 1990, 56, 2646–2651. [Google Scholar] [CrossRef]
  18. Virtanen, P.; Gommers, R.; Oliphant, T.E.; Haberland, M.; Reddy, T.; Cournapeau, D.; Burovski, E.; Peterson, P.; Weckesser, W.; Bright, J.; et al. SciPy 1.0: Fundamental algorithms for scientific computing in Python. Nat. Methods 2020, 17, 261–272. [Google Scholar] [CrossRef] [PubMed]
  19. Available online: https://docs.scipy.org/doc/scipy/index.html (accessed on 25 May 2024).
  20. Blank, J.; Deb, K. Pymoo: Multi-Objective Optimization in Python. IEEE Access 2020, 8, 89497–89509. [Google Scholar] [CrossRef]
  21. Available online: https://pymoo.org (accessed on 10 June 2024).
  22. Deb, K.; Pratap, A.; Agarwal, S.; Meyarivan, T. A fast and elitist multiobjective genetic algorithm: NSGA-II. IEEE Trans. Evol. Comput. 2002, 6, 182–197. [Google Scholar] [CrossRef]
  23. Harrison, H.M.; McNichols, E.O.; Blaha, M.R. NASA Small Engine Components Compressor Test Facility: High Efficiency Centrifugal Compressor Vaneless Diffuser and Transition Duct Configurations. In Proceedings of the ASME Turbo Expo 2023: Turbomachinery Technical Conference and Exposition, Boston, MA, USA, 26–30 June 2023; Volume 13D: Turbomachinery—Multidisciplinary Design Approaches, Optimization, and Uncertainty Quantification; Radial Turbomachinery Aerodynamics; Unsteady Flows in Turbomachinery. American Society of Mechanical Engineers: New York, NY, USA, 2023. [Google Scholar] [CrossRef]
  24. Harrison, H.M.; Nguyen-Huynh, T.; Mathison, R.M. NASA HECC Geometry and Performance Review Part 3: A Numerical and Experimental Investigation of Tip Clearance Effects on the Vaneless Diffuser Configuration. In Proceedings of the ASME Turbo Expo 2024: Turbomachinery Technical Conference and Exposition, London, UK, 24–28 June 2024; Volume 12D: Turbomachinery—Multidisciplinary Design Approaches, Optimization, and Uncertainty Quantification; Radial Turbomachinery Aerodynamics; Unsteady Flows in Turbomachinery. American Society of Mechanical Engineers: New York, NY, USA, 2024. [Google Scholar] [CrossRef]
Figure 1. Speedline calculation procedure.
Ijtpp 10 00039 g001
Figure 2. Flowchart of the multi-point design methodology adopted in the present work.
Ijtpp 10 00039 g002
Figure 3. Validation of the ROM for the NASA HECC: total-to-total pressure ratio as a function of the corrected mass flow rate. Solid lines correspond to TurboSim prediction, shaded regions represent a ± 2 % band with respect to TurboSim, and dots corresponds to experimental data from [23,24].
Ijtpp 10 00039 g003
Figure 4. Validation of the ROM for the NASA HECC: total-to-total efficiency as a function of corrected mass flow rate. Solid lines correspond to TurboSim prediction, shaded regions represent a ± 2 % band with respect to TurboSim, and dots corresponds to experimental data from [23,24].
Ijtpp 10 00039 g004
Figure 5. MPO convergence history: averaged total-to-total efficiency (16) (top); blade peripheral speed at the second operating point (bottom).
Ijtpp 10 00039 g005
Figure 6. Change of design point pressure ratio β tt des and mass flow rate m ˙ des as a function of the generations. The values are made non-dimensional with respect to their bounds.
Ijtpp 10 00039 g006
Figure 7. Corrected map of the multi-point-optimized compressor. Mass flow rate axis is normalized by means of the ground-point value for confidentiality reasons. Solid lines indicate speedlines; the star indicates the design point; symbols refer to the target operating points.
Ijtpp 10 00039 g007
Figure 8. Comparison of Pareto fronts at the last generations of the SPO and SPO-CG optimizations. Average total-to-total efficiency, η tt , vs. operating Range, O R .
Ijtpp 10 00039 g008
Table 1. The design specification, design variable, and operating point list required by the multi-point design system.
DescriptionDefinitionGroup
Working fluid-Design specification
Design total inlet pressure p t des Design specification
Design total inlet temperature T t des Design specification
Design mass flow rate m ˙ des Design specification/variable
Design target pressure ratio β tt des Design specification/variable
Swallowing capacity Φ t , 1 Design variable
Work coefficient ψ is Design variable
Absolute flow angle α 2 Design variable
Diffuser radius ratio R 3 / R 2 Design variable
Impeller shape factor κ = 1 R 1 , h R 1 , s 2 Design variable
Total blade count Z = Z bl + Z split Design variable
Diffuser pinch blade height ratio H r , pinch = H 3 H 2 H 2 R 2 R pinch 1 Design variable
Diffuser pinch radius ratio R r , pinch = R pinch R 2 R 3 R 2 Design variable
Real mass flow rate m ˙ OP i OP list
Total inlet pressure p t OP i OP list
Total inlet temperature T t OP i OP list
Target pressure ratio β tt OP i OP list
Required stall margin, Equation (17) S M OP i OP list
Operating point weights ω OP i OP list
Table 2. List of constraints supported by the multi-point design optimization framework.
DescriptionSymbol
Min stall margin required S M OP i
Min pressure ratio required β tt OP i
Min and Max rotational speed Ω OP i
Max tip peripheral speed U 2 OP i
Table 3. List of design operating points and requirements.
Point Name m ˙ corr OP i β tt OP i η tt OP i SM OP i Min ( Ω OP i ) Max ( Ω OP i ) Max ( U 2 OP i )
Ground m ˙ corr Ground ≈2.70> η tt , spec > S M Ground 20 krpm80 krpm620 m/s
Cruise 1 2.14 · m ˙ corr Ground ≈5.57> η tt , spec 3 % > S M Cruise 1 20 krpm80 krpm620 m/s
Cruise 2 2.12 · m ˙ corr Ground ≈4.84> η tt , spec 5 % > S M Cruise 2 20 krpm80 krpm620 m/s
Table 4. Objective function and constraints of the MPO and pseudo-optimal SPO compressor.
QuantityMPOSPOSPO-CG
η tt Ground [ % ] 80.9079.8078.87
η tt Cruise 1 [ % ] 80.5080.0076.94
η tt Cruise 2 [ % ] 81.7082.0075.79
β tt Ground [ ] 2.702.702.76
β tt Cruise 1 [ ] 5.575.575.57
β tt Cruise 2 [ ] 4.844.844.84
Δ S M Ground [ % ] + 0.0 + 0.3 + 23.7
Δ S M Cruise 1 [ % ] + 4.1 + 2.7 + 27.5
Δ S M Cruise 2 [ % ] + 15.3 + 14.3 + 36.0
Ω Ground [ krpm ] 413839
Ω Cruise 1 [ krpm ] 625759
Ω Cruise 2 [ krpm ] 585355
U 2 Ground [ m / s ] 409409406
U 2 Cruise 1 [ m / s ] 618617613
U 2 Cruise 2 [ m / s ] 578574573
Table 5. Design variables of the optimal candidates normalized by the MPO design variables.
QuantitySPOSPO-CG
Φ t , 1 / Φ t , 1 MDO 0.86 0.81
ψ is / ψ is MDO 1.06 1.20
α 2 / α 2 MDO 1.03 1.02
R 3 / R 2 / R 3 / R 2 MDO 1.00 1.00
κ / κ MDO 1.00 1.00
Z / Z MDO 0.86 0.86
H r , pinch / H r , pinch MDO 27.0 10.4
R r , pinch / R r , pinch MDO 0.07 1.40
Disclaimer/Publisher’s Note: The statements, opinions and data contained in all publications are solely those of the individual author(s) and contributor(s) and not of MDPI and/or the editor(s). MDPI and/or the editor(s) disclaim responsibility for any injury to people or property resulting from any ideas, methods, instructions or products referred to in the content.