
VICTORIOUS: A Visual Analytics System for Scoping Review of Document Sets


Abstract
1. Introduction
- identifying or fine-tuning the research question;
- identifying relevant documents;
- selecting documents that are to be examined further;
- sensemaking and classifying documents;
- summarizing results.
- What tasks does the sensemaking step of a scoping review include?
- What visual analytics modules could be developed to support these tasks?
- How can these modules be composed to help a scoping review process?
2. Background
- knowledge synthesis methodologies and scoping reviews;
- existing visual analytics approaches in knowledge synthesis.
2.1. Knowledge Synthesis Methodologies
Systematic Reviews Compared with Scoping Reviews
- identifying and fine-tuning the research question;
- identifying relevant documents;
- selecting documents that are to be examined further;
- sensemaking and classifying documents;
- summarizing results.
2.2. Visual Analytics for Sensemaking
- gathering information;
- encoding the information in a new representation;
- gaining insight through manipulation of the new representation;
- generating knowledge based on the resulted information.
- the dynamic flow of data, i.e., initially found informational items might be removed/reformed during the process (referred to as “dynamic knowledge extraction”);
- the iterative nature of the sensemaking process, in which the sub-processes can come with many back loops and occur one after the other to further polish the formed mental model (referred to as “Multi-resolution sensemaking”).
2.2.1. Existing Approaches

| Initiative | Aim/Objective |
|---|---|
| OpenMinTed [25] | “[T]o create an open, service-oriented Infrastructure for Text and Data Mining (TDM) of scientific and scholarly content” |
| Visa TM [26] | Serves as the core knowledge extraction component for OpenMinted by integrating thesauri, ontologies, and semantic resources from multiple domains. |
| ISTEX [27] | Constitutes corpora of scientific publications; provides tools for research communities to explore curated corpora subsets. |
| LODEX [28] | Formulating queries on Lined Open Data, to be used in ISTEX. |
| Covid-on-the-Web [29] | Provides access, extraction, and querying of knowledge from coronavirus-related literature. |
2.2.2. Visualization/Design Principles
2.3. Automated Analysis in Research
- Data ownership [56,57]: Who gets to own proprietary data? The “thorny issue of data ownership” [58] is more emphasized when the automated analysis is outsourced to another entity, often (though not always) through the usage of a commercially licensed API. This dimension focuses on the tension between commercial AI service providers wanting to use input data for model training and users seeking to maintain confidentiality rights.
3. Proposed System
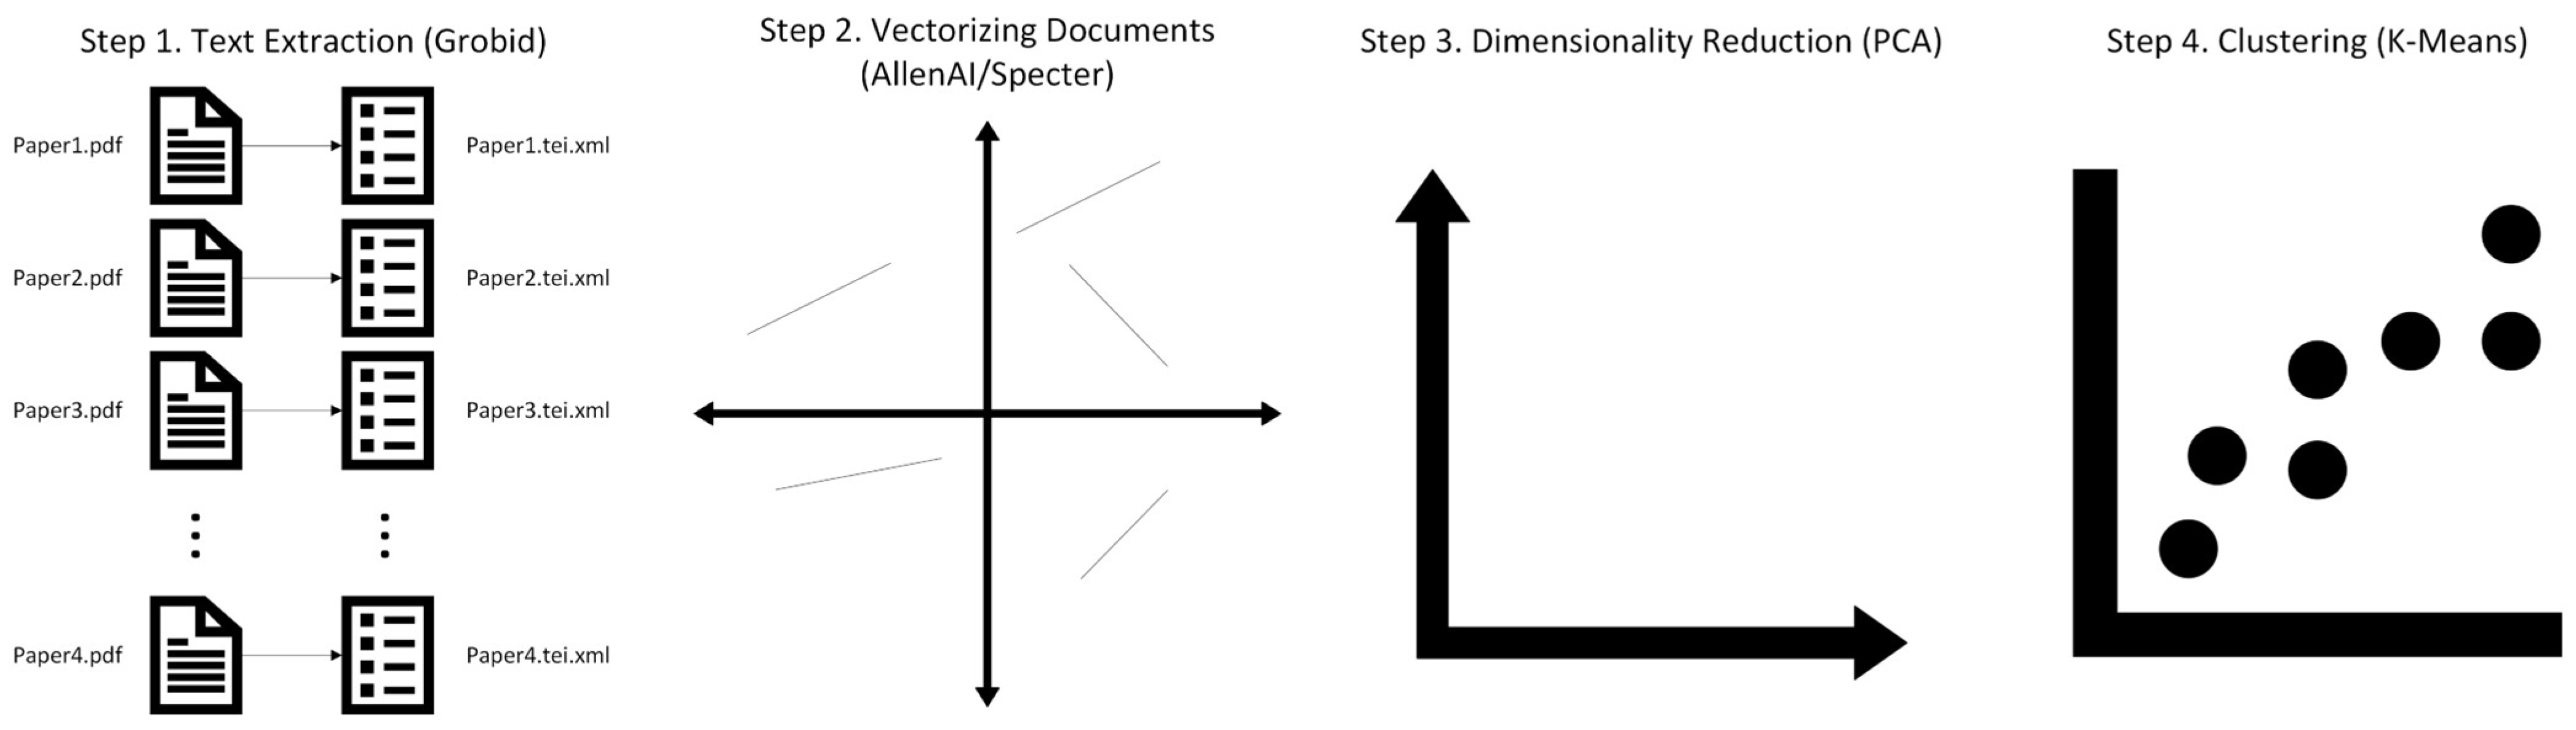
3.1. Document Processing Pipeline (DPP)
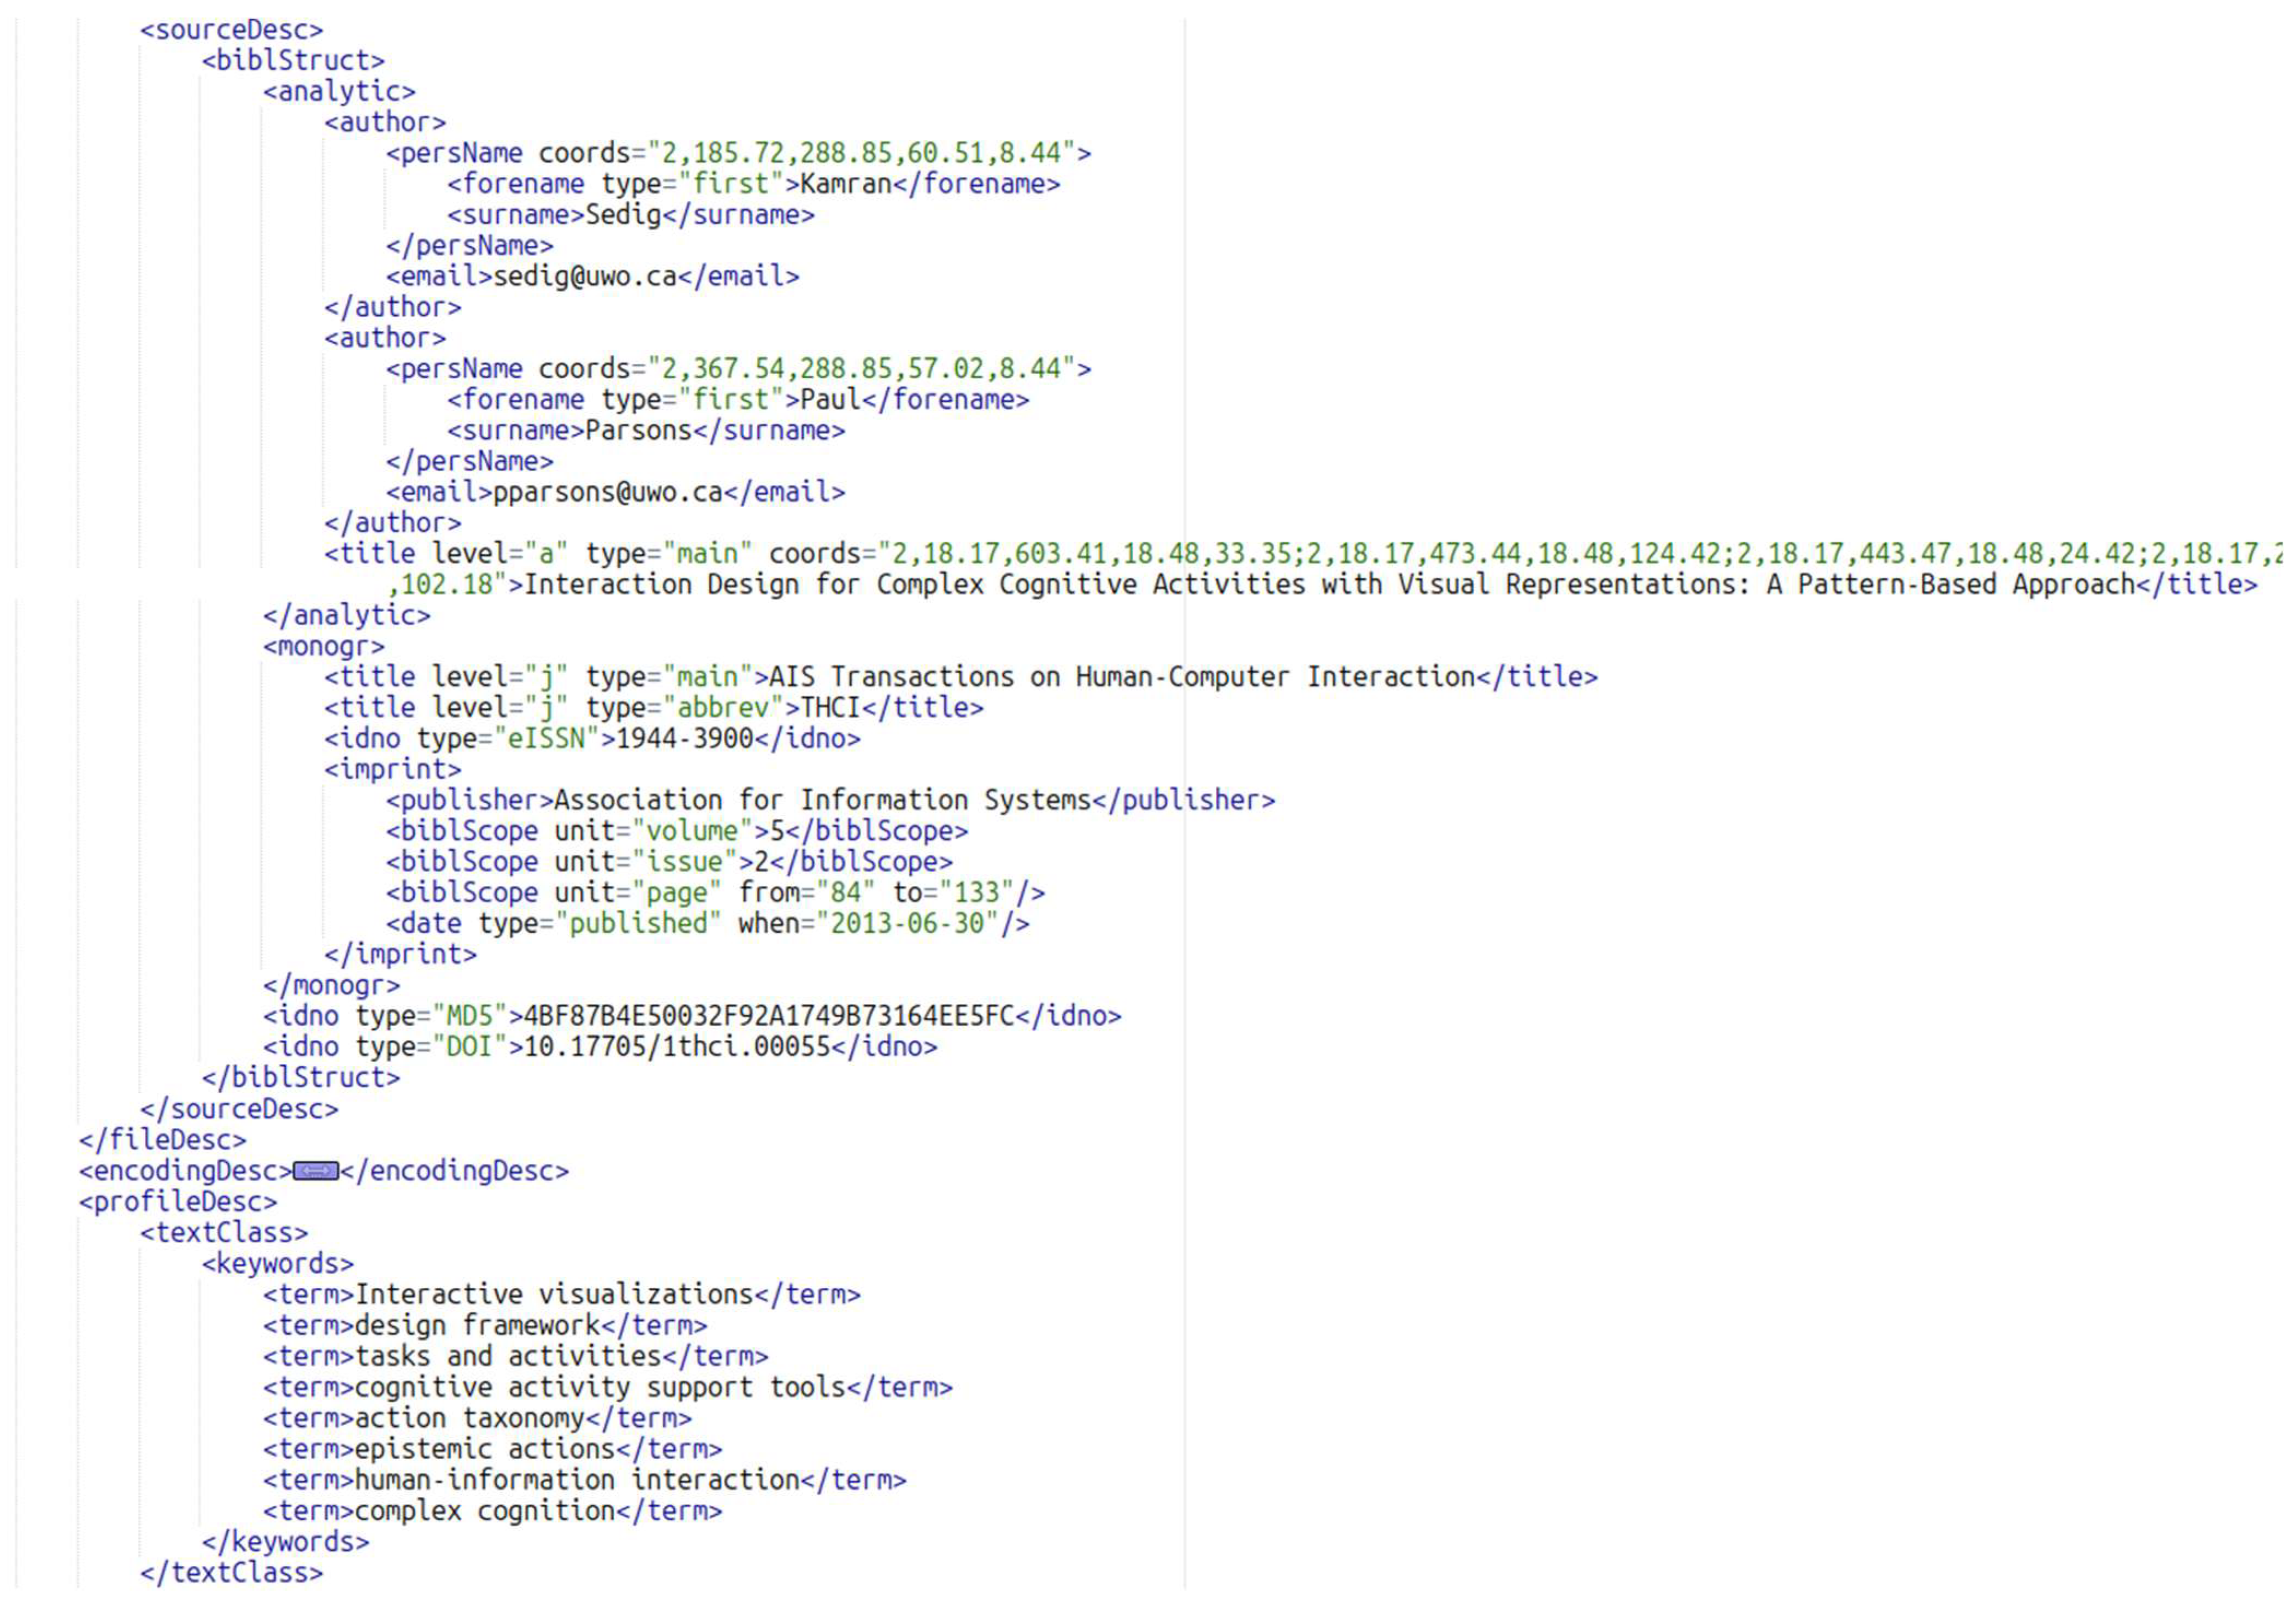
3.1.1. Extracting Text
3.1.2. Vectorizing Documents
3.1.3. Reducing Dimensionality
3.1.4. Clustering Documents
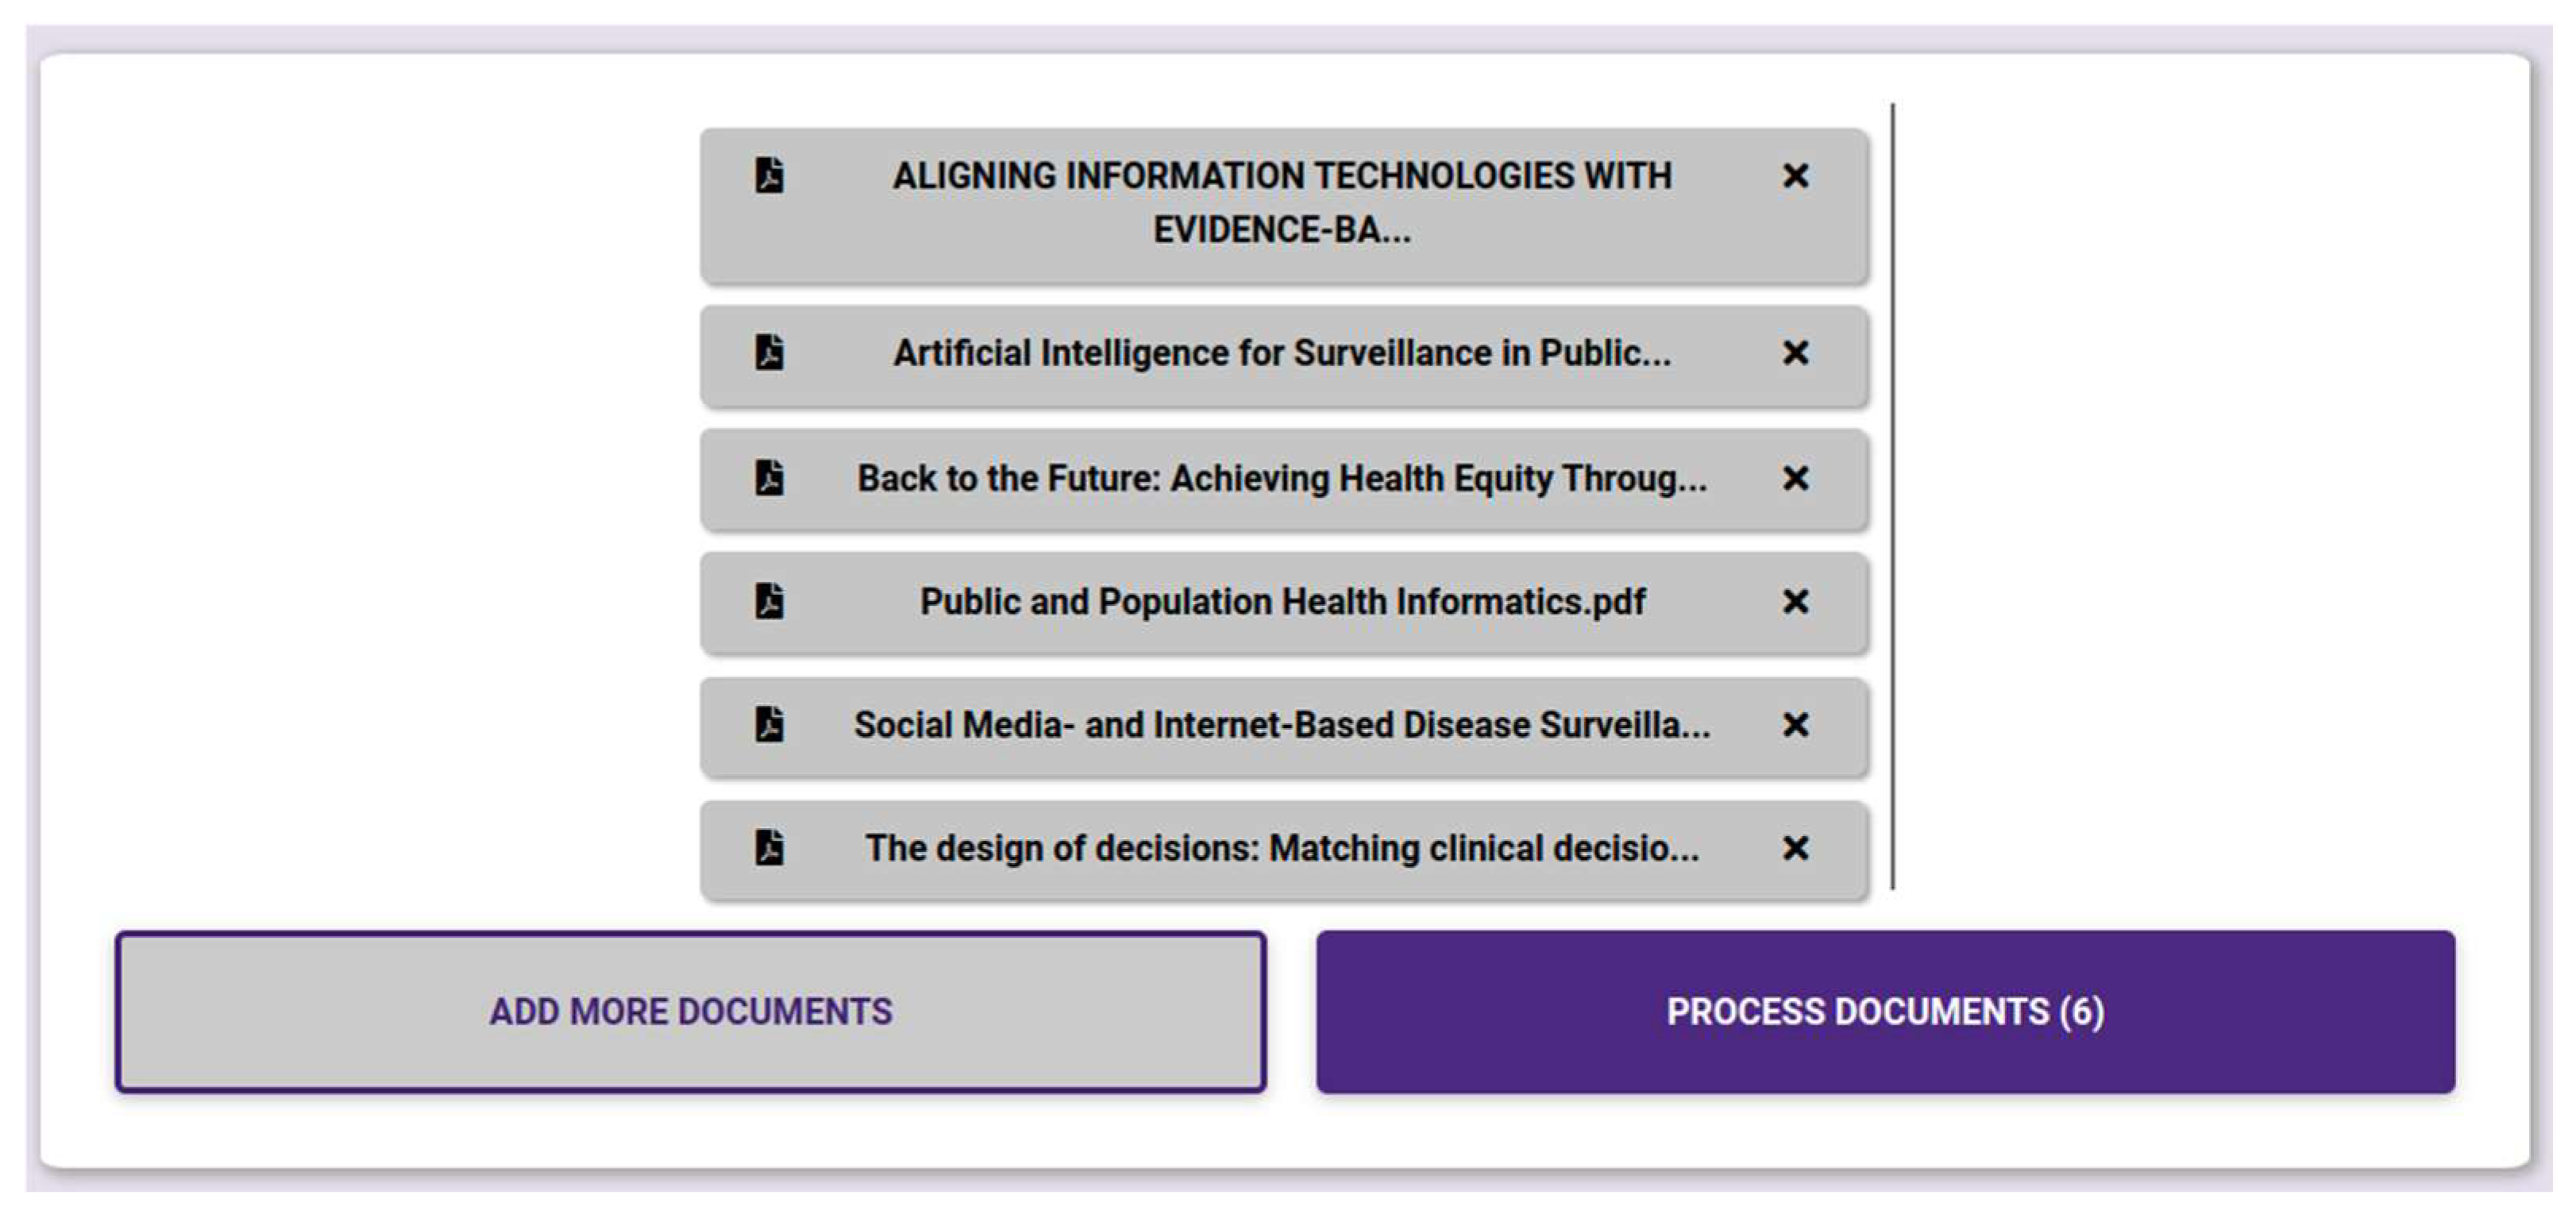
3.2. User Interface
3.3. The Six Modules of VICTORIOUS
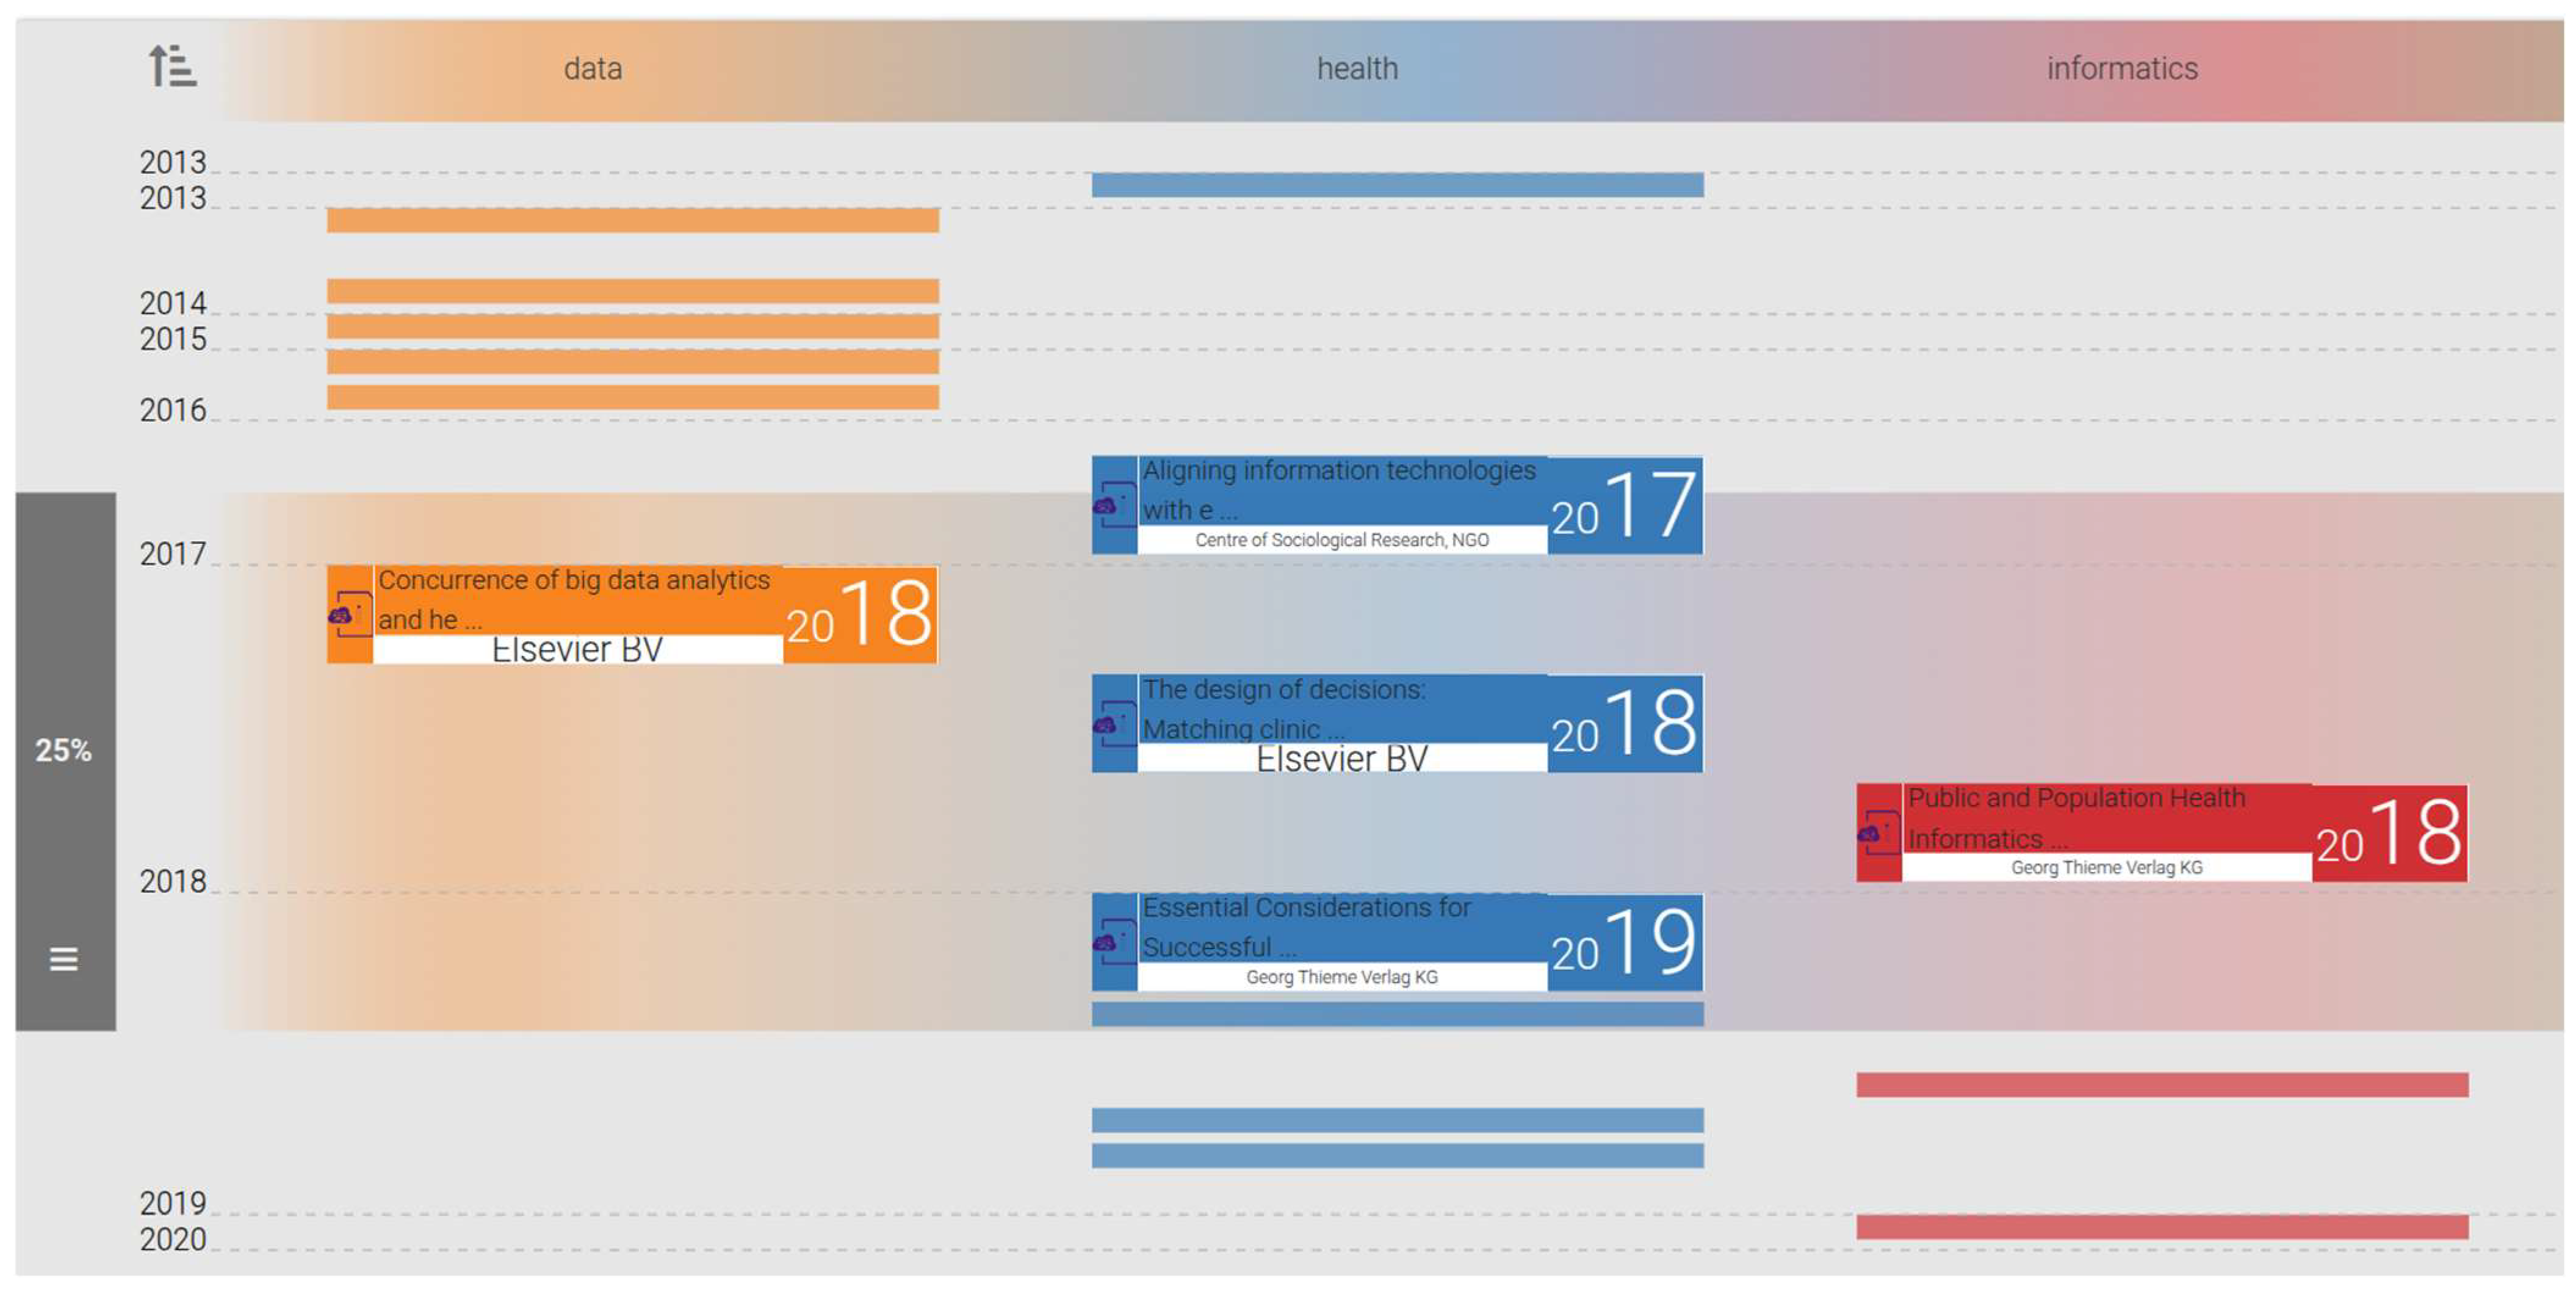
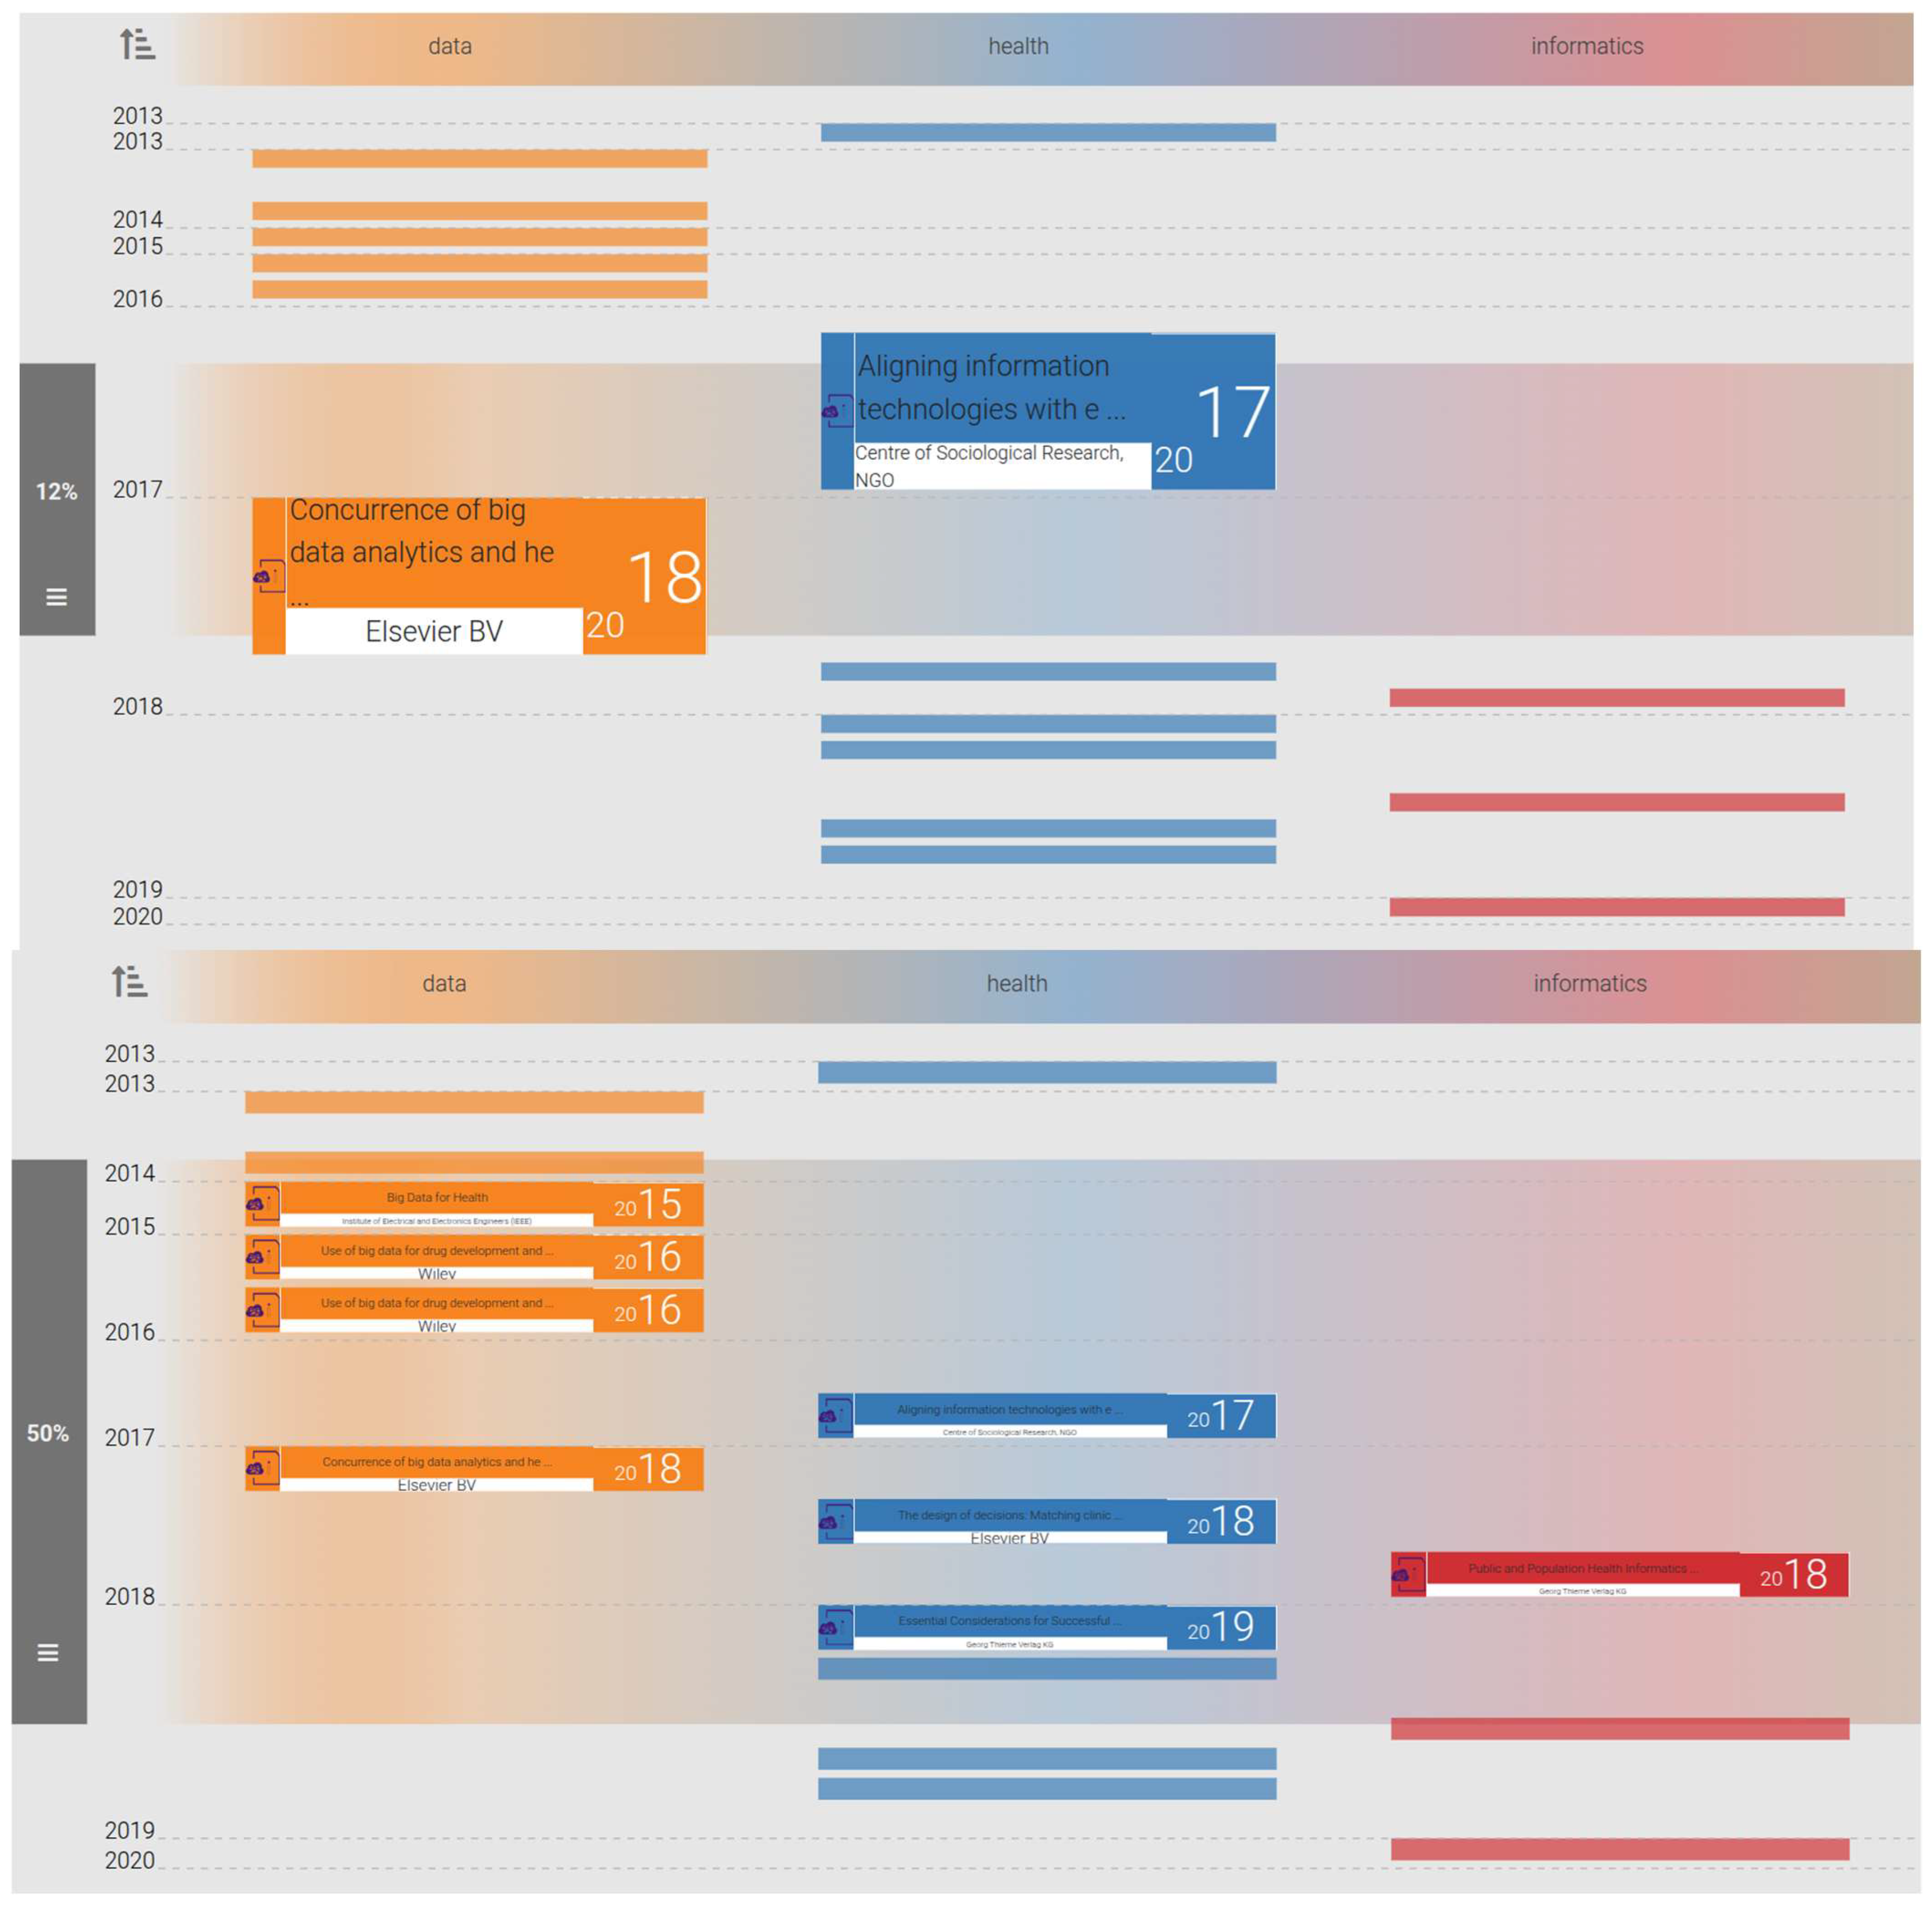
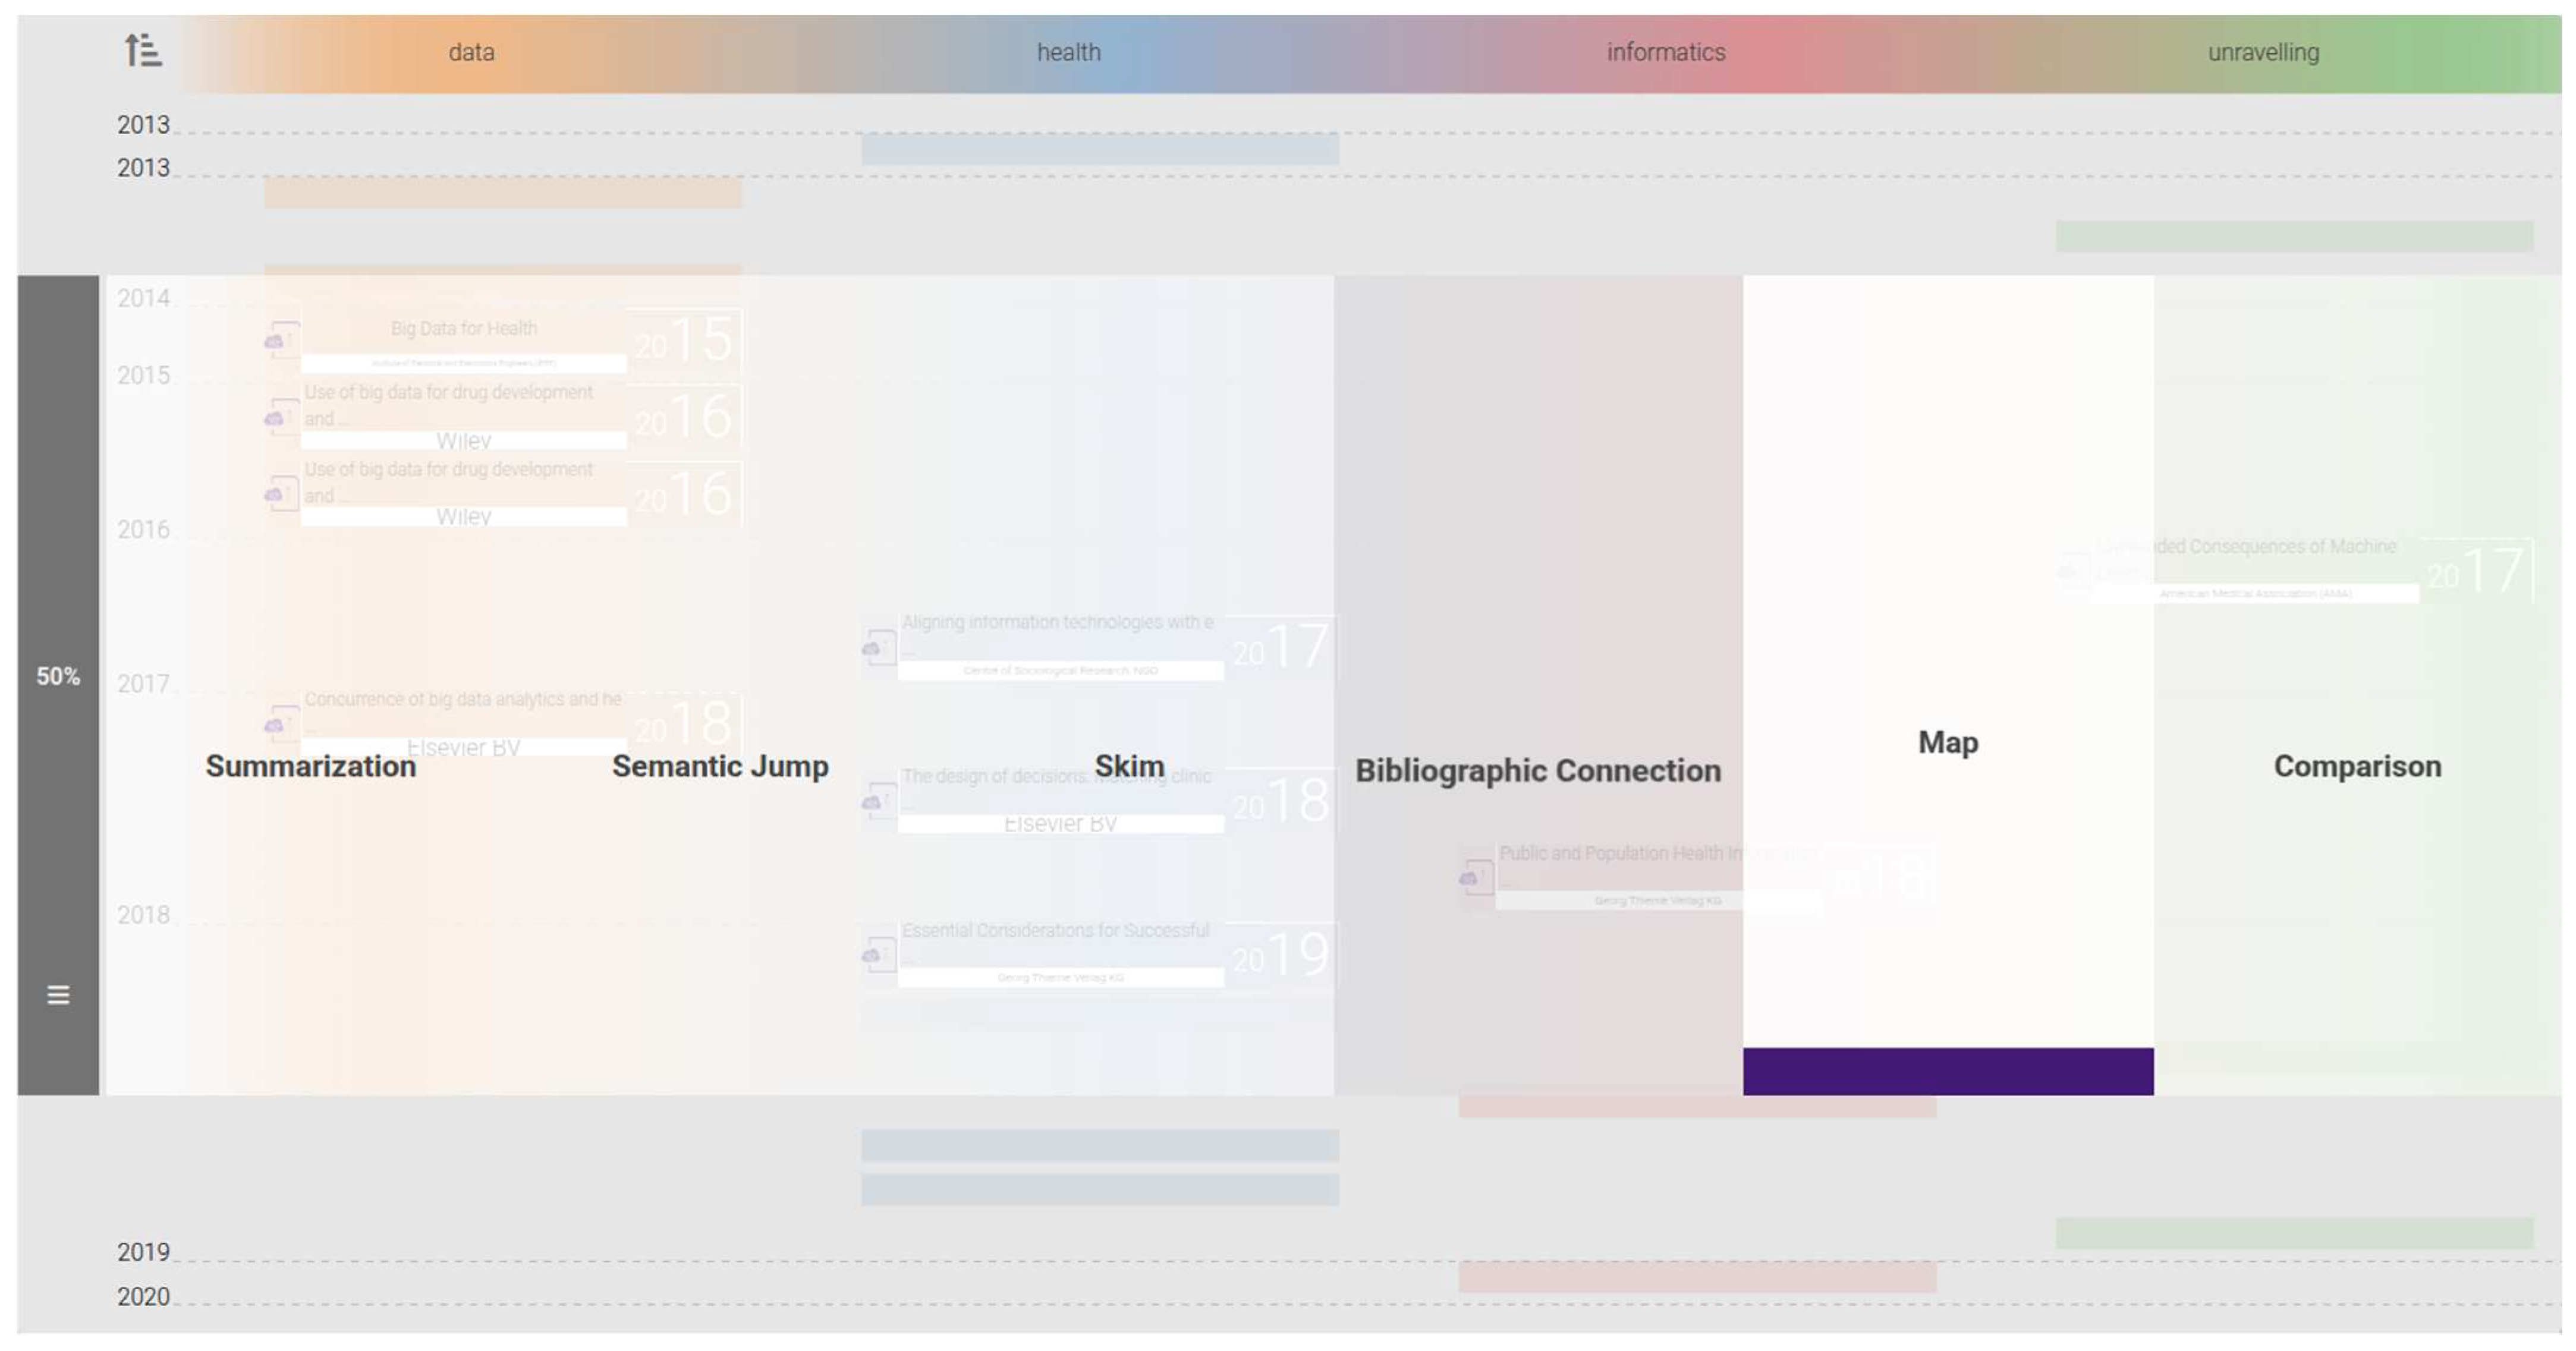
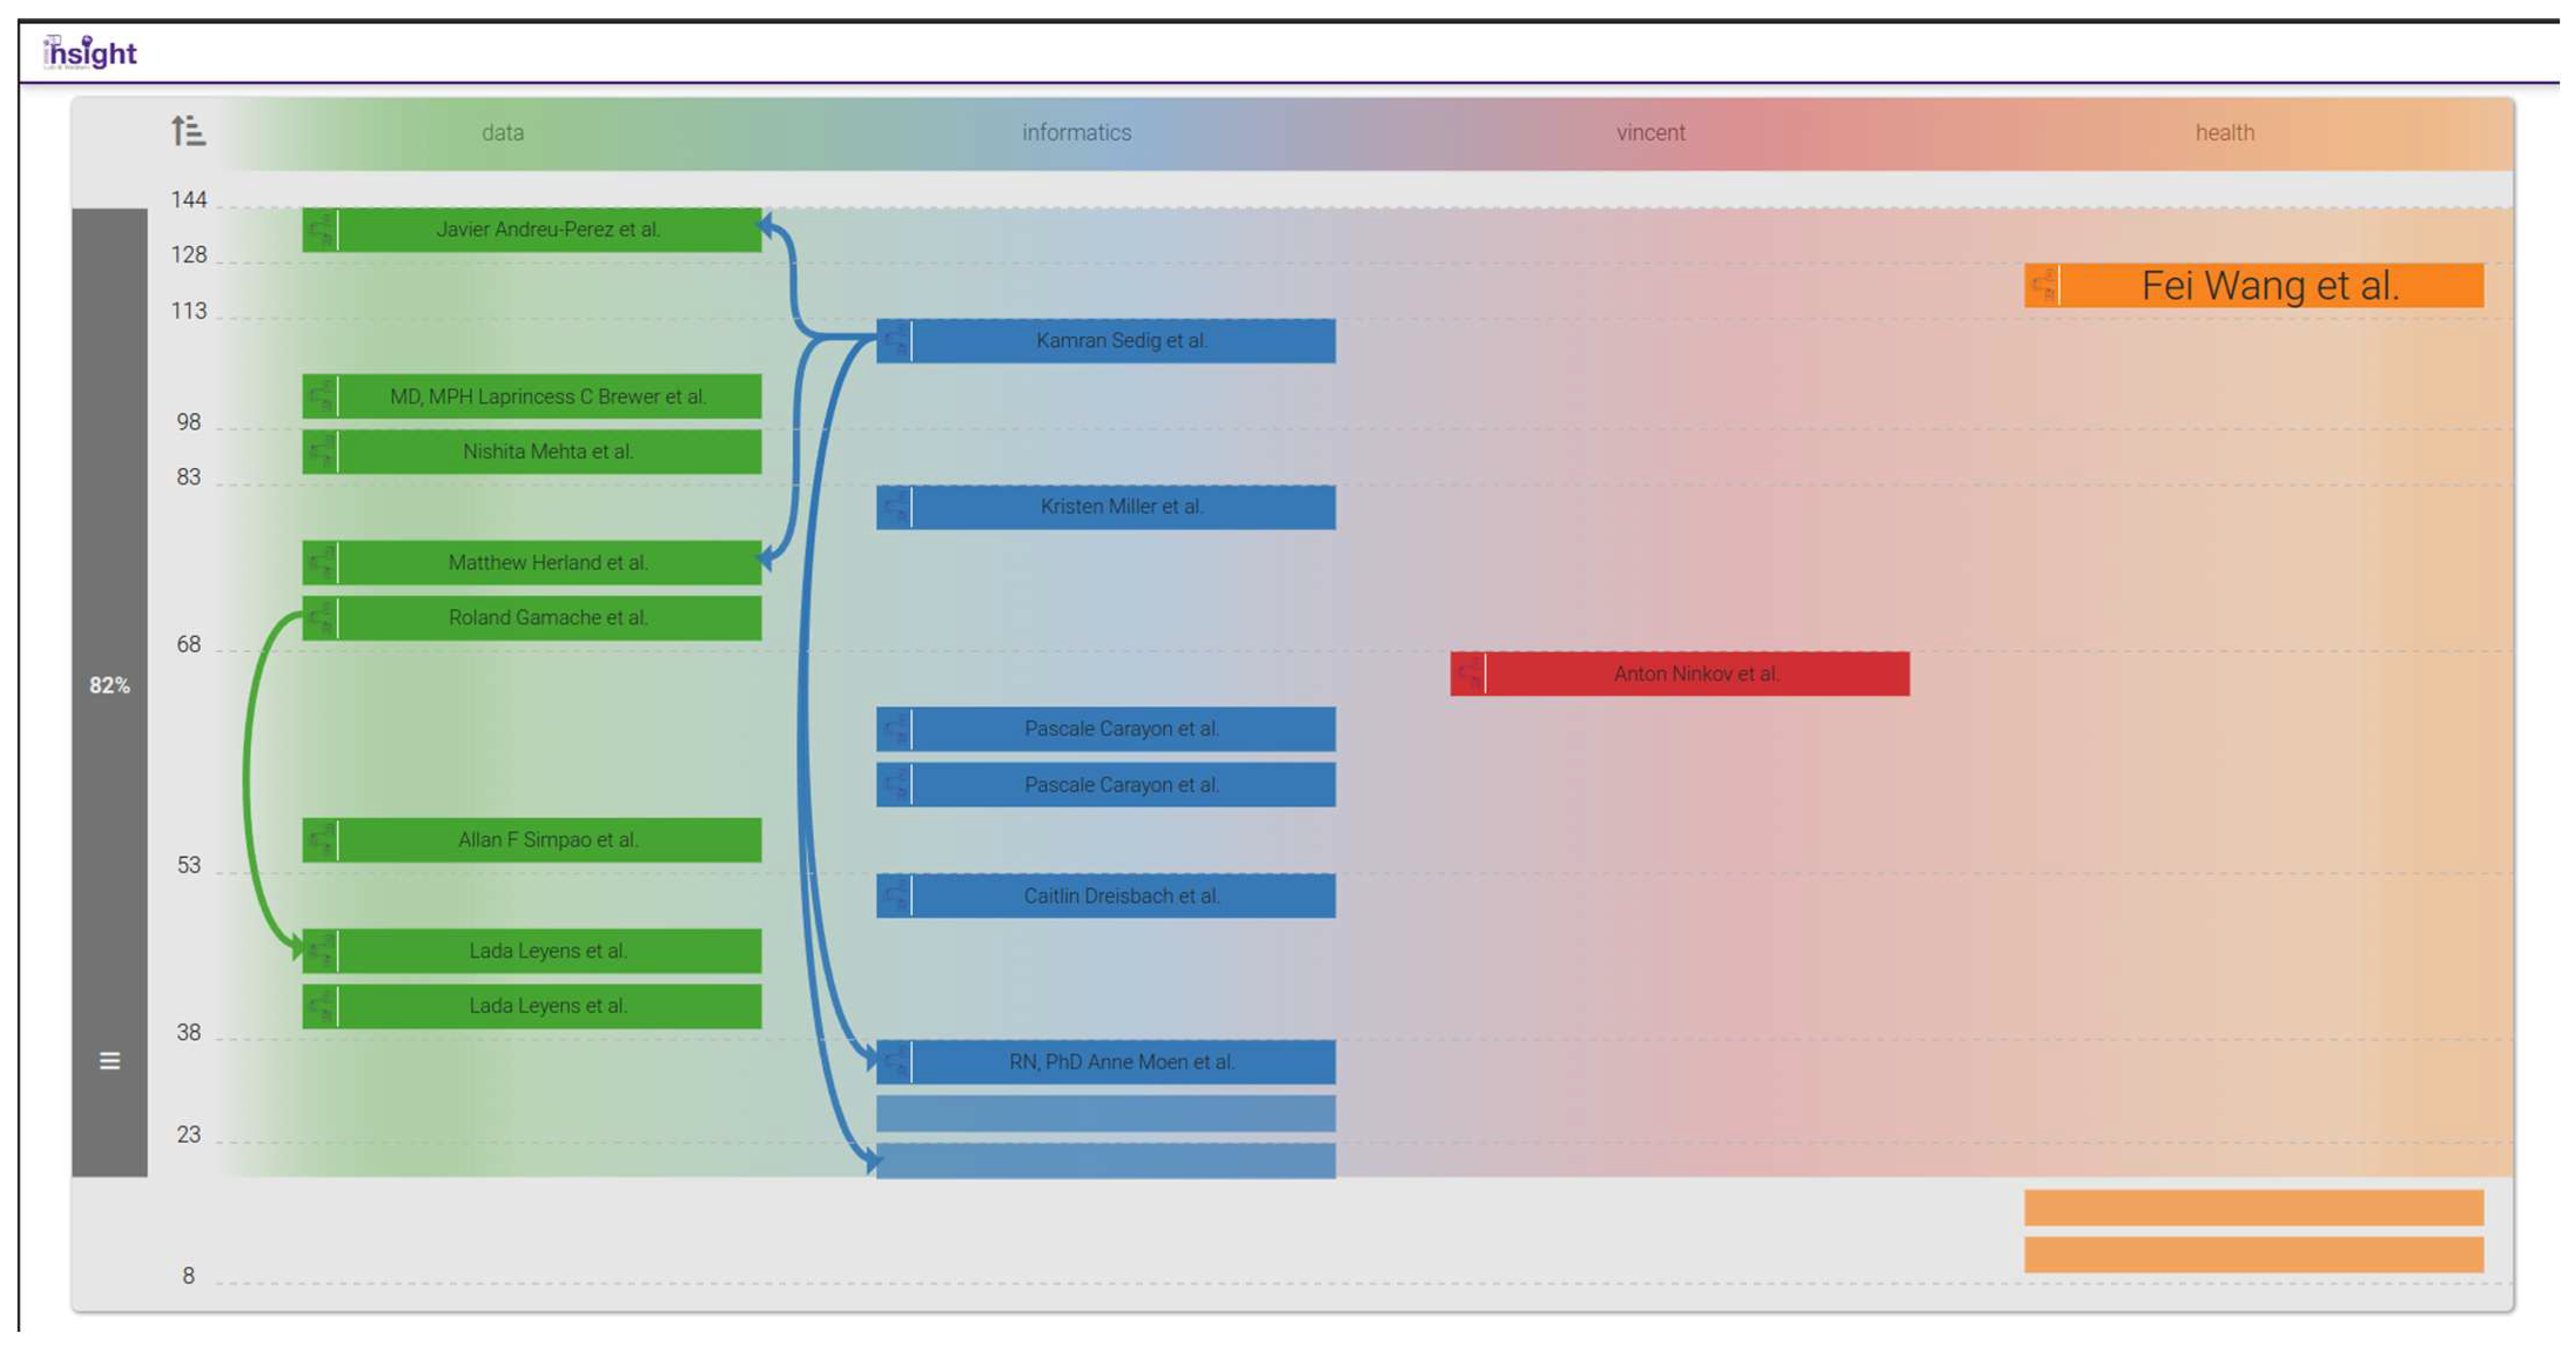
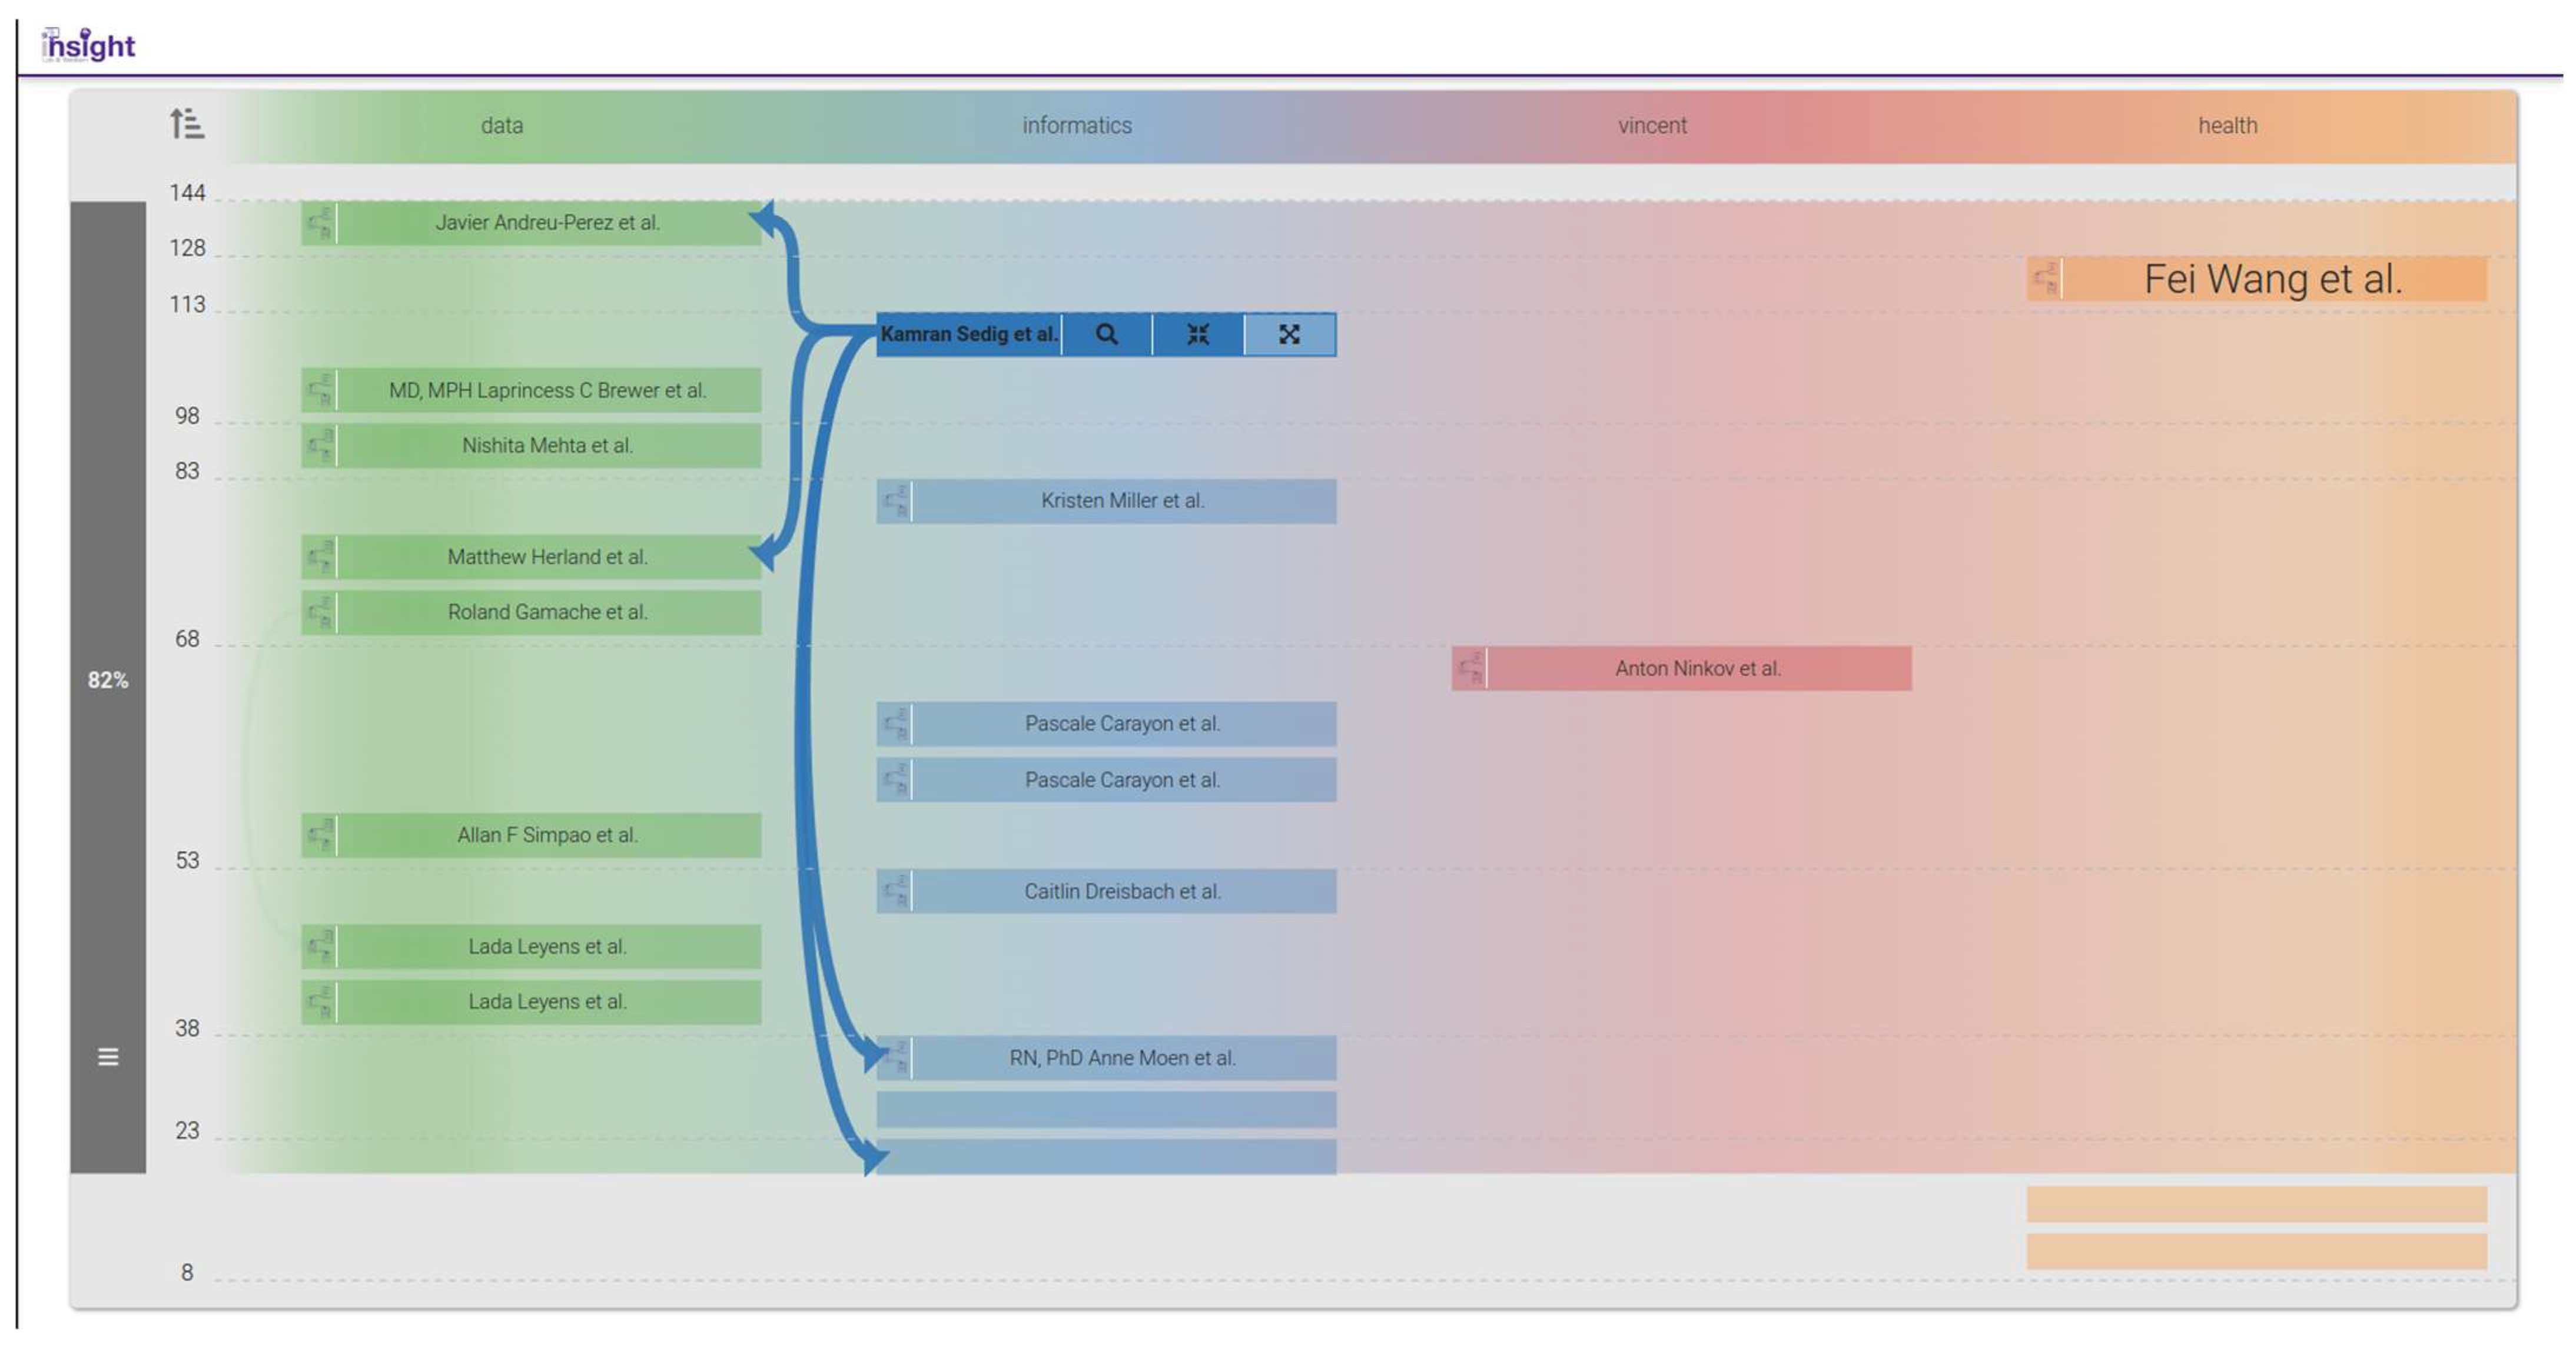
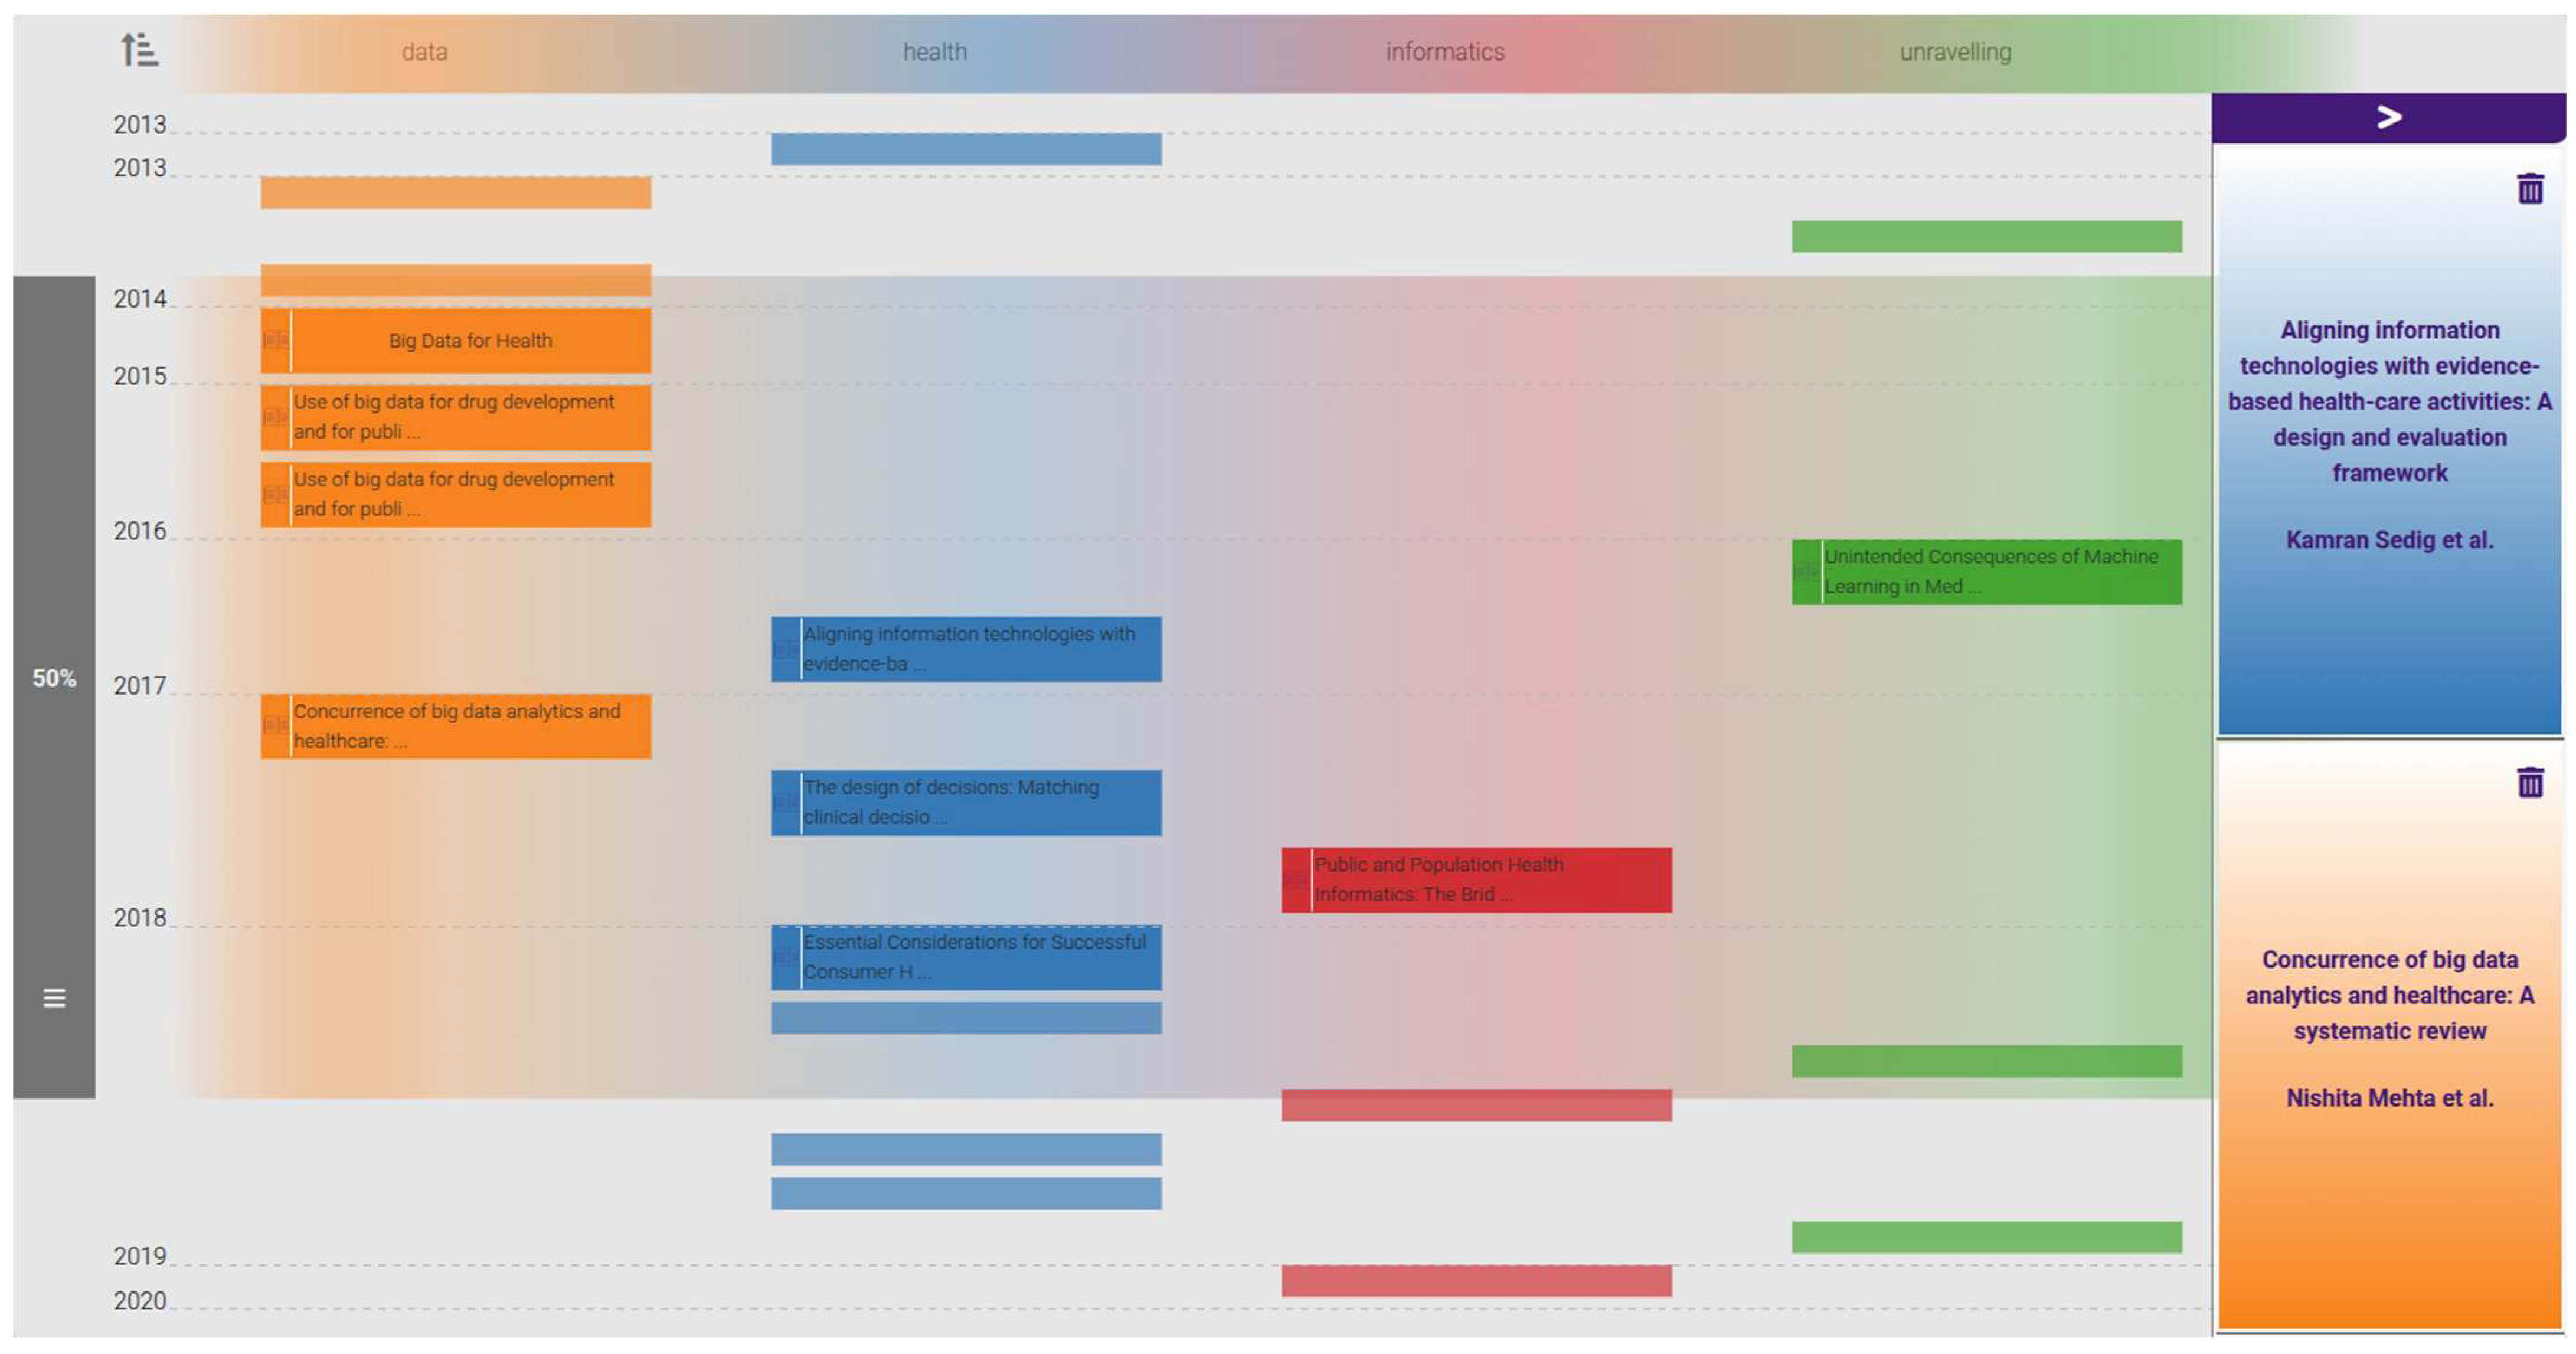
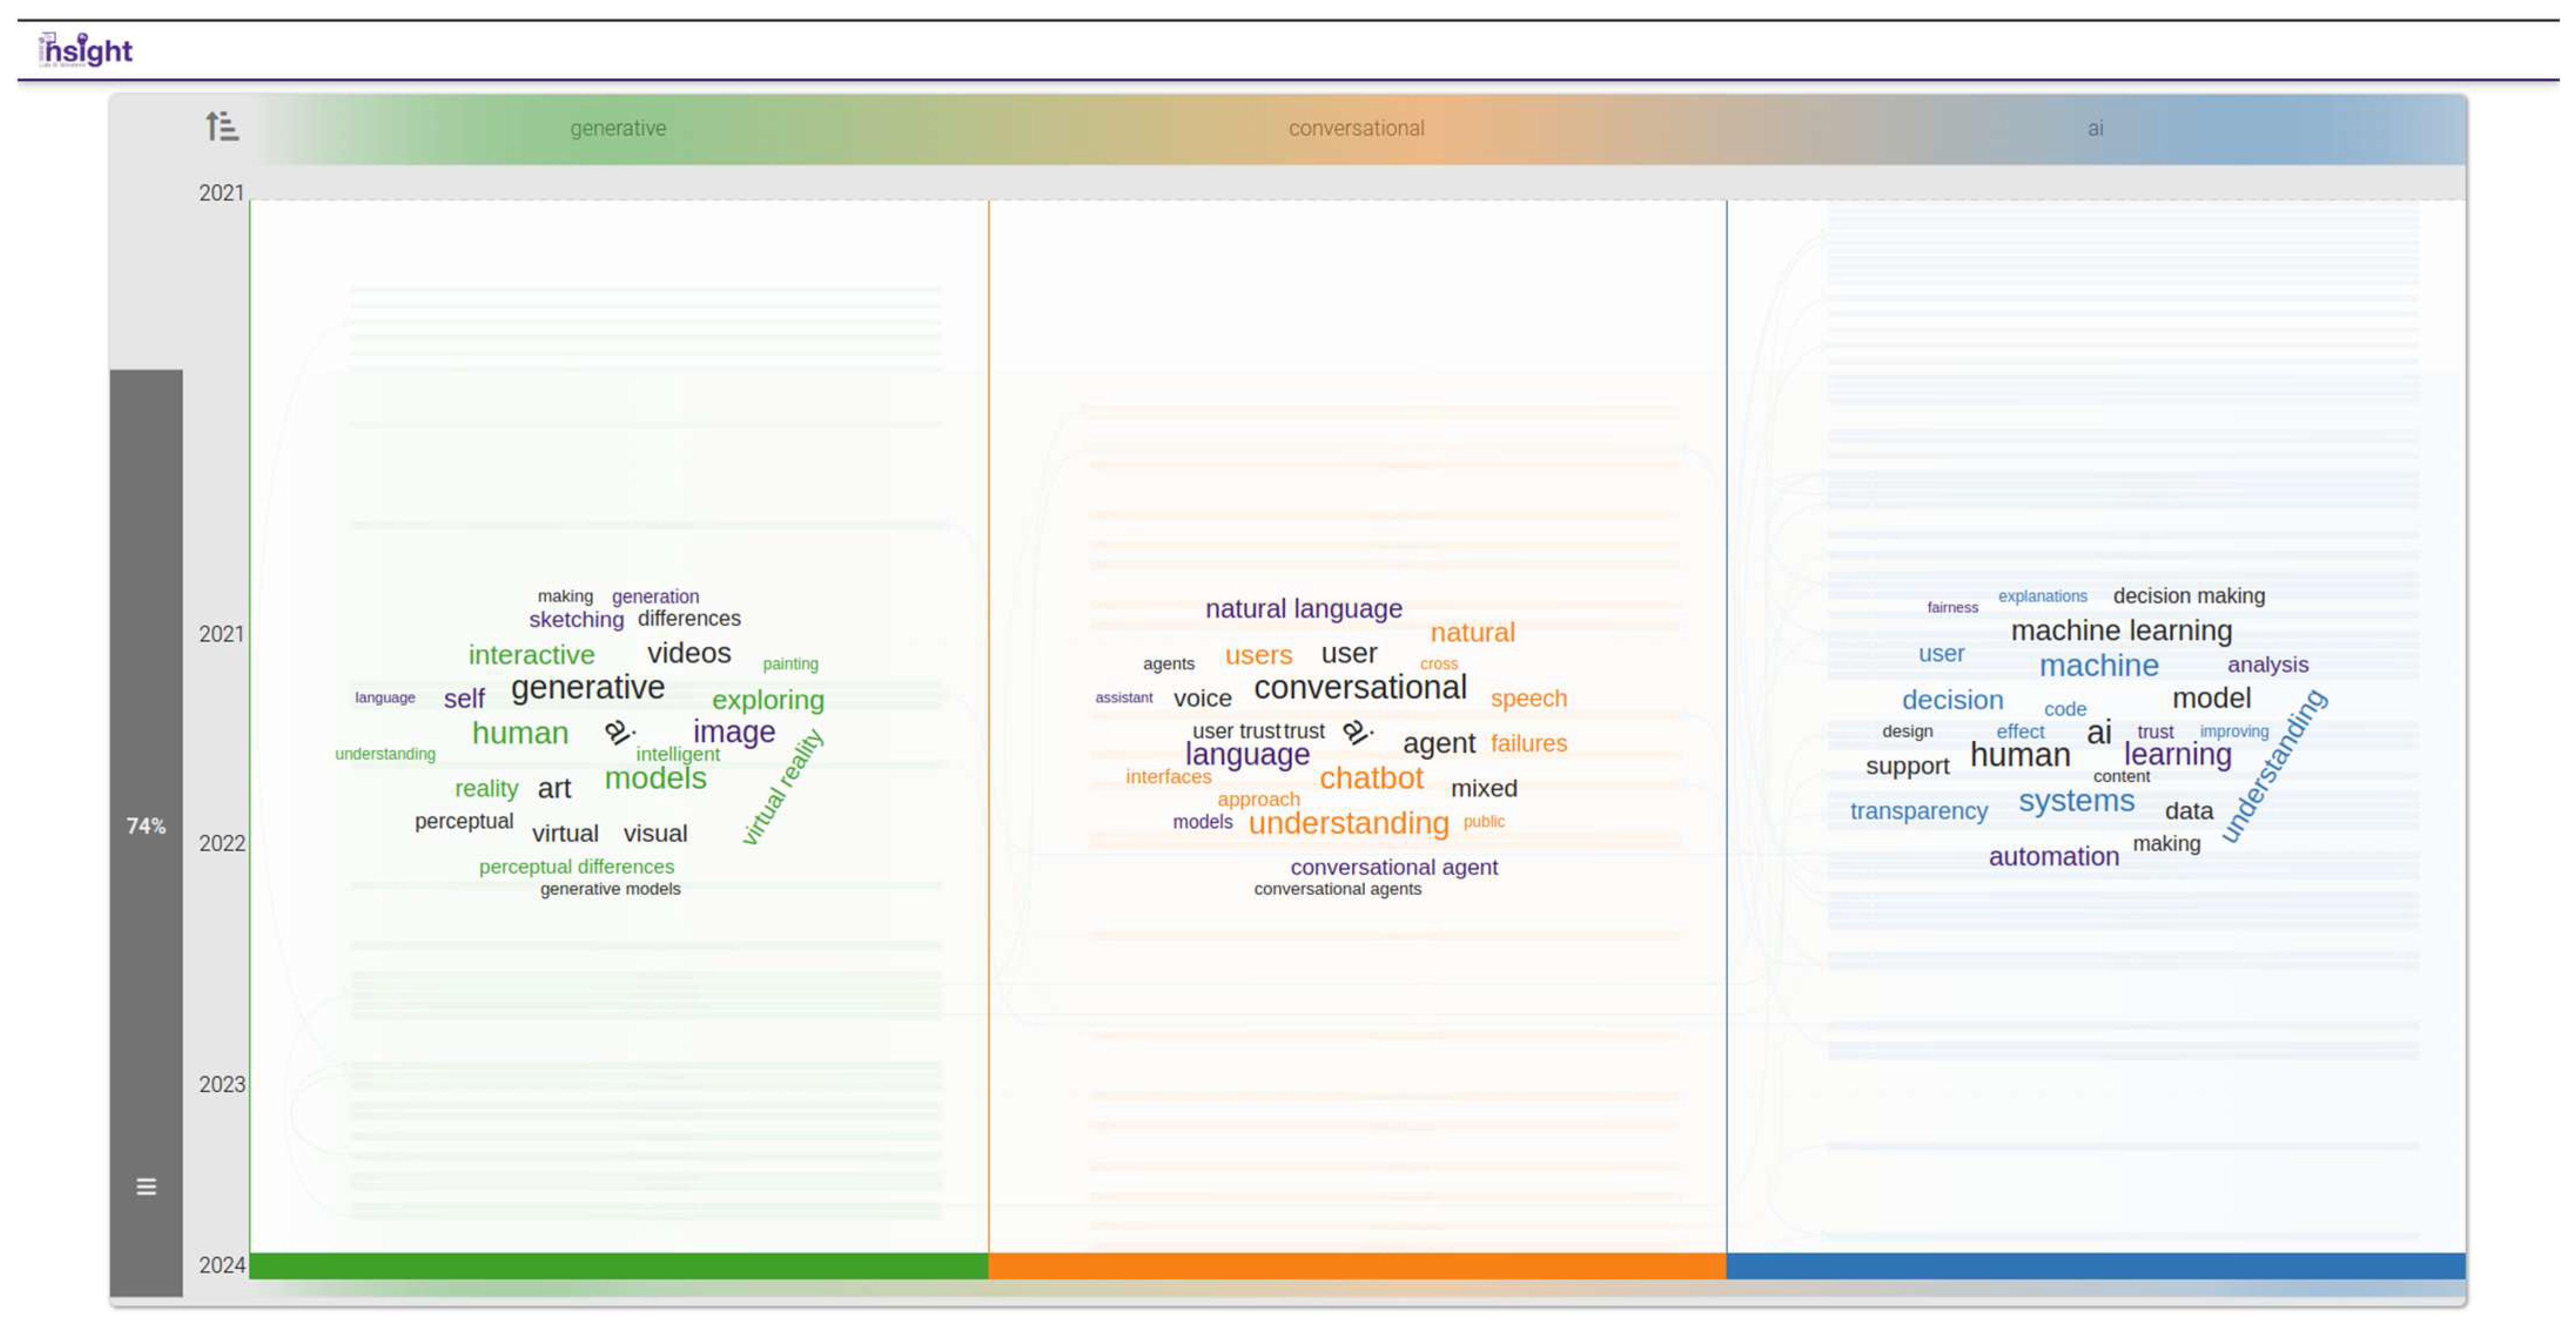
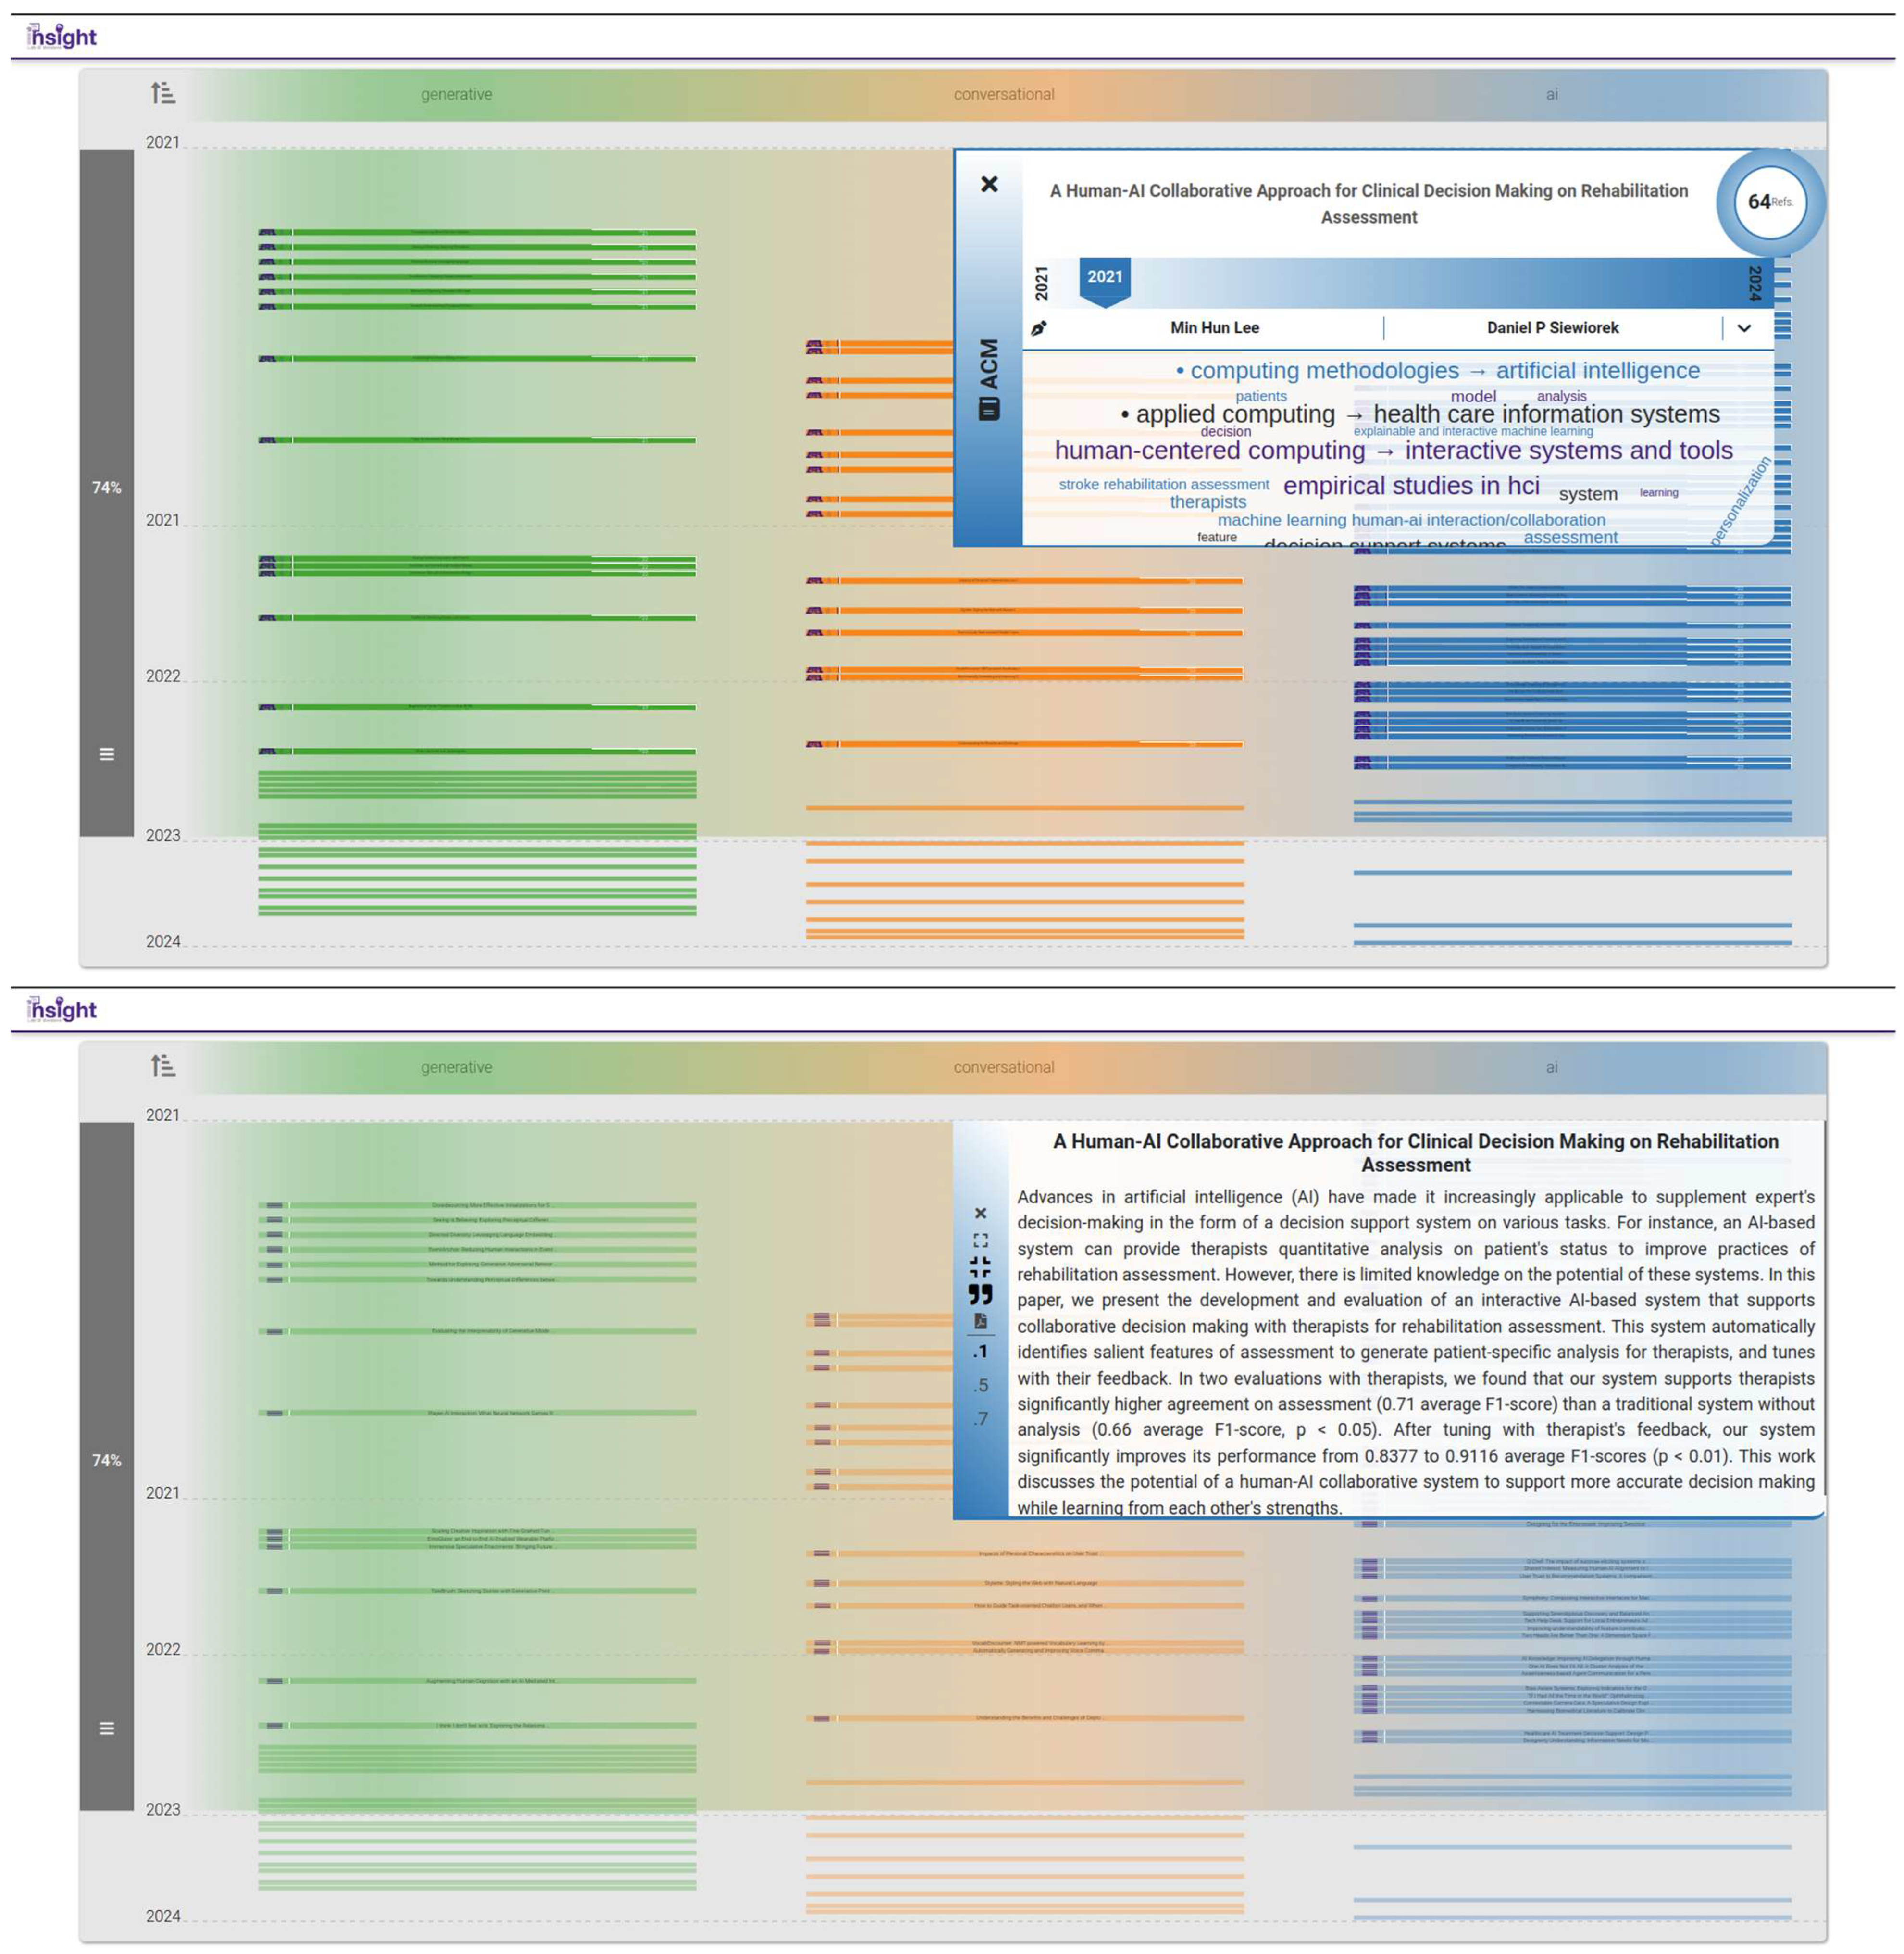
3.3.1. Map
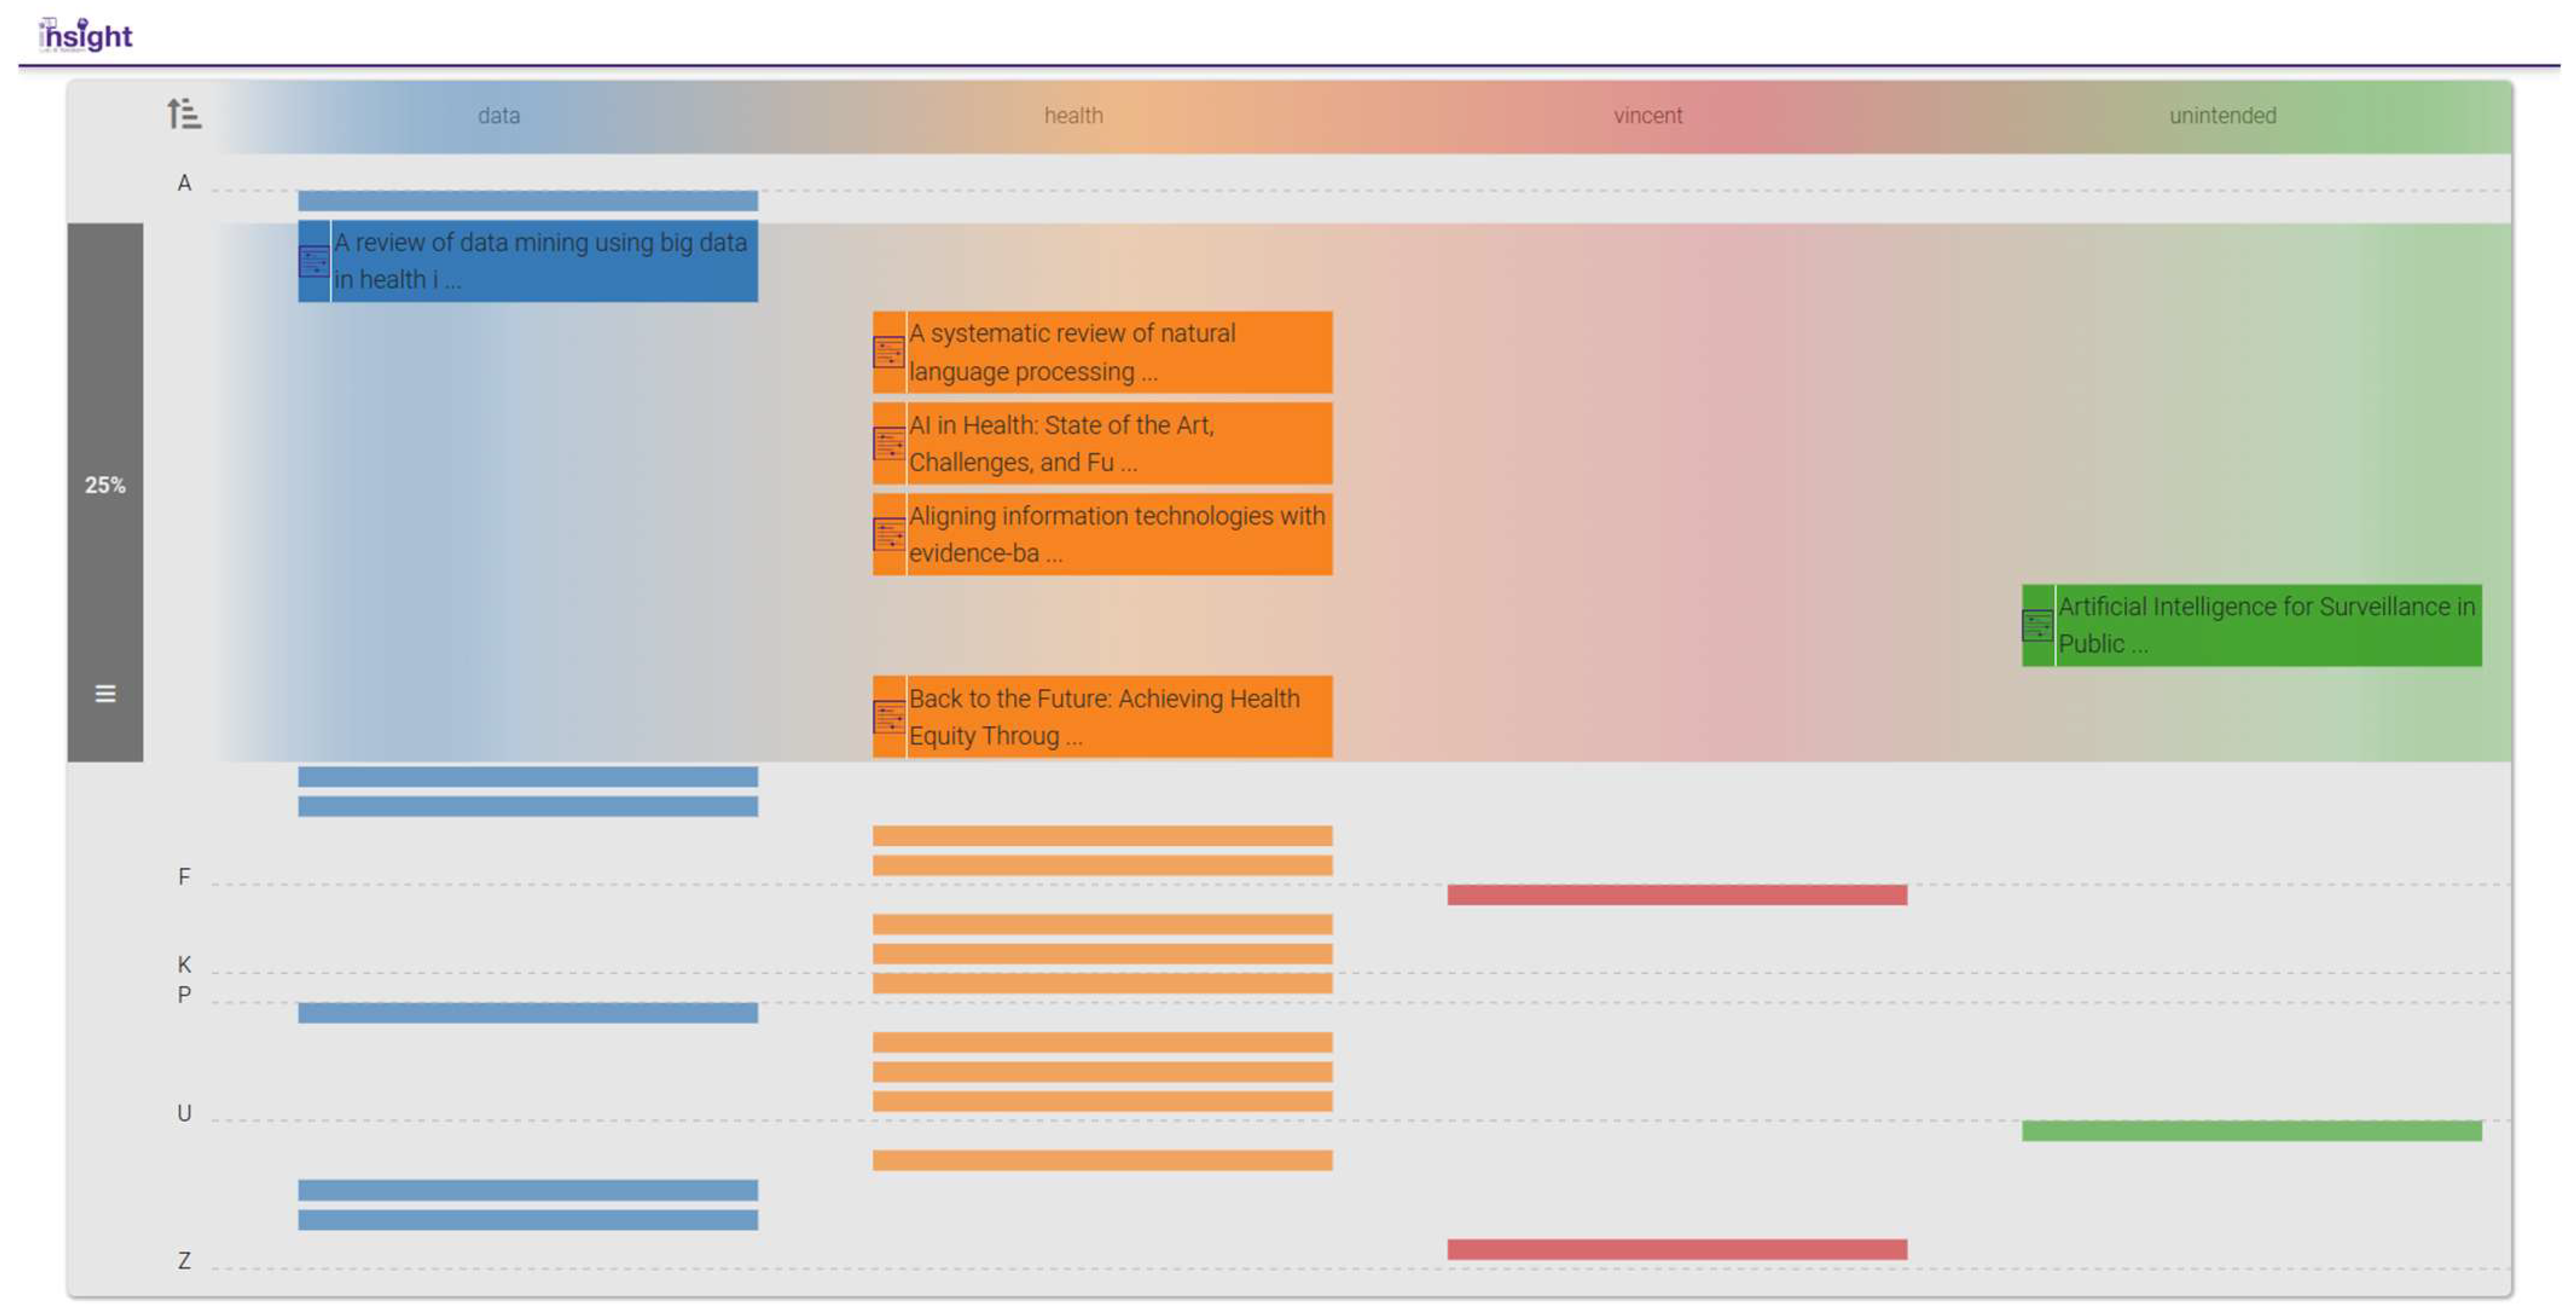
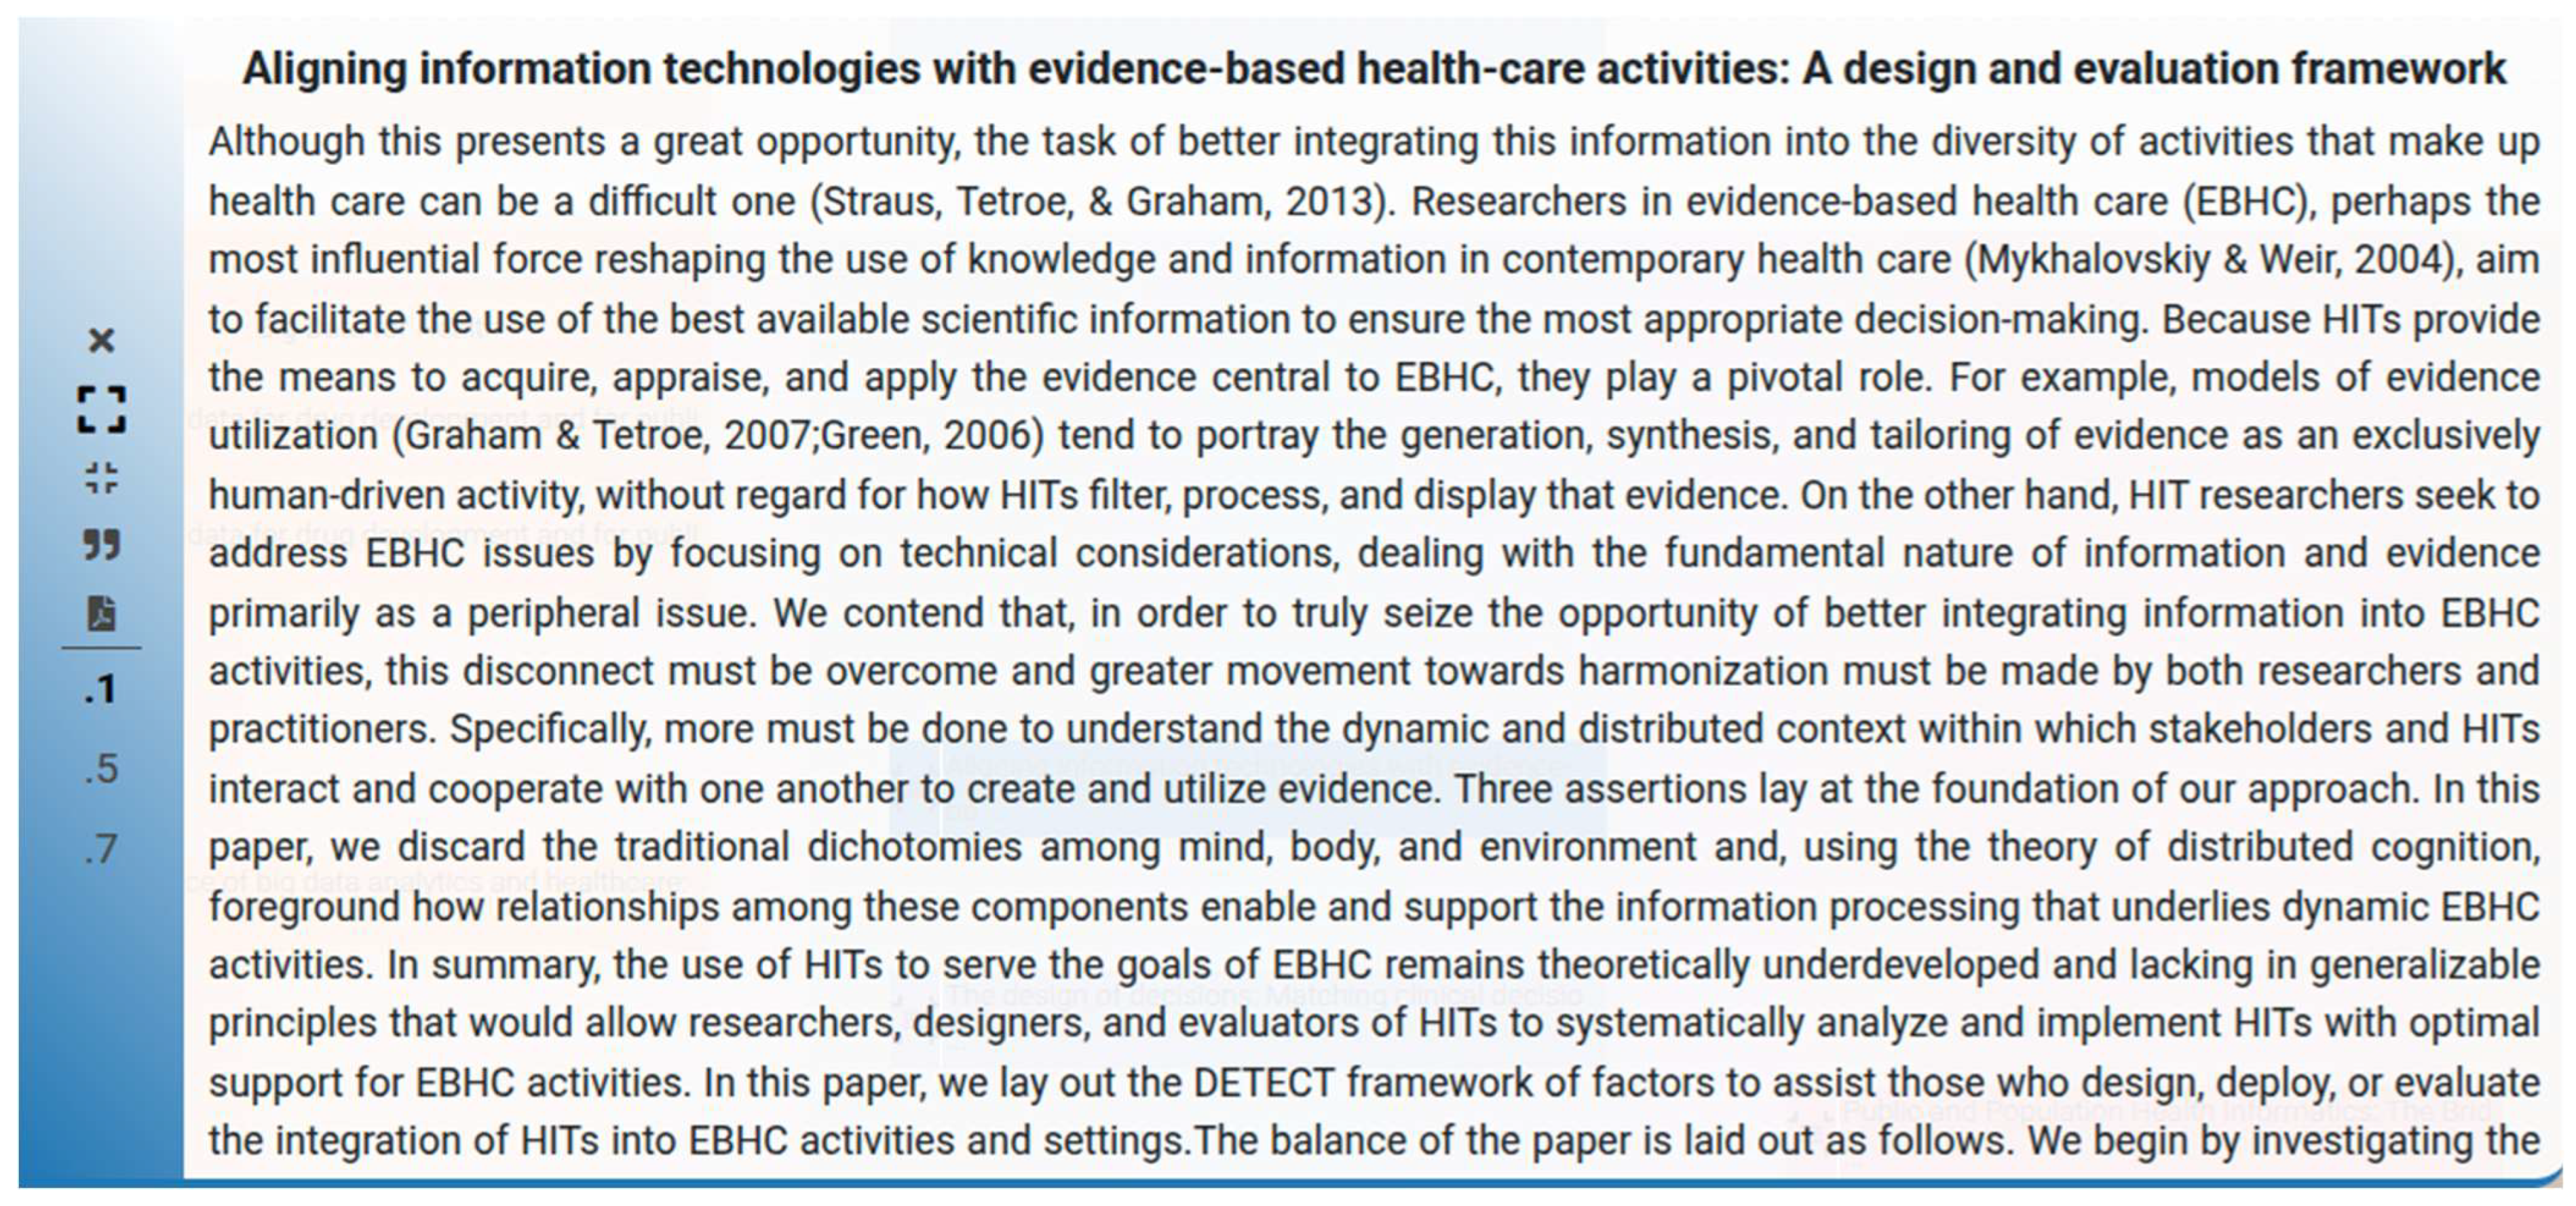
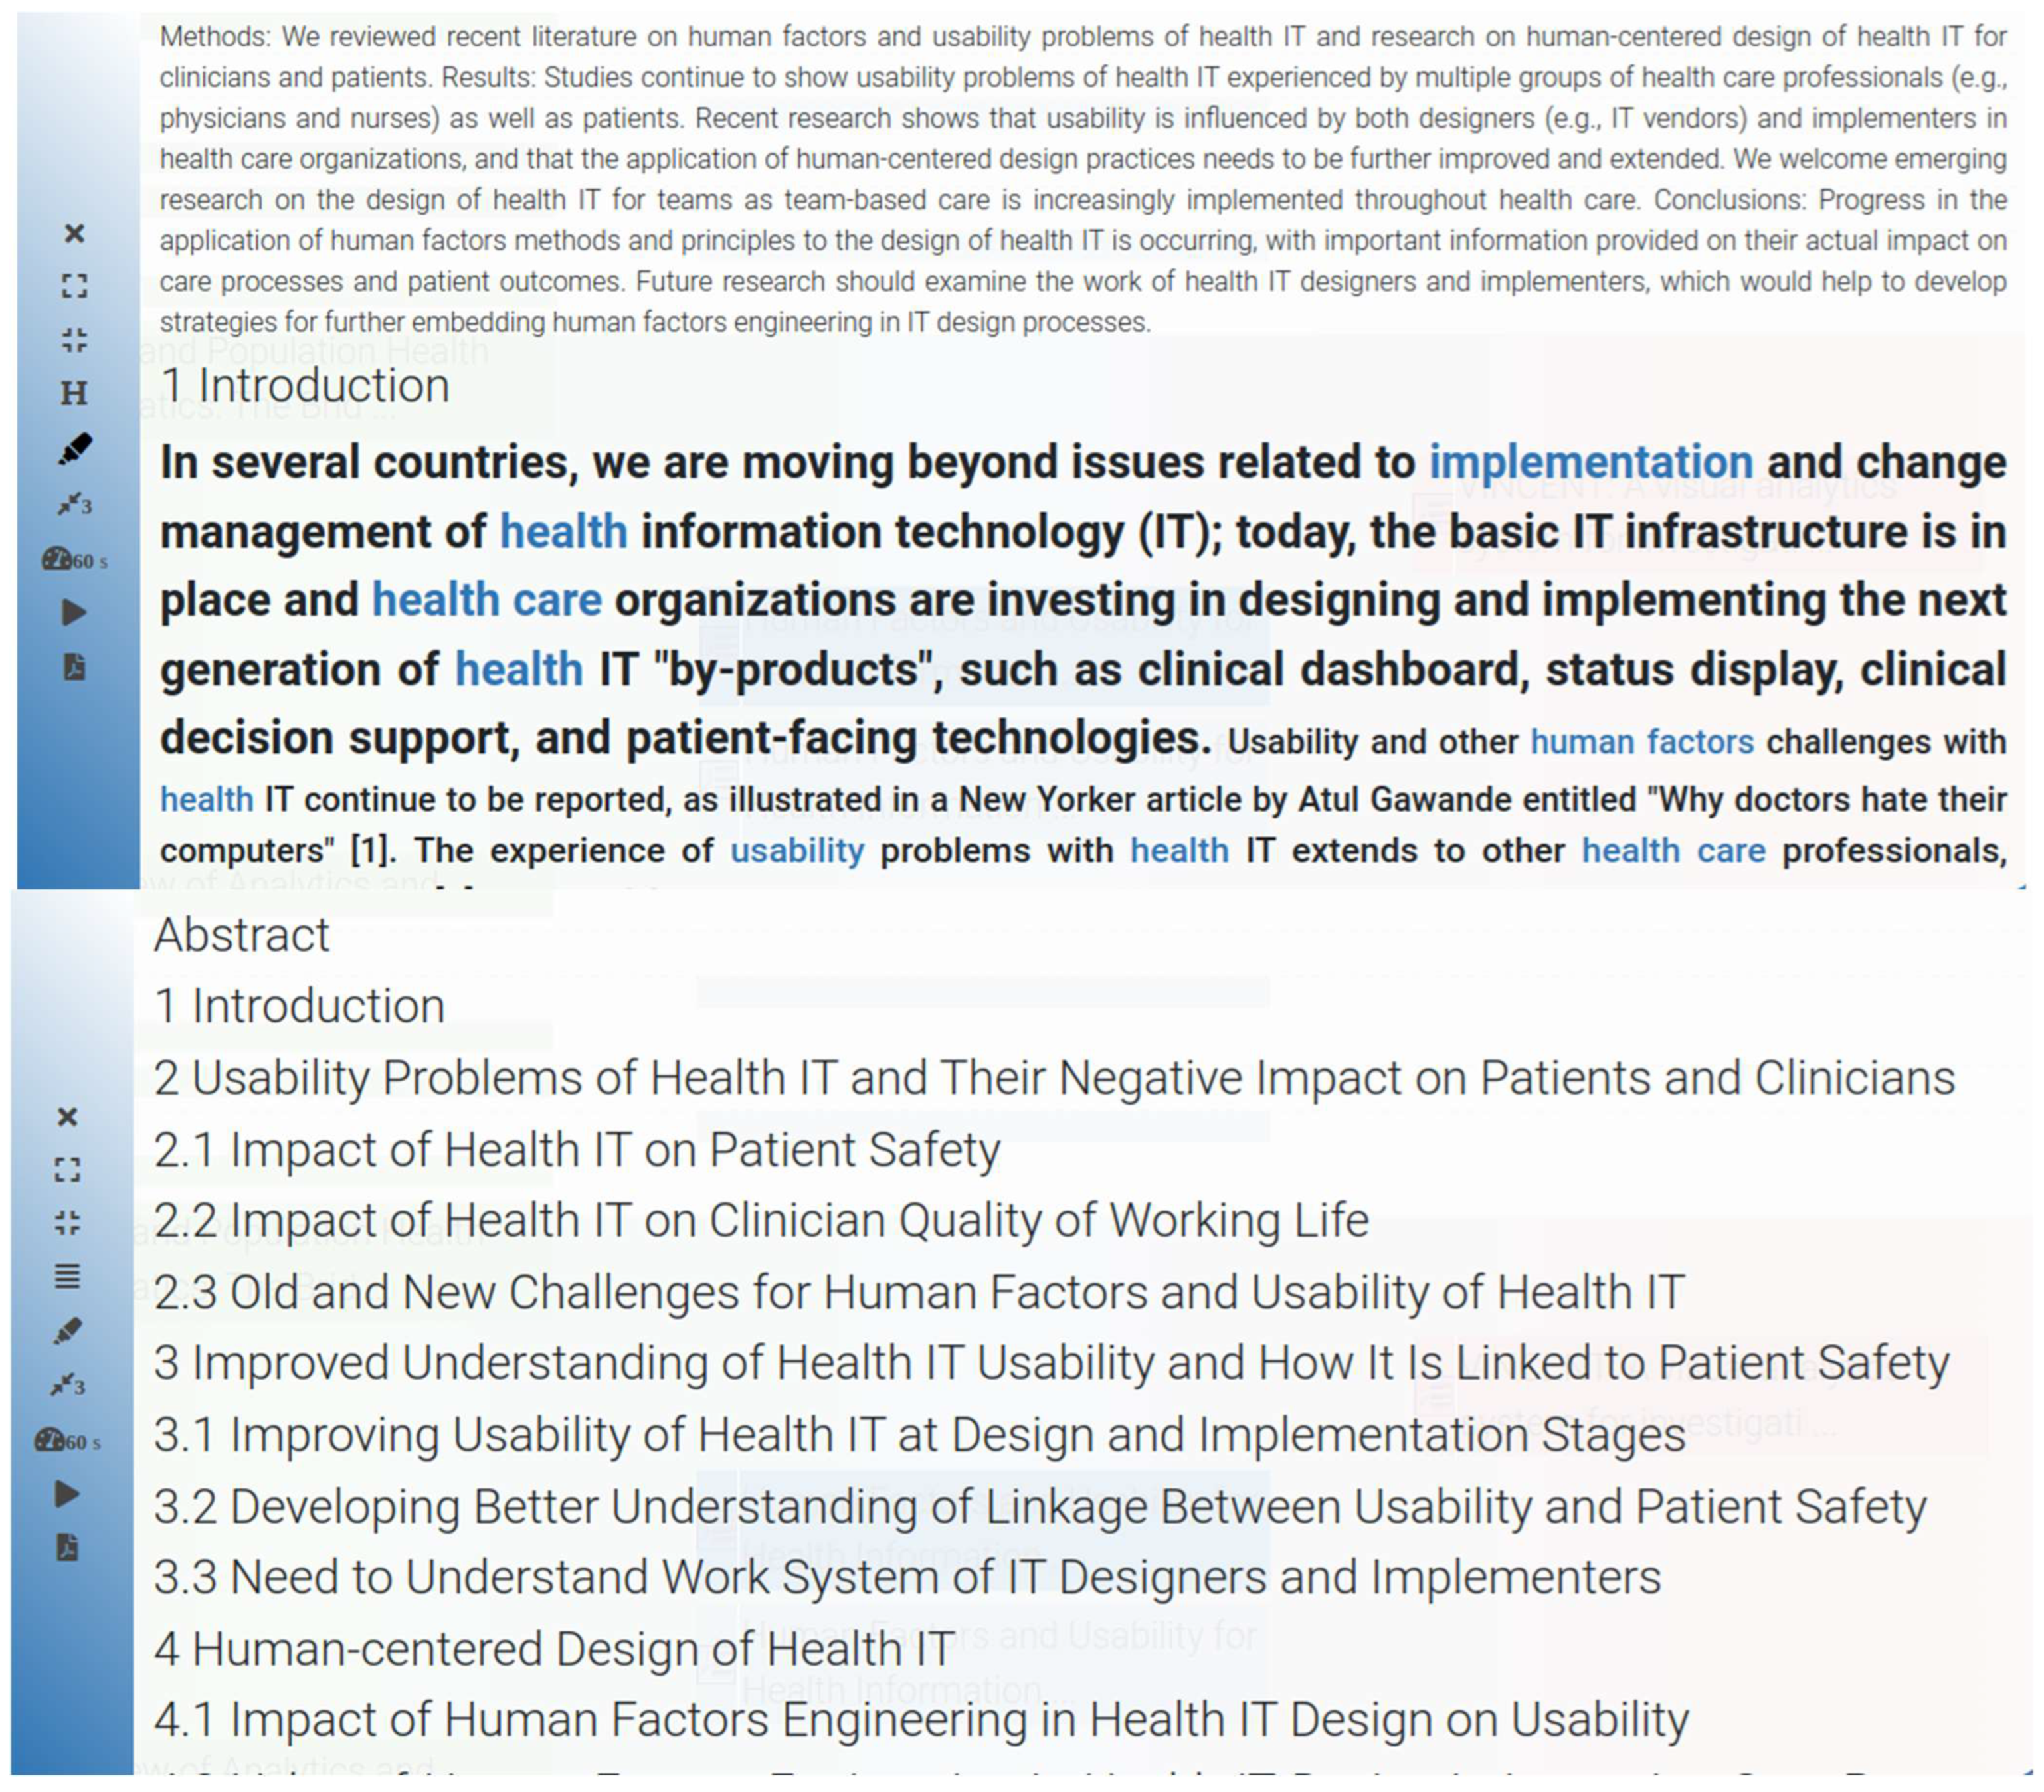
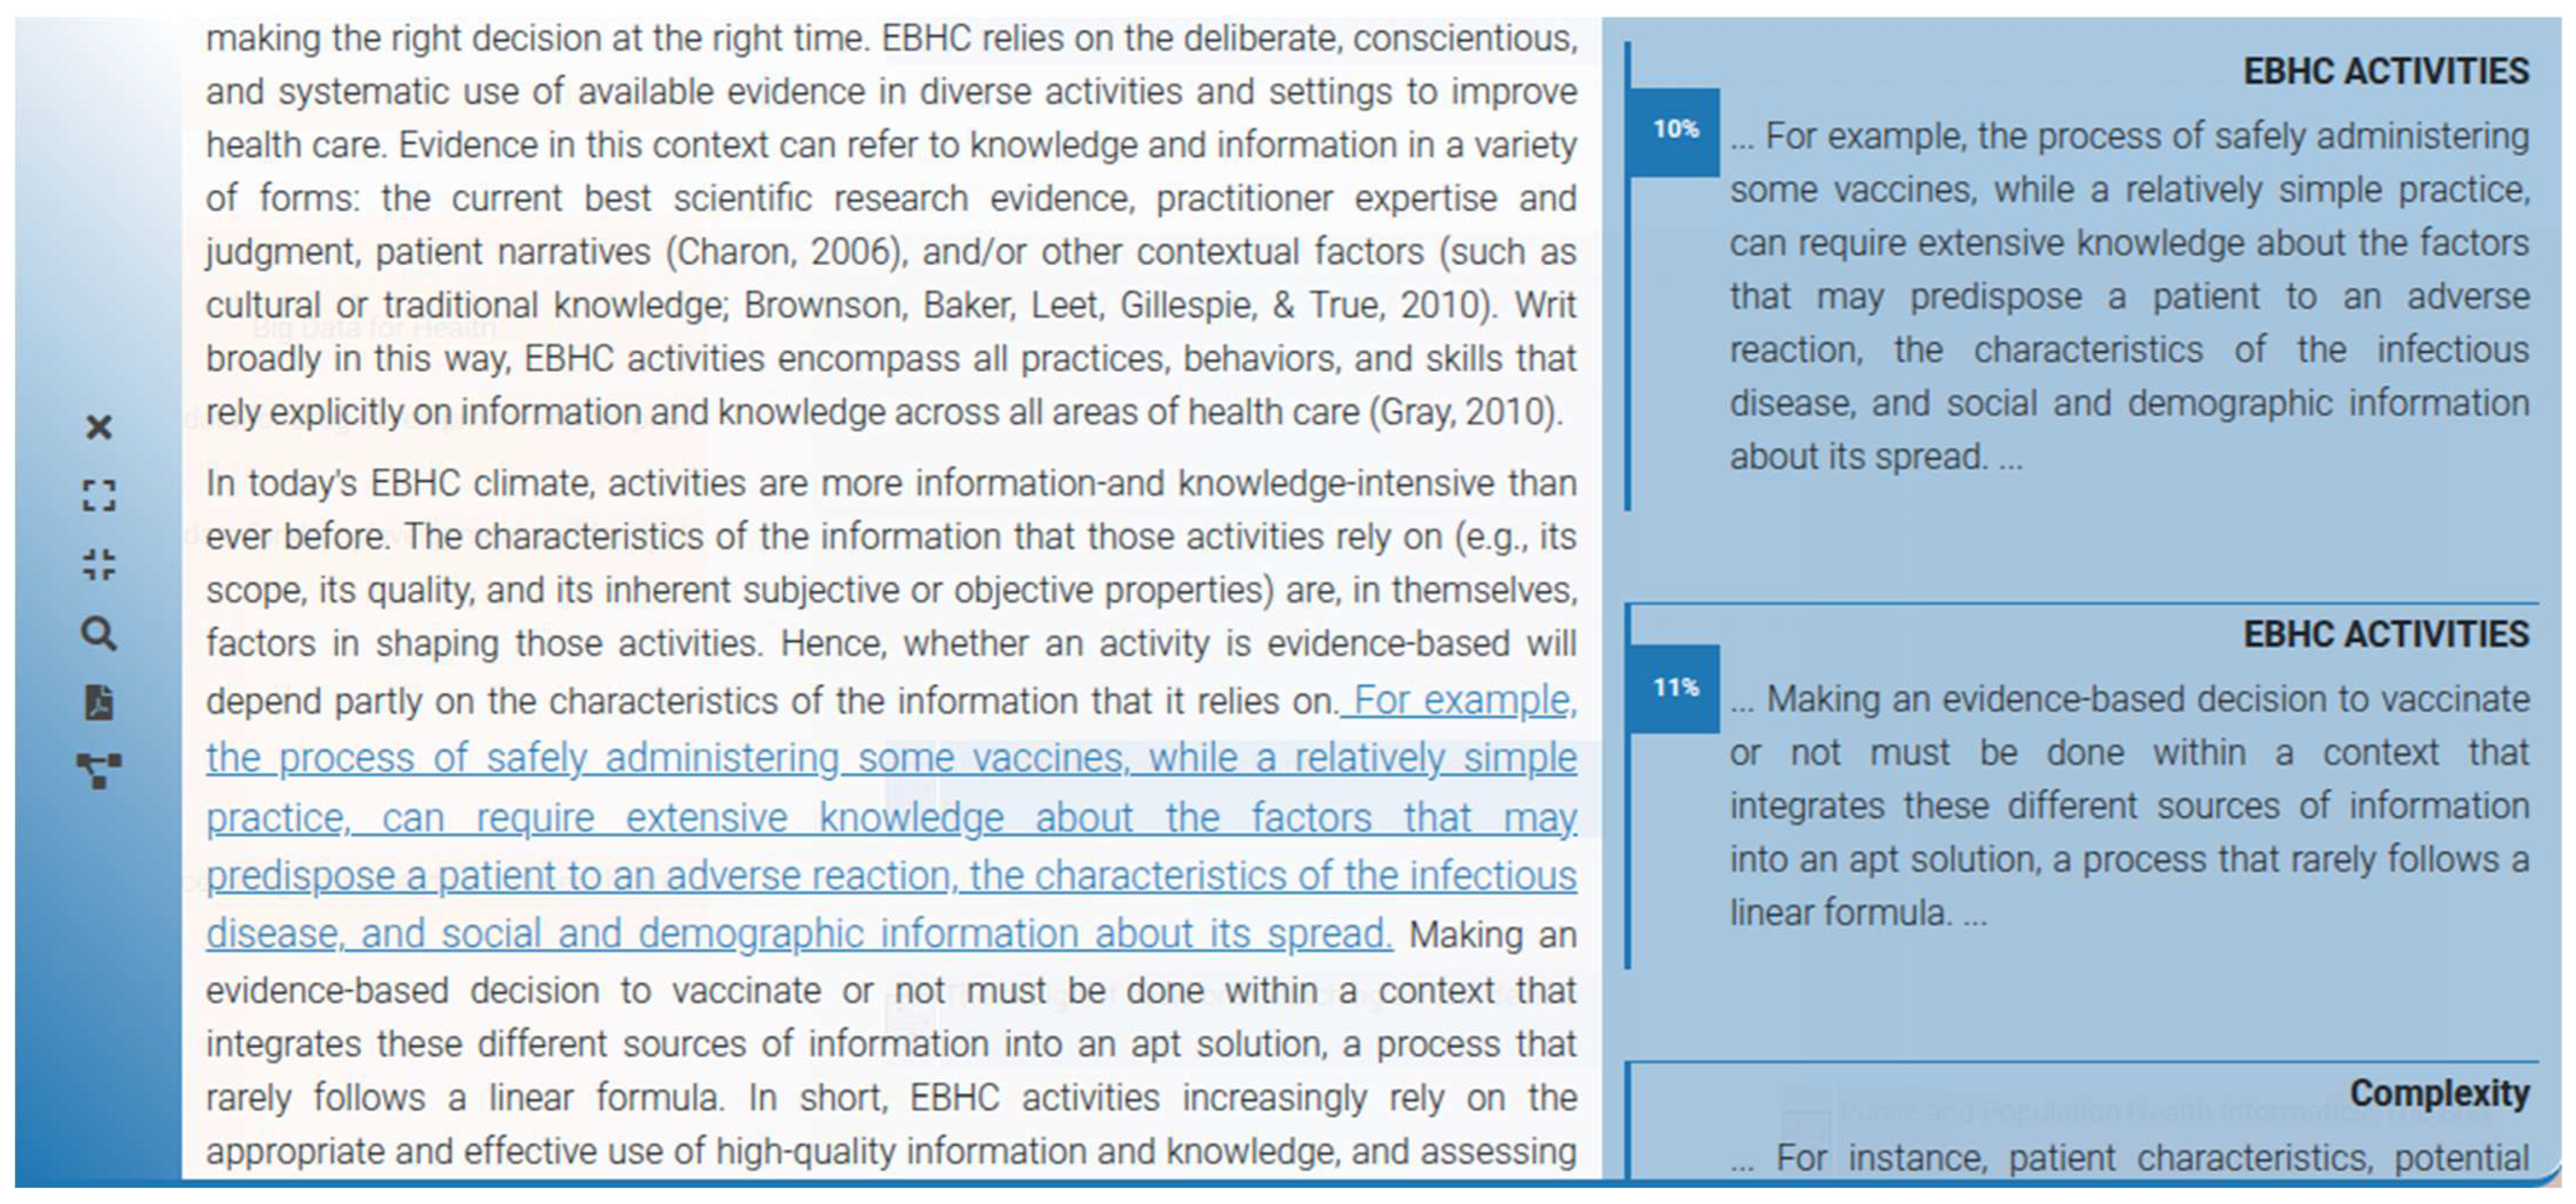
3.3.2. Summary
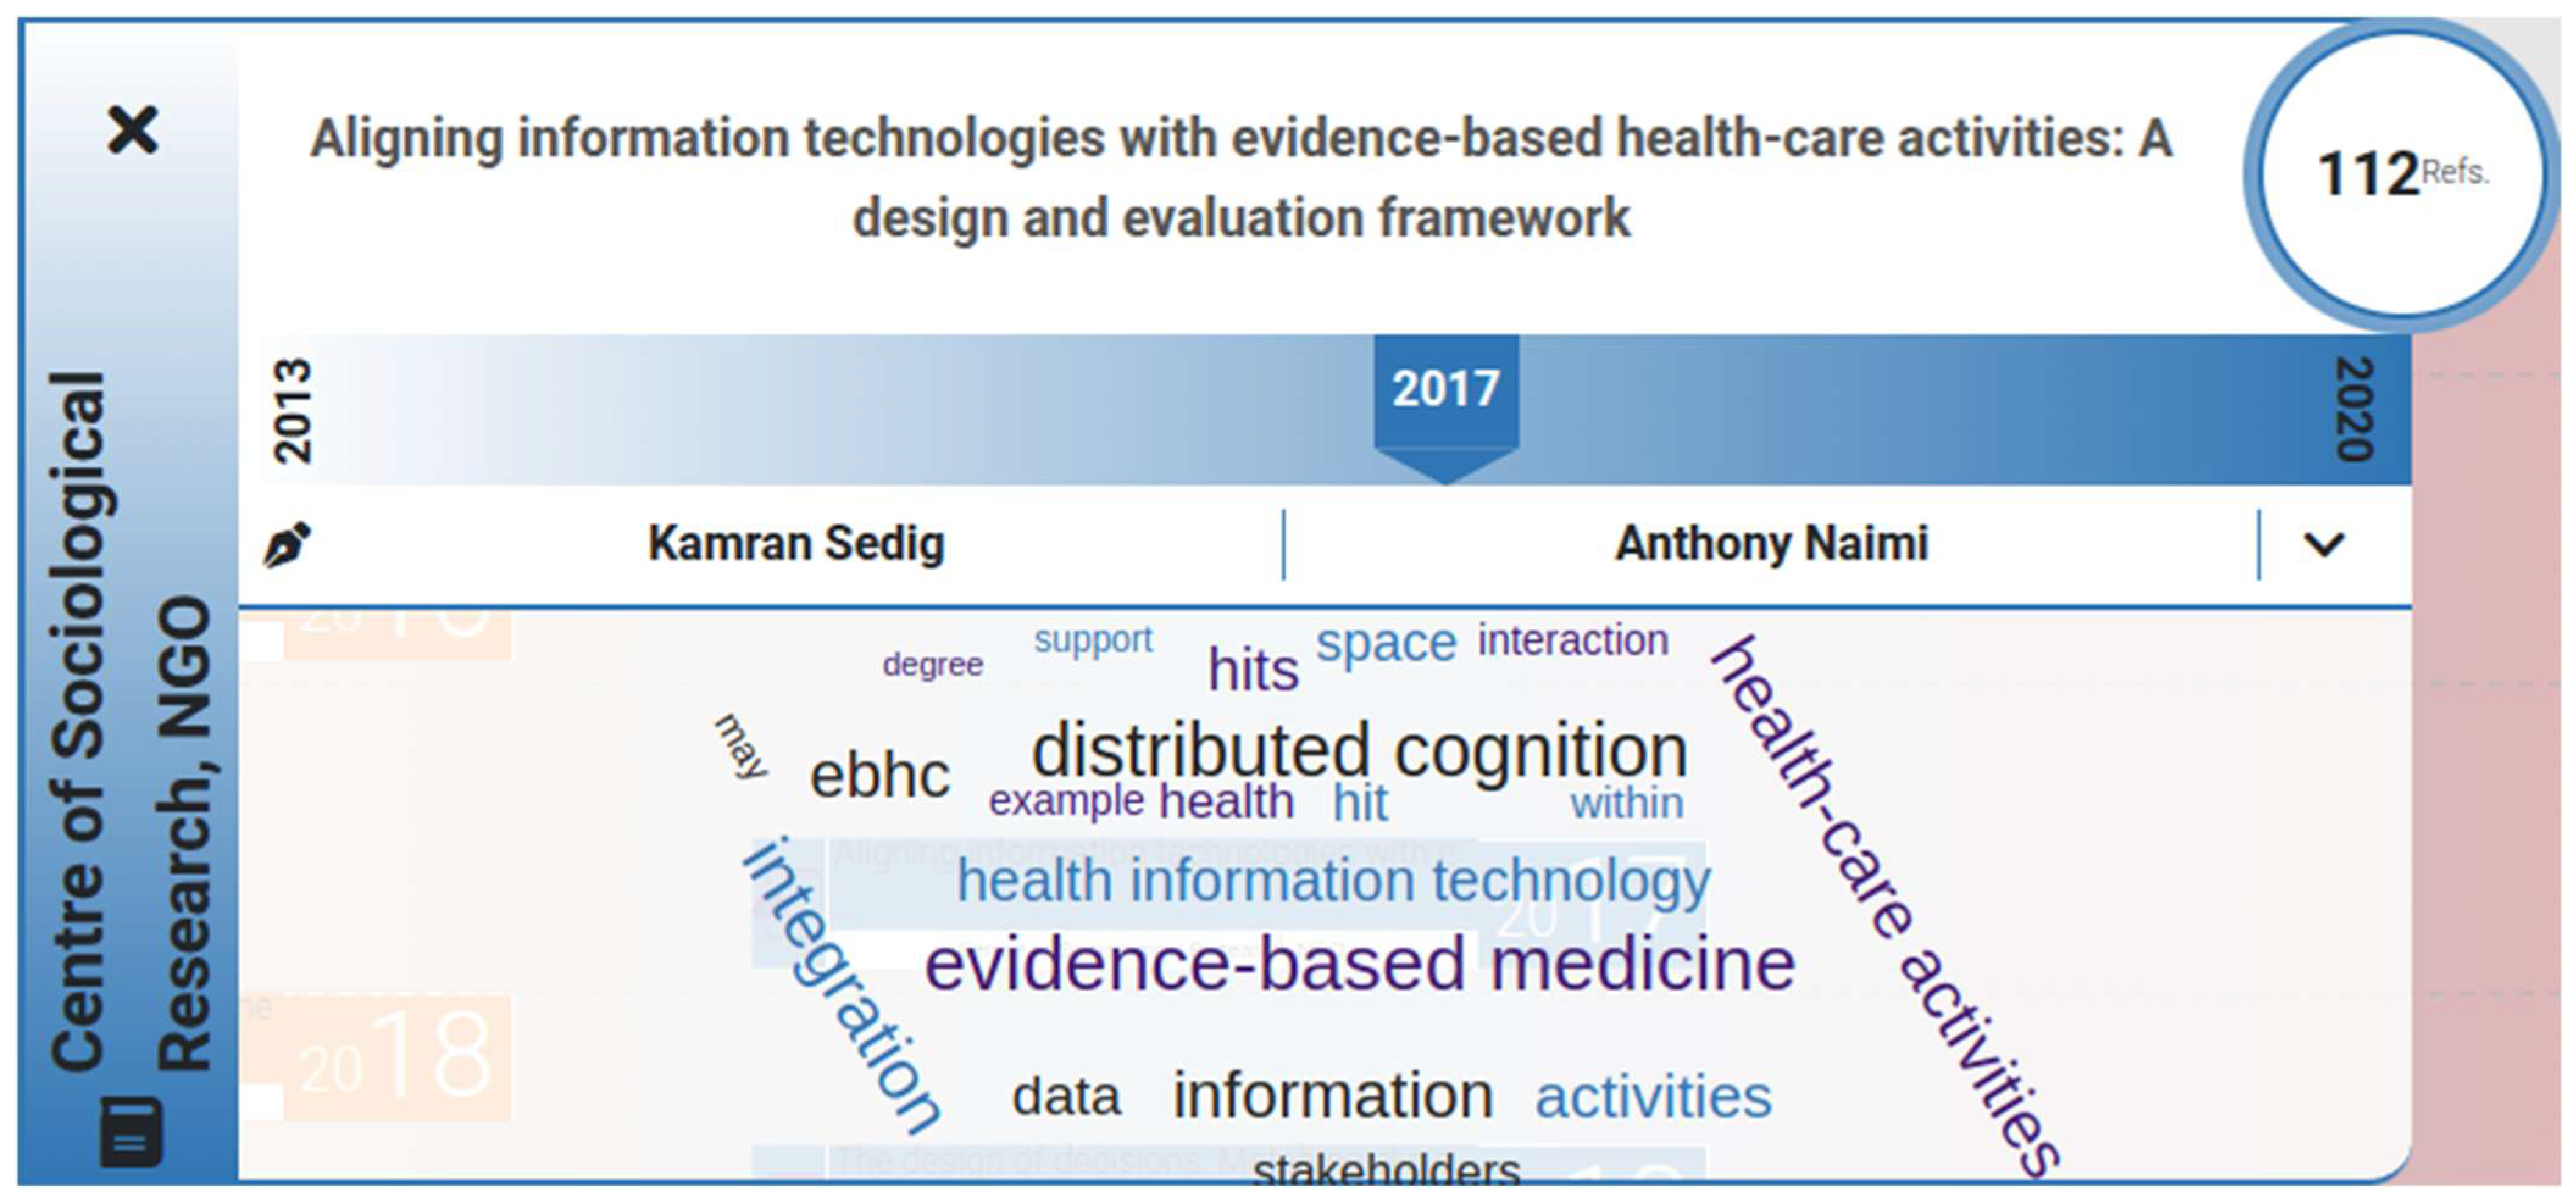
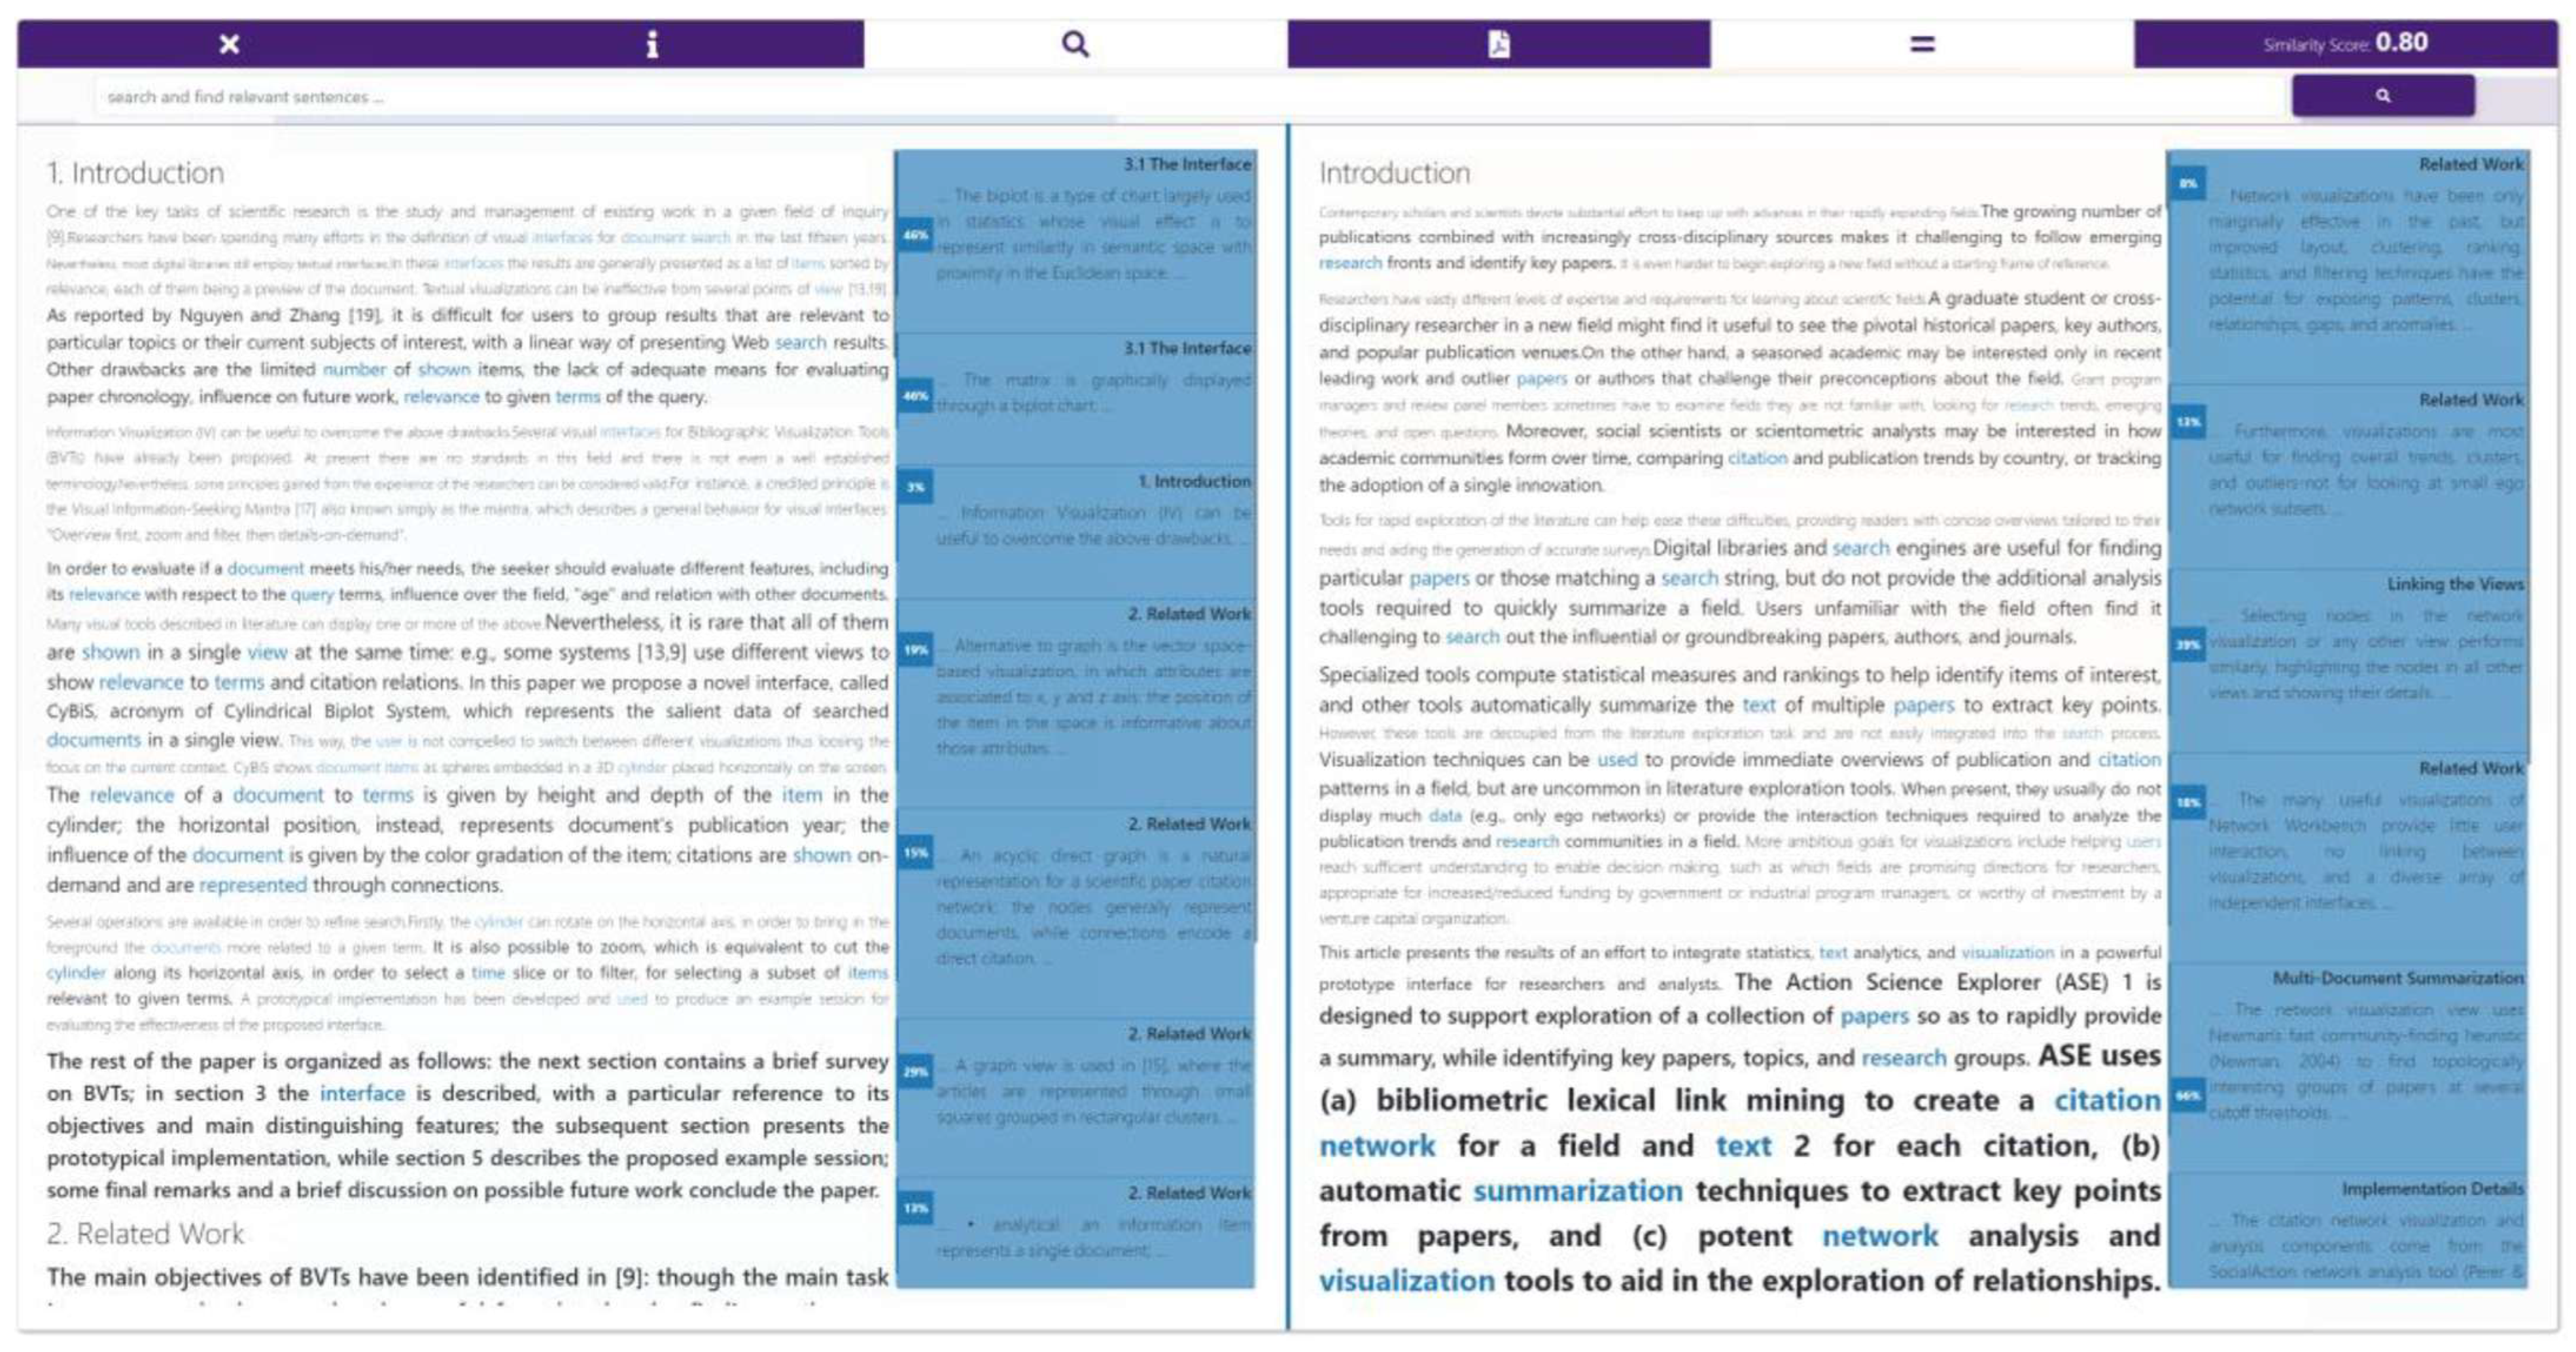
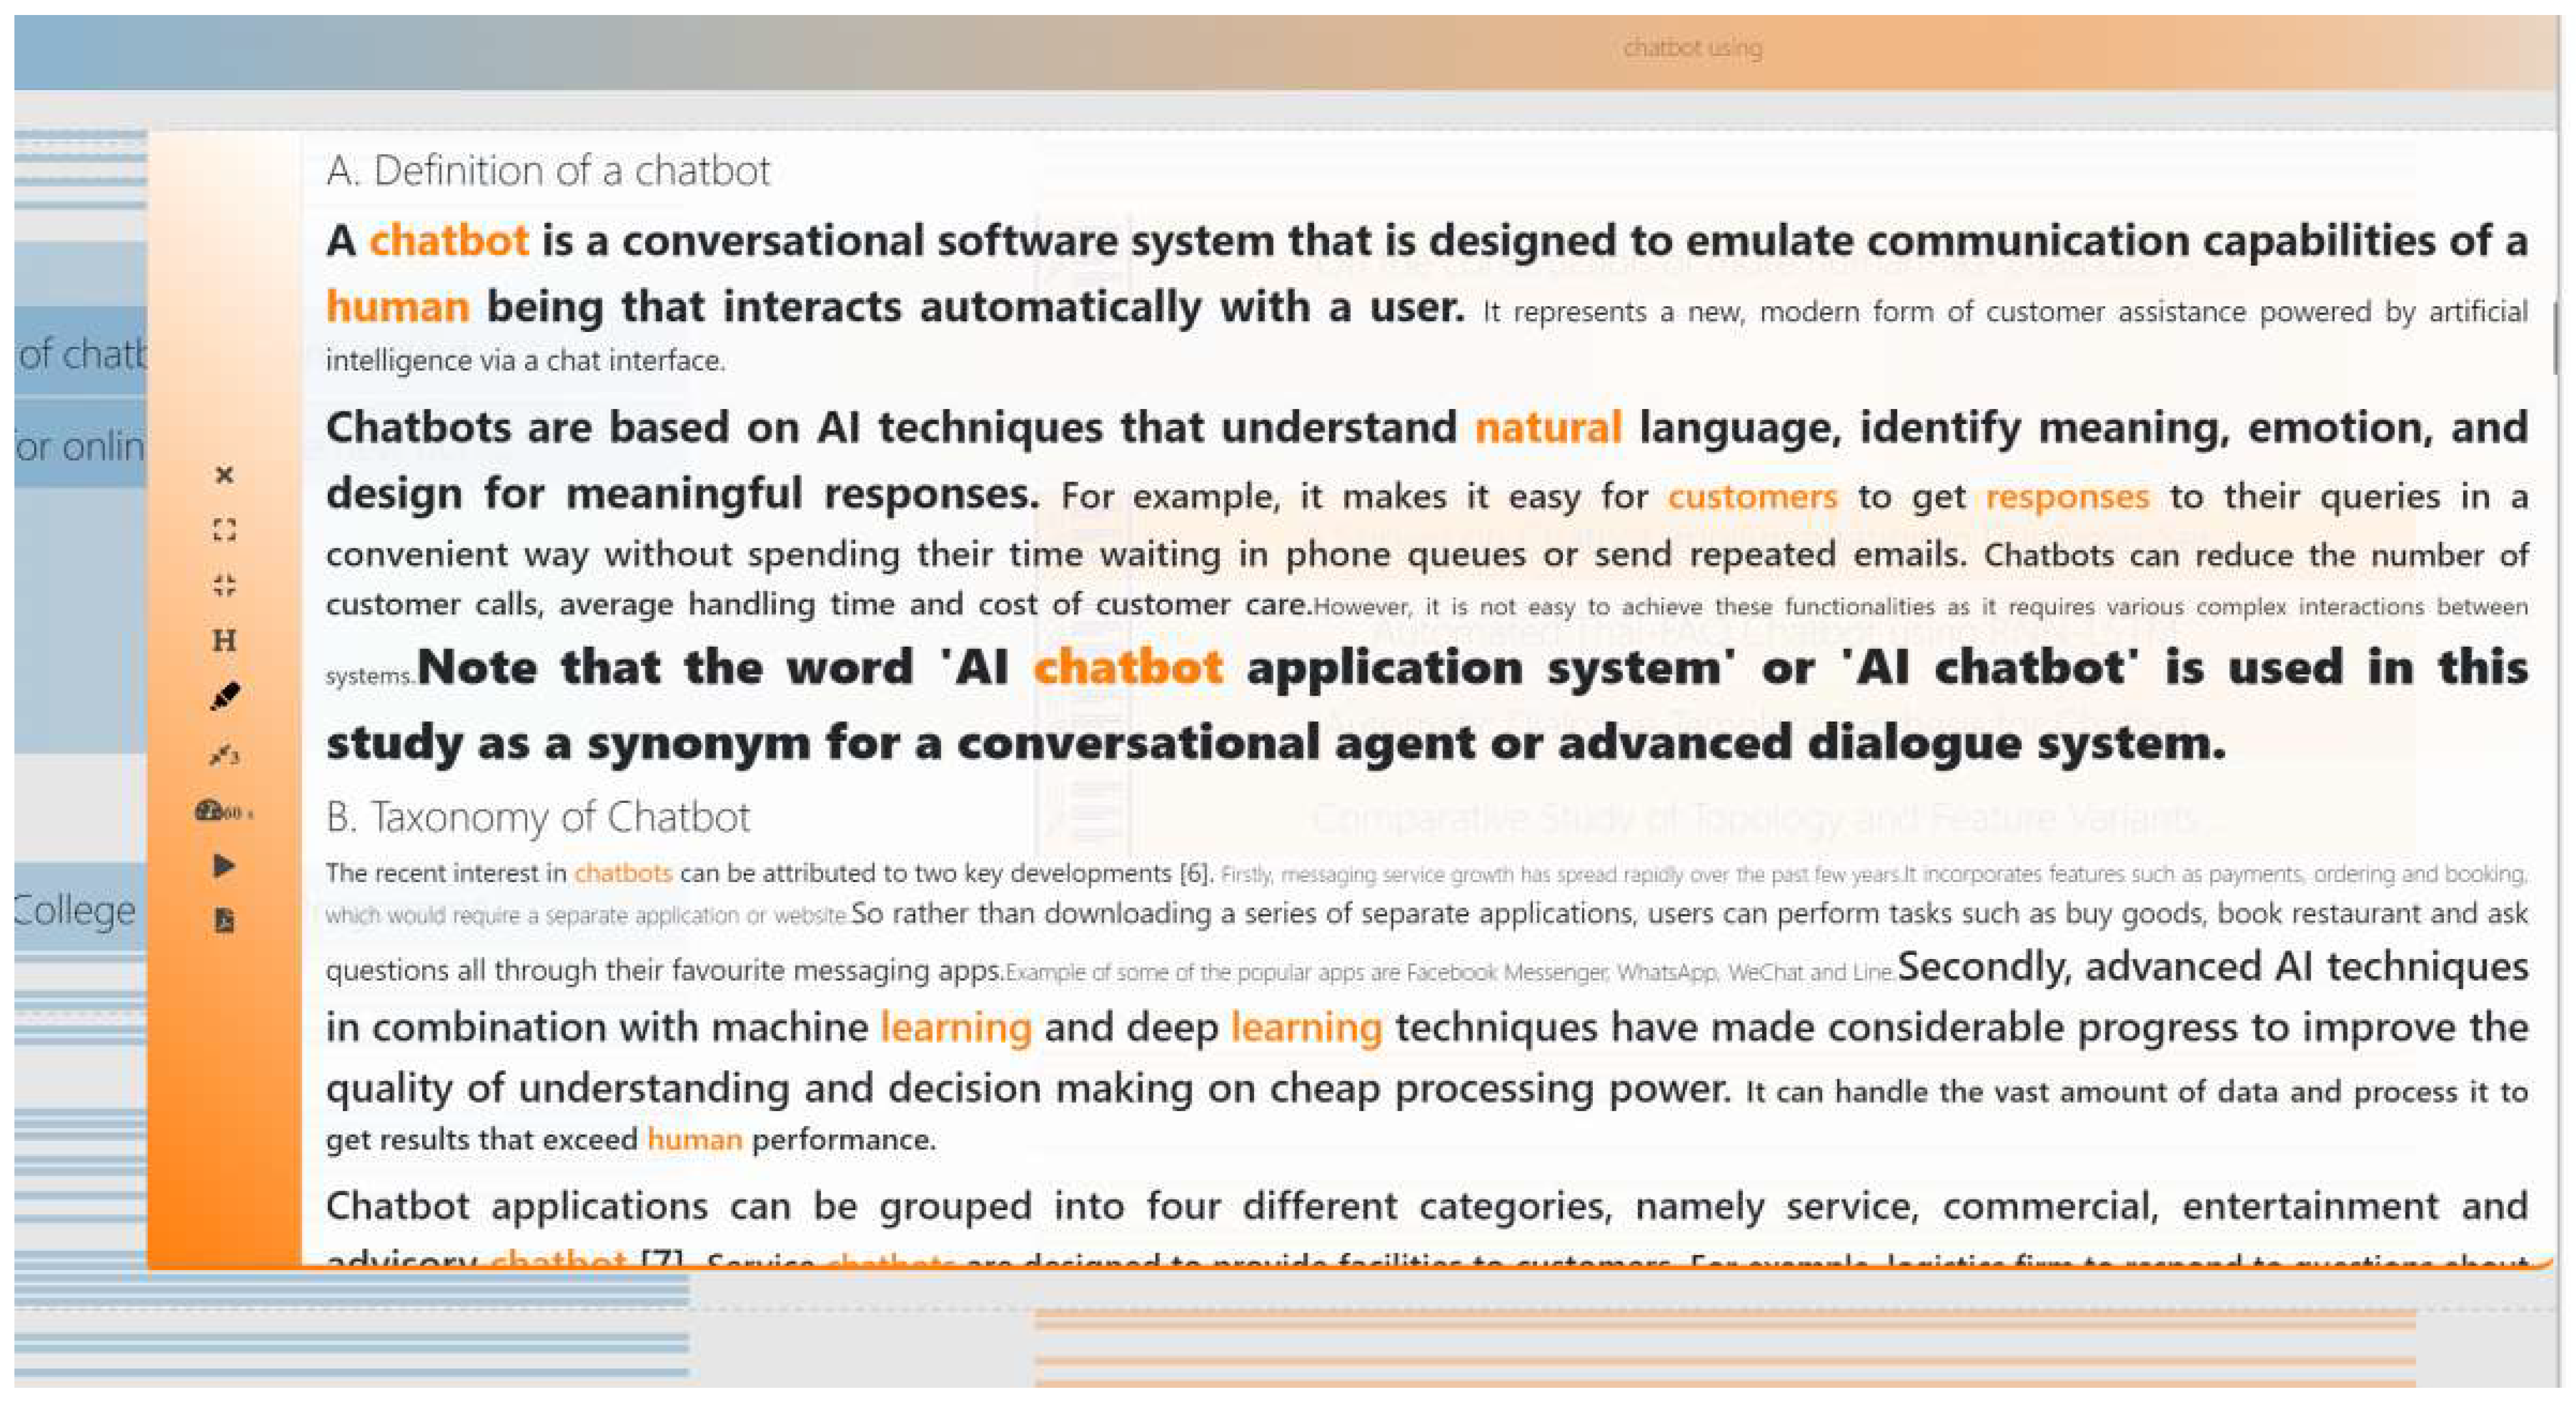
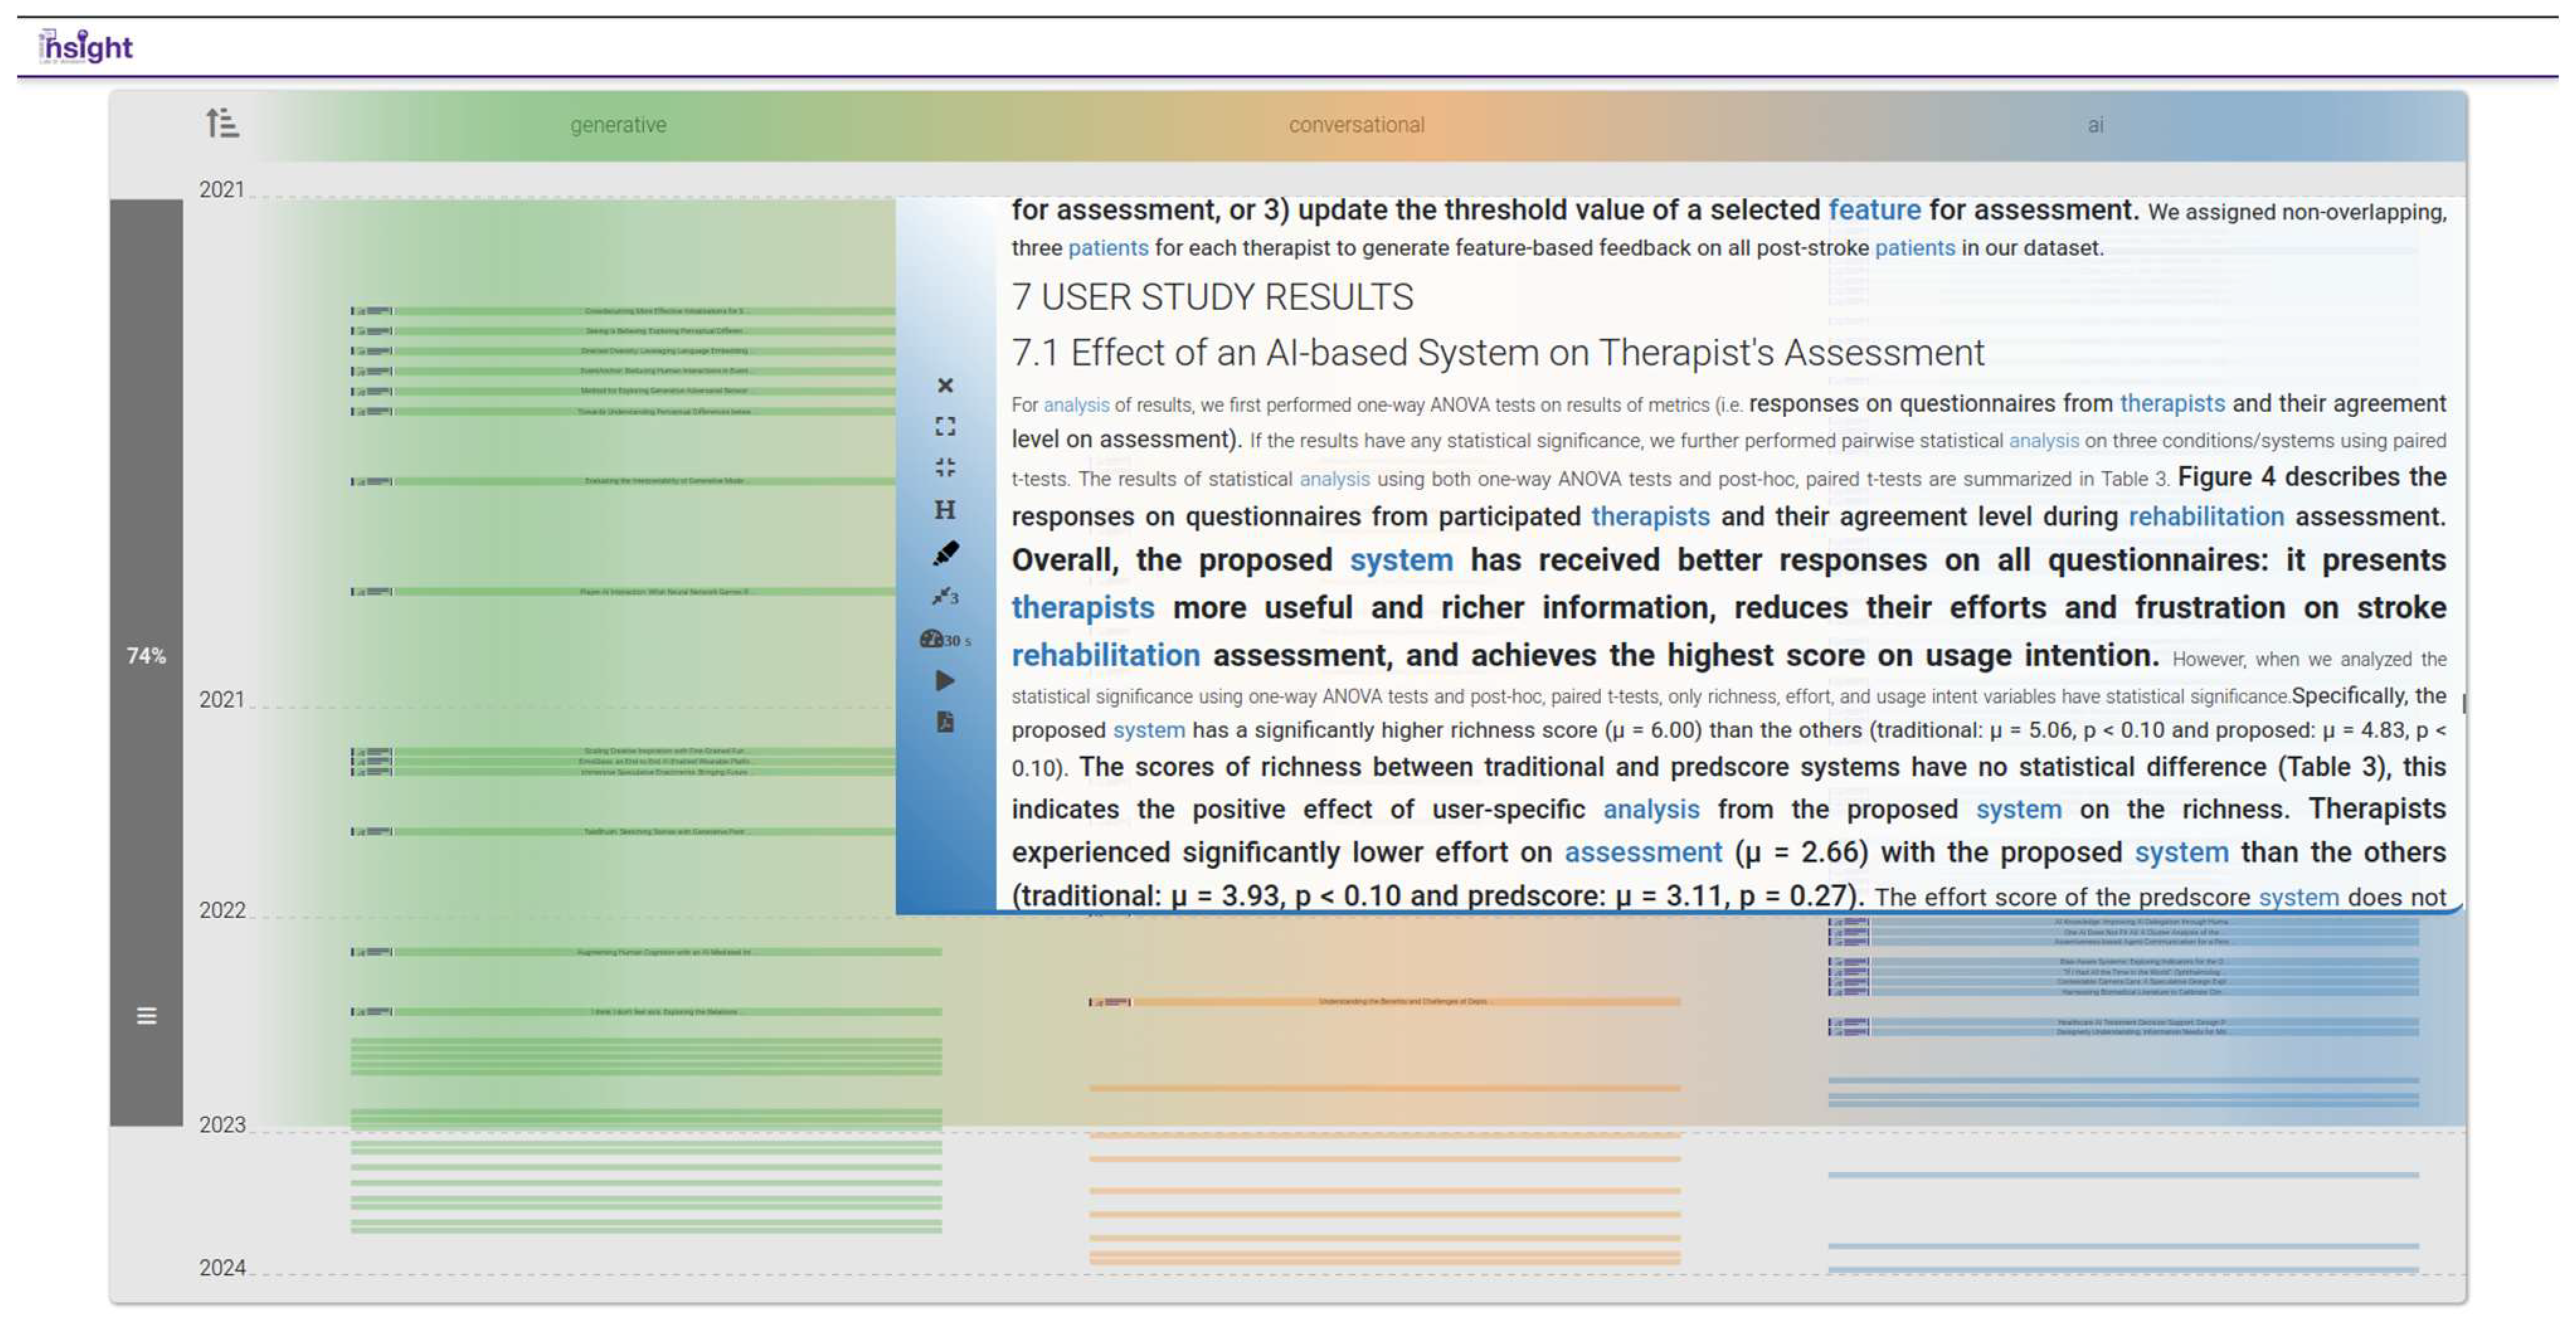
3.3.3. Skim
3.3.4. Semantic Jump (SemJump)
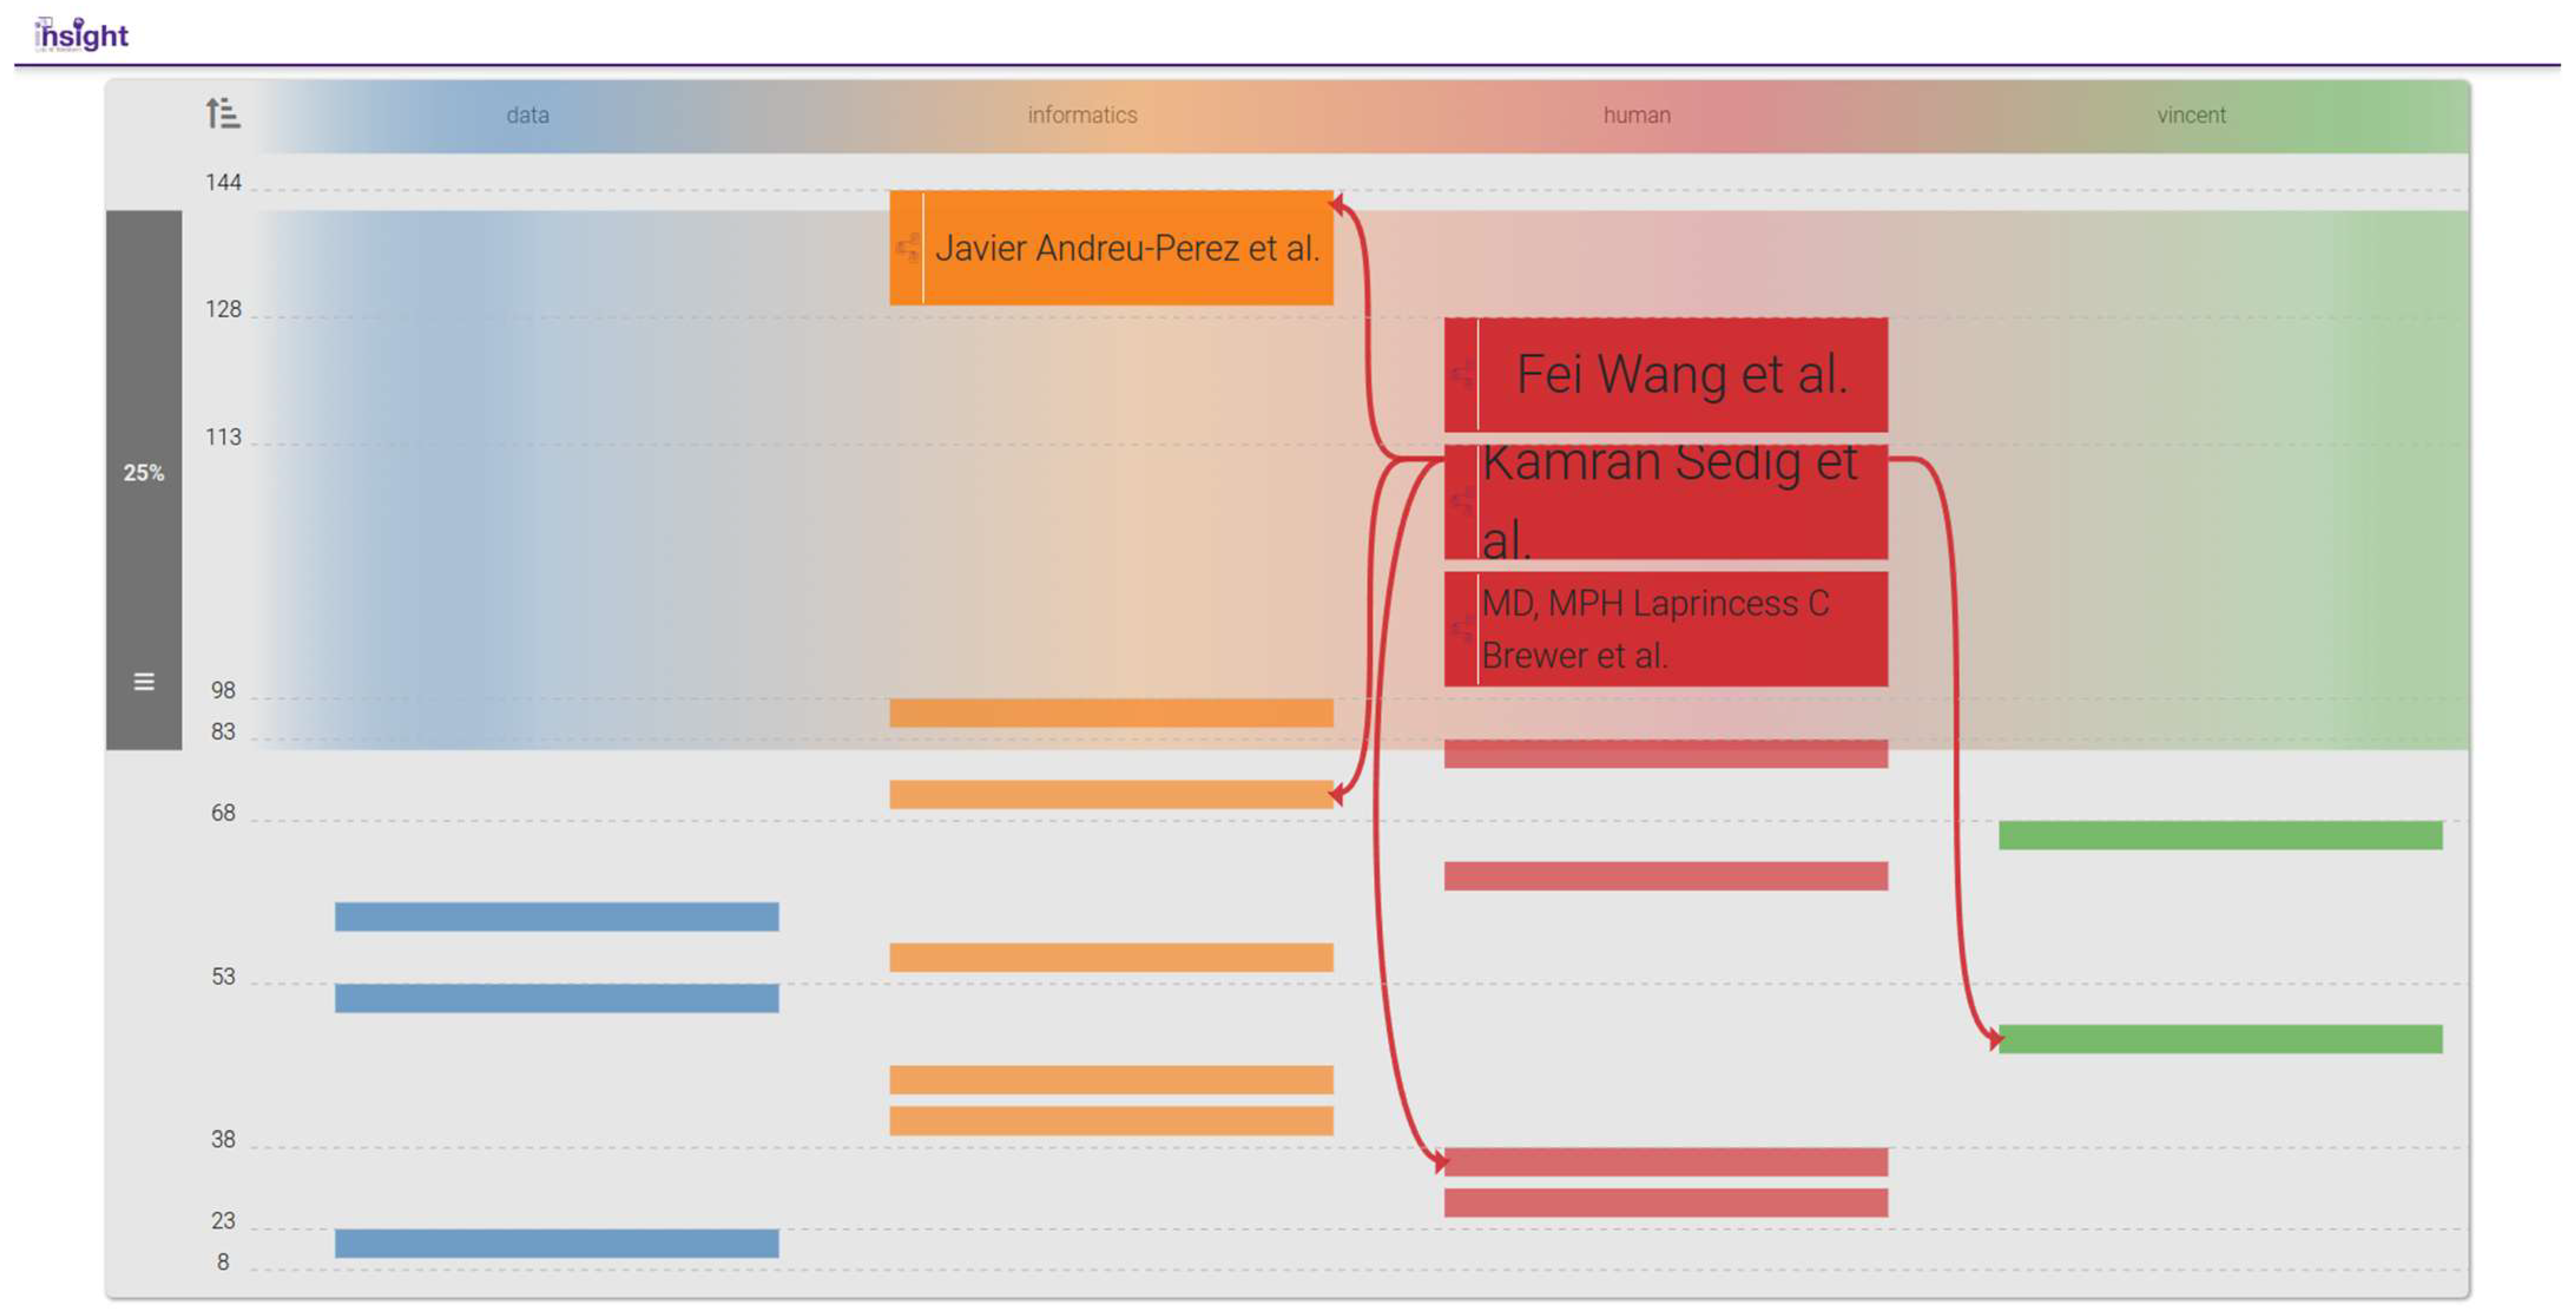
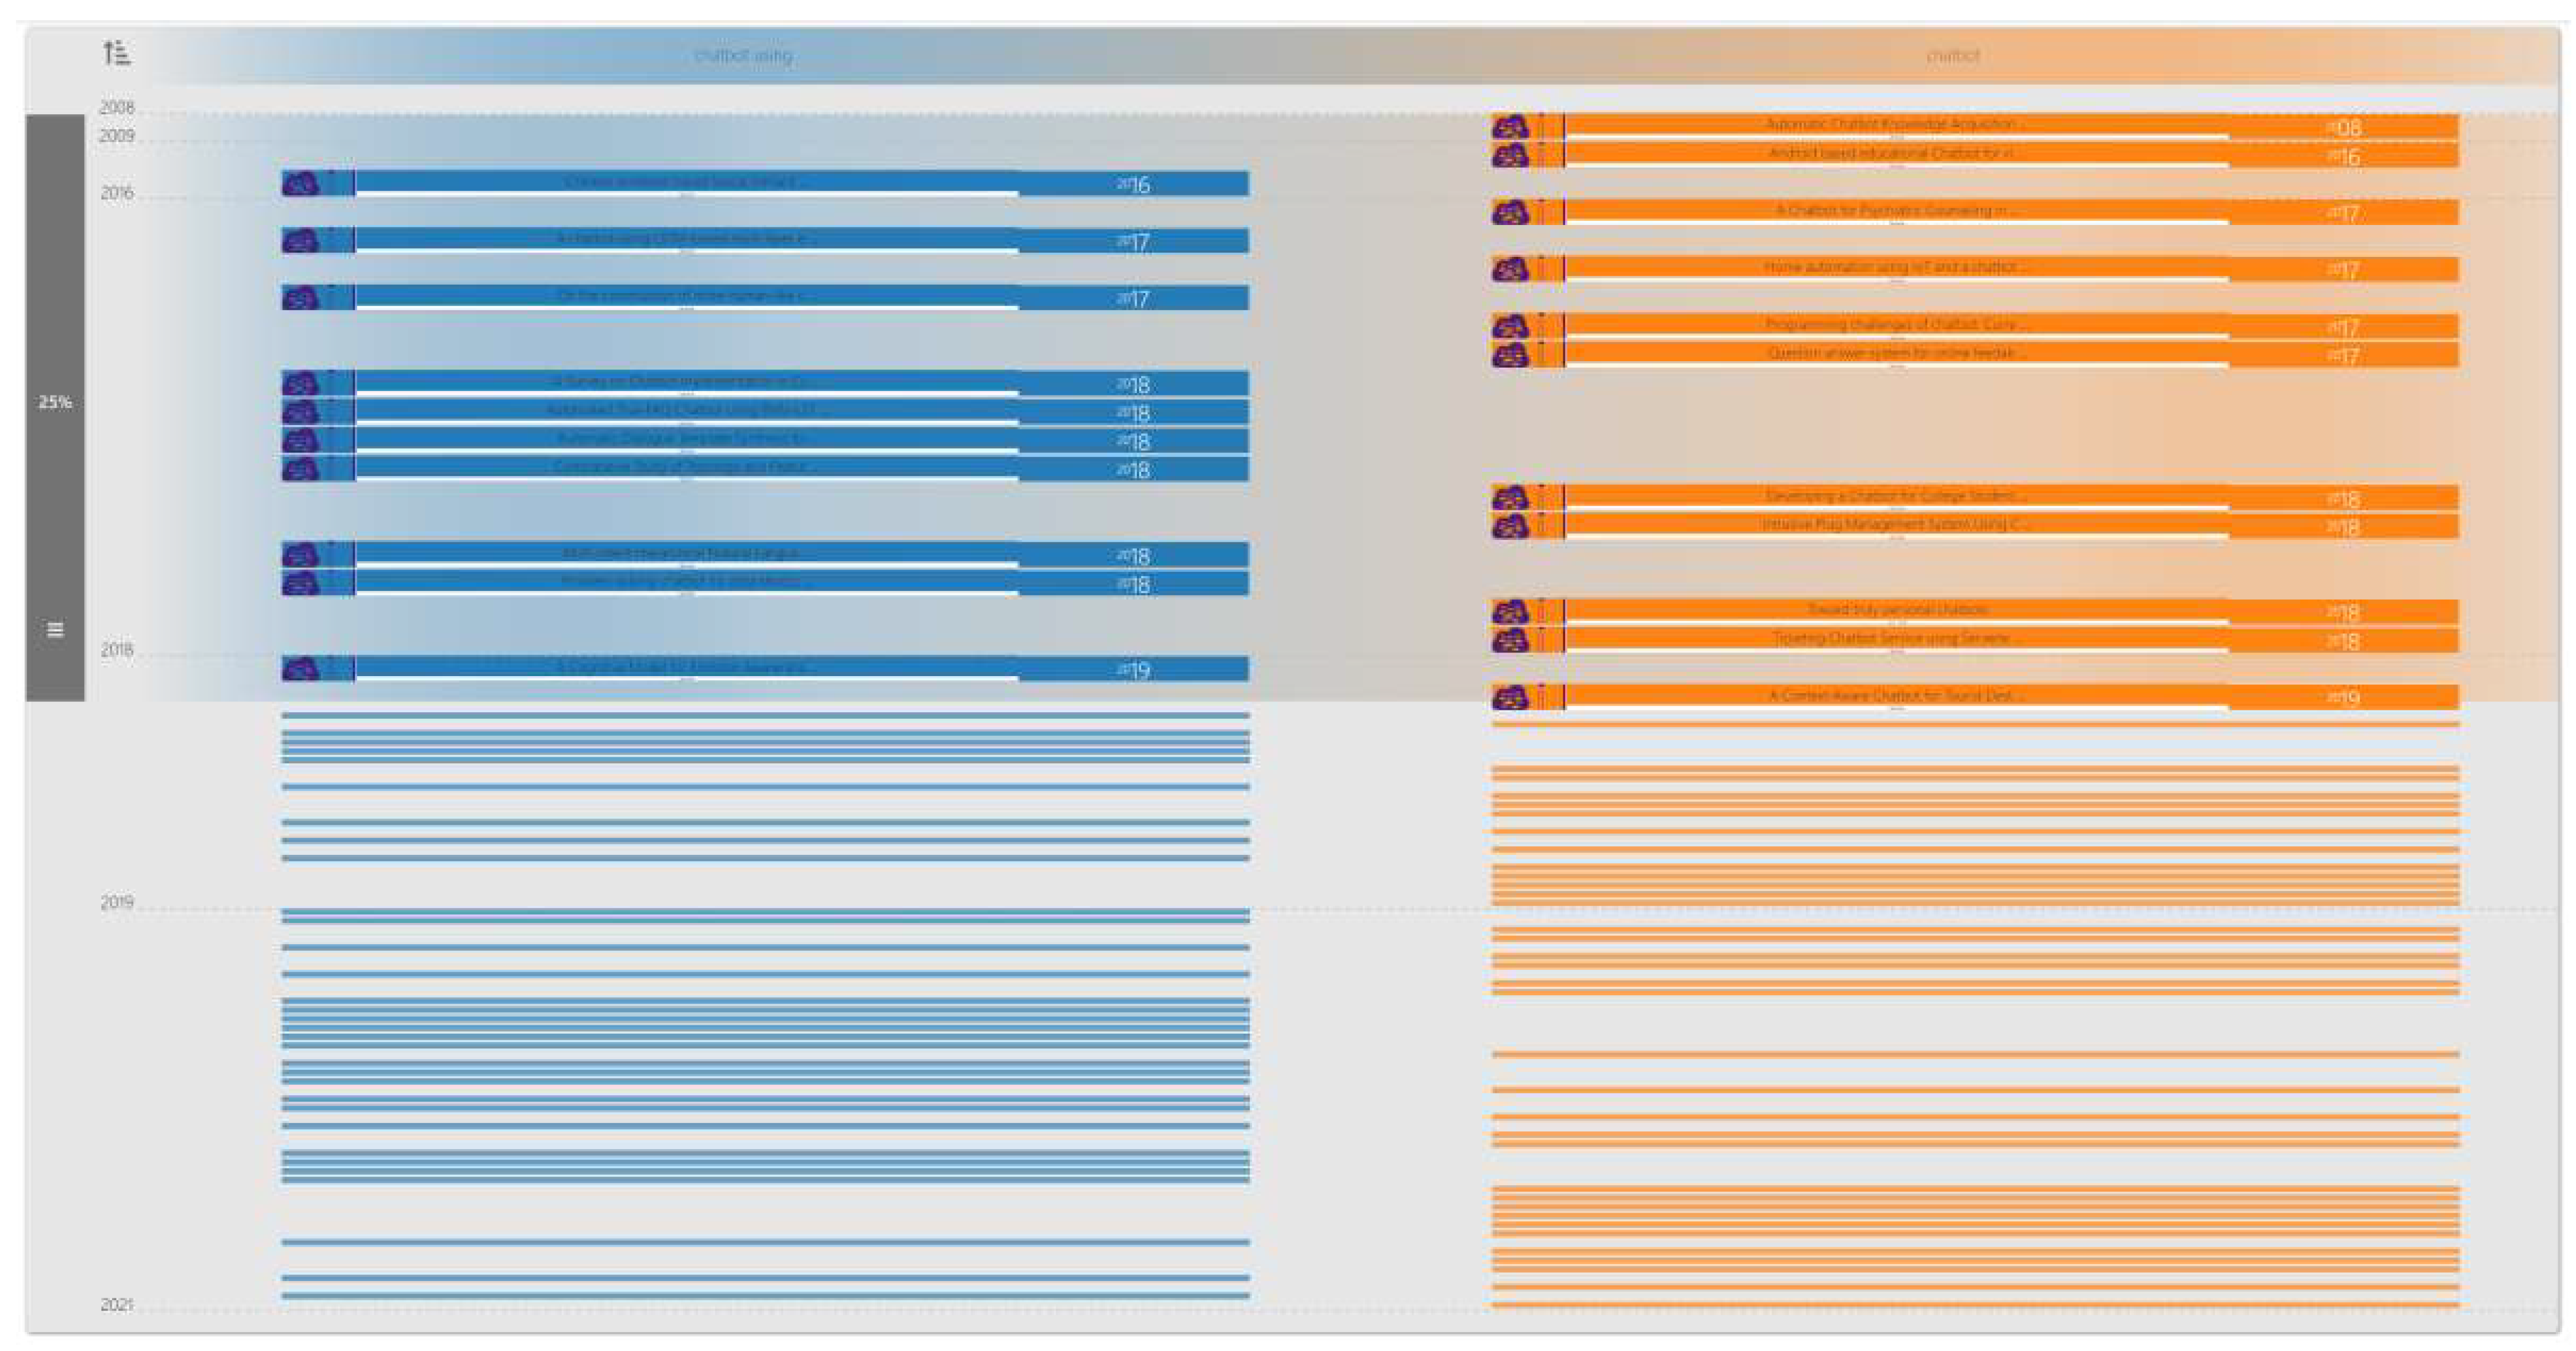
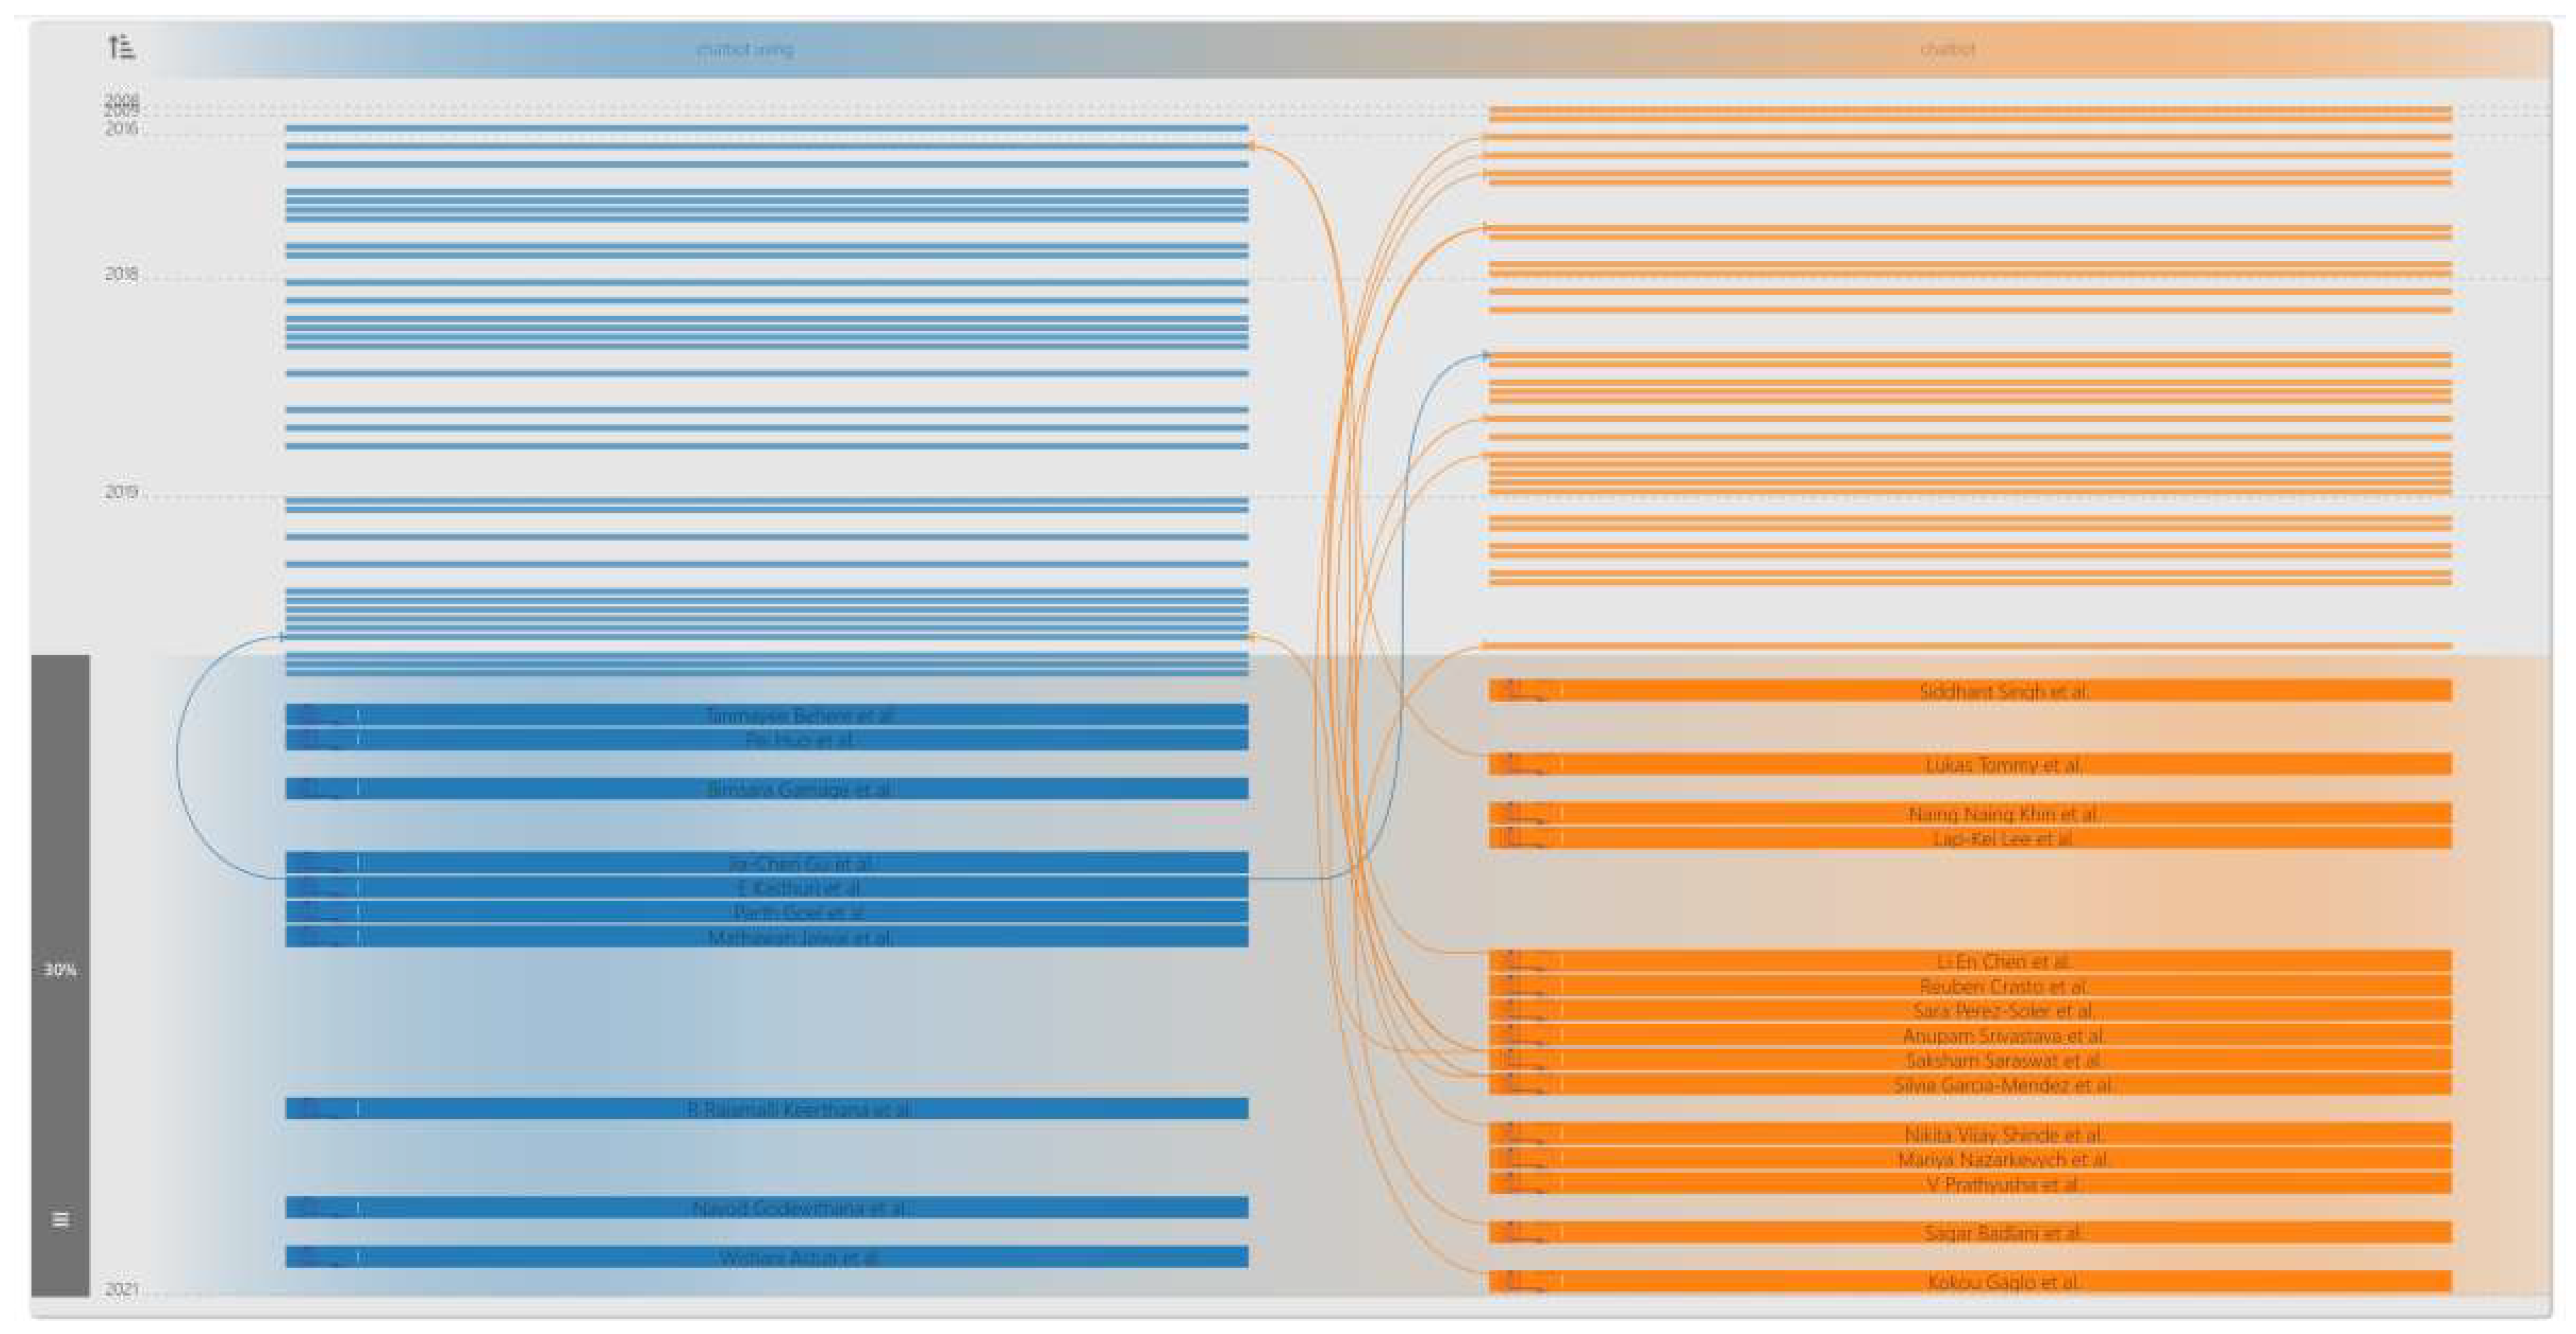
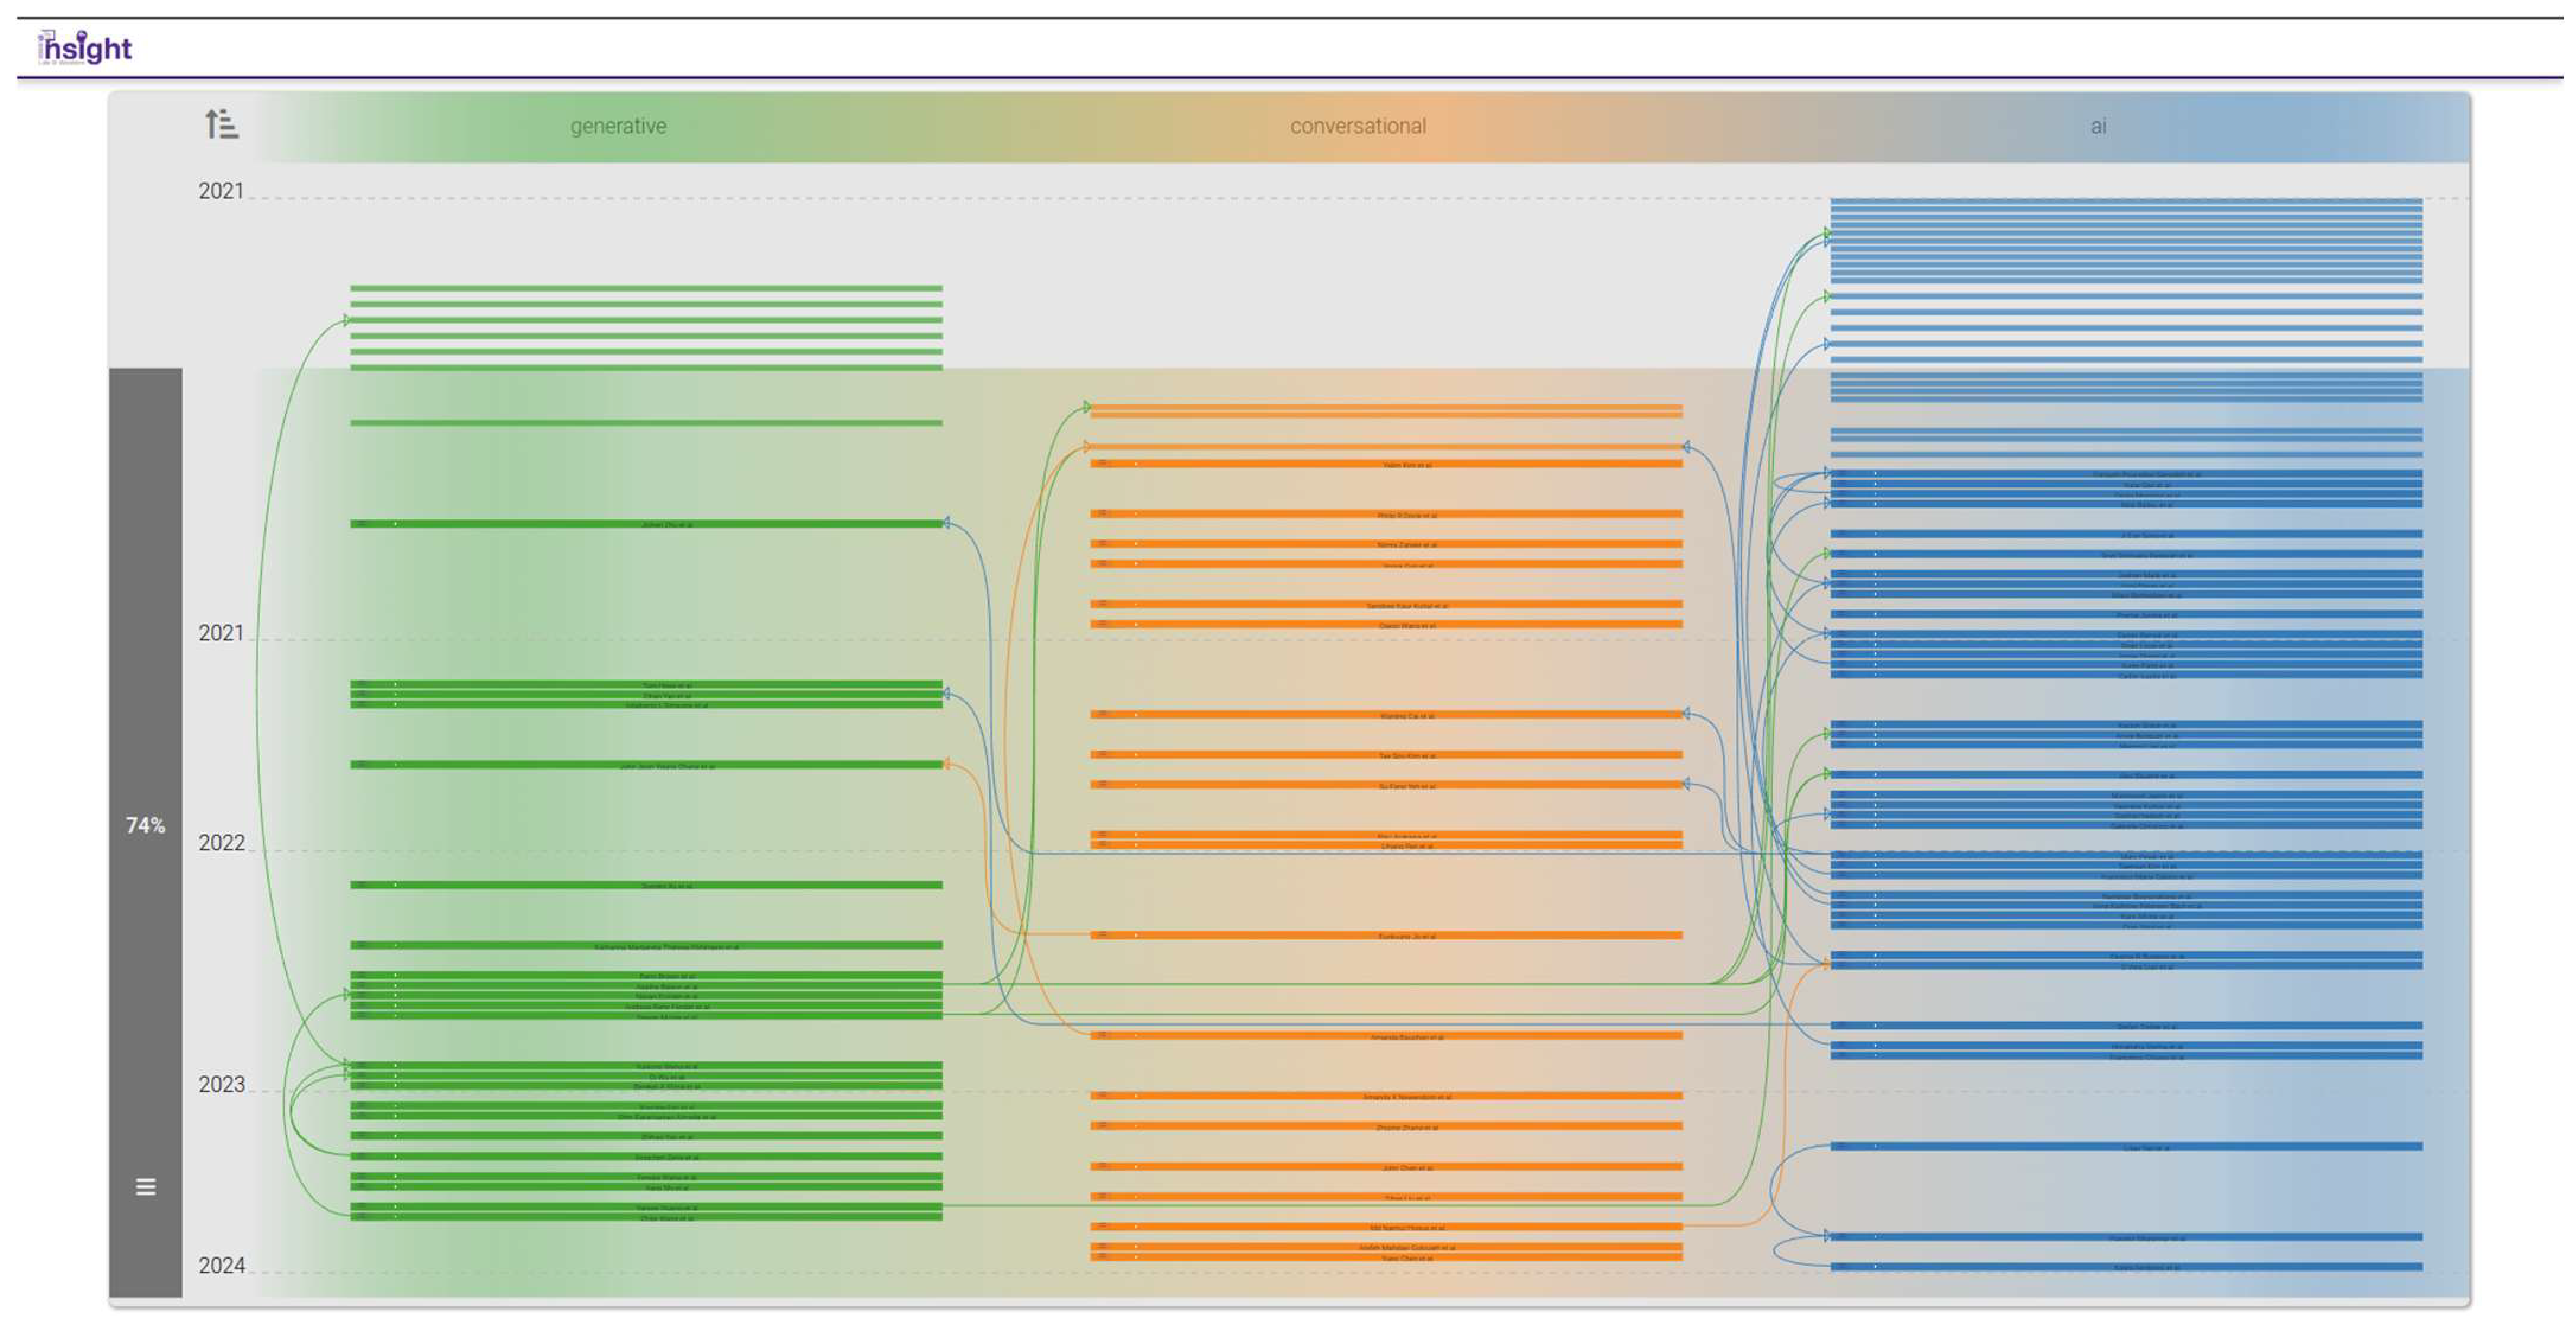
3.3.5. Bibliographic Connections (BiblioConnections)
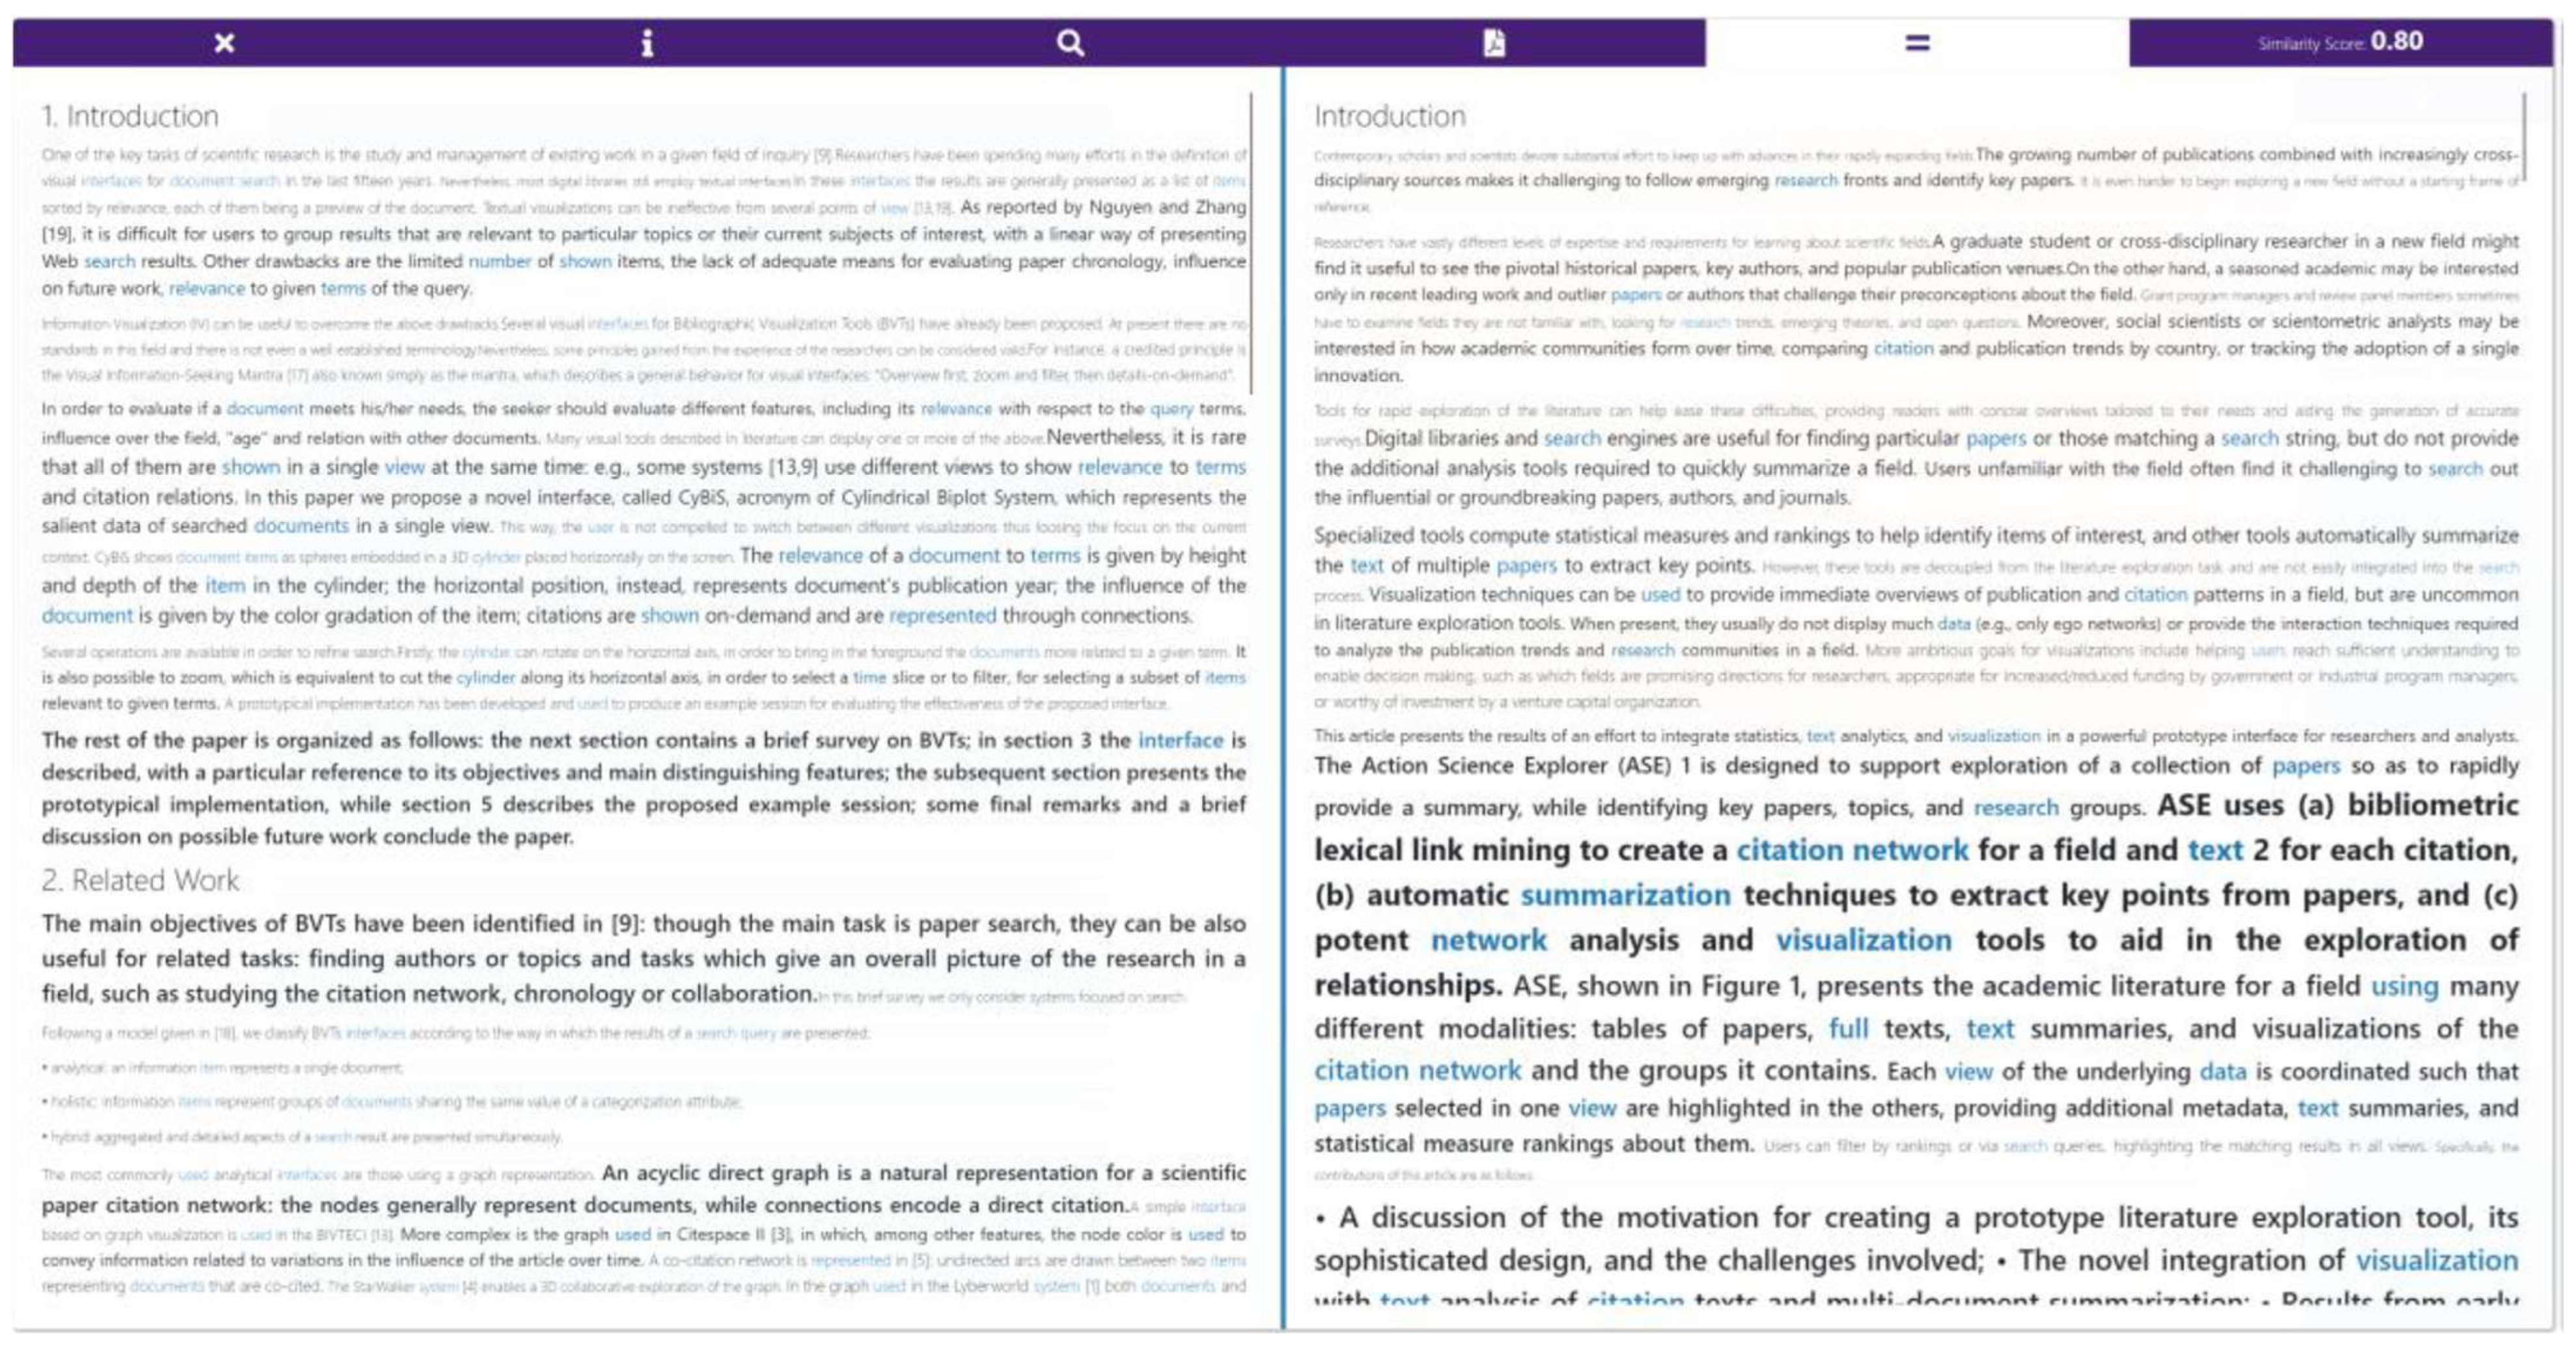
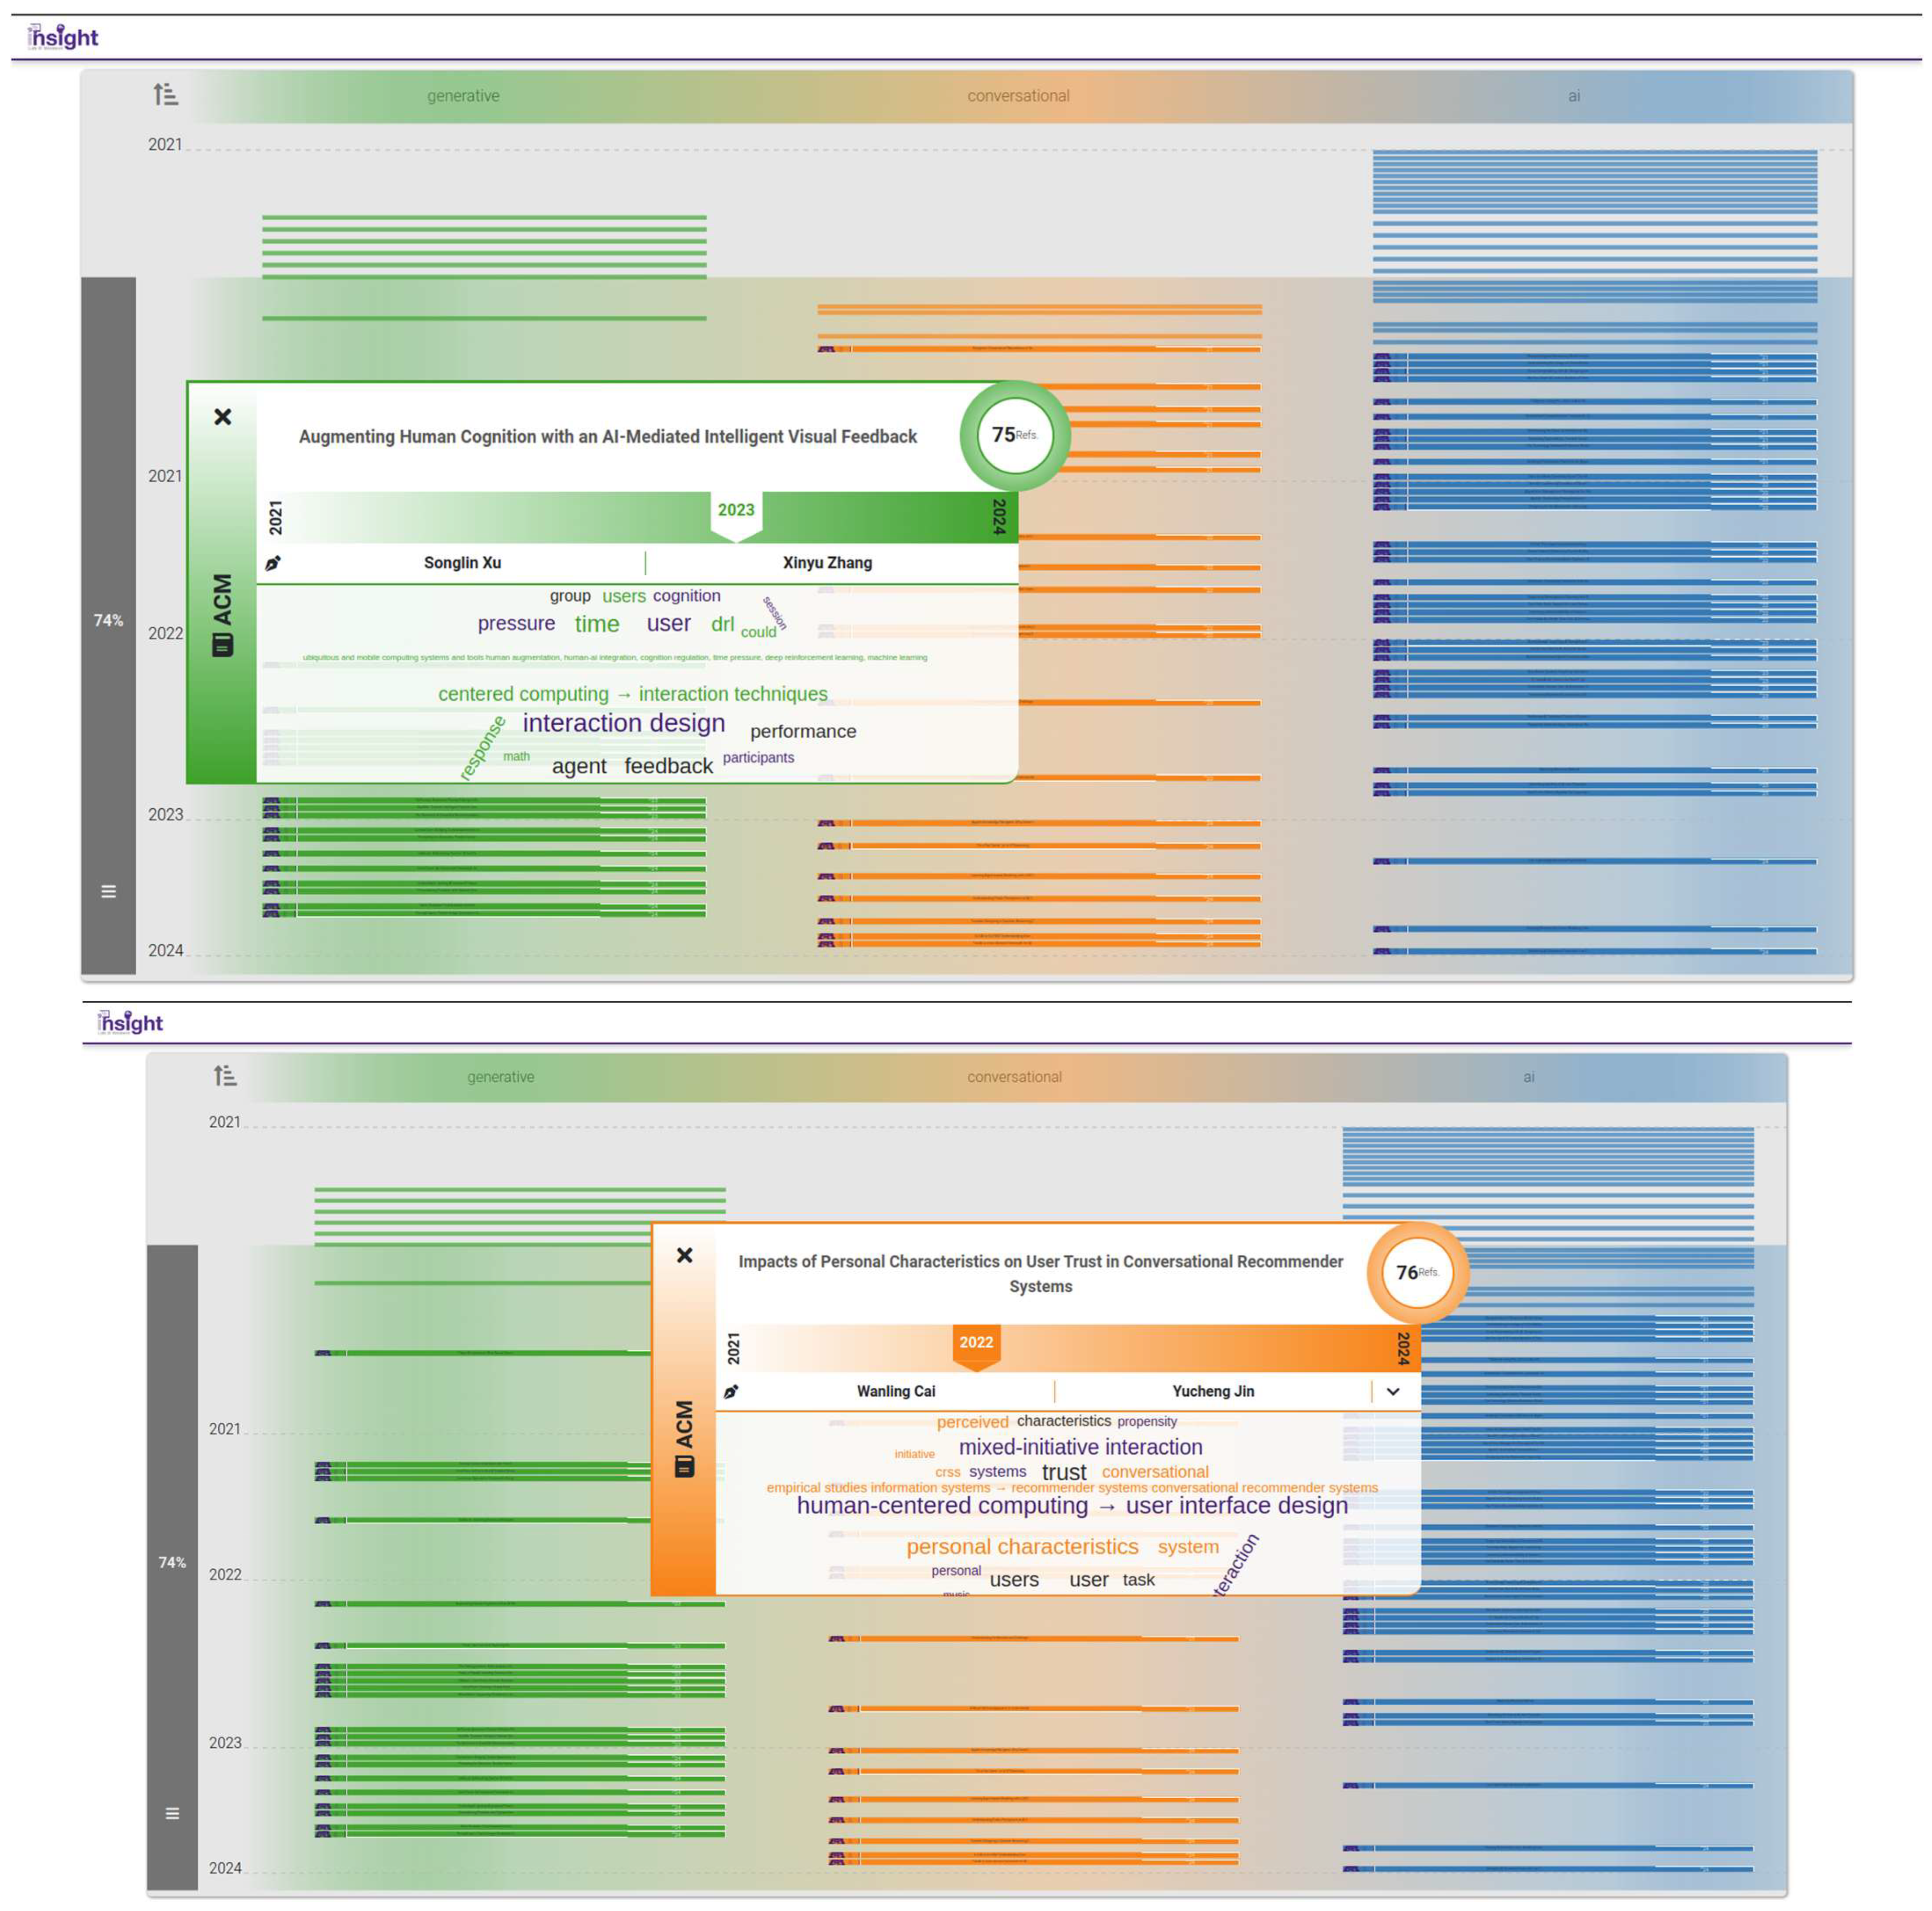
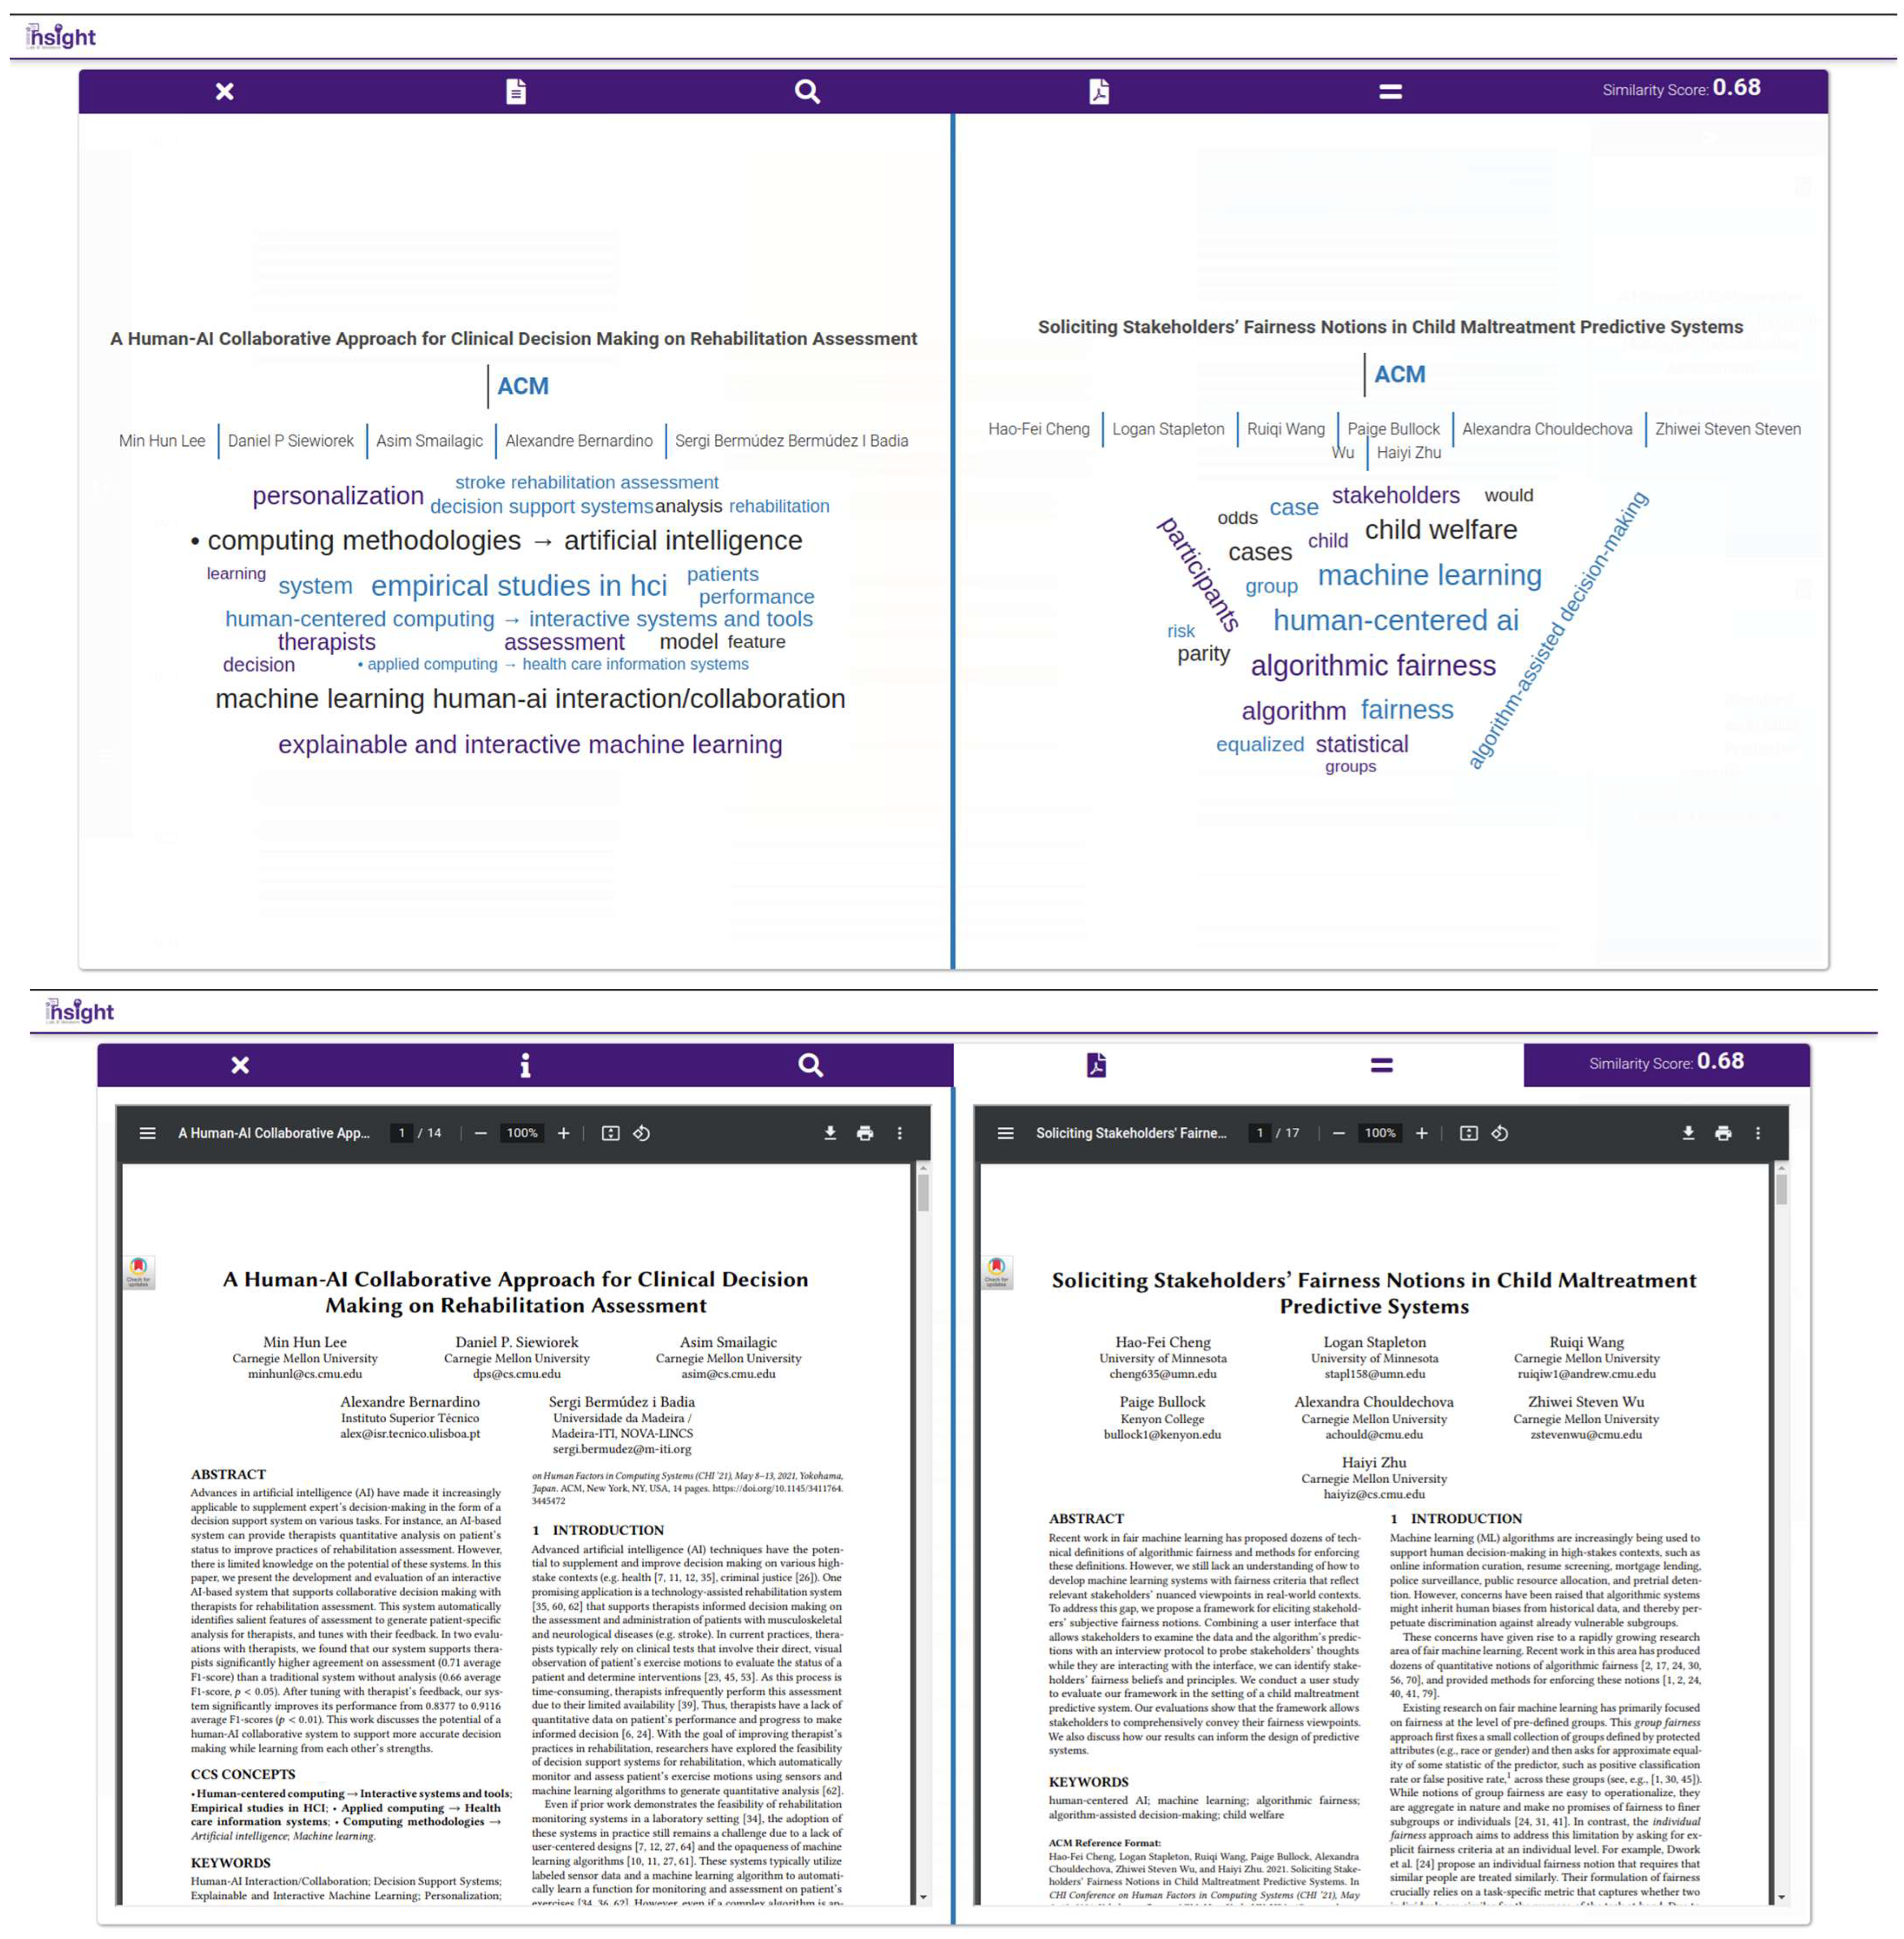
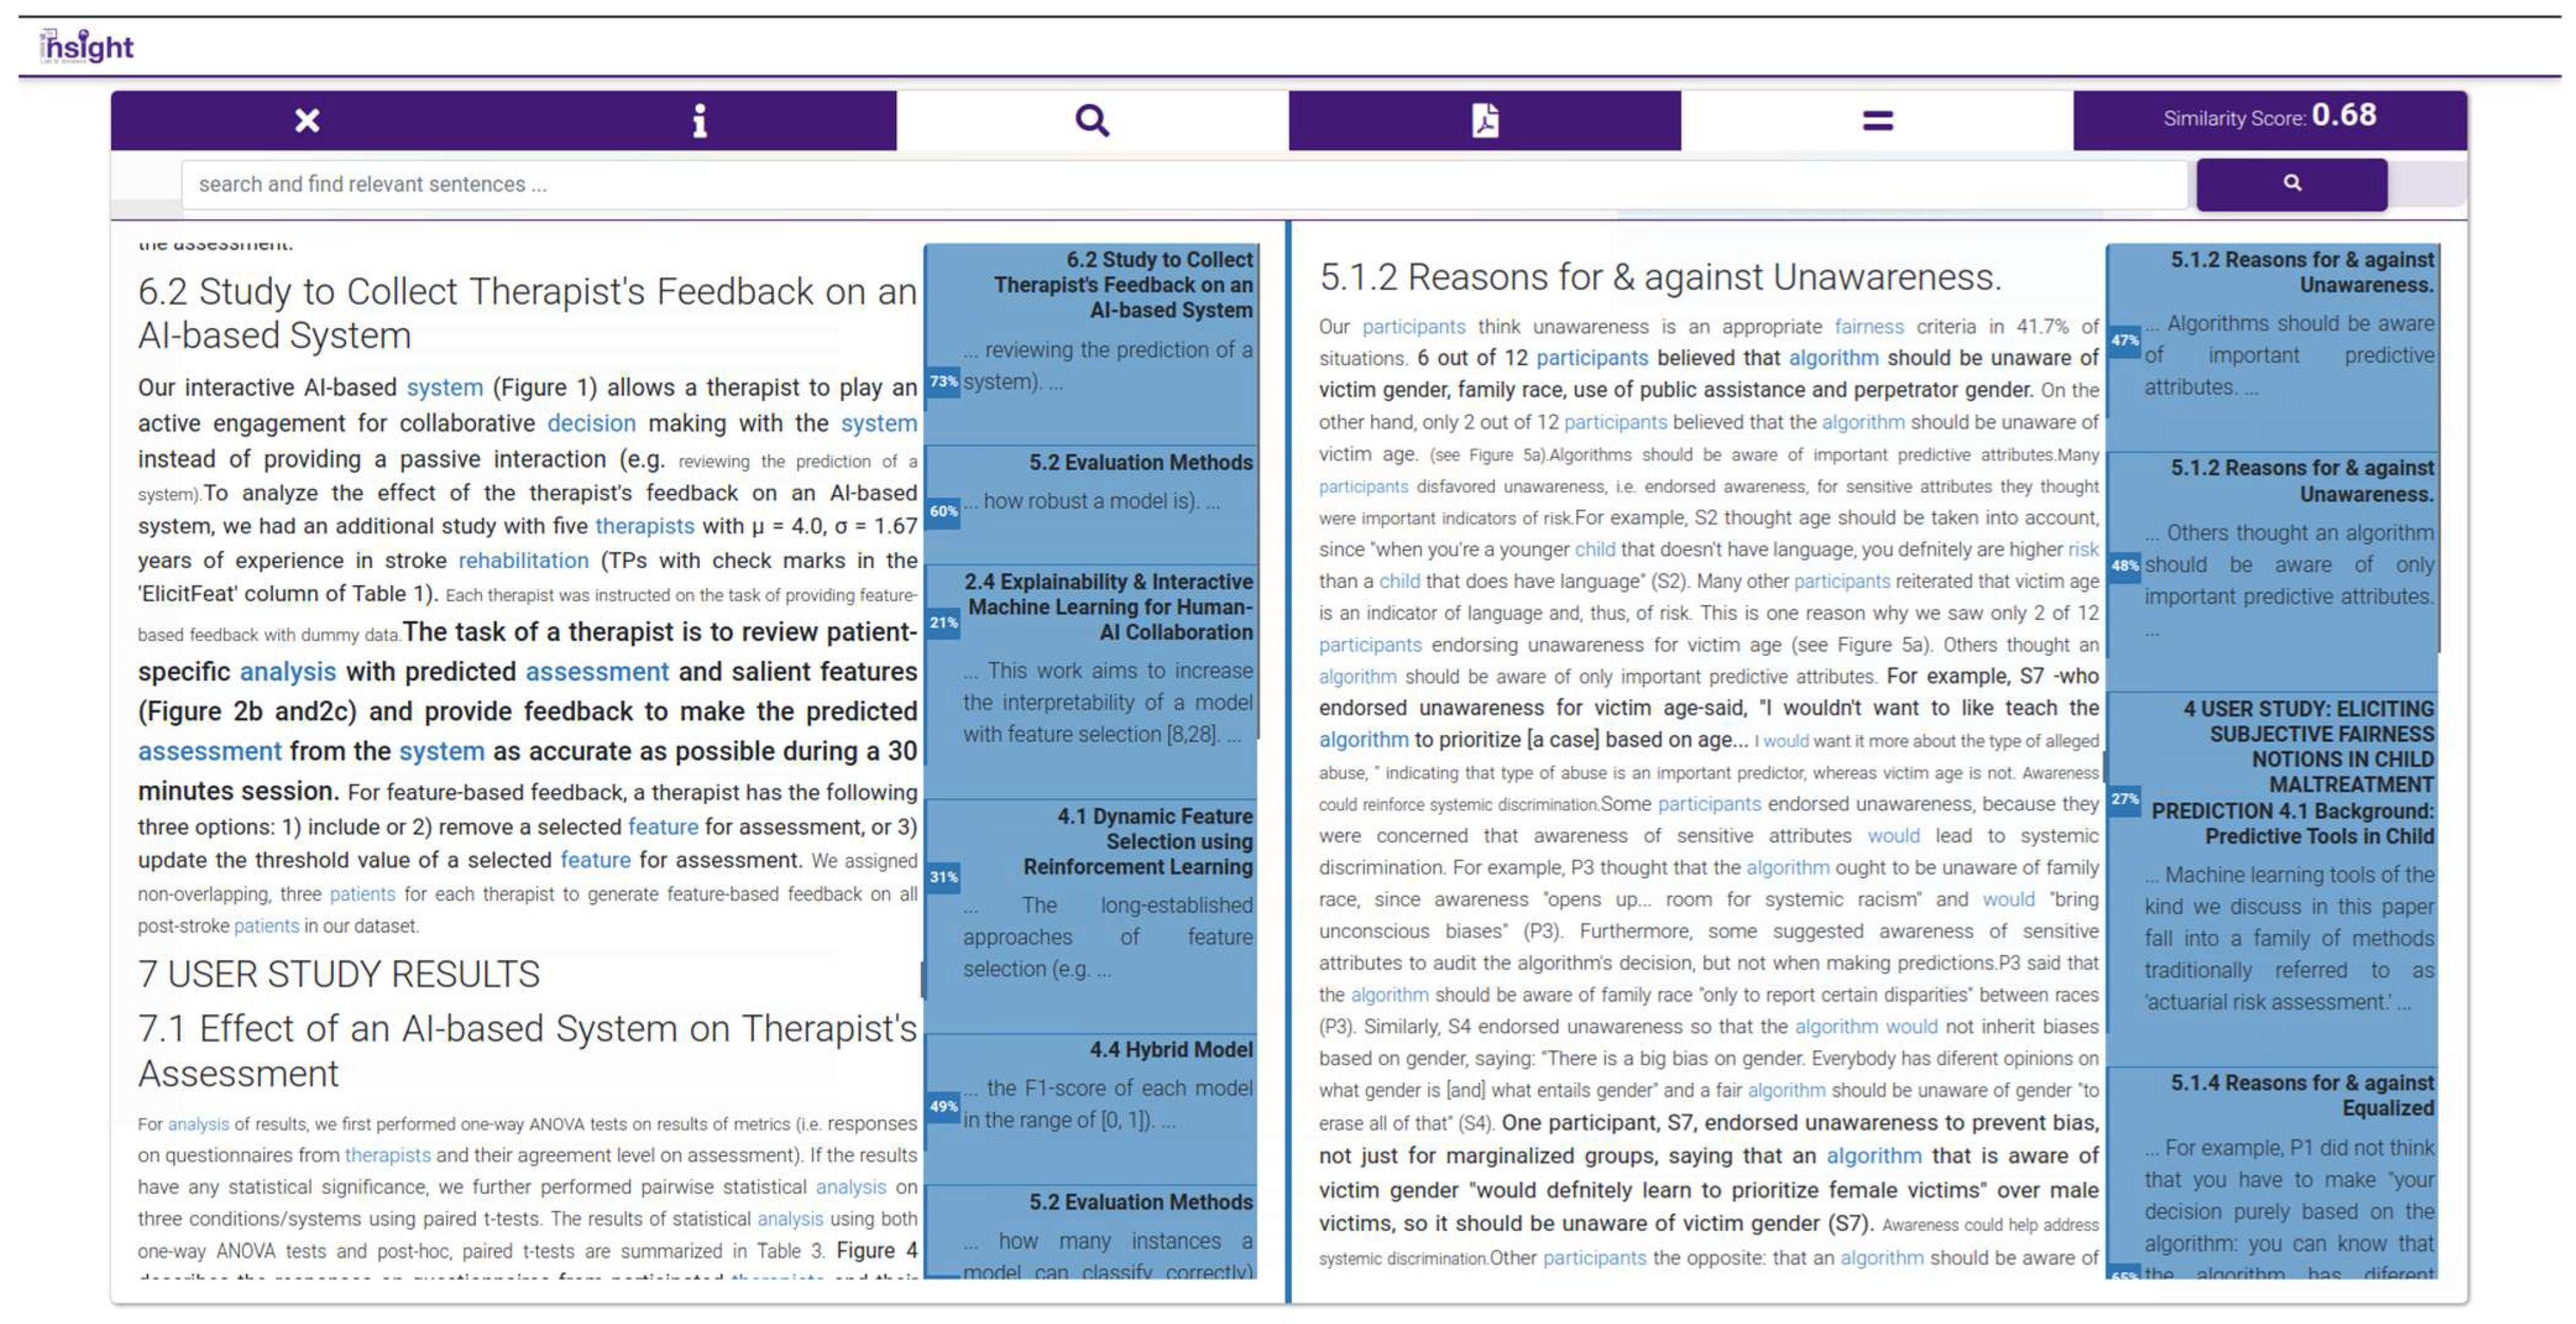
3.3.6. Compare
4. Usage Scenarios
4.1. A: Trends in AI Chatbots
- Q1.
- How popular have chatbots been in scholarly studies?
- Q2.
- What are the existing definitions proposed for chatbots?
- Q3.
- What are the main differences among the publications related to chatbots?
- Q4.
- Who are the notable researchers in this domain, and how different are their perspectives about chatbots?
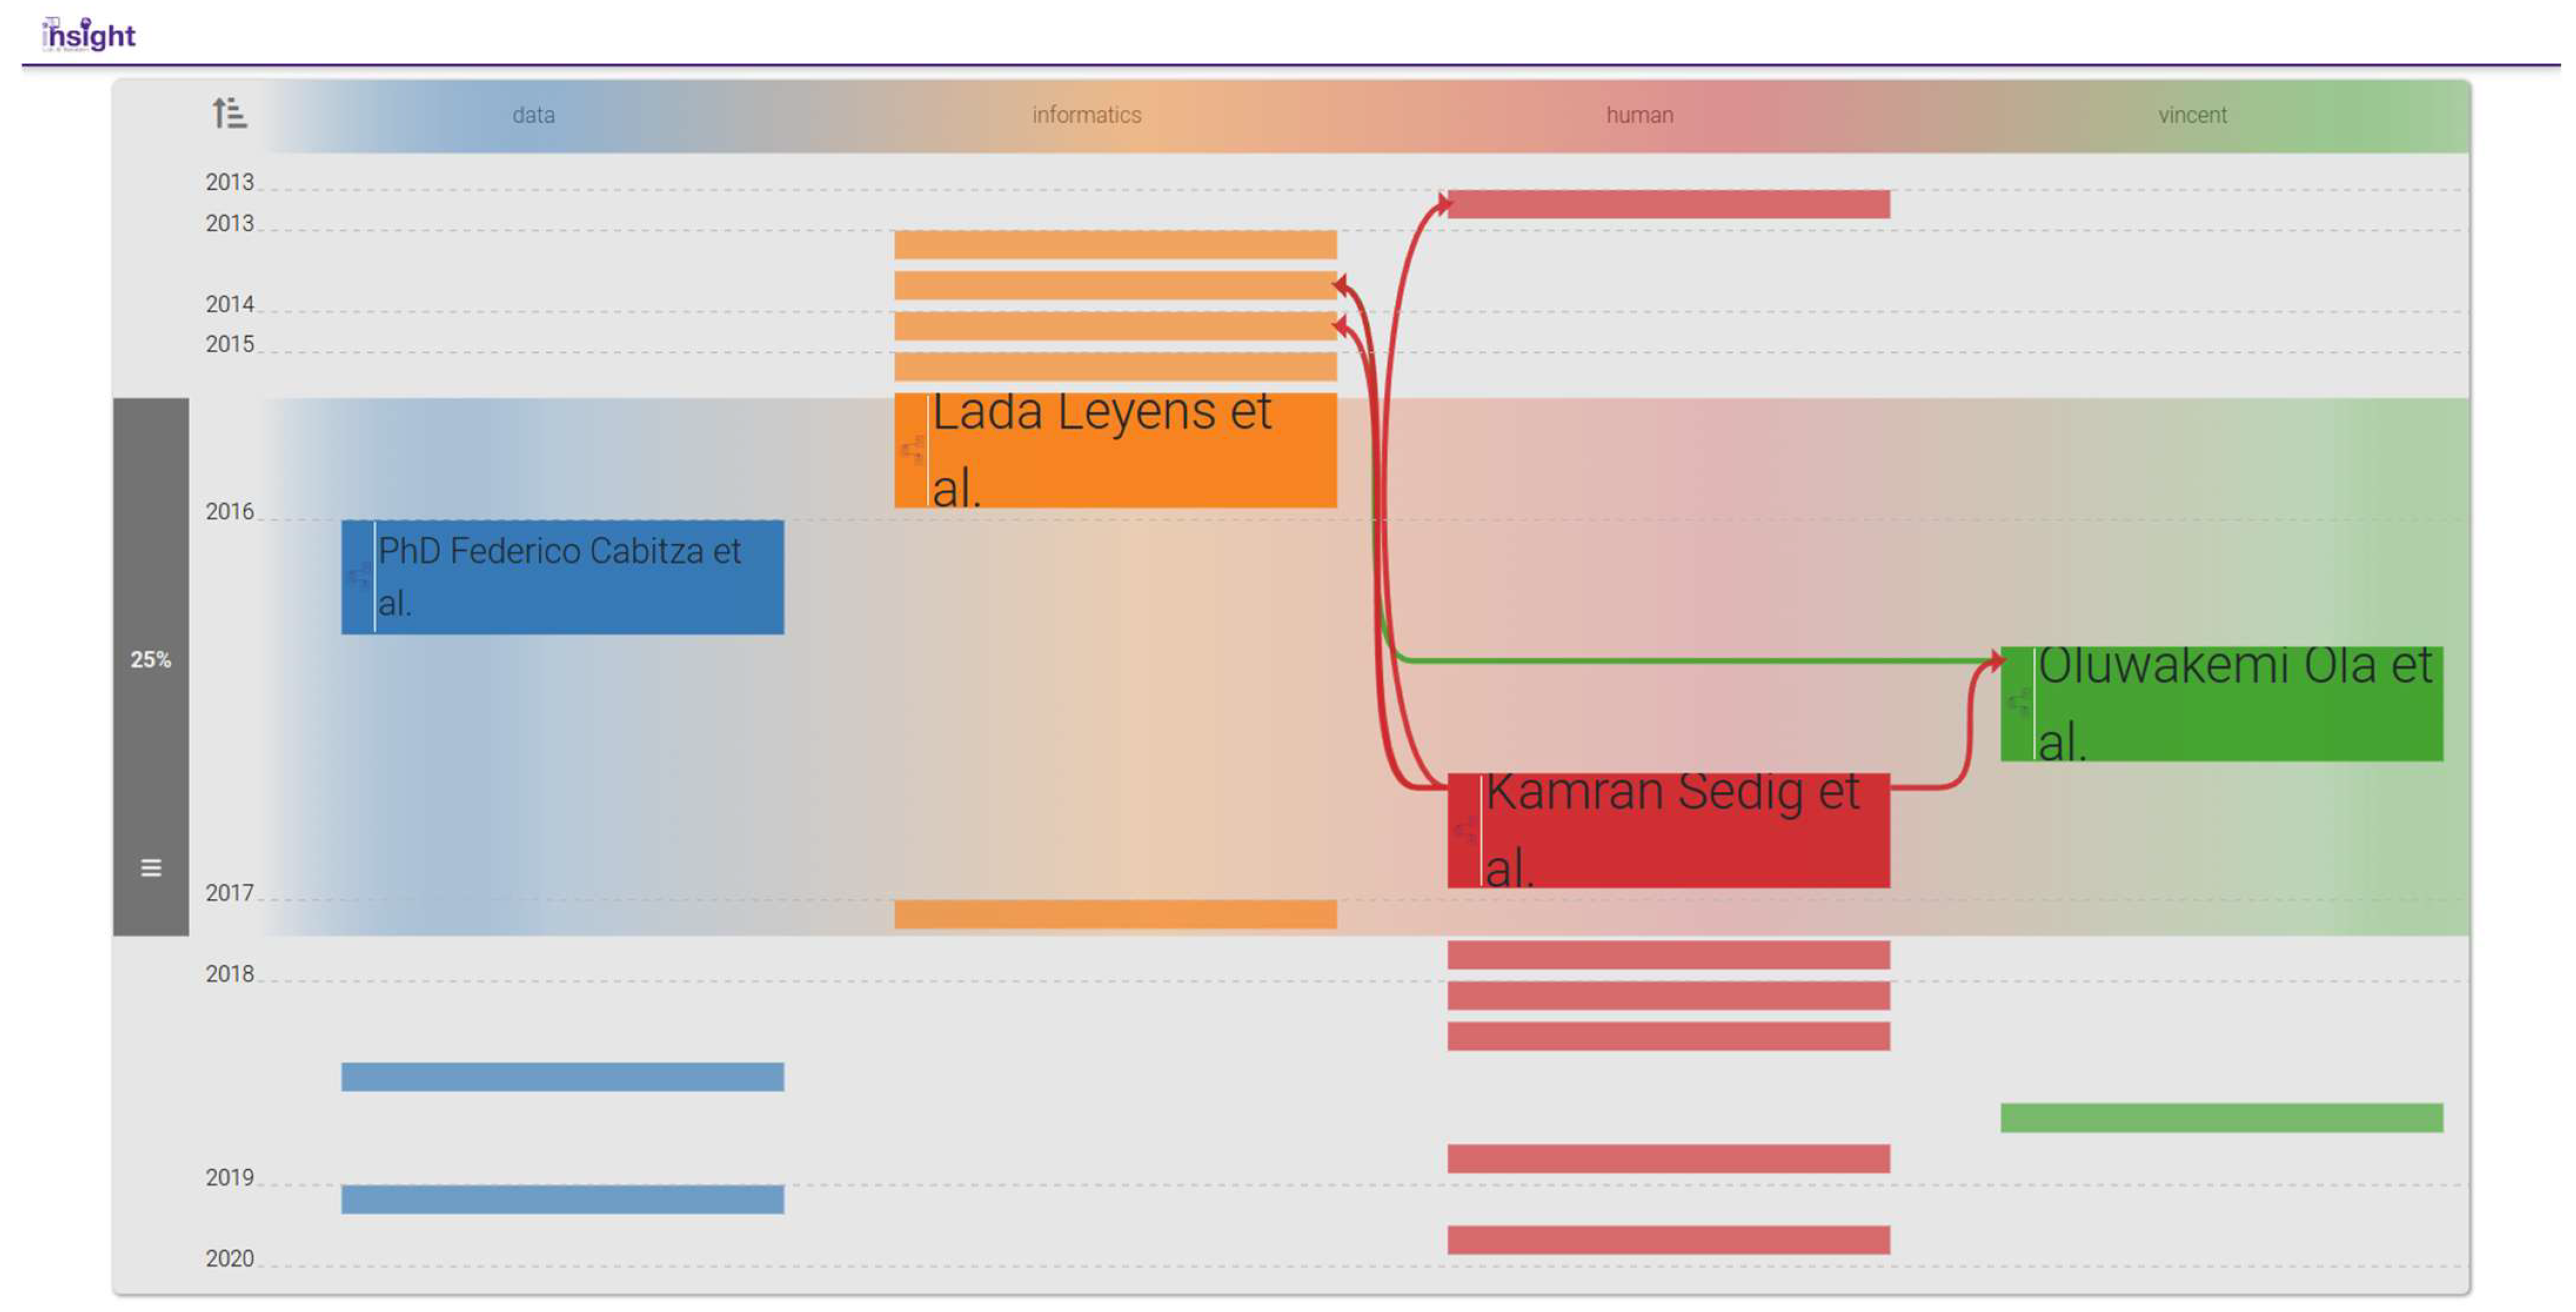
4.2. B: Evolution of AI-Adjacent Research in Recent CHI Proceedings
- Q1.
- What are the main themes covered in the documents?
- Q2.
- What is the contribution of influential works to each respective theme?
- Q3.
- What has been the application of AI in healthcare-related domains?
- Q4.
- How has the subject of “fairness” in predictive analysis been taken into consideration within healthcare-related applications of AI?
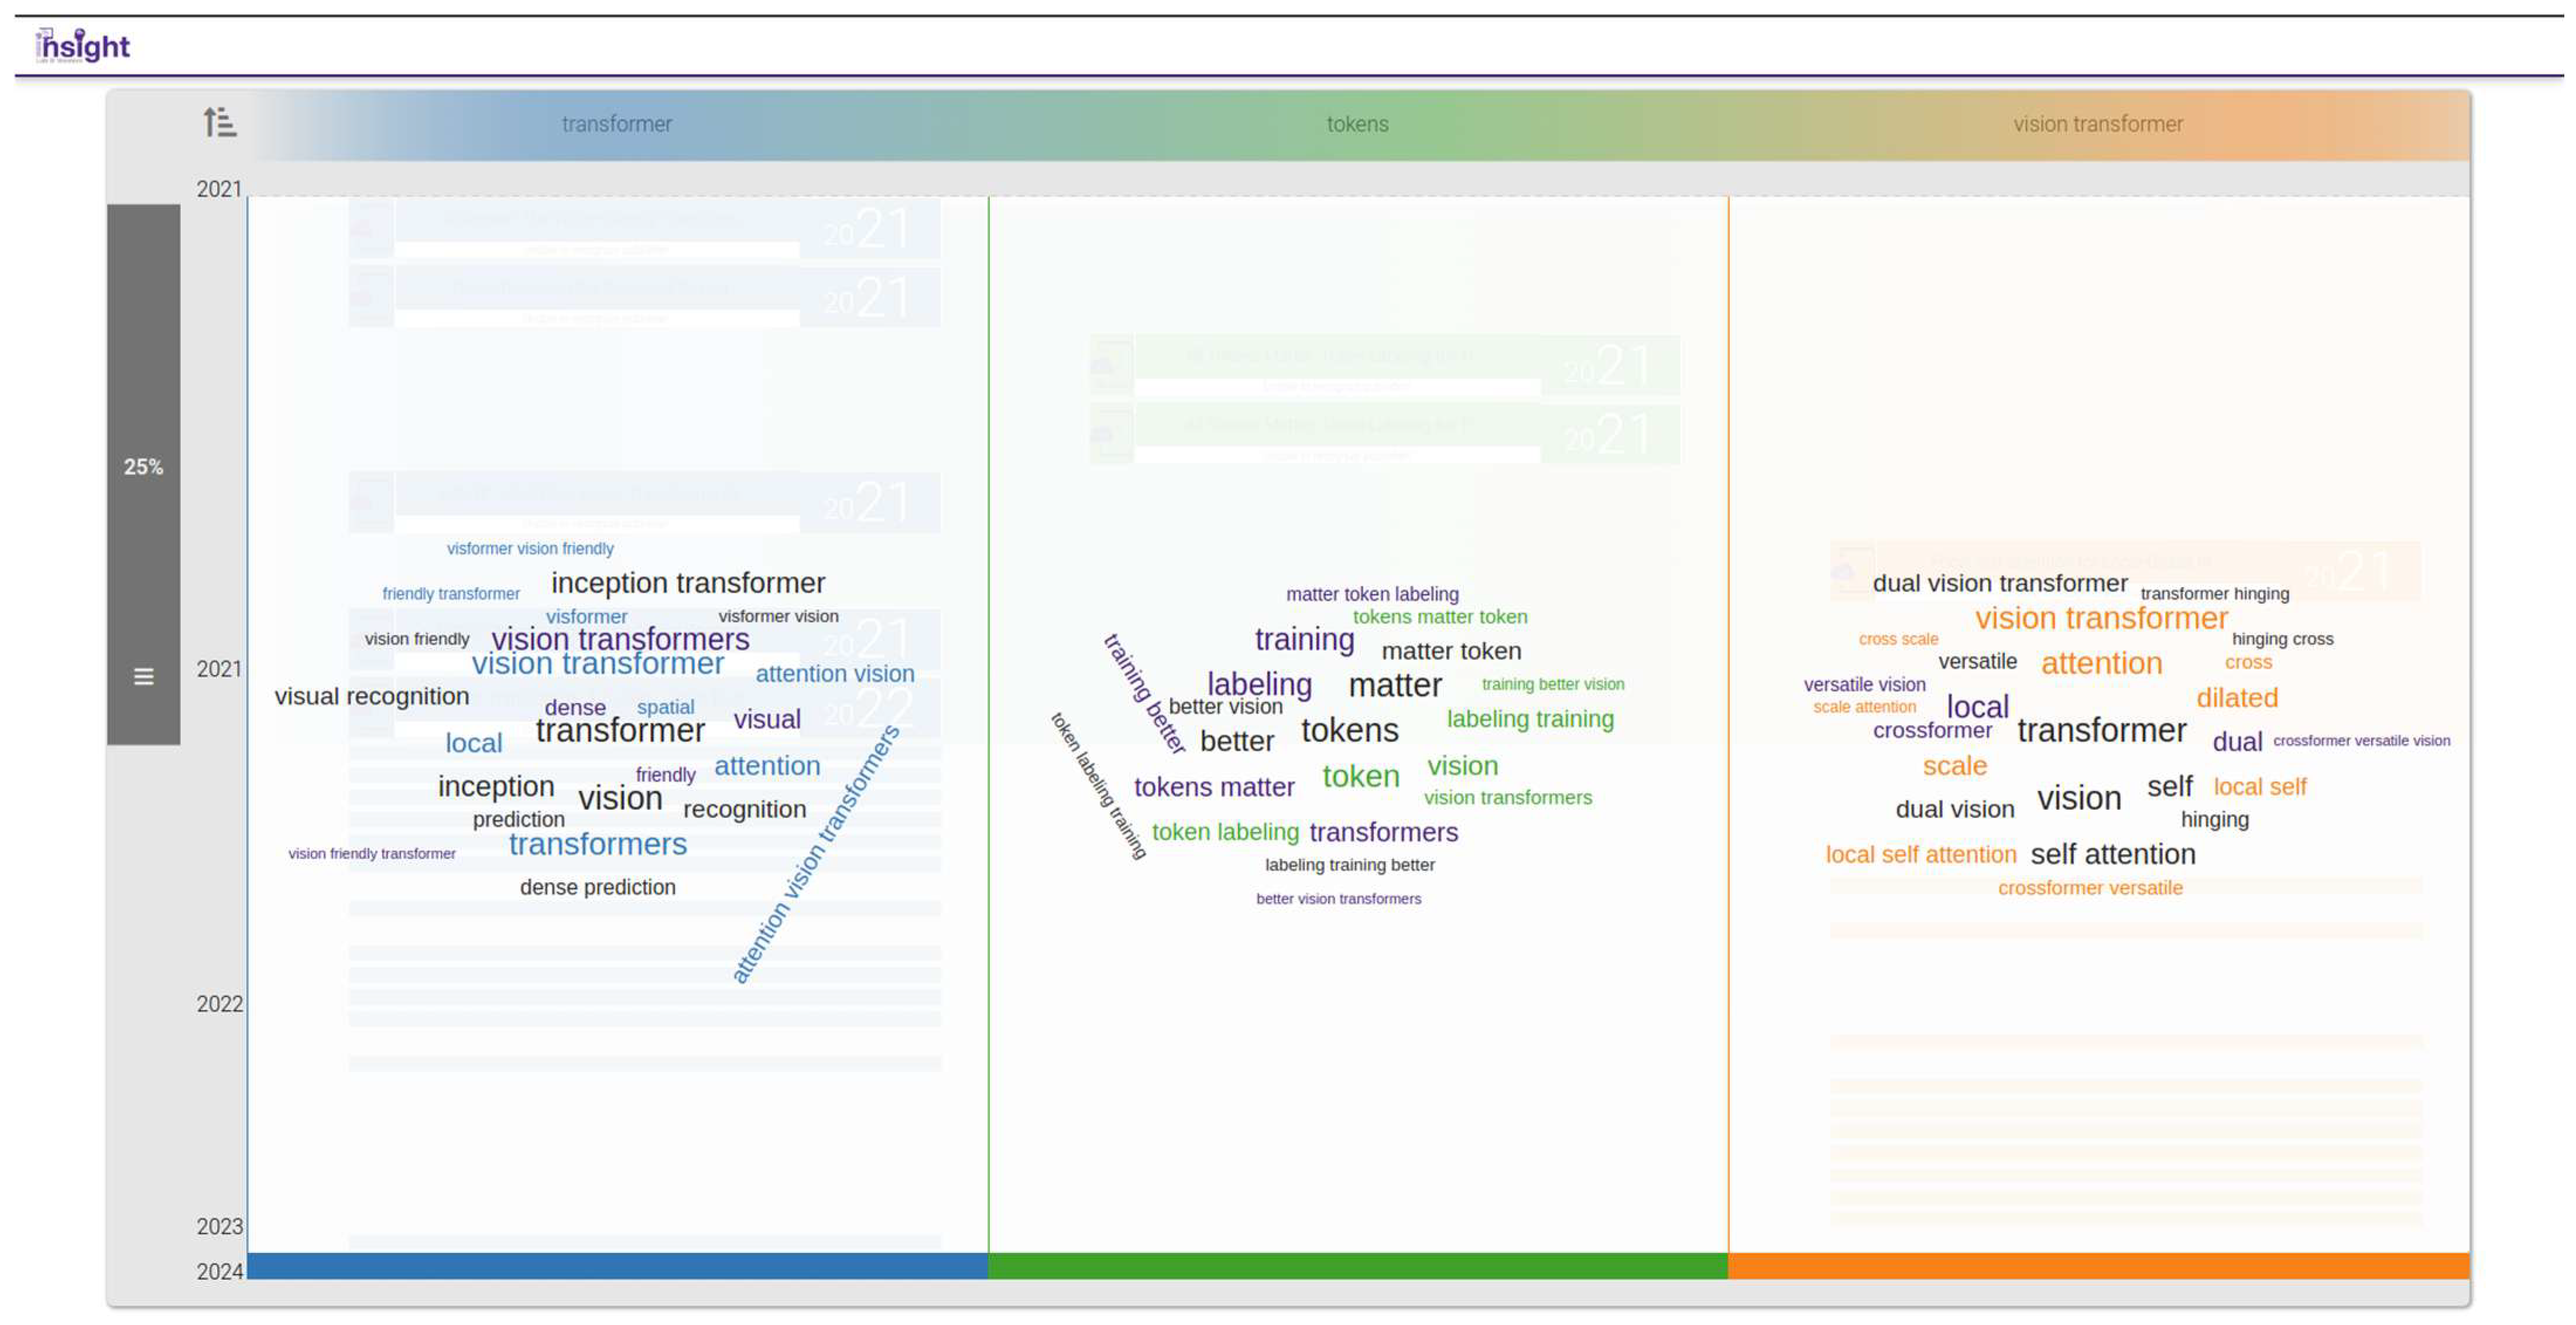
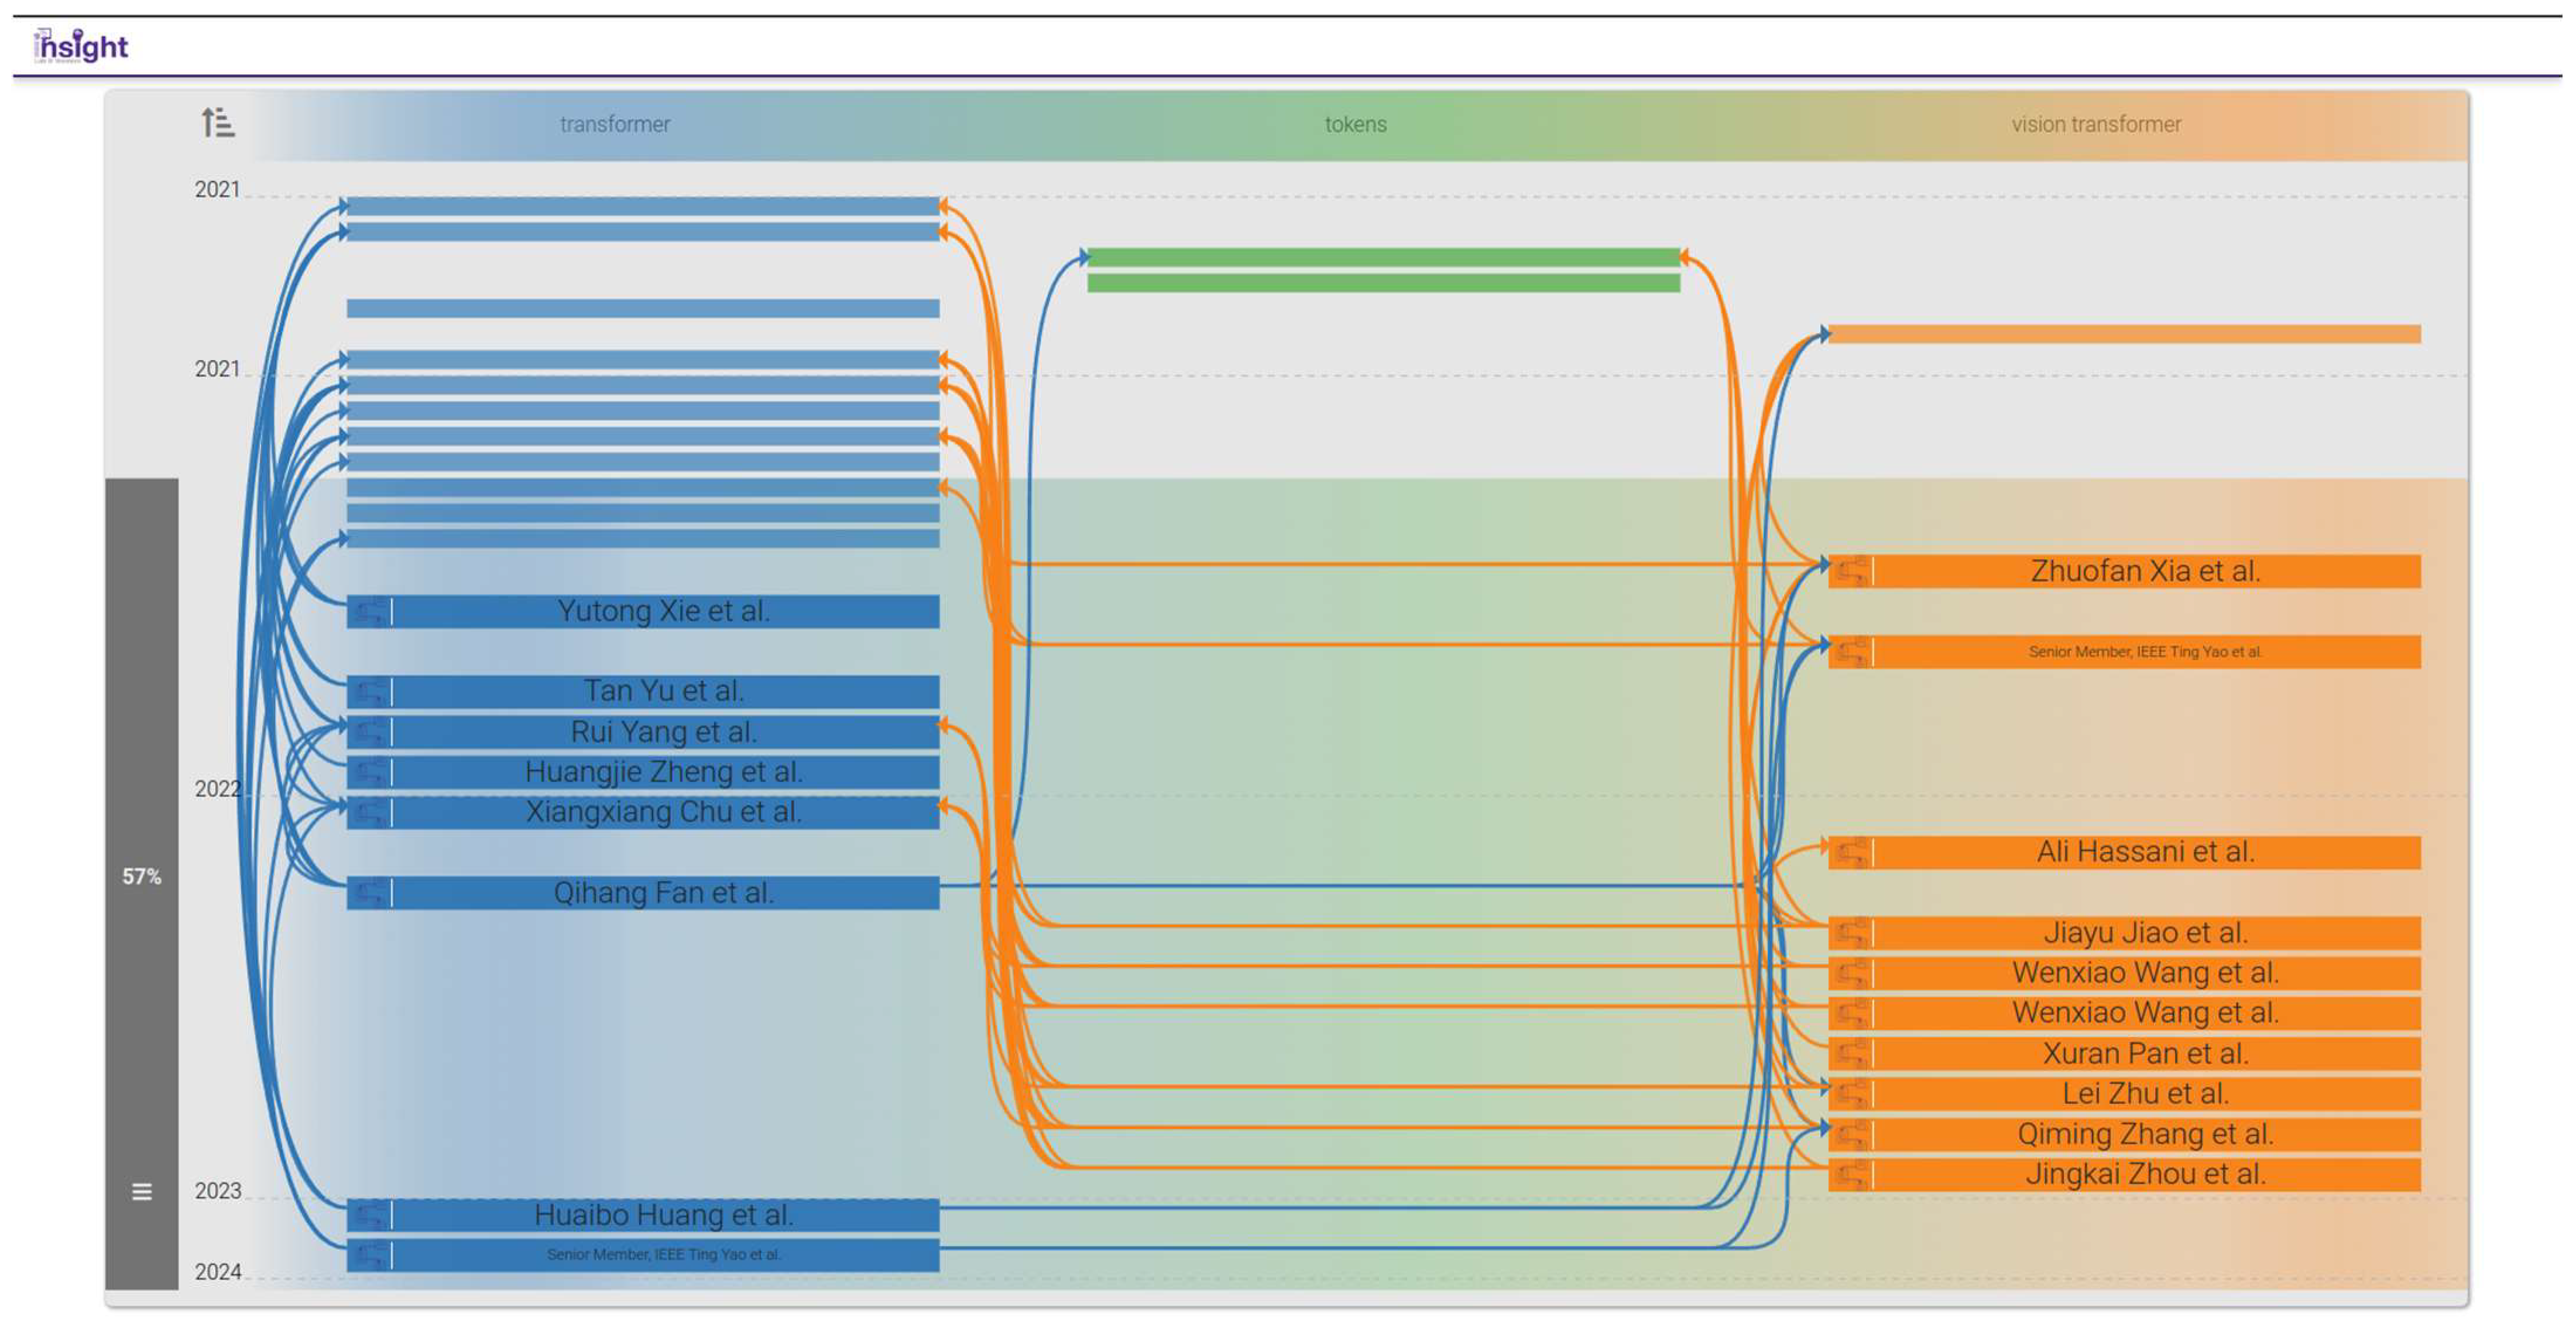
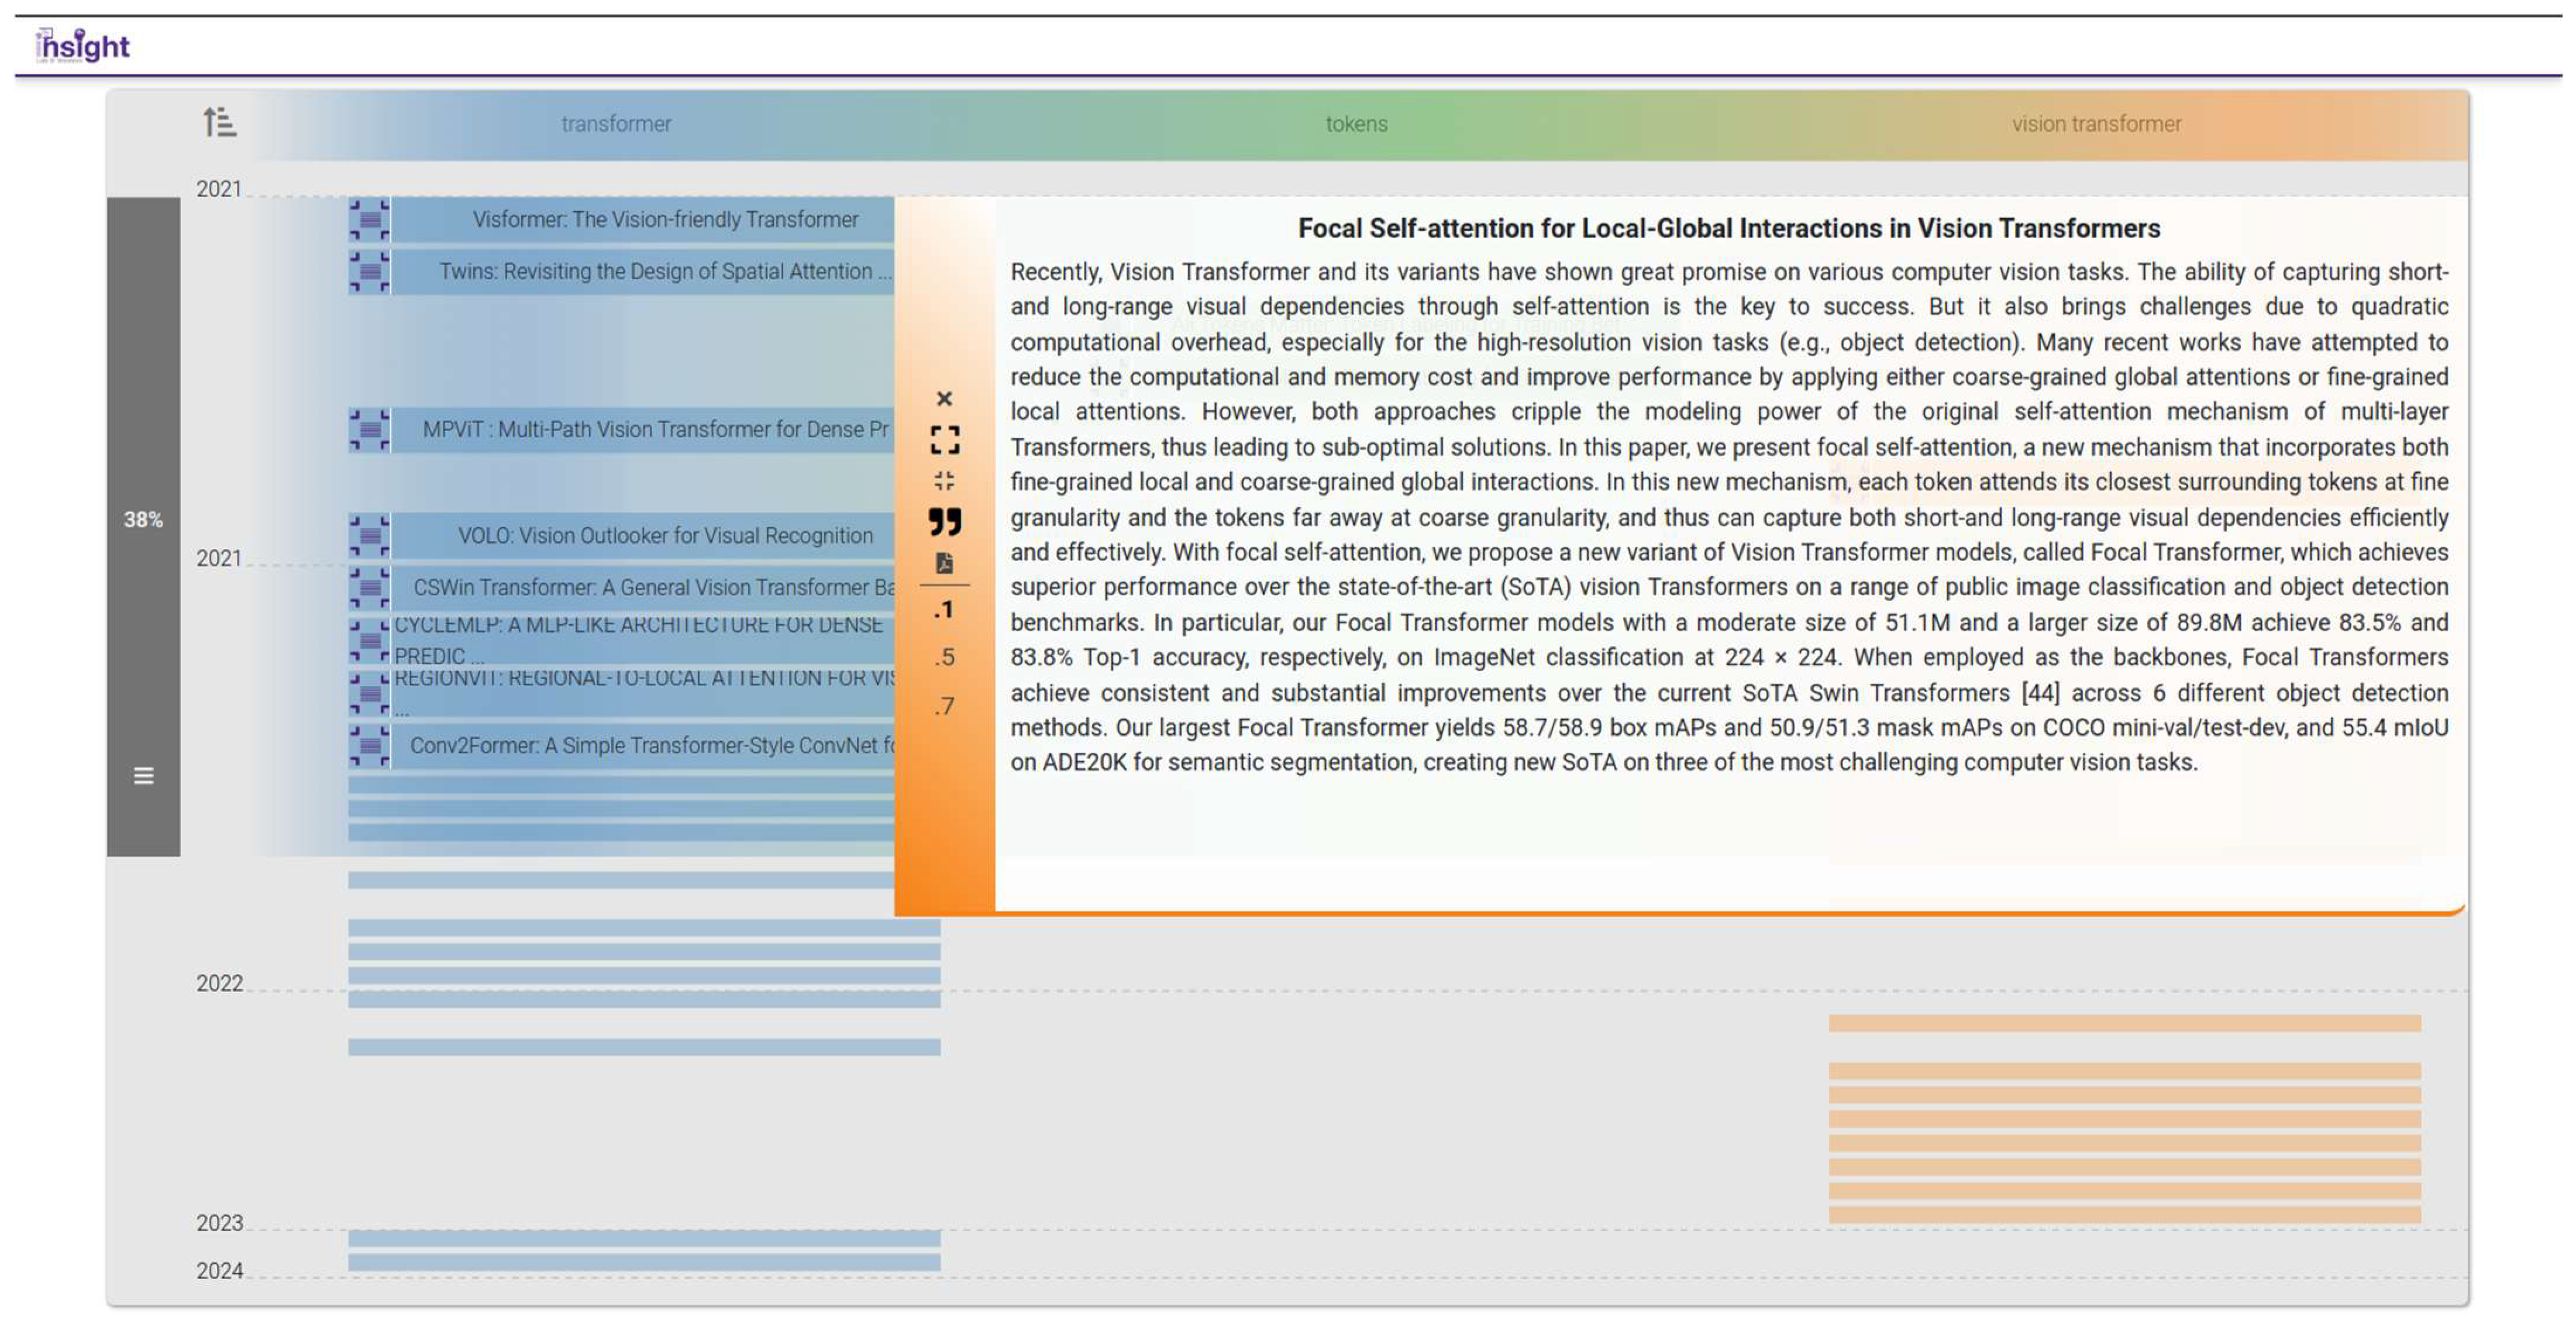
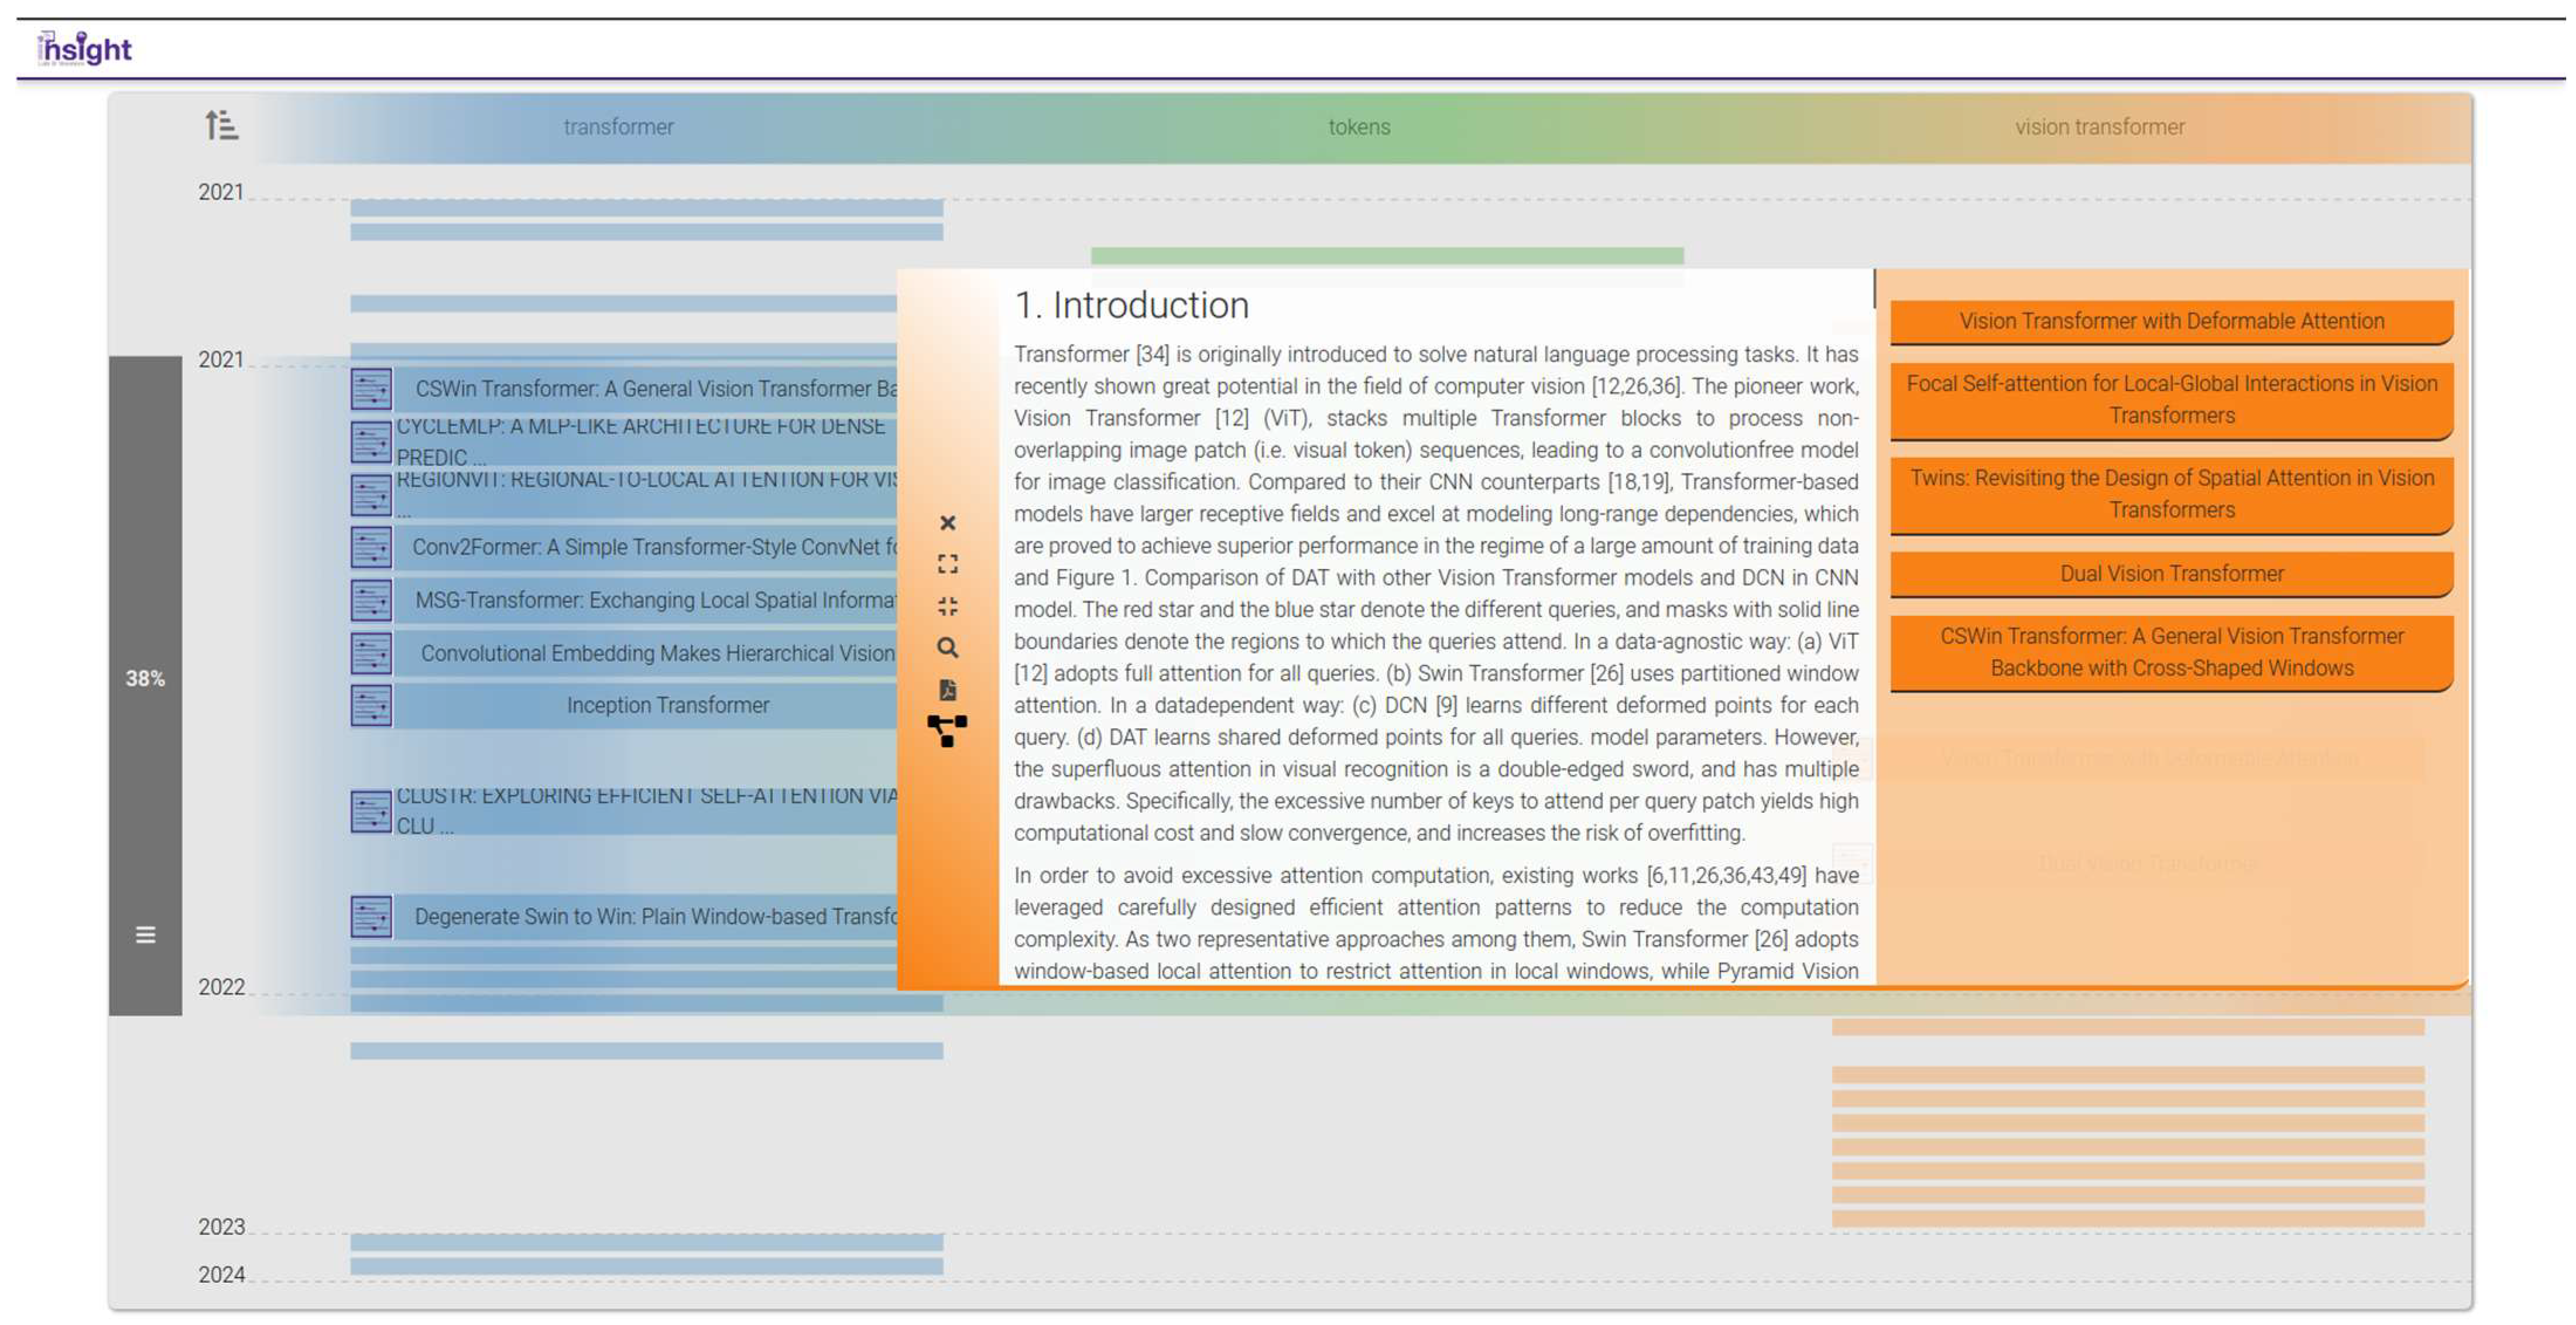
4.3. C: Neighborhood Attention Transformers
- Q1.
- How can the ideas used in each paper be traced back to an original source?
- Q2.
- How do Vision Transformers (ViTs) use the self-attention mechanism?
- Q3.
- Which documents harness self-attention in their proposed architectures?
5. Summary and Conclusions
Author Contributions
Funding
Institutional Review Board Statement
Informed Consent Statement
Data Availability Statement
Conflicts of Interest
References
- Noblit, G.W.; DwightHare, R. Meta-Ethnography; SAGE Publications, Inc.: Thousand Oaks, CA, USA, 1988; ISBN 978-1-4129-8500-0. [Google Scholar]
- Smela, B.; Toumi, M.; Świerk, K.; Francois, C.; Biernikiewicz, M.; Clay, E.; Boyer, L. Rapid Literature Review: Definition and Methodology. J. Mark. Access Health Policy 2023, 11, 2241234. [Google Scholar] [CrossRef]
- Pawson, R.; Greenhalgh, T.; Harvey, G.; Walshe, K. Realist Review—A New Method of Systematic Review Designed for Complex Policy Interventions. J. Health Serv. Res. Policy 2005, 10, 21–34. [Google Scholar] [CrossRef]
- The Rise and Rise of Realist Reviews? Available online: https://www.cebm.ox.ac.uk/news/views/the-rise-and-rise-of-realist-reviews (accessed on 4 September 2024).
- Sukhera, J. Narrative Reviews in Medical Education: Key Steps for Researchers. J. Grad. Med. Educ. 2022, 14, 418–419. Available online: https://meridian.allenpress.com/jgme/article/14/4/418/484915/Narrative-Reviews-in-Medical-Education-Key-Steps (accessed on 4 September 2024). [CrossRef] [PubMed]
- Publications Output:, U.S. Trends and International Comparisons|NSF—National Science Foundation. Available online: https://ncses.nsf.gov/pubs/nsb202333/publication-output-by-region-country-or-economy-and-by-scientific-field (accessed on 4 September 2024).
- The Scopus Content Coverage Guide: A Complete Overview of the Content Coverage in Scopus and Corresponding Policies|Elsevier Scopus Blog. Available online: https://blog.scopus.com/posts/the-scopus-content-coverage-guide-a-complete-overview-of-the-content-coverage-in-scopus-and (accessed on 4 September 2024).
- Malahov, V. The Open Science Movement: Causes, State of the Art, and Prospects for Development. Sci. Manag. Theory Pract. 2021, 3, 118. [Google Scholar] [CrossRef]
- Arksey, H.; O’Malley, L. Scoping Studies: Towards a Methodological Framework. Int. J. Soc. Res. Methodol. 2005, 8, 19–32. [Google Scholar] [CrossRef]
- Munn, Z.; Peters, M.D.J.; Stern, C.; Tufanaru, C.; McArthur, A.; Aromataris, E. Systematic Review or Scoping Review? Guidance for Authors When Choosing between a Systematic or Scoping Review Approach. BMC Med. Res. Methodol. 2018, 18, 143. [Google Scholar] [CrossRef] [PubMed]
- Pirolli, P.; Russell, D.M. Introduction to This Special Issue on Sensemaking. Hum.–Comput. Interact. 2011, 26, 1–8. [Google Scholar] [CrossRef]
- Furnas, G.W.; Russell, D.M. Making Sense of Sensemaking. In Proceedings of the CHI ’05 Extended Abstracts on Human Factors in Computing Systems, Portland, OR, USA, 2–7 April 2005; Association for Computing Machinery: New York, NY, USA, 2005; pp. 2115–2116. [Google Scholar]
- Russell, D.M.; Stefik, M.J.; Pirolli, P.; Card, S.K. The Cost Structure of Sensemaking. In Proceedings of the INTERACT ’93 and CHI ’93 Conference on Human Factors in Computing Systems, Amsterdam, The Netherlands, 24–29 April 1993; Association for Computing Machinery: New York, NY, USA, 1993; pp. 269–276. [Google Scholar]
- Buchel, O. Making Sense of Document Collections with Map-Based Visualizations. Ph.D. Thesis, Western University, London, ON, Canada, 2012; p. 523. [Google Scholar]
- Chalmers, I.; Hedges, L.V.; Cooper, H. A Brief History of Research Synthesis. Eval. Health Prof. 2002, 25, 12–37. [Google Scholar] [CrossRef]
- Higgins, J.P.T.; Thomas, J.; Chandler, J.; Cumpston, M.; Li, T.; Page, M.J.; Welch, V.A. (Eds.) Cochrane Handbook for Systematic Reviews of Interventions; Wiley Online Books: Hoboken, NJ, USA, 2019; Available online: https://onlinelibrary.wiley.com/doi/book/10.1002/9781119536604 (accessed on 4 September 2024).
- Levac, D.; Colquhoun, H.; O’Brien, K.K. Scoping Studies: Advancing the Methodology. Implement. Sci. 2010, 5, 69. [Google Scholar] [CrossRef]
- Peters, M.D.J.; Marnie, C.; Colquhoun, H.; Garritty, C.M.; Hempel, S.; Horsley, T.; Langlois, E.V.; Lillie, E.; O’Brien, K.K.; Tunçalp, Ö.; et al. Scoping Reviews: Reinforcing and Advancing the Methodology and Application. Syst. Rev. 2021, 10, 263. [Google Scholar] [CrossRef]
- Scoping Reviews—JBI Manual for Evidence Synthesis—JBI Global Wiki. Available online: https://jbi-global-wiki.refined.site/space/MANUAL/355862497/10.+Scoping+reviews (accessed on 4 September 2024).
- Sensecape: Enabling Multilevel Exploration and Sensemaking with Large Language Models|Proceedings of the 36th Annual ACM Symposium on User Interface Software and Technology. Available online: https://dl.acm.org/doi/10.1145/3586183.3606756 (accessed on 4 September 2024).
- Paziraei, M.; Motamedi, A. A Survey of Visualization Techniques for Digital Twins; Springer: Cham, Switzerland, 2024. [Google Scholar]
- Fortuna, B.; Grobelnik, M.; Mladenić, D. Visualization of Text Document Corpus. Inform. Slov. 2005, 29, 497–504. [Google Scholar]
- Sedig, K. Interactive Mathematical Visualisations: Frameworks, Tools and Studies; Springer: Cham, Switzerland, 2009; pp. 343–363. ISBN 978-1-84800-268-5. [Google Scholar]
- ISSA: Generic Pipeline, Knowledge Model and Visualization Tools to Help Scientists Search and Make Sense of a Scientific Archive|SpringerLink. Available online: https://link.springer.com/chapter/10.1007/978-3-031-19433-7_38 (accessed on 26 October 2024).
- Welcome to the OpenMinTeD Resources. Available online: https://openminted.github.io/ (accessed on 26 October 2024).
- Ouvrir la Science—Visa TM Project Badolato, A. Available online: https://www.ouvrirlascience.fr/visa-tm-project/ (accessed on 1 January 2025).
- Kettani, F.; Schneider, S.; Aubin, S.; Bossy, R.; François, C.; Jonquet, C.; Tchechmedjiev, A.; Toulet, A.; Nédellec, C. Projet VisaTM: L’interconnexion OpenMinTeD—AgroPortal—ISTEX, Un Exemple de Service de Text et Data Mining Pour Les Scientifiques Français. In Proceedings of the IC 2018—29es Journées Francophones d’Ingénierie des Connaissances, Sydney, Australia, 16–18 July 2018; Ranwez, S., Ed.; PFIA: Nancy, France, 2018; pp. 247–249. [Google Scholar]
- Benedetti, F.; Bergamaschi, S.; Po, L. Lodex: A Tool for Visual Querying Linked Open Data. In Proceedings of the 14th International Semantic Web Conference (ISWC-2015), Bethlehem, PA, USA, 11–15 October 2015. [Google Scholar]
- Covid-on-the-Web: Knowledge Graph and Services to Advance COVID-19 Research|SpringerLink. Available online: https://link.springer.com/chapter/10.1007/978-3-030-62466-8_19 (accessed on 26 October 2024).
- Gandee, T.J.; Glaze, S.C.; Giabbanelli, P.J. A Visual Analytics Environment for Navigating Large Conceptual Models by Leveraging Generative Artificial Intelligence. Mathematics 2024, 12, 1946. [Google Scholar] [CrossRef]
- Lo, K.; Shen, Z.; Newman, B.; Chang, J.; Authur, R.; Bransom, E.; Candra, S.; Chandrasekhar, Y.; Huff, R.; Kuehl, B.; et al. PaperMage: A Unified Toolkit for Processing, Representing, and Manipulating Visually-Rich Scientific Documents. In Proceedings of the 2023 Conference on Empirical Methods in Natural Language Processing: System Demonstrations, Singapore, 6–10 December 2023; Feng, Y., Lefever, E., Eds.; Association for Computational Linguistics: Singapore, 2023; pp. 495–507. [Google Scholar]
- Petersen, T.; Suryani, M.A.; Beth, C.; Patel, H.; Wallmann, K.; Renz, M. Geo-Quantities: A Framework for Automatic Extraction of Measurements and Spatial Context from Scientific Documents. In Proceedings of the 17th International Symposium on Spatial and Temporal Databases, Virtual, 23–25 August 2021; Association for Computing Machinery: New York, NY, USA, 2021; pp. 166–169. [Google Scholar]
- High-Performance Mining of COVID-19 Open Research Datasets for Text Classification and Insights in Cloud Computing Environments|IEEE Conference Publication|IEEE Xplore. Available online: https://ieeexplore.ieee.org/abstract/document/9302839 (accessed on 26 October 2024).
- Rumbut, J.; Fang, H.; Wang, H. Topic Modeling for Systematic Review of Visual Analytics in Incomplete Longitudinal Behavioral Trial Data. Smart Health 2020, 18, 100142. [Google Scholar] [CrossRef] [PubMed]
- Yan, Y.; Tao, Y.; Jin, S.; Xu, J.; Lin, H. An Interactive Visual Analytics System for Incremental Classification Based on Semi-Supervised Topic Modeling. In Proceedings of the 2019 IEEE Pacific Visualization Symposium (PacificVis), Bangkok, Thailand, 23–26 April 2019; pp. 148–157. [Google Scholar]
- Progressive Learning of Topic Modeling Parameters: A Visual Analytics Framework|IEEE Journals & Magazine|IEEE Xplore. Available online: https://ieeexplore.ieee.org/document/8019825 (accessed on 26 October 2024).
- VISTopic: A Visual Analytics System for Making Sense of Large Document Collections Using Hierarchical Topic Modeling—ScienceDirect. Available online: https://www.sciencedirect.com/science/article/pii/S2468502X17300074?via%3Dihub (accessed on 26 October 2024).
- Jiang, X.; Zhang, J. A Text Visualization Method for Cross-Domain Research Topic Mining. J. Vis. 2016, 19, 561–576. [Google Scholar] [CrossRef]
- Osborne, F.; Motta, E.; Mulholland, P. Exploring Scholarly Data with Rexplore. In Proceedings of the The Semantic Web—ISWC 2013, Sydney, Australia, 21–25 October 2013; Alani, H., Kagal, L., Fokoue, A., Groth, P., Biemann, C., Parreira, J.X., Aroyo, L., Noy, N., Welty, C., Janowicz, K., Eds.; Springer: Berlin, Heidelberg, 2013; pp. 460–477. [Google Scholar]
- Fried, D.; Kobourov, S.G. Maps of Computer Science. arXiv 2013, arXiv:1304.2681. [Google Scholar]
- Costagliola, G.; Fuccella, V. CyBiS: A Novel Interface for Searching Scientific Documents. In Proceedings of the 2011 15th International Conference on Information Visualisation, London, UK, 13–15 July 2011; pp. 276–281. [Google Scholar]
- Dou, W.; Wang, X.; Chang, R.; Ribarsky, W. ParallelTopics: A Probabilistic Approach to Exploring Document Collections. In Proceedings of the 2011 IEEE Conference on Visual Analytics Science and Technology (VAST), Providence, RI, USA, 23–28 October 2011; pp. 231–240. [Google Scholar]
- Roberts, J.C. State of the Art: Coordinated & Multiple Views in Exploratory Visualization. In Proceedings of the Fifth International Conference on Coordinated and Multiple Views in Exploratory Visualization (CMV 2007), Zurich, Switzerland, 2 July 2007; pp. 61–71. [Google Scholar]
- Hauser, H. Generalizing Focus+Context Visualization. In Scientific Visualization: The Visual Extraction of Knowledge from Data; Bonneau, G.-P., Ertl, T., Nielson, G.M., Eds.; Springer: Berlin, Heidelberg, 2006; pp. 305–327. [Google Scholar]
- Sengar, S.S.; Hasan, A.B.; Kumar, S.; Carroll, F. Generative Artificial Intelligence: A Systematic Review and Applications. Multimed. Tools Appl. 2024. [Google Scholar] [CrossRef]
- Ge, L.; Agrawal, R.; Singer, M.; Kannapiran, P.; De Castro Molina, J.A.; Teow, K.L.; Yap, C.W.; Abisheganaden, J.A. Leveraging Artificial Intelligence to Enhance Systematic Reviews in Health Research: Advanced Tools and Challenges. Syst. Rev. 2024, 13, 269. [Google Scholar] [CrossRef]
- Affengruber, L.; van der Maten, M.M.; Spiero, I.; Nussbaumer-Streit, B.; Mahmić-Kaknjo, M.; Ellen, M.E.; Goossen, K.; Kantorova, L.; Hooft, L.; Riva, N.; et al. An Exploration of Available Methods and Tools to Improve the Efficiency of Systematic Review Production: A Scoping Review. BMC Med. Res. Methodol. 2024, 24, 210. [Google Scholar] [CrossRef]
- Ateeq, A.; Alzoraiki, M.; Milhem, M.; Ateeq, R.A. Artificial Intelligence in Education: Implications for Academic Integrity and the Shift toward Holistic Assessment. Front. Educ. 2024, 9, 1470979. [Google Scholar] [CrossRef]
- Khalifa, M.; Albadawy, M. Using Artificial Intelligence in Academic Writing and Research: An Essential Productivity Tool. Comput. Methods Programs Biomed. Update 2024, 5, 100145. [Google Scholar] [CrossRef]
- Chubb, J.; Cowling, P.; Reed, D. Speeding up to Keep up: Exploring the Use of AI in the Research Process. AI Soc. 2022, 37, 1439–1457. [Google Scholar] [CrossRef] [PubMed]
- Holzinger, A.; Zatloukal, K.; Müller, H. Is Human Oversight to AI Systems Still Possible? New Biotechnol. 2025, 85, 59–62. [Google Scholar] [CrossRef] [PubMed]
- Hassija, V.; Chamola, V.; Mahapatra, A.; Singal, A.; Goel, D.; Huang, K.; Scardapane, S.; Spinelli, I.; Mahmud, M.; Hussain, A. Interpreting Black-Box Models: A Review on Explainable Artificial Intelligence. Cogn. Comput. 2024, 16, 45–74. [Google Scholar] [CrossRef]
- Marey, A.; Arjmand, P.; Alerab, A.D.S.; Eslami, M.J.; Saad, A.M.; Sanchez, N.; Umair, M. Explainability, Transparency and Black Box Challenges of AI in Radiology: Impact on Patient Care in Cardiovascular Radiology. Egypt. J. Radiol. Nucl. Med. 2024, 55, 183. [Google Scholar] [CrossRef]
- Gruenhagen, J.H.; Sinclair, P.M.; Carroll, J.-A.; Baker, P.R.A.; Wilson, A.; Demant, D. The Rapid Rise of Generative AI and Its Implications for Academic Integrity: Students’ Perceptions and Use of Chatbots for Assistance with Assessments. Comput. Educ. Artif. Intell. 2024, 7, 100273. [Google Scholar] [CrossRef]
- Butson, R.; Spronken-Smith, R. AI and Its Implications for Research in Higher Education: A Critical Dialogue. High. Educ. Res. Dev. 2024, 43, 563–577. [Google Scholar] [CrossRef]
- Aldoseri, A.; Al-Khalifa, K.N.; Hamouda, A.M. Re-Thinking Data Strategy and Integration for Artificial Intelligence: Concepts, Opportunities, and Challenges. Appl. Sci. 2023, 13, 7082. [Google Scholar] [CrossRef]
- BaHammam, A.S. Balancing Innovation and Integrity: The Role of AI in Research and Scientific Writing. Nat. Sci. Sleep 2023, 15, 1153–1156. [Google Scholar] [CrossRef]
- The Thorny Issue of Data Ownership|Entertainment and Media Guide to AI|Perspectives|Reed Smith LLP. Available online: https://www.reedsmith.com/en/perspectives/ai-in-entertainment-and-media/2024/02/the-thorny-issue-of-data-ownership (accessed on 8 March 2025).
- GROBID Documentation. Available online: https://grobid.readthedocs.io/en/latest/ (accessed on 21 March 2024).
- Cohan, A.; Feldman, S.; Beltagy, I.; Downey, D.; Weld, D.S. SPECTER: Document-Level Representation Learning Using Citation-Informed Transformers. In Proceedings of the 58th Annual Meeting of the Association for Computational Linguistics; Association for Computational Linguistics, Online, 5–10 July 2020; Available online: https://aclanthology.org/2020.acl-main.207/ (accessed on 21 March 2024).
- Anish-M-Code/pdftotext: A Simple Pdftotext Conversion Tool. Available online: https://github.com/Anish-M-code/pdftotext (accessed on 1 January 2025).
- Welcome to pdfminer.six’s Documentation! Available online: https://pdfminersix.readthedocs.io/en/latest/ (accessed on 1 January 2025).
- Apache PDFBox|A Java PDF Library. Available online: https://pdfbox.apache.org/ (accessed on 5 September 2024).
- Data Visualization for Making Sense of Scientific Literature|IEEE Conference Publication|IEEE Xplore. Available online: https://ieeexplore.ieee.org/document/9109976 (accessed on 21 March 2024).
- Furnas, G.W. Generalized Fisheye Views. ACM SIGCHI Bull. 1986, 17, 16–23. [Google Scholar] [CrossRef]
- Connected Papers|Find and Explore Academic Papers. Available online: https://www.connectedpapers.com/ (accessed on 24 October 2024).
| Focus Area | Systematic Review Goals | Scoping Review Goals |
|---|---|---|
| Broad research questions | Classify existing body of knowledge regarding a particular research question | Characterization of research methodologies used within the literature |
| Particular research questions | Identify and investigate conflicting results | Clarify key concepts within the literature |
| Evidence | Uncover emerging evidence for a hypothesis | Identify a typology of evidence |
| Knowledge gaps | Identify and inform future research possibilities | Identify possible knowledge gaps within a domain |
| Outcome | Typology(ies) of existing research | Assessment of relevancy for a future systematic review |
| Traditional Literature Reviews | Systematic Reviews | Scoping Reviews | |
|---|---|---|---|
| Rigorous review protocol | No | Yes | Yes (some) |
| Explicit, transparent, peer-reviewed search strategy | No | Yes | Yes |
| Standardized data extraction forms | No | Yes | Yes |
| Critical appraisal (risk of bias assessment) | No | Yes | No |
| Synthesis and generation of summaries | No | Yes | No |
| Visual Analytics System | Visualization Module(s) | Year |
|---|---|---|
| A visual analytics environment for navigating large conceptual models by leveraging generative artificial intelligence [30] | Conceptual models extracted from a document | 2024 |
| PaperMage [31] | Text annotation in and extraction from individual documents | 2023 |
| ISSA [24] | Topical inter-document relationships; individual document metadata | 2022 |
| Geo-quantities [32] | Numerical properties from individual documents | 2021 |
| An Aneka-based system for COVID-19 datasets [33] | Aggregate statistics of a document archive | 2020 |
| Topic modeling for systematic review of visual analytics in incomplete longitudinal behavioral trial data [34] | Topic modeling; longitudinal information of a document | 2020 |
| An interactive visual analytics system for incremental classification based on semi-supervised topic modeling [35] | Intra-document topic modeling | 2019 |
| Progressive learning of topic modeling parameters [36] | Intra-document topic modeling; reinforcement learning | 2018 |
| VISTopic [37] | Intra-document hierarchical topic modeling | 2017 |
| A system for cross-domain topic mining [38] | Topic modeling/mining | 2016 |
| Rexplore [39] | Topic modeling/similarity | 2013 |
| Maps of computer science [40] | Intra-document topic modeling; bibliographic information modeling | 2013 |
| CyBiS [41] | Bibliographic information | 2011 |
| ParallelTopics [42] | Topic modeling | 2011 |
| Principle | Summarized Definition | Key Focus |
|---|---|---|
| Sensemaking Loop | Iterative process of interacting with data to derive meaning. | Iterative interactions |
| Schneiderman’s Mantra | “Overview first, zoom and filter, then details on demand” | Structured and disciplined exploration |
| Focus + Context | Simultaneous visualization of a focused data item and its context | Contextualizing details |
| Details on Demand | Providing details only when requested | Preventing information overload |
| Scenario | Document Count | Topics Identified (K in K-Means) | Reduced Dimensions Count (PCA) | K: Silhouette Score Per K |
|---|---|---|---|---|
| A (Section 4.1) | 112 | 2 | 40 | 2: 0.21172 3: 0.11393 4: 0.10214 5: 0.09852 6: 0.10178 |
| B (Section 4.2) | 115 | 3 | 94 | 2: 0.06488 3: 0.06674 4: 0.06490 5: 0.06032 6: 0.05822 |
| C (Section 4.3) | 40 | 3 | 28 | 2: 0.05757 3: 0.11113 4: 0.10935 5: 0.10833 6: 0.06936 |
Disclaimer/Publisher’s Note: The statements, opinions and data contained in all publications are solely those of the individual author(s) and contributor(s) and not of MDPI and/or the editor(s). MDPI and/or the editor(s) disclaim responsibility for any injury to people or property resulting from any ideas, methods, instructions or products referred to in the content. |
© 2025 by the authors. Licensee MDPI, Basel, Switzerland. This article is an open access article distributed under the terms and conditions of the Creative Commons Attribution (CC BY) license (https://creativecommons.org/licenses/by/4.0/).
Share and Cite
Haghighati, A.; Haghverdi, A.R.; Sedig, K. VICTORIOUS: A Visual Analytics System for Scoping Review of Document Sets. Multimodal Technol. Interact. 2025, 9, 37. https://doi.org/10.3390/mti9050037
Haghighati A, Haghverdi AR, Sedig K. VICTORIOUS: A Visual Analytics System for Scoping Review of Document Sets. Multimodal Technologies and Interaction. 2025; 9(5):37. https://doi.org/10.3390/mti9050037
Chicago/Turabian StyleHaghighati, Amir, Amir Reza Haghverdi, and Kamran Sedig. 2025. "VICTORIOUS: A Visual Analytics System for Scoping Review of Document Sets" Multimodal Technologies and Interaction 9, no. 5: 37. https://doi.org/10.3390/mti9050037
APA StyleHaghighati, A., Haghverdi, A. R., & Sedig, K. (2025). VICTORIOUS: A Visual Analytics System for Scoping Review of Document Sets. Multimodal Technologies and Interaction, 9(5), 37. https://doi.org/10.3390/mti9050037