Article

Interactive Visualizations of Transparent User Models for Self-Actualization: A Human-Centered Design Approach

Social Computing Group, Faculty of Engineering, University of Duisburg-Essen, 47048 Duisburg, Germany
*
Author to whom correspondence should be addressed.
Multimodal Technol. Interact. 2022, 6(6), 42; https://doi.org/10.3390/mti6060042
Submission received: 14 April 2022 / Revised: 20 May 2022 / Accepted: 23 May 2022 / Published: 30 May 2022
(This article belongs to the Special Issue Explainable User Models)

Abstract

:
This contribution sheds light on the potential of transparent user models for self-actualization. It discusses the development of EDUSS, a conceptual framework for self-actualization goals of transparent user modeling. Drawing from a qualitative research approach, the framework investigates self-actualization from psychology and computer science disciplines and derives a set of self-actualization goals and mechanisms. Following a human-centered design (HCD) approach, the framework was applied in an iterative process to systematically design a set of interactive visualizations to help users achieve different self-actualization goals in the scientific research domain. For this purpose, an explainable user interest model within a recommender system is utilized to provide various information on how the interest models are generated from users’ publication data. The main contributions are threefold: First, a synthesis of research on self-actualization from different domains. Second, EDUSS, a theoretically-sound self-actualization framework for transparent user modeling consisting of five main goals, namely, Explore, Develop, Understand, Scrutinize, and Socialize. Third, an instantiation of the proposed framework to effectively design interactive visualizations that can support the different self-actualization goals, following an HCD approach.

1. Introduction

User modeling has been used in many disciplines such as e-commerce, e-learning, business, advertisements, digital marketing, adaptive systems, and recommender systems (RS) to fulfill a unified aim which is to have a digital representation of the current and/or potential users in order to provide relevant content to them. Working on improving this process and enriching it with various features has been ongoing since its first emergence till today. Among these features, openness, scrutability, and explainability are the most investigated ones by researchers from different disciplines in view of their significant impact on the user’s perception of the systems and the outcomes provided by these systems. Opening the user model means allowing users to see how the system is perceiving them in a human-understandable form, which will lead to several benefits such as improving the accuracy of the model [1]. Scrutinizing the user model is a concept built on top of openness and is related to user control in a sense that in addition to letting the users inspect their models, they are provided with a feature of interacting with their models with different levels of interactivity [1]. Explaining the user model consists of providing explanations about how these models were generated. In a recommendation context, explaining the user model can enable or improve the scrutability of the RS, that is, allowing users to tell the system if it is wrong [2]. By increasing users’ understanding of how their user models contribute to the resulting RS outcomes, it helps them feel in control of their recommendations, thereby enhancing their experience of the RS [3].
Seeing that user modeling is heavily related to personalization, user models could face one of the most known issues in this regard which is the filter bubble problem, i.e., trapping the users in their current state, which makes the personalized systems provide limited content. For example, RS will not expose users to items outside their existing interests because of over-tailoring the outcomes with the used user model [2]. Recently, several studies started to investigate the concept of self-actualization and propose it as a solution to the filter bubble problem [4,5]. For instance, Knijnenburg et al. [4] proposed an RS for self-actualization, which is a personalized system that has the explicit goal not just to present users with the best possible items but to support users in developing, exploring, and understanding their own unique tastes and preferences. In the same direction, Graus et al. [6] claimed that user profiles might offer readers insights into their behavior, biases, interests, or expertise, and effectively exposing a user profile can help users who actively seek to reduce biases to do so. More generally, eliciting exploration may yield benefits such as unleashing long tail articles and thus increasing user engagement through broader and more diverse consumption of content.
In this work, we aim to take the concept of self-actualization to the user modeling level in order to help users explore, develop, and understand their unique personal preferences and interests. This work is significant because it presents a conceptual solution that addresses the potential of explanatory visualizations of transparent user models for self-actualization. To this end, first, we reviewed the literature on self-actualization from the psychology and computer science domains to derive different self-actualization goals and concrete mechanisms to achieve them. Second, we developed a conceptualization framework for self-actualization goals that could be targeted and achieved when dealing with transparent user modeling. Third, drawing on the proposed framework, we leveraged the Human-Centered Design (HCD) approach to systematically design interactive visualizations of different aspects of the user model to support different self-actualization goals.
The remainder of this paper is organized as follows. Section 2 and Section 3 report on the related work on transparent user modeling and self-actualization goals. Section 4 describes the steps that were taken to develop our framework to conceptualize self-actualization goals of transparent user modeling. This framework provides the theoretical background of possible self-actualization goals and how these goals could be achieved through various mechanisms. In Section 5, we instantiate the proposed framework and follow the HCD approach to systematically design interactive visualizations to help users achieve different self-actualization goals. Finally, Section 6 summarizes the paper and outlines perspectives for future work.

2. Transparent User Modeling

Approaches to transparent user modeling may be of relevance in different contexts where interpretability, trust, and user control are key requirements. In this section, we address the concept of making the user model transparent from the perspectives of adaptive systems, intelligent tutoring systems and other educational systems, as well as explainable recommender systems.

2.1. Adaptive Systems

Adaptive and personalized systems are spreading widely and gradually playing an increasingly important role in our everyday lives. This has made us used to interact with these systems that help us in several scenarios, ranging from services of music suggestions to movie recommendations to personal assistants able to proactively support us in complex decision-making tasks. Unfortunately, most of these systems adopt black box models whose internal mechanisms are opaque to end-users. Users typically enjoy personalized suggestions or like to be supported in their decision-making tasks. However, they are not aware of the general rationale that guides the algorithms in the adaptation process, leading to a lack of transparency and trust with these systems. Therefore, it is crucial to make the internal mechanisms that guide these algorithms as clear as possible. Recent research stressed the need for explainable adaptive systems. Further, many researchers highlighted the potential of transparent user models to add transparency and controllability to adaptive systems. For example, Wasinger et al. [7] pointed out that adaptive systems that incorporate user modelling components need to satisfy not just a number of functional requirements but also end-user requirements such as scrutability, user control, and reuse of user model content. Ahn et al. [8] focused on the application of open user models in adding transparency and controllability to adaptive news systems. The results of their study confirmed that users prefer transparency and control in their systems and generate more trust in such systems. In the same direction, Rahdari et al. [9] presented an information exploration system with an open and controllable user model, which supports undergraduate students in finding research advisors. The authors made the user model of interests directly visible and editable by the end-users so that the user can add relevant topics as well as remove less relevant keywords. The results of their study indicated that exploratory profile building based on open user models can lead to better user experience. Despite the recognized benefits of transparent user models, current adaptive systems tend to go in the opposite direction, since most of the approaches try to maximize the effectiveness of the personalization strategy at the expense of the explainability and transparency of the user model.

2.2. Intelligent Tutoring Systems

Intelligent tutoring systems (ITS) (also known as AI in education) represent a popular application of adaptive systems in the educational domain. ITS research strives to provide personalized help, feedback, and pedagogical interventions by modelling a variety of features that are important for individualized instruction, such as students’ domain knowledge and cognitive skills, behaviors, as well as their meta-cognitive abilities and affective states [10]. Development of strategies and approaches that assist students in better understanding of how their learning is captured and approximated in educational systems has been studied in a branch of ITS research known as Open Learner Modeling (OLM) [1,11]. OLMs are learner models that are externalised and made accessible to students or other stakeholders such as instructors. They are often opened through visualizations, as an important means of support for learning [11]. These models might represent attributes regarding learner’s knowledge, interests, affect, or other cognitive dimensions, which typically are inferred based on the learner’s interactions with the system [11]. OLMs allow users to access their content with varying levels of interactivity. For example, an OLM can be scrutable (users may view the system’s current assessment of their states and abilities), cooperative or negotiable (the user and the system work together to arrive at an assessment), and editable (the user can directly change the system’s assessment and representation of their model at will) [10].
The use of OLMs in ITS has demonstrated multiple benefits that these models can bring. Conati et al. [10] pointed out that OLMs can serve two main purposes; first to support metacognitive processes of reflection, self-monitoring and planning, and second to improve model accuracy by enabling students to adjust the system’s prediction and representation of their models when these are deemed inaccurate by students. The authors noted that the more interactive the OLM, the more interpretable and explainable the underlying representations may need to be. They further summarized key considerations that need to be taken into account when designing OLMs, by citing four dimensions which are expressed as questions as proposed by [1], namely, Why the model is built?; Which aspect of the model to reveal?; How is the model accessed and the degree to which it can be manipulated by the user?; and Who has access to the model?). Basu et al. [12] proposed an editable OLM which allows students to build models of their knowledge by exploring concepts, properties and relations between them in open ended exploratory learning environments (OELE). The authors showed that editable OLMs can provide effective, engaging and trusted learning tools if they are accompanied by fine-grained support from the system. Putnam and Conati [13] presented a pilot study towards understanding when and if it is necessary for an ITS to explain its underlying user modeling techniques to students. The results showed an overall positive sentiment towards wanting an explanation. Based on the results of this pilot study, Conati et al. [14] developed why and how explanations that provide the users insights on the user modeling and hint provision mechanisms used in the ITS. The authors found in their study that providing explanations increase students’ trust in the ITS hints, perceived usefulness of the hints, and intention to use them again. Likewise, Li and Zhao [15] argued that adding explainability to user modeling techniques would make them more acceptable by practitioners.

2.3. Other Educational Systems

In an educational context, in addition to ITS, the OLM was also adopted in the domain of game-based learning. For example, Hocine [16] developed a serious game based on an OLM that helps in self-regulation for attention training. The author argued that the transparency of the model may help users follow their progression, develop their learning strategy, and self-regulate their skills. Similarly, Hooshyar et al. [17] proposed to apply OLMs to educational games to overcome two challenges associated with educational games, namely, transparency in assessing educational outcomes in real-time gameplay, and clarity in representing those results to players. The authors argued that applying OLMs within gameplay sessions could help learners independently track, reflect on, and pace their learning processes.
Recent contributions from the learning analytics (LA) and educational data mining (EDM) communities have also emphasized the importance of transparent, understandable OLMs that provide insight and enhance learners’ understanding of interactions with learning environments [18]. OLMs have been integrated into learning analytics dashboards (LADs) to help learners monitor, reflect on, and regulate their own learning [19,20]. Furthermore, OLMs have been used as an explanation for educational recommender systems. For instance, Abdi et al. [18] found that complementing an educational recommender systems with OLMs to provide justification for their recommendations can have a positive effect on student engagement and their perception about the effectiveness of the system despite potentially making the system harder to navigate. Barria Pineda and Brusilovsky [21] argued that OLM interfaces could be used to explain learning content recommendations when they are generated based on student level of knowledge of the domain. Building on this work, Barria-Pineda and Brusilovsky [22] presented an explainable educational recommender system, named Mastery Grids, which uses an interactive OLM as an approach to explain need-based recommendations and make them more transparent. Beyond the educational context, transparent user models have also been applied in recommender systems in different application domains, as we will discuss next.

2.4. Explainable Recommender Systems

Recommender systems (RS) represent another popular instance of adaptive and personalized systems. In RS, user models, which are based on users’ interests and preferences, are used to predict the suitability of items to be recommended. How these user models are inferred and used in the recommendation process are often not transparent to end-users. To address these issues, explainable RS have gained an increasing importance in the last two decades. The focus of an explanation can be on different parts of the RS, namely, the recommendation input (i.e., user model), process (i.e., algorithm), or output (i.e., recommended items) [23,24]. Compared to explainability of the recommendation output or the recommendation process, focusing on the recommendation input is under-explored in explainable recommendation research [6,25,26].
The rise of distrust and skepticism related to the collection and use of personal data, and privacy concerns in general has led to an increased interest in transparency of black-box user models, used to provide recommendations [27]. Many researchers stressed the importance of enabling transparency by opening, scrutinizing, and explaining the black box user profiles, that serve as input for the RS. This can help users become aware of their interests used for the recommendations [28], build a more accurate mental model of the system [26], detect wrong assumptions made by the system [28], contribute to scrutability, allowing users to provide explicit feedback on their generated user profiles [6], help detect biases which is crucial to producing fair recommendations, thus leading to increased trust in the system [26], and facilitate users’ self-actualization [6,27].
Several recommendation tools have represented and exposed the user model behind the recommendation mechanism [21,29,30,31]. However, scrutability is lacking in these tools. Scrutability in RS refers to allowing users to correct their models when they disagree with (parts of) it or modify their models in order to adjust the recommendation results according to their needs and preferences [2,26]. The interest in providing scrutable user models has increased in the last decade and various studies have been conducted in this direction, presenting systems that enable scrutability and provide user control on the input layer of the RS [3,9,32,33,34,35,36,37,38,39]. Explaining user models goes beyond just exposing and manipulating the user model to provide concrete explanations of how the user model was inferred. Only few works followed this approach and provided explanations of the user model to make the RS transparent [24,25,26,27,40].

3. Self-Actualization

The concept of self-actualization was initially studied by psychologists. However, other disciplines such as computer science adopted this concept to provide novel solutions to several faced issues. In this section, we discuss this concept from both psychology and computer science perspectives.

3.1. Psychology Perspective

Self-actualization is a psychological concept that was developed in the 20th century by Kurt Goldstein [41], Carl Rogers [42], and Abraham Maslow [43], who have contributed immensely to the understanding of this concept. The term self-actualization was first introduced into scientific circulation by Goldstein [41] as the ultimate goal of every organism. According to the author, self-actualization involves the tendency to actualize an organism’s individual capacities as much as possible. It thus refers to the desire for self-fulfillment, and the propensity of an individual to become actualized in his potential Goldstein [41]. The concept of self-actualization was further developed in the works of Rogers and Maslow—representatives of humanistic psychology. They described self-actualization more narrowly than did Goldstein by applying it solely to human beings—rather than all organisms. Rogers [42] described self-actualization as a continuous lifelong process whereby an individual’s self-concept is maintained and enhanced via reflection and the reinterpretation of various experiences which enable the individual to recover, change and develop. Within the framework of his concept, self-actualization is “the tendency of an organism to develop its abilities in order to preserve and develop its personality” [44] (p. 45). Maslow [43] also viewed self-actualization as the complete realization of one’s potential as manifest in peak experiences which involve the full development of one’s abilities [45]. It “refers to the desire of people to realize themselves, namely, the tendency to manifest in what is potentially inherent in them. This inclination can be defined as the desire to show the distinctive features inherent in a person in order to achieve everything he is capable of in a more prominent degree” [46] (p. 68). Self-actualization is the highest motive in the hierarchy of needs by Maslow who pointed out that the state of self-actualization is obtainable only after one’s fundamental needs for survival, safety, love and self-esteem are satisfied [43,46].
Self-actualization processes are also discussed in educational psychology and mainly explained with metacognition theories and models. Self-actualization is the principal function of education and education is “the process of the individual human being making of himself what he wishes to be” [47] (p. 133). Strategies that target student’s personal development besides academic achievements include targeted interventions for encouraging lifelong learning and improving metacognitive abilities and skills, which help scaffold the never-ending self-growth, and thus self-actualization [48,49,50,51,52].

3.2. Computer Science Perspective

The first attempt to consider self-actualization in RS was reported in [4]. The authors argued that the filter bubble problem can be overcome by building “Recommender Systems for Self-Actualization” (RSSA), i.e., personalized systems that have the explicit goal to not just present users with the best possible items, but to support users in developing, exploring, and understanding their own unique tastes and preferences. Building upon this work, Wilkinson [5] presented an RSSA that has potential to help users in understanding their unique tastes through development and exploration. In addition to displaying a Top-N list, the proposed system also displays different lists that promote exploration and taste development by addressing the issues of incorrect negative predictions, unknown preferences, and novel or controversial items. Similarly, Guo [53] stressed the need for RS that concentrate on the more complex situation of helping users in developing their preferences rather than only suggesting accurate items. The authors argued that RS should more actively keep the user “in-the-loop” by providing alternative recommendation lists that go beyond the traditional Top-N list. As possible implementations of an RSSA, they discussed four algorithms that generate such alternative recommendation lists in order to enable the RS to gain a more holistic view of the user and also allow the user to learn more about themselves. Harambam et al. [54] confirmed that the different RSSA strategies proposed in [4] are not just theoretical solutions, but have real empirical grounding in peoples concerns, needs and wishes. The authors conducted focus groups or moderated think-aloud sessions to systematically study how people evaluate different control mechanisms for the three different phases in the recommendation process (i.e., data input, process, and output) in a News recommendation prototype. They found that controlling the input (through an intelligible user profile) and the process (providing possibilities to influence the recommendation algorithms) were highly valued, especially when these control mechanisms can be operated in relation to achieving personal self-actualization goals.
The benefits of designing RS for self-actualization were further confirmed in other efforts to connect explanations of user profiles with self-actualization goals. Graus et al. [6] described how explaining the typically “black box” user profiles, that serve as the RS’ input can be beneficial in several aspects. These include transparency to help users better understand the underlying mechanisms of the RS, scrutability to allow users to provide explicit feedback on the constructed user profiles, and self-actualization to support users in understanding and exploring their personal preferences. Likewise, Sullivan et al. [27] focused on explaining the user profile for self-actualization in the news domain. They presented a conceptual framework that defines goals of explanations, based on three layers that enable users to answer different questions depending on different goals, namely, transparency, contextualization, and self-actualization. According to the authors, the self-actualization layer is goal-directed and allows for user-control to achieve those goals. Further, they instantiated the proposed framework by evaluating an explanation interface for two self-actualization goals (i.e., broaden horizons and discover the unexplored). The results of their study showed that providing users with different goals for self-actualization influences their reading intentions for news recommendations.

4. A Framework for Self-Actualization Goals of Transparent User Modeling

In this section, we present and discuss EDUSS, our proposed framework for self-actualization goals of transparent user modeling. To this end, we present the method we followed to collect and cluster related work on self-actualization goals. Then, we report the results of our investigation and describe how we compiled these goals into the EDUSS framework.

4.1. Method

We investigated the literature from both psychology and computer science disciplines to extract self-actualization goals along with their descriptions. We analyzed the existing works considering what could be presented as a self-actualization goal to be targeted when making a user model transparent. We started by extracting self-actualization goals from popular definitions of self-actualization in psychology and computer science (see Section 3). Further, we collected papers about self-actualization by querying Google Scholar and Semantic Scholar for all papers with the key terms ’self-actualization’ AND ’user model’ and ’self-actualization’ AND ’recommender system’ in their abstract, title, or authors’ keywords. Also, we checked the references of the relevant papers. In order to cover the maximum of the works on self-actualization related to user modeling and/or RS, we used ’Connected Papers’ (https://www.connectedpapers.com/, accessed on 22 January 2022), which is a visual tool developed to help researchers find and explore relevant related papers. This step resulted in 304 papers. After initial processing of the papers’ abstracts, removing duplicates and irrelevant entries, i.e., those papers without concrete mechanisms on how a personalized system can support users’ self-actualization, we ended up with 15 papers. We then read those papers in detail and collected and clustered potential self-actualization goals as well as mechanisms to achieve these goals. Each extracted goal was assigned to only one cluster. Where necessary, a new cluster was added. As a result, main goals and sub-goals of self-actualization emerged from an iterative bottom-up clustering process.

4.2. Results

This section reports the results of our analysis of the literature on self-actualization goals and related mechanisms to achieve these goals.

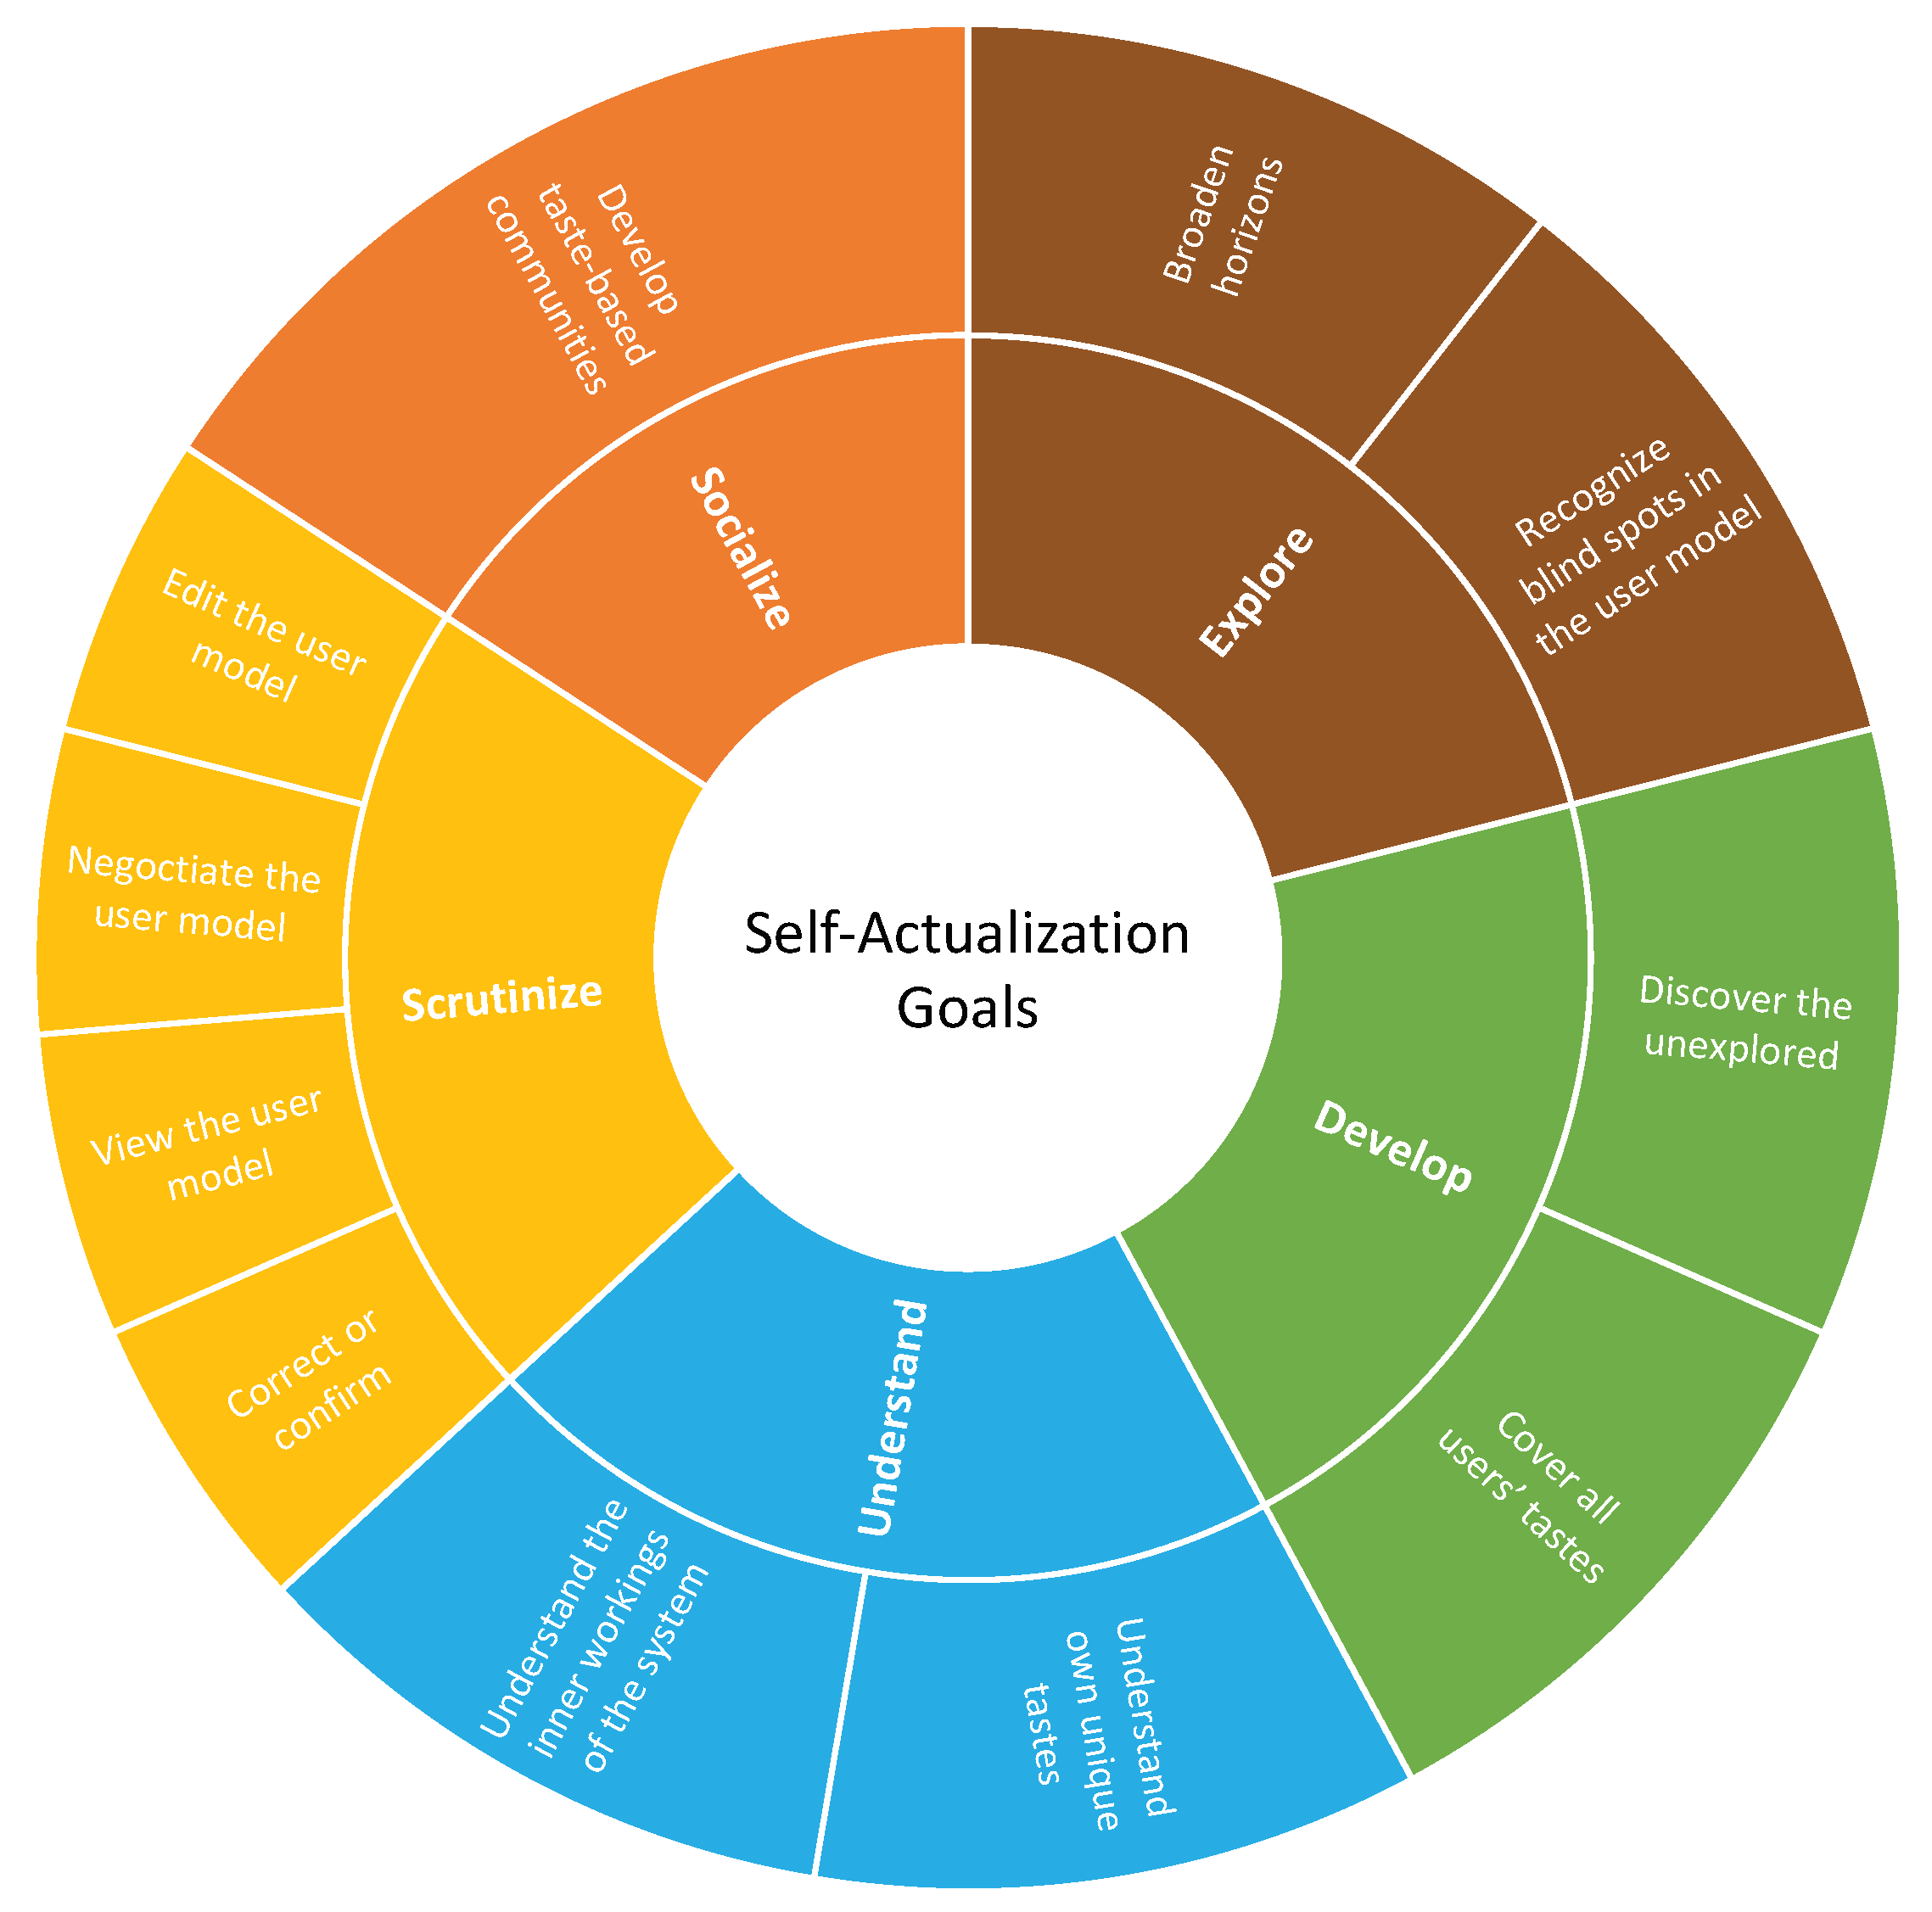
4.2.1. Self-Actualization Goals

Our analysis of the literature resulted in a set of thirteen potential self-actualization goals. These goals, their description, and their sources are presented in Table 1. After collecting the first set of potential goals, we followed a bottom-up approach to cluster them. The most common definition of self-actualization refers to personalized systems that support users in exploring, developing, and understanding their own unique taste. Hence, we considered Explore, Develop and Understand as potential main goals. We found that some other goals would semantically fit under these goals, so we grouped them as sub-goals of these goals. For instance, we assigned Broaden horizons and Recognize blind spots in user model as sub-goals under the main goal Explore. We then tried to cluster the remaining goals resulting in two new main goals, namely, Scrutinize and Socialize. For instance, the goals “Correct or confirm”, “View the user model”, “Negotiate the user model”, and "Edit the user model" were grouped under the more general goal Scrutinize. Similarly, we used Socialize to refer to the goal “Develop taste-based communities”. Following this bottom-up approach to cluster the identified goals resulted in the Explore, Develop, Understand, Scrutinize, Socialize (EDUSS) framework which represents a hierarchical grouping of self-actualization goals, as depicted in Figure 1.

4.2.2. Self-Actualization Mechanisms

After the clustering process of the goals and the sub-goals, we read again the reviewed papers and collected the proposed mechanisms related to each goal. These mechanisms represent concrete actions to achieve self-actualization goals. The collected mechanisms with their descriptions are presented in Table 2.

4.3. The EDUSS Framework

The EDUSS framework emerged from an iterative bottom-up clustering process and resulted in five main goals and eleven sub-goals. A summary of these goals along with their related mechanisms is provided in Table 3.
Explore: This is one of the main goals proposed in [4] where the authors define a recommender system of self-actualization (RSSA) that has the explicit goal to not just present users with the best possible items, but instead to support users in exploring their own unique taste. This RSSA focuses on exploration rather than consumption, that means it does not focus on optimizing the probability that the user will like recommendations, but instead on exploring underdeveloped tastes. Likewise, Guo [53] agree that RSSAs acknowledge the value of alternative items for helping the user explore their tastes and preferences. The authors described techniques to generate alternative lists such as “Things we are not sure about” containing items for which there is no sufficient data for a particular user available, thus, covering unexplored potential preference and “Things that are controversial” showing recommendations that are polarizing among like-minded users, allowing the user to explore tastes that go beyond the mainstream. Moreover, Harambam et al. [54] argued that providing a transparent news RS makes users not only more satisfied and trustful of the RS, but also they will be activated to explore beyond their known interests, which increases the diversity of recommended contents. In the music RS domain, Liang and Willemsen [57] reported that rather than designing a behavior change oriented RS, several guided exploration tools are built to help people explore new items that they might be interested in and further build new preferences towards them. In a more recent study related to music recommendation, Liang and Willemsen [38] investigated how interactive design in the context of music genre exploration can support users to explore new preferences. They argued that by increasing awareness for exploration, people gradually step into the action stage of the behavioral change process, willing to take actions to explore new tastes. In summary, the self-actualization goal Explore means discovering new things but still within one’s circle of interests.
This main goal could be split into two more specific sub-goals. The first sub-goal Broaden horizons was extracted from [27,54]. Sullivan et al. [27] aimed at supporting the user to identify familiar topics that are close to their interests but are largely unexplored while Harambam et al. [54] aimed at offering news from unexplored territories to help users expand their reading horizon. As a possible mechanism to achieve the sub-goal Broaden horizons, Sullivan et al. [27] proposed to “Increase diversity gradually” by making small steps outside of users’ current circle of interests. The second sub-goal Recognize blind spots in the user model was extracted from [38,54,55,58,59,60]. For instance, Tintarev et al. [59] investigated how they can help users to better understand their consumption profiles through visualizations aiming at revealing to users regions of the recommendation space that are unknown to them, i.e., blind-spots. Building upon this work, Kumar and Tintarev [58] proposed an approach for visualizing blind-spots in user profiles, thereby indirectly nudging users to diverse exploration. These blind-spots are visualized by enabling comparisons between a user’s consumption pattern with that of other users of the system. In general, the main idea behind this sub-goal is to support users in recognizing blind spots in their profiles, i.e., regions of the preference-space that are underrepresented, to encourage them to further explore the recommendation space. “Explore under-represented preferences” was suggested as a mechanism to recognize blind spots in the user model [4,53].
Develop: This self-actualization goal is mainly very related to the human-being nature since human are dynamic by nature and always seek to develop and evolve during one’s life. Maslow [45] mentioned this goal in his definition of self-actualization: “Self-actualization can be described as the complete realization of one’s potential ... which involve the full development of one’s abilities and appreciation for life”. This goal was also extracted from [44] where the author defines self-actualization as “the tendency of an organism to develop its abilities in order to preserve and develop its personality”. Supporting users in developing their own unique tastes and preferences is one of the main goals of a recommender system for self-actualization (RSSA) [4,5,53]. Knijnenburg et al. [4] pointed out that experiencing controversial items could allow the user to develop unique tastes. The authors proposed to detect such items and to present them to the user, which can help users to better understand their own tastes, because developing one’s tastes means trying new things, even if this includes things that one may not like. Similarly, Liang [55] investigated how RS can help people develop new preferences and goals. The authors argued that RS for developing new preferences should provide users with more explicit guidance and support towards new preferences rather than just introducing new or diverse items as most of the current diversification and novelty approaches do. They proposed that developing users’ preferences could be system-initiated or user-initiated, i.e., users sometimes intend to develop their unique interests (user-initiated), and sometimes the system is nudging/supporting the user towards development. In the educational context, the Develop goal refers to developing deep learning and meta-cognitive approaches to learning [1]. Compared to the self-actualization goal Explore which aims at discovering new things but still within one’s circle of interests, the self-actualization goal Develop aims at developing new tastes and preferences which can be outside one’s circle of interests.
This goal could be split into two more specific sub-goals. The first one is Discover the unexplored which was extracted from [27], and it consists of making bigger steps outside of the current circle of preferences, even if this includes “Things that one may not like”, “Things we have no clue about”, or “Things that are polarizing”, which would allow the user to develop new unique tastes [4,5,53]. “Visualize underdeveloped parts of a user model” [27] and “Try new things” [4,5] were proposed as mechanisms to achieve this sub-goal. The second sub-goal Cover all users’ tastes which was extracted from [4,5,53] aims at helping users to achieve the completeness of their user models, including new potential tastes and preferences. This sub-goal can be achieved through the mechanism "Detect not just some but all of the users’ preferences", as proposed in [4].
Understand: Related to the previous two self-actualization goals, exploring and developing one’s tastes can also help users understand their own tastes better [4]. According to Knijnenburg et al. [4], such deep understanding of one’s own tastes is a particularly important goal in decisions that have a resounding impact on one’s life and also important for cultural diversity. This goal could be split into two sub-goals: Understand own unique tastes [4,5,53,54] and Understand the inner workings of the system [6,10,60]. An effective mechanism to meet these sub-goals is to “Explain the user model” [6,27] in order to increase the transparency of the system. In the case of RS, transparency can be achieved either by explaining the input (i.e., user model), process (i.e., algorithm), or output (i.e., recommended items). Switching the focus on explaining the user model enables a more complete picture of the information used as input in the RS and how this information is used to generate recommendations. This would lead to a more complete explanation of the inner workings of the RS [6,27].
Scrutinize: Compared to the goals that we clustered under Explore, Develop, and Understand, as discussed above, the goals Correct or confirm, View the user model, Negotiate the user model, and Edit the user model require user’s agency with the system generating the user model, with increasing levels of interactivity. The user may view the system’s current assessment of their states and abilities [1,10,61], work together with the system to negotiate the system’s assessment [1,5,10], or change the system’s assessment by editing [1,3,10,32], correcting, or confirming the system’s representation of their model [4,5,42,53]. We clustered these goals under the main self-actualization goal Scrutinize. Scrutability is perceived differently depending on the discipline where it is used. In some works in the ITS and OLM fields, scrutability is perceived as a passive inspection of the model which means that the user can only see their model but have no control over it [1,61]. Other works suggest a more active role of the user when interacting with their models [3,5,10,12]. The majority of works in the RS field perceive scrutability as an active inspection of the user model by allowing users to tell the system if it is wrong and enabling them to adjust the model’s predictions when these are deemed inaccurate [2]. In summary, the self-actualization goal Scrutinize gives users agency over their generated model. An effective mechanism to achieve this is by allowing users to “Access the user model with varying levels of interactivity” [1,10].
Socialize: According to Knijnenburg et al. [4], the idea behind the goal Develop Taste-based communities is to support users in actively recommending items to other users. This can contribute to a sense of fulfillment (helping others) and pride (being called upon for expertise). The authors further suggest to expand beyond simple one-to-one connections between users, to recommend groups of users to come together and develop taste-based communities that are based on shared preferences [4]. This allows the generation of a “community profile”, i.e., aggregation of many user models sharing the same preferences which could be used as an input to provide group recommendations. We used the term Socialize to refer to the goal Develop Taste-based communities. This self-actualization goal is one of the characteristics of Self-actualized people who can benefit from their community and mutual support. This requires that one should be unselfish and provide support to others as well as being open to the idea of receiving help from others [62]. A key mechanism to develop taste-based communities is to “Connect people based on shared preferences” [4].

5. EDUSS Framework in Action

We applied the EDUSS framework to systematically design interactive visualizations of user models to support different self-actualization goals in the transparent recommendation and interest modeling application (RIMA) [26]. Below, we provide a brief background about how the application is generating the user interest model and detail the steps we followed to design visualizations for the different self-actualization goals of the EDUSS framework, following a Human-Centered Design (HCD) approach [63].

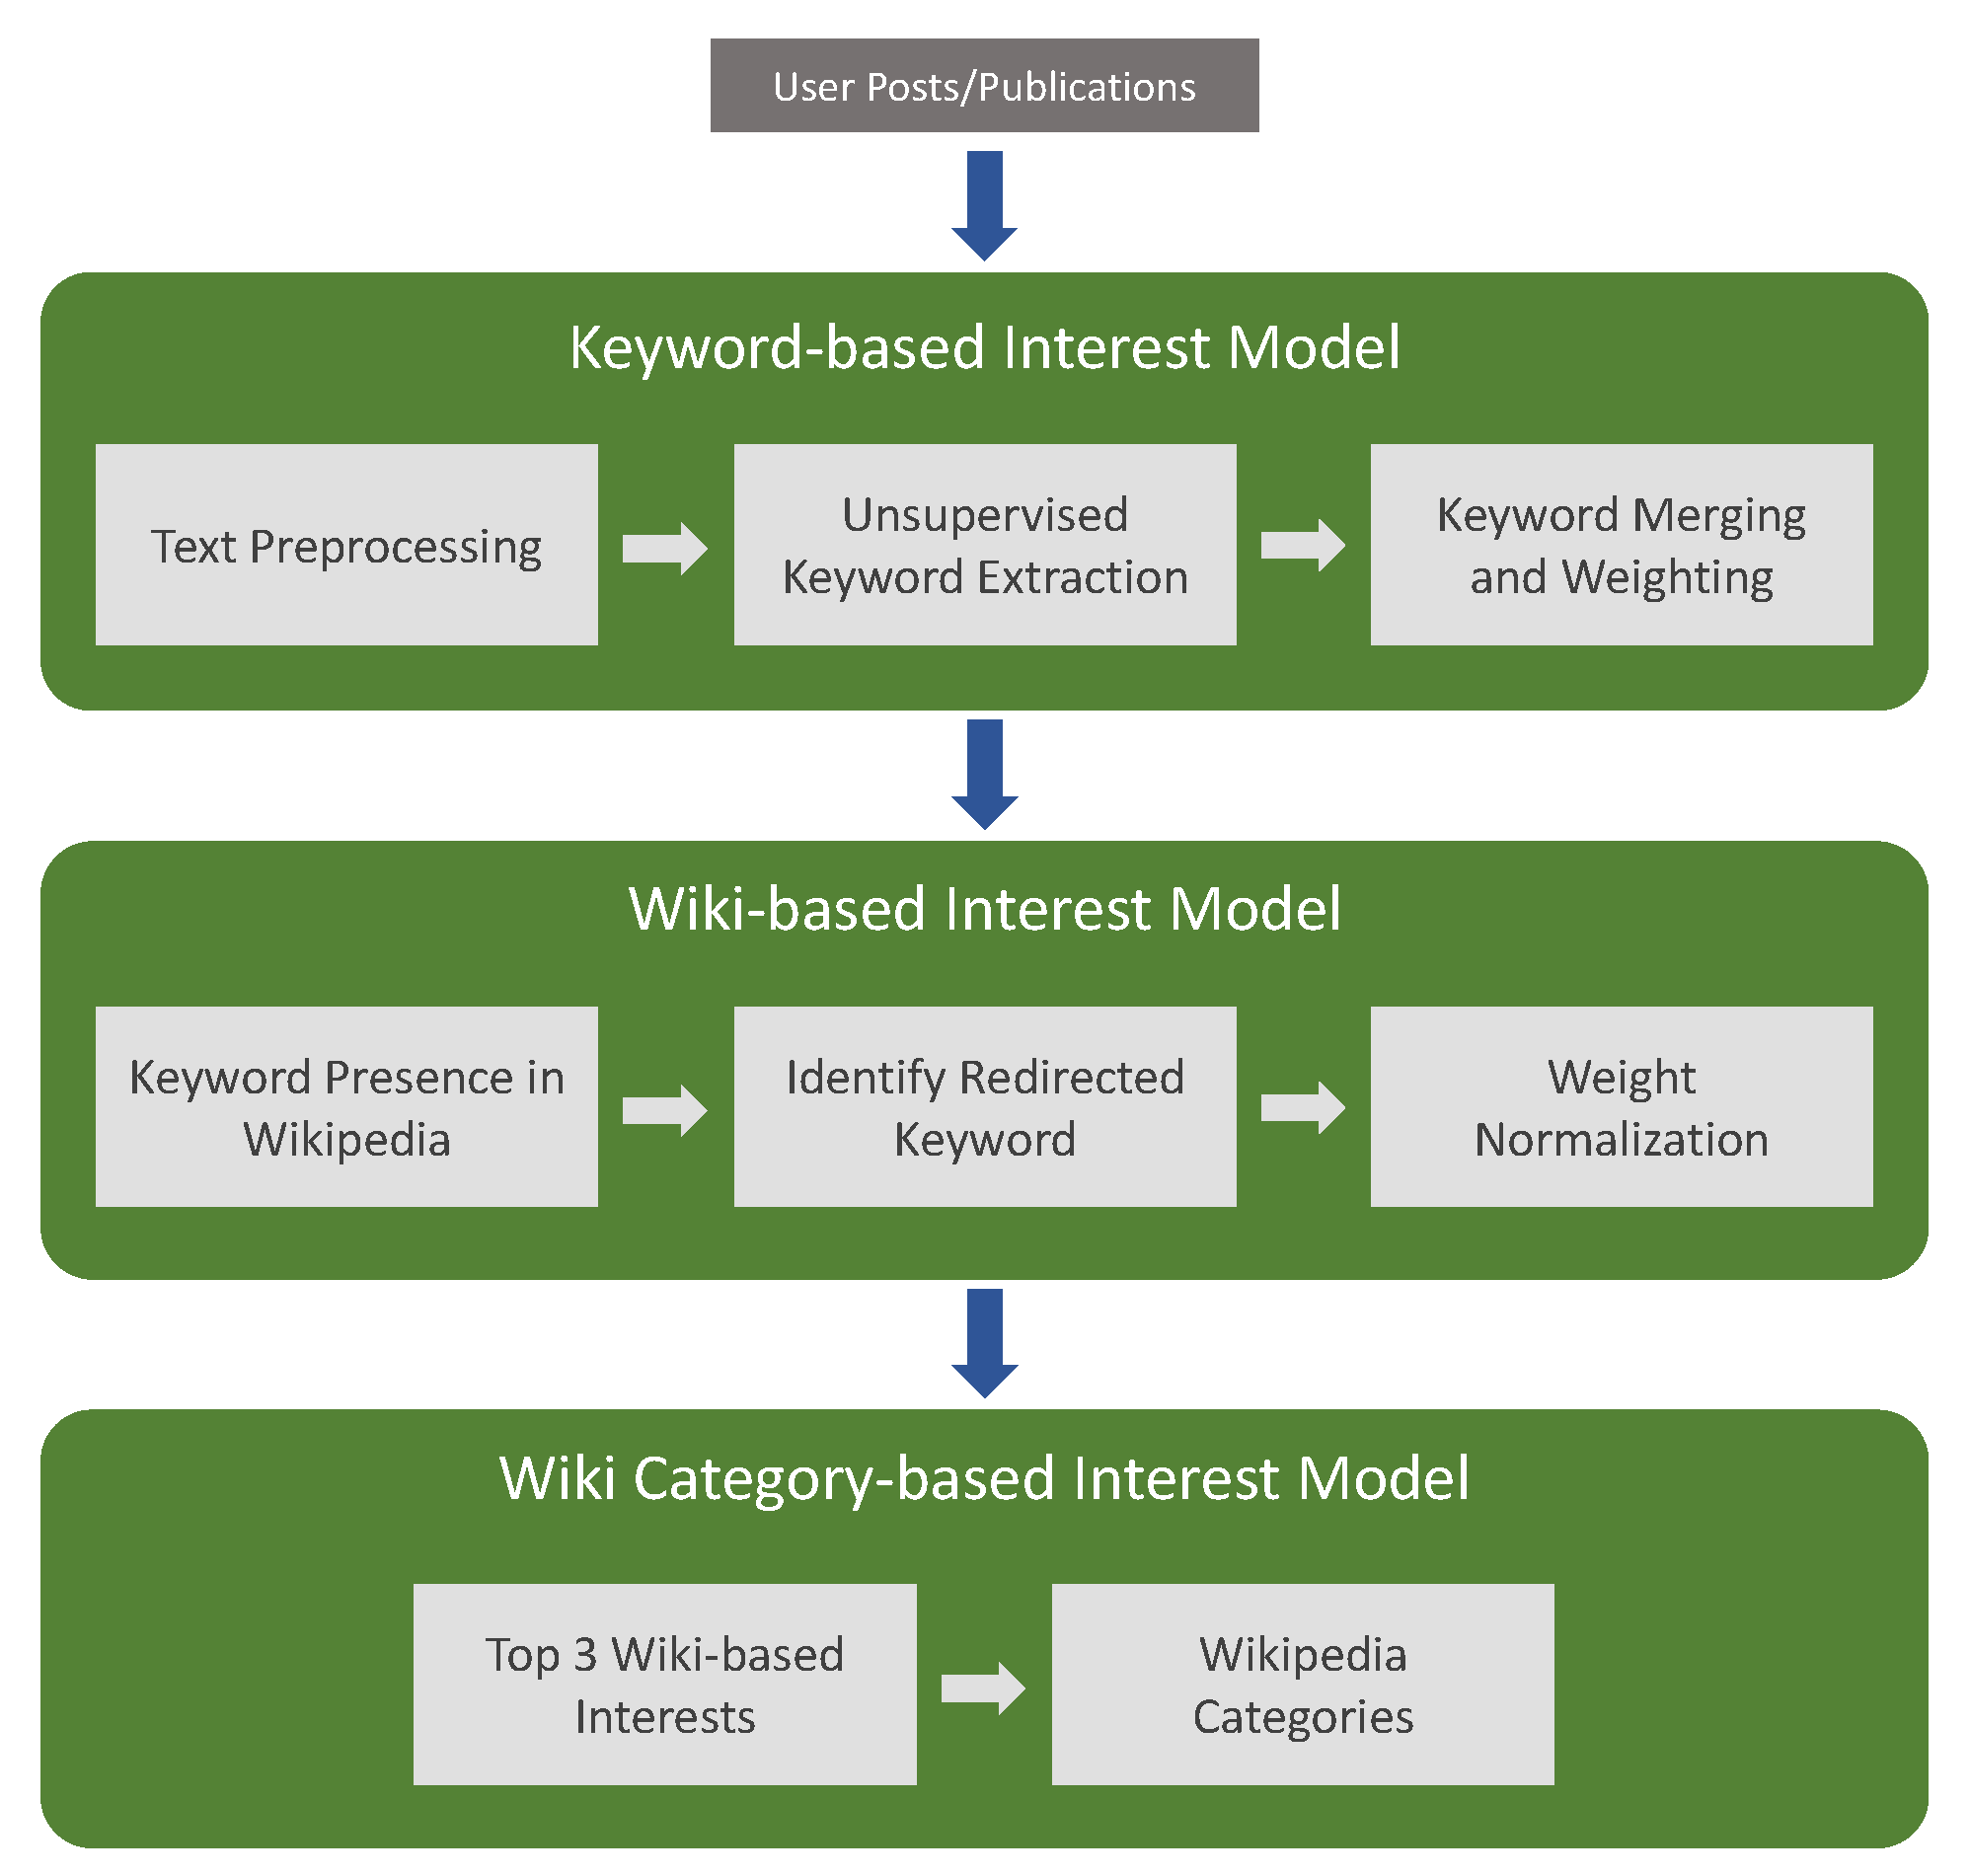
5.1. User Interest Model Generation

The interest models that we are working with represent the input part of the transparent Recommendation and Interest Modeling Application (RIMA) that aims at achieving transparent recommendation by opening, scrutinizing, and explaining user models [26]. The user interest models in RIMA are generated from users’ publications and tweets. The application uses Semantic Scholar and Twitter IDs provided by users to gather their publications and tweets. It applies unsupervised keyphrase extraction algorithms on the collected publications and tweets to generate keyphrase-based interests. First, our proposed approach starts with extracting candidate interest keywords from the user-generated textual content (e.g., research publications, tweets) using various unsupervised keyword extraction algorithms, including TextRank, SingleRank, TopicRank, TopicalPageRank, PositionRank, MultipartitieRak, Rake, and YAKE!
Inspired by the fact that an interest is often a well-defined concept (article) in Wikipedia, we use a method of interest modeling that mixes unsupervised keyword extraction algorithms and Wikipedia as a knowledge base to generate semantically-enriched interest models. Leveraging Wikipedia to infer interest models has the potential to address different semantic-related issues: (a) synonym interests can be merged (b) acronym interests can be reduced, and (c) noise coming from non-relevant keywords can be filtered out. As a result, Wikipedia-based interest models would be more representative and more accurate than keyword-based ones.
Further, Wikipedia is used to find the categories of Wikipedia-based interests and generate Wikipedia category-based interests. Enriching an interest model with Wikipedia categories might lead to unexpected but still relevant interests, which can be important to achieve serendipitous encounters. The three main steps of the interest model generation process are illustrated in Figure 2 and described in detail in [64].

5.2. Human-Centered Design

Design thinking is an approach to problem forming and solving that is focused on who we are designing for. Human-Centered Design (HCD) is a powerful tool for design thinking. HCD involves the end-user throughout the product development and testing process [65]. It is a multi-stage process that allows for various iterations of a design and subsequent updates to the requirements [63]. Designing with the HCD approach requires that the user is involved from the very beginning and is regularly consulted for the evaluations of incremental prototypes [66], which ensures that the needs and requirements of the user are taken into consideration throughout the design process. In this way, it is possible to avoid serious mistakes and to save re-implementation time since the first design is based on empirical knowledge of user behavior [67]. There are four different activities in the HCD process, namely, Observation, Ideation, Prototyping, and Testing. These four activities are iterated; that is, they are repeated over and over, with each cycle yielding more insights and getting closer to the desired solution.

5.3. Designing Visualizations for Self-Actualization

Building upon the EDUSS framework, we followed the HCD approach to systematically design interactive visualizations of transparent user interest models in RIMA to support users’ self-actualization. The final design of these visualizations was the result of three HCD iterations. Next, we outline the iterative design process of the visualizations and their evaluation.

5.3.1. Participants

For evaluating the different visualization prototypes, a group of potential users were selected to participate in the design process. Our target group are researchers and students who are interested in scientific literature. We recruited users from the local university who were familiar with visualizations. For each design iteration, five different potential users were involved to test and give feedback on the provided prototypes, as recommended by Nielsen [68] in the case of qualitative user studies. Age: 87% 18–24; 13% 25–32. Gender: 54% male; 46% female. Education: 20% some university, no degree; 73% bachelor degree; 7% master degree.

5.3.2. First Iteration

Observation: In our work, users’ needs for self-actualization are based on the literature review that we conducted to collect self-actualization goals, summarized in the EDUSS framework (see Section 4).
Ideation: As mentioned in Section 4, each goal has a set of sub-goals, and we defined different mechanisms to achieve these sub-goals. The ideation phase was focused on generating ideas about how to implement these mechanisms. In this phase, a brainstorming session involving two authors and four students from the local university having knowledge on RS and information visualization was carried out to collect ideas using an online tool called ’Miro’ (https://www.miro.com, accessed on 5 February 2022). The aim in this initial phase was to collect as many ideas as possible on a given goal and put quantity of ideas over quality. For each mechanism, every idea was written down on a sticky note. After that, these ideas were discussed following a “pitch and critique” approach. This process requires that participants pitch their ideas to the group and the others should give both positive and negative feedback. The last step was the voting process to select the best ideas. For each self-actualization goal, each participant had three votes (using stars) to vote on the best three ideas according to them. Figure 3 presents the results of this ideation phase related to the goal Explore. The big sticky note contains the main goal while the two sticky notes next to it represent the sub-goals. For each sub-goal we have one or more mechanisms representing concrete actions to achieve the goal.
As a final result of this ideation phase, we selected the top three voted ideas for each main goal. For the goal Explore, we have the sub-goal Recognize blind spots in the user model with the related mechanism “Explore under-represented preferences”. For this sub-goal, the top voted ideas are ‘Let the user change the top-N showed interests to see low-weighted interests’ and ‘Suggest more similar keywords to the interest with a smaller weight from users publications’. For the sub-goal Broaden Horizons, we have the mechanism “Increase diversity gradually”. One idea was selected for this sub-goal, namely, ‘Suggest interests from journal/conferences scopes’.
Regarding the goal Develop, we have the sub-goal of Discover the unexplored for which the extracted mechanisms are “Visualize underdeveloped parts of a user model” and “Try new things”. For this sub-goal, the two selected ideas are ‘User can add new interest’ and ‘Same interest from different fields of study’. For the sub-goal Cover all user’s tastes, we have the mechanism “Detect not just some but all of the user’s preferences”. One idea was selected for this sub-goal which is ‘Suggest to add unrelated preferences with yes or no option/or on a scale from 1–10 how likely would you add this preference’.
As for the goals Understand, Scrutinize, and Socialize, three ideas were selected for each one. For Understand, the most voted ideas are ‘Explain the algorithm technically’, ‘Explain the algorithm in human language’, and ’Show the source of the interest with the interest highlighted’. For Scrutinize, the liked ideas are ‘Edit interest (change the weight/add/remove)’, ‘Interact with visualization’, and ’Different views of the interest set’. Finally, for Socialize, the top voted ideas are ‘Compare users with similar user models’, ‘Authors from references’, and ‘Add graph representing authors who influenced the user and are most influenced by the user’.
Prototyping: After the collection of the three most voted ideas for each goal, the next step was to come up with possible visualizations for the different ideas. We discussed various visualizations that we thought are relevant to each idea. Then, we created low-fidelity prototypes as paper mock-ups for each proposed visualization.
For the goal Explore, three charts were created, namely, a node-link diagram, a target diagram, and a sankey diagram (Figure 4). In the node-link diagram, the node in the middle is representing an existing interest of the user and the outgoing edges point to similar interests. The target diagram has the same idea, where the circle in the middle would be an existing interest, and the surrounding fields are similar interests. Similarly, in the sankey diagram, the starting point would be an existing interest and the outgoing branches would each be a similar interest.
For the goal Develop, a packed circle chart, a polar area chart, a grouped bubble chart, and a node-link diagram were drawn (Figure 5). For instance, The idea of the packed circle chart was to show the interests of a user inside a bigger circle that represents the user’s interest profile. Next to this circle, possible interests are provided that are not necessarily similar to the existing interests, as the idea of this goal was to show new potential interests. The polar area chart provides a similar visualization, where the center represents the profile of the user and the areas around it represent unrelated interests. The grouped bubble chart consisted of circles in no particular relation to each other. This chart can be connected to multiple ideas, as the circles could all be independent from each other and thus represent unrelated topics. Another interpretation could be, that different groups of circles represent domains, and each circle would be a sub-domain. The idea of taking an existing interest and showing it from a different field of study was done with a node-link diagram, where an existing interest was placed as the original node. The second layer of nodes represent other fields of studies, and each field of study has outgoing edges leading to new potential interests.
For the goal Understand, we proposed three visualizations, namely, a flowchart, a fishbone diagram, and a linear process diagram which can be used to explain the algorithm behind the interest profile generation, either in a technical manner or in more simple terms that are understandable for lay-users. For instance, the fishbone diagram could be used to reveal the algorithm where each bone represents a single step in the interest model generation process (Figure 6). Additionally, the users were shown a modal where explanatory information is provided, which is representing the idea of showing the sources from where the users’ interests were extracted. This window contains a tab for the publications and another one for tweets. In the window, the users could see their published papers where the interest mentioned was highlighted. Additional information included the number of publications, the weight of the interest, the algorithm that was used, and the keywords that were used to generate this interest (Figure 6).
For the goal Scrutinize, more than three mock-ups for the same visualization were needed, as one of the ideas was to give the user the option to switch between different visualizations. As such, a word cloud, a packed circle chart, a polar area chart, a bar chart, and a view with sliders were drawn. The idea to switch between three different visualizations that represent the user profile was illustrated with a word cloud, a packed circle chart, and a polar area chart (Figure 7). For editing and interacting with their own profile, the users were shown a view with a bar chart, buttons, and sliders (Figure 8).
For the goal Socialize, a Venn diagram and a butterfly chart were proposed for the comparison of two users with similar profiles. The common interests would be in the middle of the Venn diagram, while in the butterfly chart, the profiles would be next to each other. To realize the idea of ’authors who influenced the user and are most influenced by the user’, we proposed a node-link diagram consisting of the user, who is represented via an icon, in the middle. To the left, three other user icons with arrows going to the middle user were shown. Three outgoing arrows from the middle user lead to three further user icons on the right. This graph could represent which authors influenced the user in the middle the most, and which authors were influenced by them the most (Figure 9).
Testing: The evaluation of the initial low-fidelity prototypes aims to receive feedback for optimization. This feedback was collected through a qualitative evaluation with five potential users following a think-aloud approach where we used open-ended questions to ask the users about their thoughts on each visualization and their opinions regarding which visualization could be fitting more for which goal. The procedure was to give a small description to explain the self-actualization goals and their meanings. After that, a short summary about the most voted ideas was given. Then, the users were shown each prototype one by one and were asked to which idea it might be related to, and if the prototype can indeed fulfill this idea. If not, they were asked for suggestions to change or add aspects.
Regarding the goal Explore, the target diagram and the sankey diagram were confusing to the users at first, while the node-link diagram could easily be linked to the existing ideas, like showing related interests or possible interests from scopes of different journals and conferences. Even with some interventions of the study moderator to explain a potential scenario for all the diagrams, the node-link diagram was still the preferred option.
For the goal Develop, users had difficulties relating the three mentioned visualizations to concrete ideas, and as such the opinions after a short discussion were very dissimilar. The visualizations that were preferred or could be related to the goal Develop and the concrete ideas were the node-link diagram and the two groups of separate circles.
For the ideas related to the goal of Understand, the users agreed that they would like the fishbone diagram as a technical explanation of how the interest profile was generated. Regarding a less technical explanation for lay-users, the users liked both a linear process diagram and the fishbone diagram. The prototype to show the source of an extracted interest was mainly favored, but some users agreed that it should show less text at first sight, and present more detailed information on demand via interactions.
Concerning the goal Scrutinize, the users were shown a word-cloud, a packed circle chart, and a polar area chart. The majority of users suggested to use these to realize the idea of having different views of their own interests, while mentioning that they did not like the polar area chart. One idea that was suggested was to replace the polar area chart with a simple bar chart, since it would fulfill the same purpose. The users also liked the prototype for interacting with their own profile. The sliders were liked the most in regard to direct editing of their interests.
Related to the goal Socialize, the users agreed that the Venn-diagram is a fitting visualization for a comparison between two users or more, while the butterfly chart was disliked. The graph which shows connections between users was suggested to be used to show the most common authors from the users’ own references and simultaneously to have an overview of who influenced the user as well as who was influenced by the user.
At the end of the think-aloud session, the users were asked to state a preference between two overarching design approaches. The first one is to present all visualizations separately from each other. That is, upon entering the site, the user would see one visualization and could see the others by scrolling down. The second approach is to create a dashboard with a starting page and buttons to navigate between the visualizations of each goal. The participants were shown each view with additional buttons or the option to click on certain elements to get a popover with options. Most users showed a strong preference for the dashboard-based visualization design.
In summary, the evaluation of the initial low-fidelity prototypes showed that the participants had different opinions regarding the presented prototypes. Their feedback was helpful to identify additional design details, allowing the visualizations to be refined, which will serve as input for the second design cycle.

5.3.3. Second Iteration

Prototyping: The next set of prototypes were also hand-drawn. As the users mentioned preference for a dashboard, this was the starting point for the next mock-ups. The new prototypes represent pages with visualizations that the user would see by clicking on one of the tabs above the dashboard or the buttons that were provided. The starting page in the dashboard shows a bar chart representing the seven most important interests in a user’s profile (Figure 10). Additionally, there is a “Show more” button at the bottom left of the dashboard. This was originally intended to give the users the option to change the number of interests that are shown to them. The arrow to the right of the bar chart takes the user to another view of the interest profile, i.e., a word cloud or a packed circle chart. The five tabs at the top represent each self-actualization goal. In addition to the tab “Explore”, the tabs “New Things”, “How does it work?”, “My Interests”, and “People” are supposed to realize the goals Develop, Understand, Scrutinize, and Socialize, respectively. By clicking on the tabs “Explore” and “New Things”, the users will see a node-link diagram. For “Explore”, similar interests to the own interest profile are shown, while for “New Things” unrelated topics are included. The “How does it work?” tab presents the user a fishbone diagram with the explanation of the algorithm. Clicking on the "My Interests" tab shows the slider-based view, where the user can add or delete interests and change their weights. The tab “People” contains the two visualizations related to the goal “Socialize”, namely, a Venn diagram to enable the comparison of two interest profiles (Figure 11) and a node-link diagram, taken from the first iteration.
Clicking on a single interest in the bar chart on the dashboard start page shows three buttons. “Similar interests” is the same idea as in “Explore”, just locally. This means that the users can explore based on one concrete interest, as shown in Figure 12. “Why this interest?” shows from which publication the interests were extracted. This is another version of the text-based view in the first iteration, just with less text and a compact overview, as proposed by the evaluators. When clicking on “Edit”, the users will see the slider-based view under the “My Interests” tab, this time with that specific interest highlighted.
Testing: The second evaluation round was conducted with five other users. First, the users were shown the dashboard starting page with the bar chart showing the interests and their respective weights. After that, the users were nudged to set the flow of the interview, with questions like “what would you do next?”. After getting to a new page, the users were asked if this behavior was expected for them, and how they would expect to interact with each page. This was done in order to get more concrete input from users regarding the specific interactions they expect regarding the dashboard. The naming and ordering of the tabs was also a subject of discussion. Regarding the “Show more” button, the users said that “the naming for this button is ambiguous and not really clear”. They also suggested to move it closer to the visualization in the middle in order to indicate that they are connected to each other. The arrow to switch between the views was not recognizable for most of the users. Two users did not see the arrow at all, and had to be reminded that it exists. Users suggested making it “stand out more visually” and to “somehow indicate the function of switching between different views”. Additionally the feedback to have an arrow for moving back as well was provided by three users. The opinions in regards to the places of the five tabs in the dashboard were very similar for the majority of users. Three users mentioned that they would expect the name “My Interests” to be “reserved for the starting page” and proposed to position this tab as the first one. Accordingly, the "How does it work?" tab should be the last tab, while “Explore”, “New Things”, and “People” should be in the middle. Two users mentioned that the naming for the “New Things" tab is “not fitting to the content of the tab”, but none could come up with a different suggestion. The majority suggested to change the name “People" to “Connect”, as it would reflect the content of this tab better. The tab “My Interests” for editing one’s interests was suggested to be named “Manage Interests”. Two users also suggested to keep this functionality as a button in the initial overview, and not as a separate tab.
All five users mentioned that they like the popup they get by clicking on one specific interest. One user said “Interacting with the visualization makes the dashboard more dynamic, and not just static information that I see once and nothing changes after that”. Regarding specific interactions, the users mentioned that they would like to click on the nodes of the node-link diagrams in “Explore” and “New Things”. They would then expect options like “Learn more”, as ”there might be a case where I do not know anything about the suggested interest. For this case a short description would help me decide whether I want to add it or not”. Correspondingly, an “Add to my interests” was wished for as well. For the two visualizations in “People”, four users said that they would expect to see the node-link diagram first, and see the Venn diagram only after interacting with specific authors seen in the network diagram. Users mentioned that the interests inside the Venn diagram should also be clickable, to be able to add them to the interest profile. One user stated “When seeing a common interest with another user, I would be interested to see the weight of this interest in their profile”. When asked how they would wish to access this information, the idea that they suggested was that “The system could simply show this when I hover over this common interest”.
Overall, the evaluation of the second prototypes showed that the participants had mostly similar positive opinions regarding the expected interactions with the dashboard. Their feedback served as input for the final design cycle.

5.3.4. Third Iteration

Prototyping: In the final design cycle, we created high-fidelity prototypes that can be interacted with by clicking and/or hovering. They were developed based on the users’ feedback from the previous iterations regarding the visualizations and the interactions the users would like to have. Under the tab “My interests” which now represents the dashboard starting page, the users can choose between three visualizations representing their interest model, namely, a bar chart (Figure 13), packed circle chart (Figure 14), or word cloud (Figure 15). They can use the arrows around the chart to move from a visualization to another. This design aims at giving users the possibility to select the visualization they feel more comfortable interacting with.
After clicking on an interest, users will see a popup with different options. Users can interact with their set of interests to look for similar interest or edit the existing ones. The option “Similar interests” leads the user to another modal, where a node-link diagram is shown (Figure 16). The center node is the initial interest, and the edges represent similar interests. Users can interact with the visualization by clicking on a node. This will result in showing the similarity score between the user’s main interest (the center node) and the new selected interest, as well as giving the user a set of options in form of a popup. The “Learn more” option gives a short description of the content of the node taken from Wikipedia. "Expand" will show three further nodes with similar interests to the chosen node. The “Add to my interest” option will add the new interest to the users interest model. Moreover, the user can undo the action or can modify the weight of the new interest, which is given 1 by default. After clicking on an interest, users can also select the option “Why this interest?”, where they will be led to another modal that explains the process of generating that specific interest (Figure 17). Further, we provide two ways to allow users to scrutinize their interest models. First, by selecting the option “Edit” after clicking on a specific interest. Second, users can click on “Manage interests” button on the top right corner of the dashboard. This button loads a popup page where users can see their interests and the weights of each interest. Clicking on the pen icon next to each interests allows the users to alter their profile by changing the weight of this interest using the slider or deleting it from their profile. Additionally, users can add new interests to their profile (Figure 18).
The tab “Explore” shows an overview of users’ interests as a node-link diagram (Figure 19). Analogous to “Similar interests”, users can interact with the visualization by clicking on a node. This will result in the same set of options, where users can see the popup with the options “Learn more”, “Expand”, and “Add to my interests”. The difference is that “Similar interests” suggests other interests related to one specific interest, while “Explore” suggests interests related the whole set of the user’s interests.
We renamed the tab “New Things” to “Discover”. Similar to “Explore”, under this tab users can interact with the visualization by clicking on the nodes (Figure 20). In this visualization, the square nodes represent different fields of study, while the round nodes represent some interests from that field. For the provided options shown in the popup, besides “Learn more” and “Add to my interests” which do the same actions like in “Explore”, the user has an extra option which is to “Remove” one of the suggested interests. The reason behind this option is that some of them could be not fitting the user’s taste at all, and also to have a cleaner visualization without crowded nodes.
We also renamed the tab “People” to “Connect”. Under this tab, users can click on one author and select between two options; (a) see how they are influencing each other (“Where am I cited?” and “Where did I cite this author?”) and (b) compare their interest models ((Figure 21). In the Venn diagram to compare two authors, when hovering over a common interest in the intersection area, the weight of that interest for each one of the authors will be shown. Also, a user has the option to add one of the other user’s interests to his or her profile (Figure 22).
Under the tab “How does it work?”, the user can see a step by step explanation of the process of the interest model generation. By clicking on each step, further details are shown on demand (Figure 23).
Testing: Following the same steps as in the second iteration, different five users were recruited to evaluate the final high-fidelity prototypes. We conducted a qualitative analysis with open-ended questions to gather user feedback on the proposed visualizations for the different self-actualization goals. Overall, the feedback collected from this last iteration shows that the users were satisfied with the design of the interactive visualizations which were perceived helpful to support users in exploring, developing, understanding, and scrutinizing their interest profiles as well as socializing with users having similar interests. The users provided few more suggestions for improvement that we summarize below.
For the node-link diagrams in the “Explore” tab and in the “Similar interests” option, all five users stated that they prefer to be able to expand the graph twice. This means being able to, first, see similar interests to their initial interest, and then seeing other similar ones, but to the newly added ones as well. We also found that the displayed similarity score between the interests was not well perceived by the users where they showed different understanding of this score. Notably, two users said they would prefer that the similarity score should be related to the initial node/interest, while two other users stated that they would expect to be shown the similarity to the node before. Accordingly, there was no agreement on what the similarity score should compare. In relation to the “Similar interests” option, two users reported that the loupe icon used for this option is misleading a bit and suggested to change it to a more meaningful icon. Moreover, one user mentioned that the “Expand” feature is a bit hidden, and he would like to see indicators showing that this option is available. Another user stated that, with a lot of interests, the visualization will be crowded, and she suggested to make the users able to see more or less similar interests.
Related to the visualizations under the “Discover” tab, the feedback provided by the users was quiet similar to the one in “Explore” and “Similar interests” in terms of how many times to expand the chart and the similarity score issue. However, since the provided items in this visualization are not very relevant to the user preferences, one user mentioned that she would prefer to delete unwanted interests, while two other users would prefer to hide it instead. Also, three users were expecting to have a confirmation pop-up when hiding/deleting an interest, and to have an undo button like when adding interests. Moreover, two users would like to have a list of the removed items.
Regarding the provided interactive visualization to explain the interest model generation, three users stated they are satisfied with the level of technical details provided and they don’t need more technical explanation. However, two users suggested to provide a “More info” button to see more technical explanation. Two users mentioned that “it’s not obvious that the elements in the chart are clickable”.
When interacting with the visualizations related to the Scrutinize self-actualization goal, the majority of the participants reported that if the chart is not showing all the interests, a “Show more” button should be added to show more than the seven most important interests. Although we are reflecting the weight of each interest using the size of the node in the circle packed chart and the size of the word in the word cloud visualizations, two participants stated that “in the views, show me the weights when hovering over the circles/words”. While adding an interest, three users said they would expect an auto-completion feature. Moreover, one user stated that after adding a new interest, he was expecting to see it with kind of indication (green tick or new badge) in the visualization.
Regarding the “Connect” interface, most of the users’ feedback was focused on adding a "Show more" button. Particularly, in the node-link diagram, three users stated that they want to have the option to see more than three authors on both sides. Moreover, one user stated that “he number was not obvious that it means the number of citations”. Also when showing the list of papers, they stated that they prefer to “see a maximum of five items per page and add a navigation option to see the rest”. In the same direction, three users mentioned that they would like to sort lists of papers by clicking on “Year”, “Title” and “Authors”. Another user suggested to “show me the overall similarity score between a selected author and me”.

6. Conclusions and Future Work

In this paper, we focused on the effective design of interactive visualizations of transparent user models for self-actualization. We presented EDUSS, a theoretically-sound conceptual framework for self-actualization goals of transparent user modeling, consisting of five main goals: Explore, Develop, Understand, Scrutinize, and Socialize. As a proof of concept, we applied the proposed framework in the scientific research domain to systematically design interactive visualizations that can support the different self-actualization goals, following a human-centered design (HCD) approach. The user feedback shows that the EDUSS framework has the potential to be a useful process for the development of transparent user models for self-actualization and an effective tool for creating effective interactive visualizations of these models. However, due to the small sample size of the participants, the results of the study cannot be generalized. In fact, the framework and the resulting visualizations were mainly evaluated with local students interested in scientific literature, who were familiar with visualizations. A wider population would be helpful to assess the utility of the framework and the visualizations.
The study presented in this paper has provided us with insights to further work on transparent user modeling for self-actualization. In future work, we plan to implement the designed visualizations and integrate them into our transparent recommendation and interest modeling application (RIMA). Moreover, we will conduct a large qualitative and quantitative user study to validate the effectiveness of the EDUSS framework and the resulting visualizations to achieve the different self-actualization goals. Further, we will study the effects of explaining recommender systems by opening, scrutinizing, and explaining black-box user profiles.

Author Contributions

Conceptualization, M.G., M.A.C. and A.T.; methodology, M.G. and M.A.C.; validation, M.A.C.; writing—original draft preparation, M.G., A.T. and Q.U.A.; writing—review and editing, M.G. and M.A.C.; visualization, M.G., M.A.C., A.T. and S.J.; supervision, M.A.C. All authors have read and agreed to the published version of the manuscript.

Funding

This work was party funded by the German Research Foundation (DFG) under grant No. GRK 2167, Research Training Group “User-Centred Social Media”. The APC was supported by the Open Access Publication Fund of the University of Duisburg-Essen.

Institutional Review Board Statement

The study was conducted according to the guidelines of the Declaration of Helsinki, and approved by the Ethics Committee of the Department of Computer Science and Applied Cognitive Science of the Faculty of Engineering at the University of Duisburg-Essen.

Informed Consent Statement

Informed consent was obtained from all subjects involved in the study.

Data Availability Statement

The interview data presented in this study are not publicly available due to ethical and privacy restrictions.

Conflicts of Interest

The authors declare no conflict of interest.

References

  1. Bull, S.; Kay, J. SMILI: A framework for interfaces to learning data in open learner models, learning analytics and related fields. Int. J. Artif. Intell. Educ. 2016, 26, 293–331. [Google Scholar] [CrossRef] [Green Version]
  2. Tintarev, N.; Masthoff, J. Explaining recommendations: Design and evaluation. In Recommender Systems Handbook; Springer: New York, NY, USA, 2015; pp. 353–382. [Google Scholar]
  3. Wasinger, R.; Wallbank, J.; Pizzato, L.; Kay, J.; Kummerfeld, B.; Böhmer, M.; Krüger, A. Scrutable user models and personalised item recommendation in mobile lifestyle applications. In International Conference on User Modeling, Adaptation, and Personalization; Springer: Berlin/Heidelberg, Germany, 2013; pp. 77–88. [Google Scholar]
  4. Knijnenburg, B.P.; Sivakumar, S.; Wilkinson, D. Recommender systems for self-actualization. In Proceedings of the 10th ACM Conference on Recommender Systems, Boston, MA, USA, 15–19 September 2016; pp. 11–14. [Google Scholar]
  5. Wilkinson, D. Testing a Recommender System for Self-Actualization. In Proceedings of the 12th ACM Conference on Recommender Systems, Vancouver, BC, Canada, 2–7 October 2018. [Google Scholar] [CrossRef]
  6. Graus, D.; Sappelli, M.; Manh Chu, D. “Let me tell you who you are”-Explaining recommender systems by opening black box user profiles. In Proceedings of the 2nd Fatrec Workshop on Responsible Recommendation, Vancouver, BC, Canada, 2–7 October 2018. [Google Scholar]
  7. Wasinger, R.; Fry, M.; Kay, J.; Kummerfeld, B. User modelling ecosystems: A user-centred approach. In International Conference on User Modeling, Adaptation, and Personalization; Springer: Berlin/Heidelberg, Germany, 2012; pp. 334–339. [Google Scholar]
  8. Ahn, J.W.; Brusilovsky, P.; Grady, J.; He, D.; Syn, S.Y. Open user profiles for adaptive news systems: Help or harm? In Proceedings of the 16th International Conference on World Wide Web, Banff, AB, Canada, 8–12 May 2007; pp. 11–20. [Google Scholar] [CrossRef]
  9. Rahdari, B.; Brusilovsky, P.; Babichenko, D. Personalizing information exploration with an open user model. In Proceedings of the 31st ACM Conference on Hypertext and Social Media, Orlando, FL, USA, 13–15 July 2020; pp. 167–176. [Google Scholar]
  10. Conati, C.; Porayska-Pomsta, K.; Mavrikis, M. AI in Education needs interpretable machine learning: Lessons from Open Learner Modelling. arXiv 2018, arXiv:1807.00154. [Google Scholar]
  11. Bull, S.; Kay, J. Open learner models. In Advances in Intelligent Tutoring Systems; Springer: Berlin/Heidelberg, Germany, 2010; pp. 301–322. [Google Scholar]
  12. Basu, S.; Biswas, G.; Kinnebrew, J.S. Learner modeling for adaptive scaffolding in a computational thinking-based science learning environment. User Model. User-Adapt. Interact. 2017, 27, 5–53. [Google Scholar] [CrossRef]
  13. Putnam, V.; Conati, C. Exploring the Need for Explainable Artificial Intelligence (XAI) in Intelligent Tutoring Systems (ITS). In Proceedings of the Joint ACM IUI 2019 Workshops, Los Angeles, CA, USA, 20 March 2019; Volume 19, pp. 1–7. [Google Scholar]
  14. Conati, C.; Barral, O.; Putnam, V.; Rieger, L. Toward personalized XAI: A case study in intelligent tutoring systems. Artif. Intell. 2021, 298, 103503. [Google Scholar] [CrossRef]
  15. Li, S.; Zhao, H. A Survey on Representation Learning for User Modeling. In Proceedings of the International Joint Conference on Artificial Intelligence, Yokohama, Japan, 7–15 January 2021; pp. 4997–5003. [Google Scholar]
  16. Hocine, N. Personalized serious games for self-regulated attention training. In Proceedings of the Adjunct Publication of the 27th Conference on User Modeling, Adaptation and Personalization, Larnaca, Cyprus, 9–12 June 2019; pp. 251–255. [Google Scholar]
  17. Hooshyar, D.; Bardone, E.; Mawas, N.E.; Yang, Y. Transparent Player Model: Adaptive Visualization of Learner Model in Educational Games. In International Conference on Innovative Technologies and Learning; Springer: Berlin/Heidelberg, Germany, 2020; pp. 349–357. [Google Scholar]
  18. Abdi, S.; Khosravi, H.; Sadiq, S.; Gasevic, D. Complementing educational recommender systems with open learner models. In Proceedings of the Tenth International Conference on Learning Analytics & Knowledge, Frankfurt, Germany, 23–27 March 2020; pp. 360–365. [Google Scholar]
  19. Bodily, R.; Kay, J.; Aleven, V.; Jivet, I.; Davis, D.; Xhakaj, F.; Verbert, K. Open learner models and learning analytics dashboards: A systematic review. In Proceedings of the 8th International Conference on Learning Analytics and Knowledge, Sydney, Australia, 7–9 March 2018; pp. 41–50. [Google Scholar]
  20. Bull, S.; Ginon, B.; Boscolo, C.; Johnson, M. Introduction of learning visualisations and metacognitive support in a persuadable open learner model. In Proceedings of the Sixth International Conference on Learning Analytics & Knowledge, Edinburg, UK, 25–29 April 2016; pp. 30–39. [Google Scholar]
  21. Barria Pineda, J.; Brusilovsky, P. Making educational recommendations transparent through a fine-grained open learner model. In Proceedings of the Workshop on Intelligent User Interfaces for Algorithmic Transparency in Emerging Technologies at the 24th ACM Conference on Intelligent User Interfaces, IUI 2019, Los Angeles, CA, USA, 20 March 2019; Volume 2327. [Google Scholar]
  22. Barria-Pineda, J.; Brusilovsky, P. Explaining educational recommendations through a concept-level knowledge visualization. In Proceedings of the 24th International Conference on Intelligent User Interfaces: Companion, Marina del Rey, CA, USA, 17–20 March 2019; pp. 103–104. [Google Scholar]
  23. Ain, Q.U.; Chatti, M.A.; Guesmi, M.; Joarder, S. A Multi-Dimensional Conceptualization Framework for Personalized Explanations in Recommender Systems. In Proceedings of the Joint 27th International Conference on Intelligent User Interfaces, Helsinki, Finland, 22–25 March 2022. [Google Scholar]
  24. Guesmi, M.; Chatti, M.; Vorgerd, L. Input or Output: Effects of Explanation Focus on the Perception of Explainable Recommendation with Varying Level of Details. In Proceedings of the IntRS’21: Joint Workshop on Interfaces and Human Decision Making for Recommender Systems, Virtual Event, 25 September 2021; Volume 2948, pp. 55–72. [Google Scholar]
  25. Balog, K.; Radlinski, F.; Arakelyan, S. Transparent, scrutable and explainable user models for personalized recommendation. In Proceedings of the 42nd International ACM SIGIR Conference on Research and Development in Information Retrieval, Paris, France, 21–25 July 2019; pp. 265–274. [Google Scholar]
  26. Guesmi, M.; Chatti, M.; Sun, Y.; Zumor, S.; Ji, F.; Muslim, A.; Vorgerd, L.; Joarder, S. Open, scrutable and explainable interest models for transparent recommendation. In Proceedings of the Joint Proceedings of the ACM IUI 2021 Workshops, College Station, TX, USA, 13–17 April 2021. [Google Scholar]
  27. Sullivan, E.; Bountouridis, D.; Harambam, J.; Najafian, S.; Loecherbach, F.; Makhortykh, M.; Kelen, D.; Wilkinson, D.; Graus, D.; Tintarev, N. Reading news with a purpose: Explaining user profiles for self-actualization. In Proceedings of the Adjunct Publication of the 27th Conference on User Modeling, Adaptation and Personalization, Larnaca, Cyprus, 9–12 June 2019; pp. 241–245. [Google Scholar]
  28. Tintarev, N.; Masthoff, J. Designing and evaluating explanations for recommender systems. In Recommender Systems Handbook; Springer: New York, NY, USA, 2011; pp. 479–510. [Google Scholar]
  29. Badenes, H.; Bengualid, M.N.; Chen, J.; Gou, L.; Haber, E.; Mahmud, J.; Nichols, J.W.; Pal, A.; Schoudt, J.; Smith, B.A.; et al. System U: Automatically deriving personality traits from social media for people recommendation. In Proceedings of the 8th ACM Conference on Recommender Systems, Silicon Valley, CA, USA, 6–10 October 2014; pp. 373–374. [Google Scholar]
  30. Du, F.; Plaisant, C.; Spring, N.; Shneiderman, B. Visual interfaces for recommendation systems: Finding similar and dissimilar peers. ACM Trans. Intell. Syst. Technol. (TIST) 2018, 10, 1–23. [Google Scholar] [CrossRef]
  31. Barria-Pineda, J.; Akhuseyinoglu, K.; Brusilovsky, P. Explaining need-based educational recommendations using interactive open learner models. In Proceedings of the Adjunct Publication of the 27th Conference on User Modeling, Adaptation and Personalization, Larnaca, Cyprus, 9–12 June 2019; pp. 273–277. [Google Scholar]
  32. Green, S.J.; Lamere, P.; Alexander, J.; Maillet, F.; Kirk, S.; Holt, J.; Bourque, J.; Mak, X.W. Generating transparent, steerable recommendations from textual descriptions of items. In Proceedings of the Third ACM Conference on Recommender Systems, New York, NY, USA, 23–25 October 2009; pp. 281–284. [Google Scholar]
  33. Bakalov, F.; Meurs, M.J.; König-Ries, B.; Sateli, B.; Witte, R.; Butler, G.; Tsang, A. An approach to controlling user models and personalization effects in recommender systems. In Proceedings of the 2013 International Conference on Intelligent User Interfaces, Santa Monica, CA, USA, 19–22 March 2013; pp. 49–56. [Google Scholar]
  34. Jin, Y.; Seipp, K.; Duval, E.; Verbert, K. Go with the flow: Effects of transparency and user control on targeted advertising using flow charts. In Proceedings of the International Working Conference on Advanced Visual Interfaces, Bari, Italy, 7–10 June 2016; pp. 68–75. [Google Scholar]
  35. Du, F.; Malik, S.; Theocharous, G.; Koh, E. Personalizable and interactive sequence recommender system. In Proceedings of the Extended Abstracts of the 2018 CHI Conference on Human Factors in Computing Systems, Montreal, QC, Canada, 21–26 April 2018; pp. 1–6. [Google Scholar]
  36. Zürn, M.; Eiband, M.; Buschek, D. What if? Interaction with Recommendations. In Proceedings of the IUI workshop on Explainable Smart Systems and Algorithmic Transparency in Emerging Technologies, Cagliari, Italy, 17–20 March 2020. [Google Scholar]
  37. Rahdari, B.; Brusilovsky, P.; Javadian Sabet, A. Connecting Students with Research Advisors Through User-Controlled Recommendation. In Proceedings of the Fifteenth ACM Conference on Recommender Systems, Virtual Event, 27 September–1 October 2021; pp. 745–748. [Google Scholar]
  38. Liang, Y.; Willemsen, M.C. Interactive Music Genre Exploration with Visualization and Mood Control. In Proceedings of the 26th International Conference on Intelligent User Interfaces, College Station, TX, USA, 14–17 April 2021; pp. 175–185. [Google Scholar]
  39. Huang, X.; Fang, Q.; Qian, S.; Sang, J.; Li, Y.; Xu, C. Explainable interaction-driven user modeling over knowledge graph for sequential recommendation. In Proceedings of the 27th ACM International Conference on Multimedia, Nice, France, 21–25 October 2019; pp. 548–556. [Google Scholar]
  40. Guesmi, M.; Chatti, M.A.; Vorgerd, L.; Joarder, S.; Zumor, S.; Sun, Y.; Ji, F.; Muslim, A. On-demand Personalized Explanation for Transparent Recommendation. In Proceedings of the Adjunct Proceedings of the 29th ACM Conference on User Modeling, Adaptation and Personalization, Utrecht, The Netherlands, 21–25 June 2021; pp. 246–252. [Google Scholar]
  41. Goldstein, K. Human Nature in the Light of Psychopathology; Harvard University Press: Cambridge, MA, USA, 1940. [Google Scholar]
  42. Rogers, C.R. Client-Centered Therapy; Houghton-Mifflin: Boston, MA, USA, 1951; Volume 7. [Google Scholar]
  43. Maslow, A.H. A theory of human motivation. Psychol. Rev. 1943, 50, 370. [Google Scholar] [CrossRef] [Green Version]
  44. Rogers, C.R. The Actualizing Tendency in Relation to “motives” and to consciousness. In Nebraska Symposium on Motivation; Jones, M.R., Ed.; U. Nebraska Press: Lincoln, NE, USA, 1963; pp. 1–24. [Google Scholar]
  45. Maslow, A.H. Toward a Psychology of Being; D. van Nostrand Company: Princeton, NJ, USA, 1962. [Google Scholar]
  46. Maslow, A.H. Motivation and Personality Harper and Row; Longman an Imprint ofAddison Wesley Longman, Inc.: New York, NY, USA, 1954. [Google Scholar]
  47. Hanlon, J.M. Administration and Education: Toward a Theory of Self-Actualization; Wadsworth Publishing Company: Belmont, CA, USA, 1968. [Google Scholar]
  48. Dezhbankhan, F.; Baranovich, D.L.; Abedalaziz, N. Impacts of Direct Metacognitive Instructions on Self-Actualization. Int. Educ. Stud. 2020, 13, 1–9. [Google Scholar] [CrossRef]
  49. Akçay, C.; Akyol, B. Self-actualization levels of participants in lifelong education centers. Procedia-Soc. Behav. Sci. 2014, 116, 1577–1580. [Google Scholar] [CrossRef] [Green Version]
  50. Amir Kiaei, Y. The Relationship between Metacognition, Self-Actualization, and Well-Being among University Students: Reviving Self-Actualization as the Purpose of Education; Florida International University Electronic Theses and Dissertations. 1367; Florida International University: Miami, FL, USA, 2014. [Google Scholar]
  51. Sperling, R.A.; Howard, B.C.; Staley, R.; DuBois, N. Metacognition and self-regulated learning constructs. Educ. Res. Eval. 2004, 10, 117–139. [Google Scholar] [CrossRef]
  52. Shipunova, O.D.; Berezovskaya, I.P.; Smolskaia, N.B. The role of student’s self-actualization in adapting to the e-learning environment. In Proceedings of the Seventh International Conference on Technological Ecosystems for Enhancing Multiculturality, León, Spain, 16–18 October 2019; pp. 745–750. [Google Scholar]
  53. Guo, L. Beyond the top-N: Algorithms that generate recommendations for self-actualization. In Proceedings of the 12th ACM Conference on Recommender Systems, Vancouver, BC, Canada, 2 October 2018; pp. 573–577. [Google Scholar]
  54. Harambam, J.; Bountouridis, D.; Makhortykh, M.; Van Hoboken, J. Designing for the better by taking users into account: A qualitative evaluation of user control mechanisms in (news) recommender systems. In Proceedings of the 13th ACM Conference on Recommender Systems, Copenhagen, Denmark, 16–20 September 2019; pp. 69–77. [Google Scholar]
  55. Liang, Y. Recommender system for developing new preferences and goals. In Proceedings of the 13th ACM Conference on Recommender Systems, Copenhagen, Denmark, 16–20 September 2019; pp. 611–615. [Google Scholar]
  56. Kay, J. Lifelong learner modeling for lifelong personalized pervasive learning. IEEE Trans. Learn. Technol. 2008, 1, 215–228. [Google Scholar] [CrossRef]
  57. Liang, Y.; Willemsen, M.C. Personalized recommendations for music genre exploration. In Proceedings of the 27th ACM Conference on User Modeling, Adaptation and Personalization, Larnaca, Cyprus, 9–12 June 2019; pp. 276–284. [Google Scholar]
  58. Kumar, J.; Tintarev, N. Using Visualizations to Encourage Blind-Spot Exploration. In Proceedings of the Joint Workshop on Interfaces and Human Decision Making for Recommender Systems, Vancouver, BC, Canada, 2–7 October 2018; pp. 53–60. [Google Scholar]
  59. Tintarev, N.; Rostami, S.; Smyth, B. Knowing the unknown: Visualising consumption blind-spots in recommender systems. In Proceedings of the 33rd Annual ACM Symposium on Applied Computing, Pau, France, 9–13 April 2018; pp. 1396–1399. [Google Scholar]
  60. Kunkel, J.; Schwenger, C.; Ziegler, J. Newsviz: Depicting and controlling preference profiles using interactive treemaps in news recommender systems. In Proceedings of the 28th ACM Conference on User Modeling, Adaptation and Personalization, Genoa, Italy, 14–17 July 2020; pp. 126–135. [Google Scholar]
  61. Bull, S.; Al-Shanfari, L. Negotiating individual learner models in contexts of peer assessment and group learning. In Proceedings of the Workshops at the 17th International Conference on Artificial Intelligence in Education AIED 2015, Madrid, Spain, 22–26 June 2015; Volume 1432, pp. 1–6. [Google Scholar]
  62. Maslow, A.H. Self-Actualization; Big Sur Recordings: Tiburon, CA, USA, 1971. [Google Scholar]
  63. Norman, D. The Design of Everyday Things: Revised and Expanded Edition; Basic Books; A Member of the Perseus Books Group: New York, NY, USA, 2013. [Google Scholar]
  64. Chatti, M.A.; Ji, F.; Guesmi, M.; Muslim, A.; Singh, R.K.; Joarder, S.A. SIMT: A Semantic Interest Modeling Toolkit. In Proceedings of the 29th ACM Conference on User Modeling, Adaptation and Personalization, Utrecht, The Netherlands, 21–25 June 2021; pp. 75–78. [Google Scholar]
  65. Harte, R.; Quinlan, L.R.; Glynn, L.; Rodríguez-Molinero, A.; Baker, P.M.; Scharf, T.; ÓLaighin, G. Human-centered design study: Enhancing the usability of a mobile phone app in an integrated falls risk detection system for use by older adult users. JMIR MHealth UHealth 2017, 5, e7046. [Google Scholar] [CrossRef] [PubMed]
  66. Abras, C.; Maloney-Krichmar, D.; Preece, J. User-centered design. In Encyclopedia of Human-Computer Interaction; Bainbridge, W., Ed.; Sage Publisher: Thousand Oaks, CA, USA, 2004; Volume 37, pp. 445–456. [Google Scholar]
  67. Petrelli, D.; Not, E. User-centred design of flexible hypermedia for a mobile guide: Reflections on the HyperAudio experience. User Model. User-Adapt. Interact. 2005, 15, 303–338. [Google Scholar] [CrossRef] [Green Version]
  68. Why You Only Need to Test with 5 Users. Available online: https://www.nngroup.com/articles/why-you-only-need-to-test-with-5-users/ (accessed on 20 May 2022).
Figure 1. The EDUSS Framework for self-actualization goals of transparent user modeling.
Mti 06 00042 g001
Figure 2. Interest model generation in RIMA [64].
Mti 06 00042 g002
Figure 3. Results of the ideation phase in the first iteration related to the goal Explore.
Mti 06 00042 g003
Figure 4. Explore: Visualizing similar interests.
Mti 06 00042 g004
Figure 5. Develop: Visualizing new potential interests.
Mti 06 00042 g005
Figure 6. Understand: Visualizing the interest model generation process.
Mti 06 00042 g006
Figure 7. Scrutunize: Visualizations for viewing the user profile.
Mti 06 00042 g007
Figure 8. Scrutunize: Visualizations for editing the user profile.
Mti 06 00042 g008
Figure 9. Socialize: Visualizing users with similar interests and influencing/influenced authors.
Mti 06 00042 g009
Figure 10. Dashboard starting page.
Mti 06 00042 g010
Figure 11. Venn diagram for comparing two interest profiles.
Mti 06 00042 g011
Figure 12. Node-link diagram for exploration starting from one interest.
Mti 06 00042 g012
Figure 13. Interest model as bar chart.
Mti 06 00042 g013
Figure 14. Interest model as packed circle chart.
Mti 06 00042 g014
Figure 15. Interest as word cloud.
Mti 06 00042 g015
Figure 16. Similar interests.
Mti 06 00042 g016
Figure 17. Why this interest.
Mti 06 00042 g017
Figure 18. Edit interests.
Mti 06 00042 g018
Figure 19. Explore interests.
Mti 06 00042 g019
Figure 20. Discover new interests.
Mti 06 00042 g020
Figure 21. Influence diagram.
Mti 06 00042 g021
Figure 22. Compare user interest profiles.
Mti 06 00042 g022
Figure 23. A step by step explanation of the interest model generation.
Mti 06 00042 g023
Table 1. Potential self-actualization goals.
GoalDescriptionReferences
ExploreExplore one’s own tastes.[4]
Explore underdeveloped tastes.
Cover unexplored potential preferences.[53]
Explore tastes that go beyond the mainstream.
Explore one’s unique personal preferences.[6]
Explore beyond their known interests.[54]
Explore new items that they might be interesting and further build new preferences.[55]
Explore new tastes.[38]
Enable the learner to explore their learner model.[56]
DevelopDevelop new preferences.[38,55,57]
Develop deep learning and meta-cognitive approaches to learning.[1]
Develop ones’ unique tastes and preferences.[4,5,6,53]
The propensity of an individual to become actualized in his potential.[41]
The tendency of an organism to develop its abilities in order to preserve and develop its personality.[44]
Self-actualization can be described as the complete realization of one’s potential ... which involve the full development of one’s abilities and appreciation for life.[45]
Broaden horizonsMake small steps outside of current interests.[27]
Offer “news from unexplored territories”, inspired by the notion of diversity, helps readers to expand their horizon.[54]
Discover the unexploredUrge users to explore topics they are largely outside of their current interests.[27]
Offer “surprising news”, inspired by the notion of serendipity, generates a random order of items.[54]
Recognize blind spots
in the user model
Encourage users to identify their blind spots through visualizations.[58,59]
Make users aware of blind-spots in their profile.[60]
Present users their filter bubbles (blind spots) to encourage them to explore new items[55]
Cover all users’ tastesHelp the user discover all of their preferences.[4]
Discover new and unknown areas of one’s own taste.
Get a more holistic representation of the user’s tastes.[53]
The system is able to cover all of user’s tastes.[5]
Understand own
unique tastes
Support users in understanding their unique tastes and preferences.[4,5,53]
Offer “news from the other ideological side”, inspired by the notion of intellectual diplomacy, helps people to understand their ideological counterparts.[54]
Understand the inner
workings of the system
When users feel educated about algorithmic workings of a RS, they can be more motivated to explore items beyond their usual interests.[60]
The system will explain why it believes its current assessment to be correct by providing evidence to support these beliefs.[10]
By exposing the user profile we can support users in better understanding part of the underlying mechanisms of the recommender system.[6]
Correct or confirmPresenting users with a list of things the system predicts the user will hate will allow users to correct or confirm these predictions.[4,5]
Providing users the ability to correct their profiles when they disagree with (parts of) it.[1,6,61]
Show recommendations with a low predicted rating, allowing users to correct potential “false negatives”.[53]
The individual’s self-concept is maintained and enhanced via reflection and the reinterpretation of various experiences which enable the individual to recover, change and develop.[42]
View the user modelUsers may view the model’s current evaluation of relevant student’s states and abilities.[1,10,61]
Negotiate the user modelThe user and the system work together to arrive at an assessment.[1,5,10]
Edit the user modelThe user can directly change the model assessment and system’s representation of their knowledge at will.[1,3,10,32]
Develop taste-based
communities
Users actively recommend items to other users which can contribute to a sense of fulfilment (helping others) and pride (being called upon for expertise).[4]
Recommend groups of users to come together and develop “taste-based communities” that are based on shared preferences.
Table 2. Mechanisms to achieve self-actualization goals.
MechanismDescriptionReferences
Increase diversity graduallyNot connect users to completely unrelated items, but gradually increase diversity, to slowly move out of their epistemic bubble[27]
Visualize underdeveloped parts of a user modelVisualizing under-explored parts of a user profile improves exploration[27]
Connect users based on shared preferencesRecommend groups of users to come together and develop “taste-based communities” that are based on shared preferences, e.g., regarding certain controversial items.[4]
Explore under-represented preferencesFocus on exploring underdeveloped tastes, rather than optimizing the probability that users will like the recommendations.[4,53]
Detect not just some but all of the user’s preferencesShow a list of hard-to-predict items that may be used to identify unexpressed preferences.[4]
Try new thingsRecommenders can help users to better understand their own tastes, because developing one’s tastes means trying new things, even if this includes things that one may not like.[4,5]
Access the user model with varying levels of interactivityAllow users to access their content with varying levels of interactivity[1,10]
Explain the user model (i.e., the system’s input)Summarize and visualize the high dimensional internal representations of users (i.e., user profiles) in such a way that users can interpret them, and take action on them.[6,27]
Table 3. A summary of self-actualization goals along with their related mechanisms.
GoalsSub-GoalsMechanisms
ExploreBroaden horizonsIncrease diversity gradually
Recognize blind spots in the user modelExplore under-represented preferences
DevelopDiscover the unexploredVisualize underdeveloped parts of a user model
Try new things
Cover all users’ tastesDetect not just some but all of the user’s preferences
Understand own unique tastes
Understand Explain the user model (i.e., the system’s input)
Understand the inner workings of the system
ScrutinizeCorrect or confirmAccess the user model with varying levels of interactivity
View the user model
Negotiate the user model
Edit the user model
SocializeDevelop taste-based communitiesConnect users based on shared preferences
Publisher’s Note: MDPI stays neutral with regard to jurisdictional claims in published maps and institutional affiliations.

