Article

User Authentication Recognition Process Using Long Short-Term Memory Model

1
Electrical and Computer Engineering Department, Texas Tech University, Lubbock, TX 79409, USA
2
Department of Computer Science & Data Science, School of Applied Computational Sciences, Meharry Medical College, Nashville, TN 37208, USA
3
Educational Psychology, Leadership & Counseling Department, Texas Tech University, Lubbock, TX 79409, USA
*
Author to whom correspondence should be addressed.
Multimodal Technol. Interact. 2022, 6(12), 107; https://doi.org/10.3390/mti6120107
Submission received: 19 October 2022 / Revised: 18 November 2022 / Accepted: 24 November 2022 / Published: 30 November 2022

Abstract

:
User authentication (UA) is the process by which biometric techniques are used by a person to gain access to a physical or virtual site. UA has been implemented in various applications such as financial transactions, data privacy, and access control. Various techniques, such as facial and fingerprint recognition, have been proposed for healthcare monitoring to address biometric recognition problems. Photoplethysmography (PPG) technology is an optical sensing technique which collects volumetric blood change data from the subject’s skin near the fingertips, earlobes, or forehead. PPG signals can be readily acquired from devices such as smartphones, smartwatches, or web cameras. Classical machine learning techniques, such as decision trees, support vector machine (SVM), and k-nearest neighbor (kNN), have been proposed for PPG identification. We developed a UA classification method for smart devices using long short-term memory (LSTM). Specifically, our UA classifier algorithm uses raw signals so as not to lose the specific characteristics of the PPG signal coming from each user’s specific behavior. In the UA context, false positive and false negative rates are crucial. We recruited thirty healthy subjects and used a smartphone to take PPG data. Experimental results show that our Bi-LSTM-based UA algorithm based on the feature-based machine learning and raw data-based deep learning approaches provides 95.0% and 96.7% accuracy, respectively.

1. Introduction

Photoplethysmography (PPG) signals have been used to gather biometric information (BI) from patients by measuring volumetric blood changes in blood vessels through the skin [1,2]. PPG is an inexpensive and user-friendly method, which can be implemented for clinical and non-clinical applications [1,2,3,4]. PPG signals are acquired in a non-invasive mode, promoting the contactless monitoring in non-clinical settings [1,2,3,4]. Fatemehsadat et al. [1] and [3] proposed contactless PPG monitoring methods which are robust at motion and noise artifacts (MNAs). Xiao et al. [2] used PPG technology for clinical monitoring during intermittent vascular occlusions. Monay et al. [4] proposed a smartphone-based blood pressure monitoring method. PPG data was acquired unobtrusively for heart rate monitoring in [4]. Recently, smartphones equipped with an illumination source and cameras have been used to collect PPG information from a subject’s fingertip and face. Moreover, smartwatches equipped with light-emitting elements and photodetectors can measure PPG signals from a subject’s wrist. Smartphone PPG has been used to estimate heart rate [5], blood oxygen saturation levels [6], and respiration rate detection [7] algorithms. However, using PPG to recognize users’ identities using smartphones has not been thoroughly studied [8,9,10].
User authentication (UA) is the technique that determines a subject’s identification from personal and exclusive characteristics. There are many types of UA applications, such as:
(1) Password-based UA methods: There have been proposed UA methods based on passwords [11,12,13,14,15]. Tivkaa et al. [11] proposed an authentication solution to address online password-guessing attacks on login forms as implemented in generic web applications. Sherry et al. [12] designed a password-based UA system that allows the user to complete two online login attempts using his credentials. Vikas et al. [13] implemented an additional way to authenticate people by graphical passwords using color and text schemes. Smart and wearable devices provide the option to authenticate users by passcodes as in [14]. Seung-hwan et al. [14] combined passwords with a fingerprint-based biometric technique. The main disadvantage of these UA-based password techniques is that they are based on their representation of compromised and non-exclusive individual data. By employing these types of data as authentication options, the system is highly vulnerable to identity theft. Hackers have a higher probability of gaining access to UA systems. Mudassar et al. [15] described password attacks and their unsafe aspects by using them as the main UA option.
(2) RFID/smart card-based UA methods: Radio frequency identification (RFID)/smart card UA methods have been proposed [16,17,18,19]. These UA methods have been used for accessing facilities. Sreelekshmi et al. [16] developed an RFID-based smart card for access control in school facilities. Praveen et al. [17] proposed a UA method based on smart cards combined with passcodes. Biometric data have been already combined with smart card UA-based methods as in [18]. Olaf et al. [18] and Anuj et al. [19] improved the UA-based smart card technique by combining the smart card with the biometric-based hand-written signature factor of the subject. These RFID/smart card-based UA methods have their limitations; for example, if cards are lost and intruders take cards, then authentication will not securely do its task.
(3) Biometric-based UA methods: Currently, the most widely-used way to authenticate users on wearable devices is the biometric-based UA method [20,21,22,23,24,25,26]. Some biometric-based UA methods are based on face recognition [20,21,22]. Face recognition-based has the limitation that predicting the user’s identity is based on visible data which could be easily manipulated. Furthermore, external and environmental artifacts such as face masks, glasses, and illumination sources may interfere with the UA method, which results in lowering the authentication accuracy. Some biometric-UA methods are based on fingerprints [23,24,25,26], which has the limitation that additional hardware is required.
Our research is fully based on UA-based biometric applications [27]. Recently, UA has been adopted in various situations, such as (1) physical fingerprint for Android phones [23,27], and (2) facial recognition in the iPhones (Face ID) [20]. Currently, most of the UA research focuses on using subjects’ faces [20,21,22,28]. U.S. adults spend 3 h per day on average using their smartphones. In 2021, there were 3.8 billion smartphone users worldwide [29]. The Apple iPhone device uses a facial recognition sensor to control access. Major companies spend millions of dollars on laser technology which is critical for facial recognition [30]. However, these face recognition-based UA technologies require ambient light and demand users to constantly configure the device’s settings since physical appearance is not stable in the time domain. When an unauthorized person uses a picture of an authorized person, the unauthorized person can access the phone. On the other hand, an authorized user may be denied access due to environmental and external effects, e.g., wearing glasses and illumination may affect the recognition process. Moreover, a face mask interferes with facial recognition. Biometrics such as PPG signals are individual markers that could be useful for UA since they do not require external hardware and can provide touchless monitoring.
Recently, several studies utilized classical machine learning (ML) techniques for UA [10,31,32,33]. Bengie et al. [10] utilized a decision tree algorithm for user authentication (UA) with smartphone PPG signals while Xiao et al. [31] and Ahmet et al. [32] applied a support vector machine (SVM) and k-nearest neighbor (kNN) on fingertip PPG signals and PPG signals obtained from PPG equipment. Authors in [31,32] achieved an accuracy of ~90% and 94.44%, respectively.
To enhance UA identification or recognition accuracy performance, several classification algorithms have been implemented in the past, including the recurrent neural network (RNN) [34] and the long short-term memory (LSTM) network [35]. The LSTM is shown to be effective in regressing or classifying highly dependent time series data such as electrocardiography (ECG) signals [36]; however, it has not been used to authenticate users using the PPG signals extracted from smartphones yet. Since LSTM has never been implemented on smartphone PPG signals for UA processes and considering the limitations of traditional clinical settings such as ECG, we are providing a new method to authenticate people smartly and non-invasively. In this paper, we propose a smartphone PPG-based UA method that analyzes a subject’s PPG signal obtained from a smartphone camera and authenticates the subject based on the PPG analysis results. Figure 1 provides a simple way to visualize our solution from the user’s perception. Our proposed LSTM-based method trains the LSTM by using the raw PPG signal of each user without losing the specific characteristics of each user. Then, we apply the trained LSTM model on test data and evaluate its performance in terms of accuracy, F1-score, precision, and recall. The rest of this paper is organized as follows: Section 2 describes the LSTM networks; Section 3 explains our proposed method; experimental results are explained in Section 4; and finally, Section 5 concludes this paper.

2. Materials

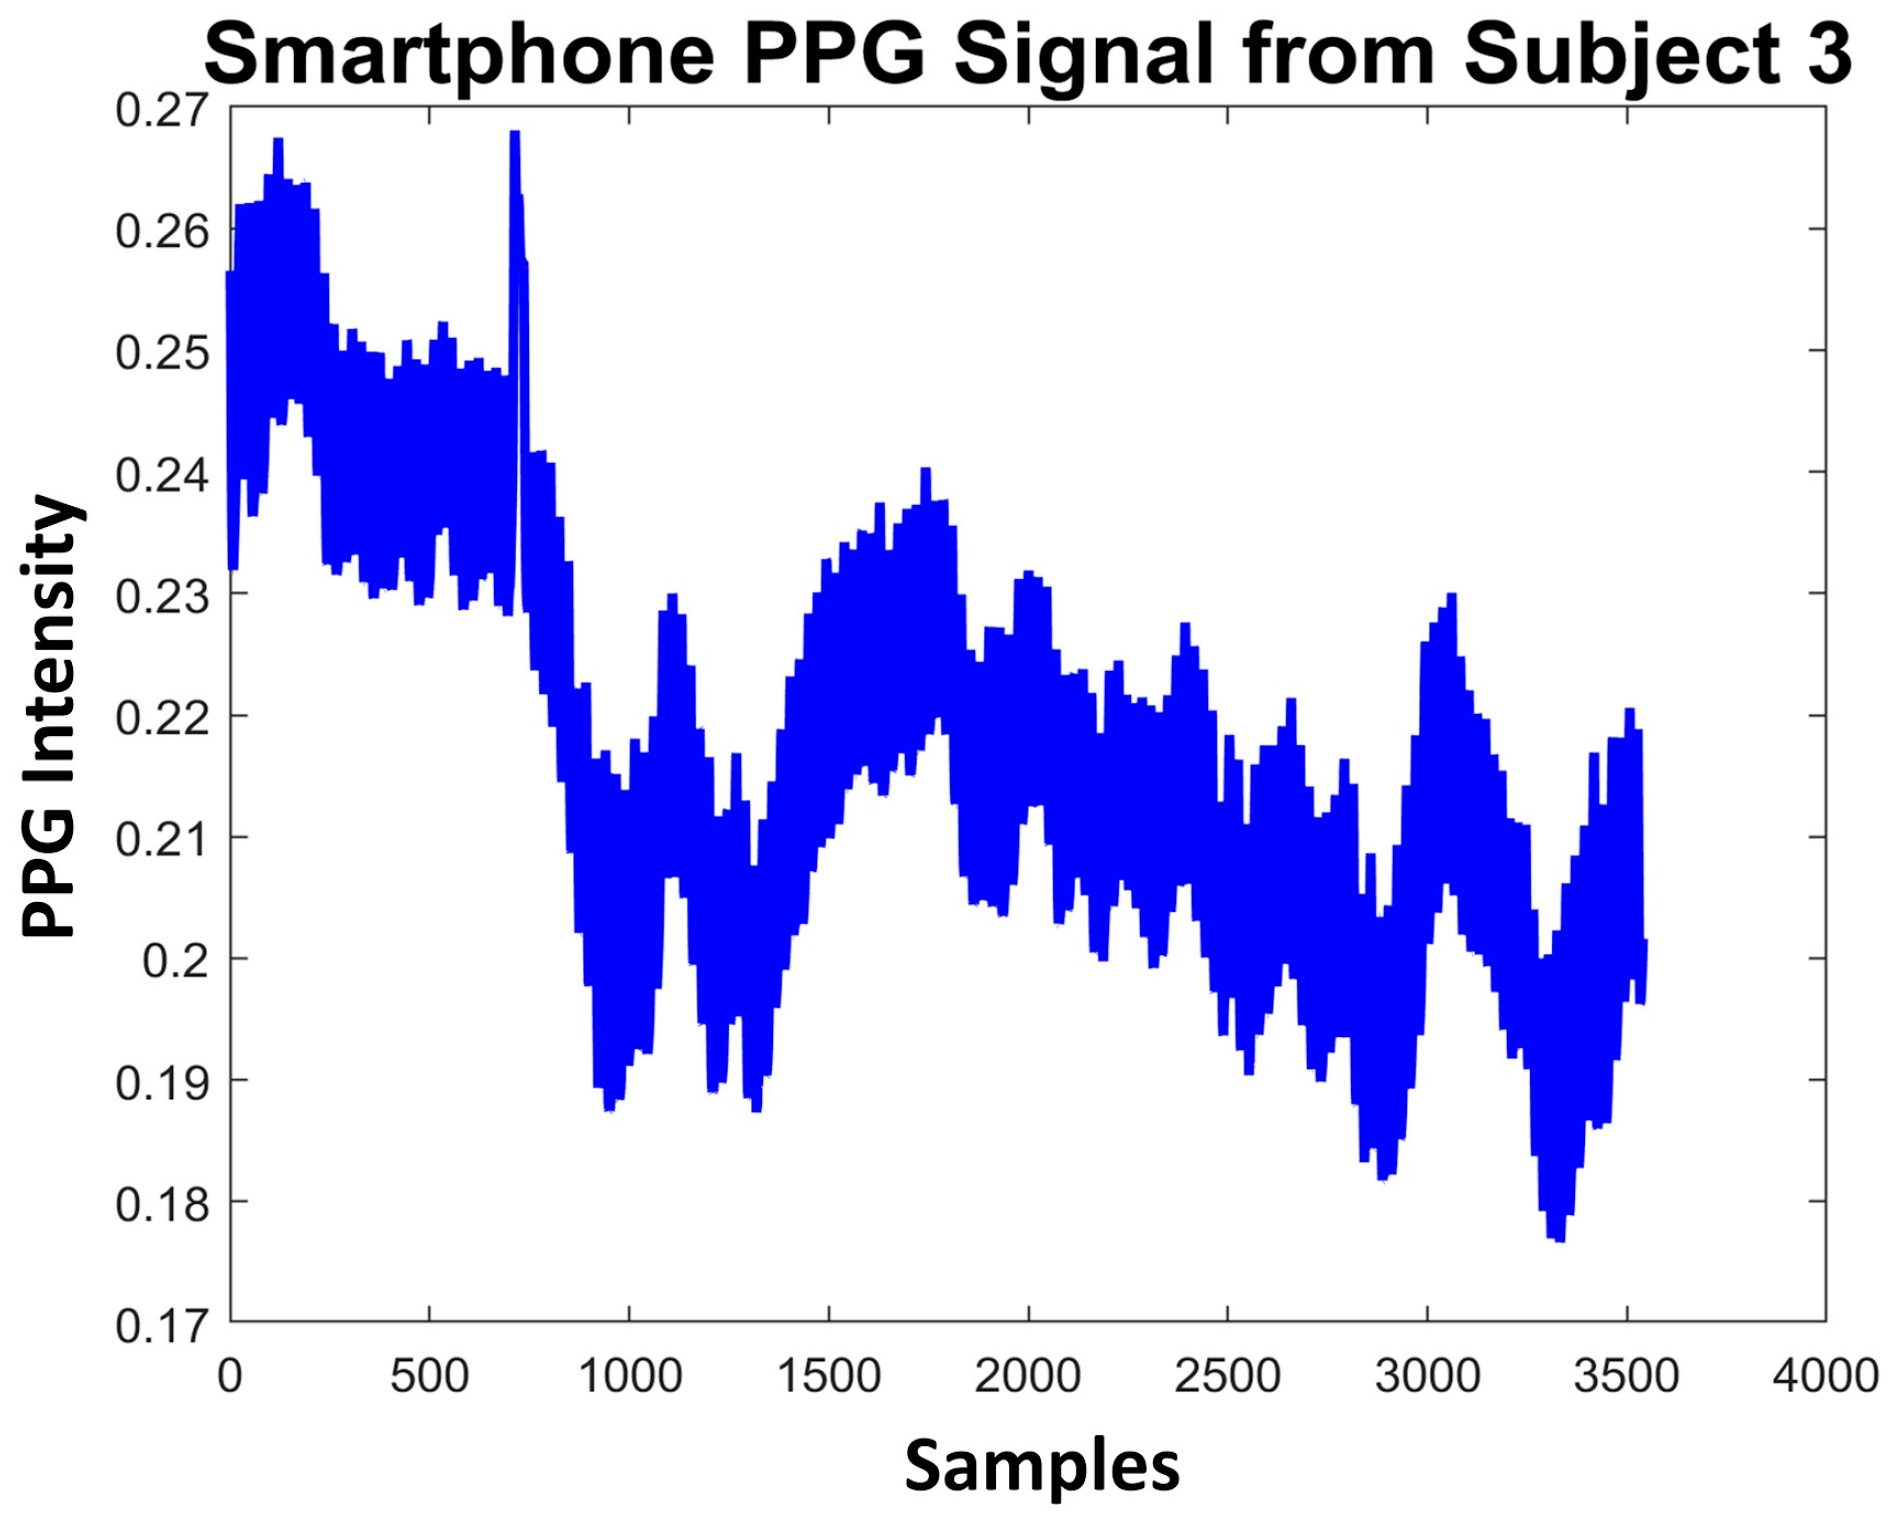
2.1. Smartphone PPG Signal Dataset
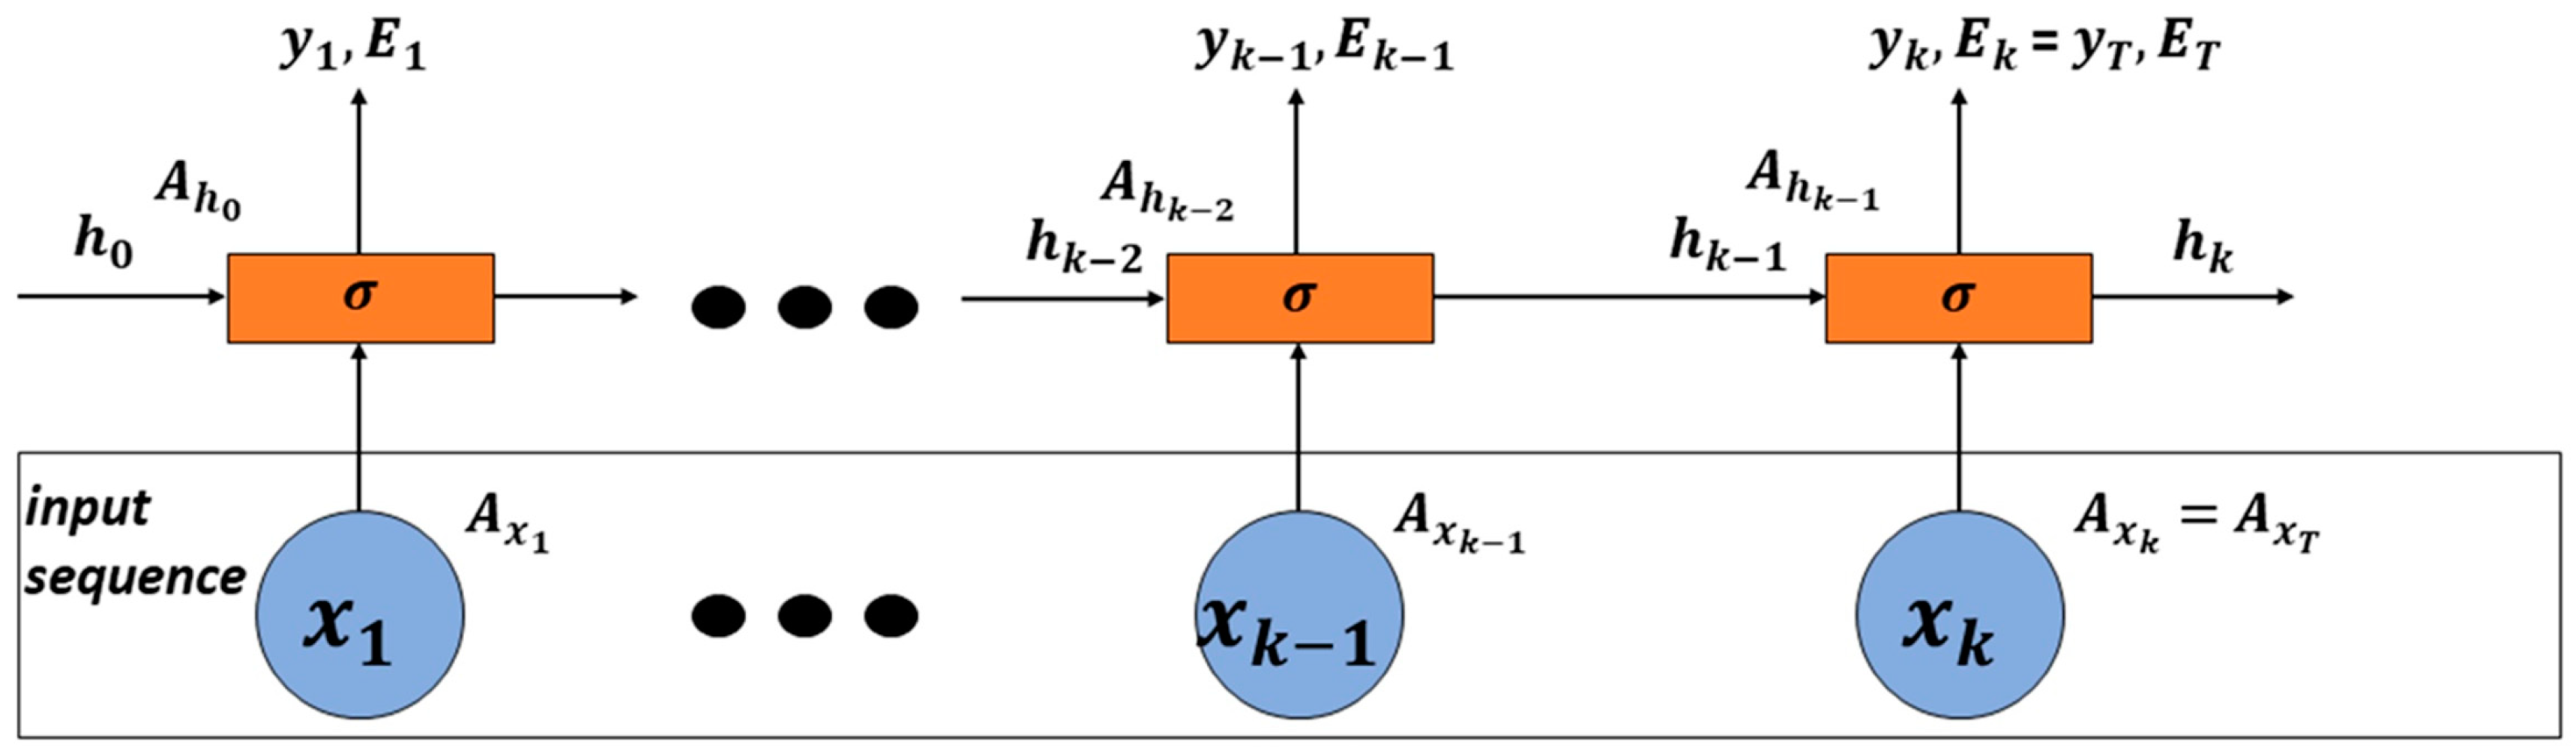
We followed the Texas Tech University’s Institutional Review Board (IRB) (IRB2019-912) for our experiment. As a result, we recruited 30 subjects from the Texas Tech University community and their ages are over 18 years. Our experiment consists of the learning phase and the authentication phase as shown in Figure 1 and each phase is described as follows:
Learning phase: Experimenters asked a recruited participant to sit on a chair and hold the smartphone used for our user authentication in the subject’s left hand. Here, we used the iPhone X [37] which has a sampling rate of 30 frames per seconds (fps). For 120 s, the experimenter allows the iPhone camera to acquire the biometric signal from the subject’s fingertip which is placed on the iPhone’s camera lens. During this learning procedure, the subject is asked not to move to prevent motion and noise artifacts. The acquired biometric signal is photoplethysmogram (PPG) datum [10] from which our developed biometric authentication algorithm learns individual-specific features as described in Section 4.2. After repeating this acquisition procedure for 30 subjects, our proposed UA method completes its learning which is required for authentication of each subject, and its learning procedure is explained in Section 3.
Authentication phase: The proposed UA method authenticates input PPG signals based on the features learned in the learning phase above. Here, the proposed method authenticates unknown input PPG signals by predicting the subject identification. Specifically, the input PPG signal is processed and analyzed by our proposed UA method, which is learned via the learning phase, and then the subject’s identity is predicted by the classification algorithm inside our proposed UA algorithm. If the predicted subject’s identity coincides with the actual identity, then it is counted toward accurate authentication. Otherwise, it is counted toward erroneous authentication.
Figure 1 provides a visualization of our proposed UA system and its experimental components. Regarding the number of participants for the user authentication study, Xiao et al. [31] and Ahmet et al. [32] recruited 19 and 22 subjects, respectively, for user authentication. For fair comparison with these studies, we have recruited 30 subjects. An example of smartphone signals from a subject is shown in Figure 2. We applied the LSTM to this raw signal without using any filters. We tested our proposed method after the completion of every training iteration.

2.2. RNN

LSTM has been implemented previously for PPG’s UA biometric-based context by using a smart wristband as monitoring source [38]. LSTM is a sub-classification of RNN, a neural network connecting nodes from a directed or undirected graph along temporal-sequential data. This RNN is characterized by memorizing the instance of previous information, which is then applied to the current input data [39]. Figure 3 shows an example of the RNN. The RNN has the advantage of handling sequential data [40]. The RNN deals with current input x k , output y k previous hidden state h k 1 , and current hidden state h k at time step k. An input sequence of vectors [ x 1 ,   x 2 ,   , x k ] is needed. The network encodes previous state information and learns knowledge in hidden state vectors [ h 1 ,   h 2 ,   , h k ].
The input and the previous hidden state are concatenated to comprise the complete input vector at time k. A h and A x are the weight matrices from hidden layers and input layers, respectively. c o and c h are the bias terms for the output state and hidden state at the kth time step, respectively. The sigmoid function is the activation function in the hidden layers. The network outputs a single vector y T at the last time step. After the RNN makes its prediction, we compute the prediction error E T , where T represents the final time step value, and use backpropagation through the algorithm at the kth time step to compute the gradient [41]. The equation for backpropagation is:
E T A h = k = 1 T E T y T . y T h T . h T h k . h k A h    
Using the multivariate chain rule, we obtain the following [42]:
E T A h = E T y T y T h T   k = 0 T h T h k . h k A h
E T A h = E T y T y T h T k = 0 T k + 1 T h k h k 1 h k A h
where h k can be written as:
h k = σ A h k 1 . h k 1 + A X T . x T
In general, training an RNN with relatively long sequential data is observed not to result in high-accuracy performance since the gradients which are calculated during the backpropagation process of the RNN may explode or vanish [42,43]. The product of derivatives can also explode. If | A h | > 1, then | A T k | would quickly blow up; this is known as the exploding gradient problem [43], which results in (∂ E T /∂ A h ) > 1. That is, RNN models can be exploded if hidden vector weights A h are large enough to overpower the activation function (σ) [43]. Since the computed error gradients E T are large values, they get larger and eventually blow up and crash the RNN model in (1). On the other hand, when | A h | < 1, then | A T k | becomes vanished [42], which leads to (∂ E T /∂ A h )→0.

3. Methods

3.1. LSTM Memory Cell

Figure 4 shows the LSTM layer internal functionality at the kth time step. Memory cells store or forget information. To implement this long-term dependency, the LSTM substitutes a conventional RNN node with a memory cell consisting of multiple gates in the hidden layer [36]. Based on the role of each gate, the multiple gates at the time step k can be named as follows:
  • Input gate ( i k ) controls the input activation of new information to the memory cell.
  • Output gate ( o k ) controls the output flow.
  • Forget gate ( f k ) controls when to forget the internal state information.
  • Input modulation gate ( g k ) controls the main input to the memory cell.
  • Internal state ( s k ) controls the internal recurrence of the memory cell.
  • Hidden state ( h k ) controls the information from the previous data sample within the context window:
  i k = σ A i x k + B i h k 1 + c i
  o k = σ A o x k + B o h k 1 + c o
f k = σ A f x k + B f x k 1 + c f
g k = σ A g x k + B g h k 1 + c f
s k = f k s k 1 + g k i k
h k = t a n h   s k   o k ,
Here, A and B represent the weight matrices for input vectors and hidden vectors, and c are the bias vectors.

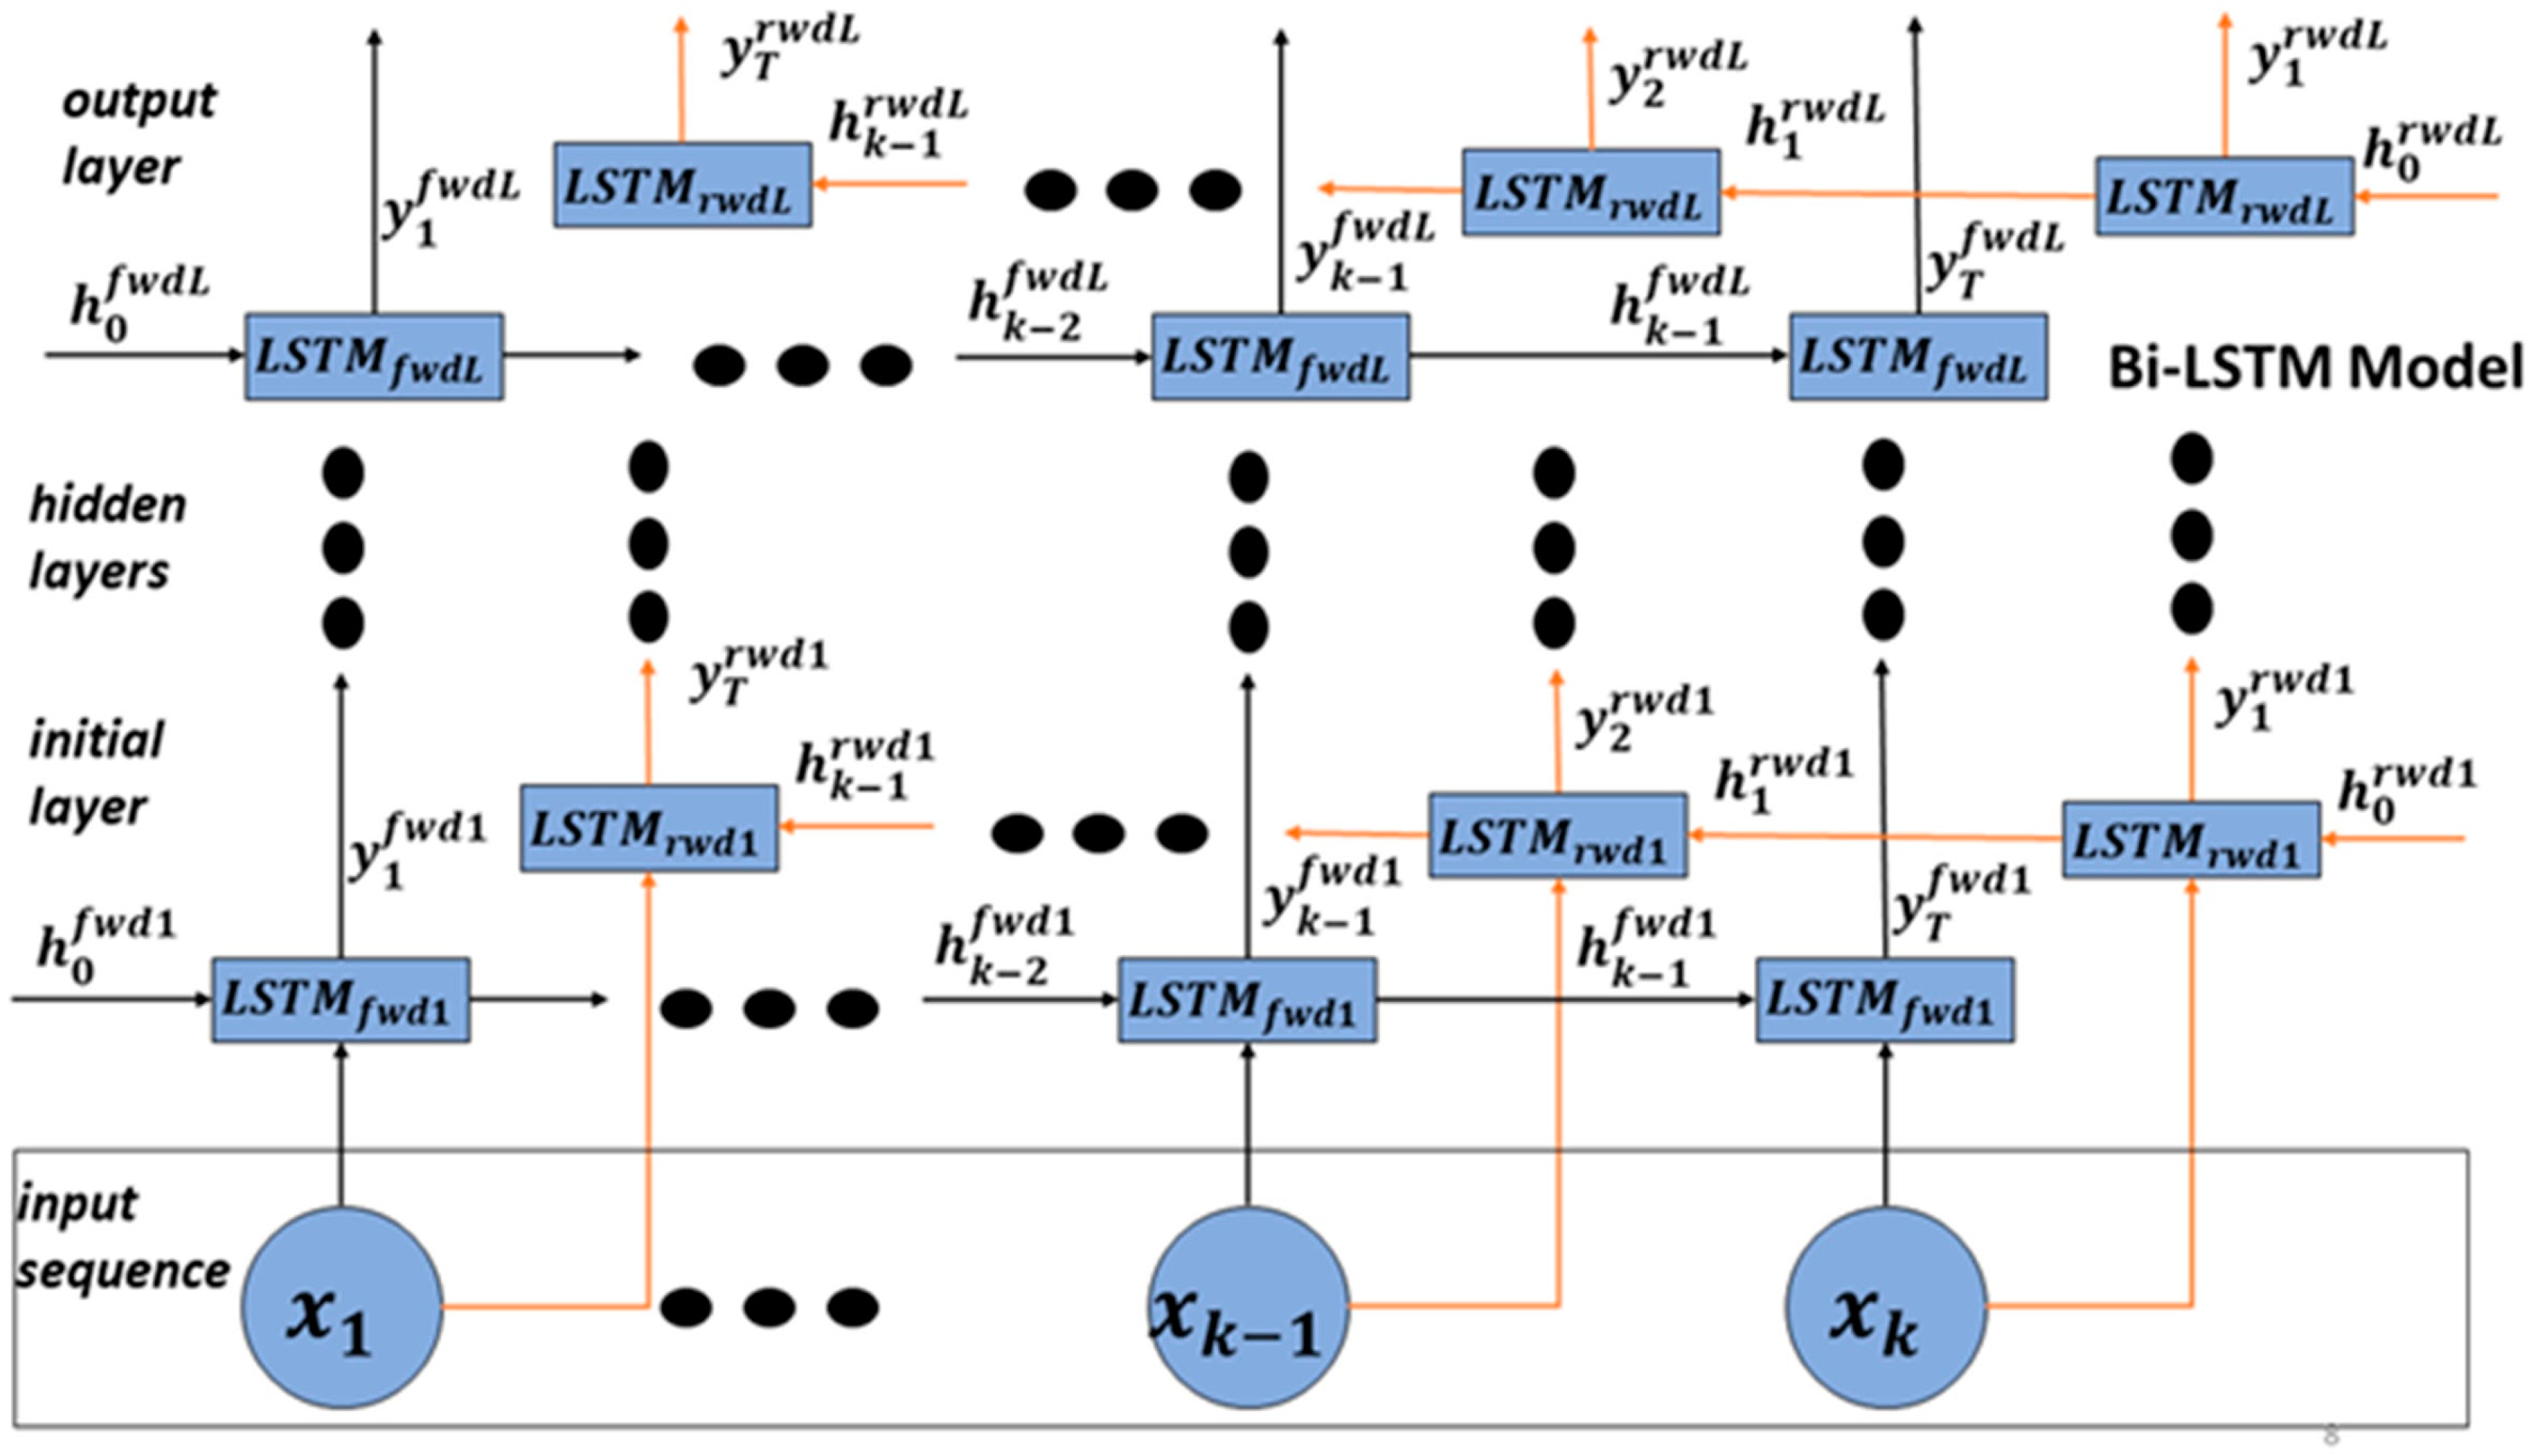
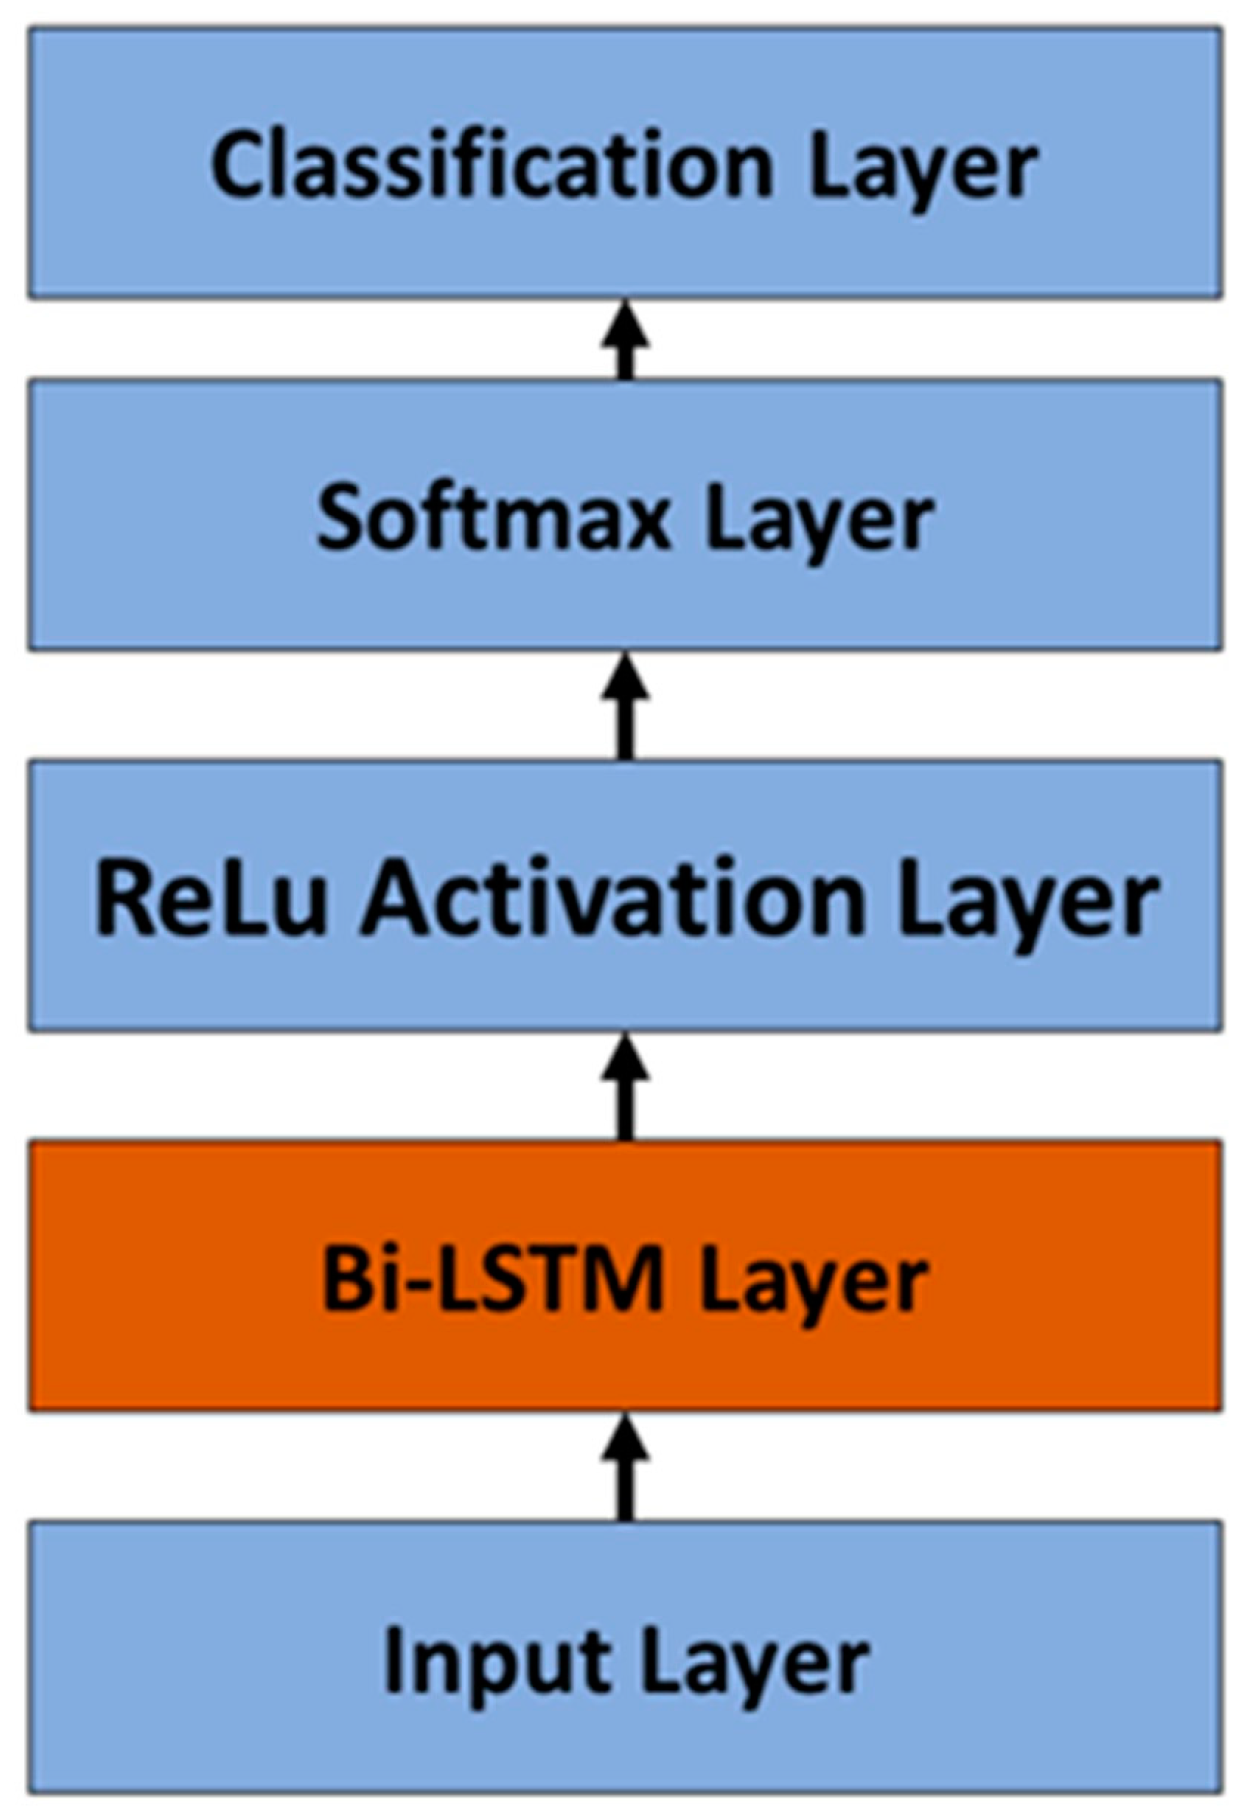
3.2. LSTM vs. Bi-LSTM

The main idea of LSTM is to make efficient memory cells last for a long time period as shown in Figure 5. We also used a bi-directional LSTM-based (Bi-LSTM) layer for further performance enhancement. Figure 6 shows a visualization of a Bi-LSTM model within forward and backward loops for exploiting the context from the past and the future of a specific time step to predict its respective class. A single or multiple hidden units are assigned in this Bi-LSTM layer. Then, data go into the ReLu activation function layer. The main task of that layer consists of creating the number of labels into which the input dataset will be classified.
It directly maps from personal smartphone PPG input to a classification layer. The input is divided into a discrete sequence of equally balanced samples [ x 1 ,   x 2 ,   , x k ], where each data point x k is a vector of each subject’s PPG. In our proposed algorithm, one-versus-all was implemented as a classification technique, distributing data in two classes. The classes were unequally distributed: the positive class belongs to the target subject, and the negative class represents the remaining population. In our authentication problem, the negative class has more data than the positive one. The ReLu activation layer eliminates all non-positive values for the prediction scores from two different labels. To convert the prediction scores into probabilities, we applied a SoftMax layer on Y, as in (11), of the prediction score. Finally, the system proceeds with the classification layer, where the final prediction is given based on those probabilities. Figure 7 provides a demonstration of our implemented architecture using Bi-LSTM. We also implemented a baseline model, the forward-operation LSTM model, to compare our proposed Bi-LSTM.
Y = 1 T k = 1 T y k L
We used a baseline model just to compare the performance of our proposed UA algorithm with another standard reference. The baseline model consists of the same layer of Figure 7, except for the Bi-LSTM layer which is replaced with the forward-based operation LSTM layer. Usually, Bi-LSTM uses the two tracks’ readings from PPG inputs heading from left to right (fwd) direction and from right to left (rwd) as follows:
y k f w d ,   h k f w d , s k f w d = L S T M f w d s k 1 f w d ,   h k 1 f w d , x k ; B f w d ,    
y k r w d ,   h k r w d , s k r w d = L S T M r w d s k 1 r w d ,   h k 1 r w d , x k ; B r w d .  
When the Bi-LSTM layer is applied, the output equation is given as follows:
Y = 1 T k = 1 k = T y k r w d L + y k f w d L  
Figure 8 provides an overall demonstration of our PPG-based UA classification system.

3.3. Optimization of Hyperparameters of LSTM

We adopted adaptive moments (ADAM) [44] as an optimizer for our proposed LSTM since the ADAM is known to reduce time consumption in the classification process. In ADAM, momentum is incorporated directly as an estimate of the gradient’s first-order moment with exponential weights. It also includes bias corrections to the estimates of both the first-order moments, the momentum term, and the uncentered second-order moments to account for their initialization at the origin. Normally, eight parameters are required to implement an ADAM optimizer [44]: step size µ; exponential decay rates for moment estimates, є1 and є2 in [0,1); small constant ψ used for numerical stabilization; initial parameters w; first and second moment initialized with their respective moment variable d = 0 and r = 0; and time step k is required to be equal to zero. Initially, the batch size is a sample of m examples from the training set [ x 1 ,   x 2 ,   , x m ] with corresponding targets y i . The gradient q is computed:
q   1 m ω i L f x i ; ω , y i .
The time step is updated:
  k k + 1 .  
Update biased first moment estimate:
d ϵ 1 d + 1 ϵ 1 q .  
Update biased second moment estimate:
r ϵ 2 r + 1 ϵ 2 q . q .  
Correct bias in the first moment:
d ^ d 1 ϵ 1 k .  
Correct bias in the second moment:
r ^ r 1 ϵ 2 k .  
Compute the update:
Δ ω = μ d ^ r ^ + ψ .
Then, the update is applied:
ω ω + Δ ω .
The hyperparameters we optimized are as follows:
  • Learning rate: The learning rate parameter has a strong influence on how quickly or slowly the model can converge to a local maximum. If it is too large, it can cause a quick convergence to a suboptimal solution. On the other hand, if it is too small, it may reach the solution slowly. ADAM optimizer is an adaptive learning rate operator [44]. The optimizer tends to be influenced by the learning rate hyperparameter, which means that it is an important input for the optimization.
  • Batch sizes: An input dataset is initially divided into many batches, depending on the batch size, and fed into a neural network. A batch size creates a subset of the training set that is used to evaluate the gradient of the loss function and update the weights.
  • Number of epochs: The number of epochs represents the total number of iterations by which the data run through the selected optimizer.

4. Results and Discussion

We conducted the experiments on google colab on Windows machines with a single Tesla k80 GPU, 12.6 GB RAM, and 1 core of Intel Xeon CPU @2.3 GHz. We used Python 3.6 and Keras by using the TensorFlow 2.0 backend. We experimented with PPG raw and feature based data sets using both LSTM and Bi-LSTM architectures.

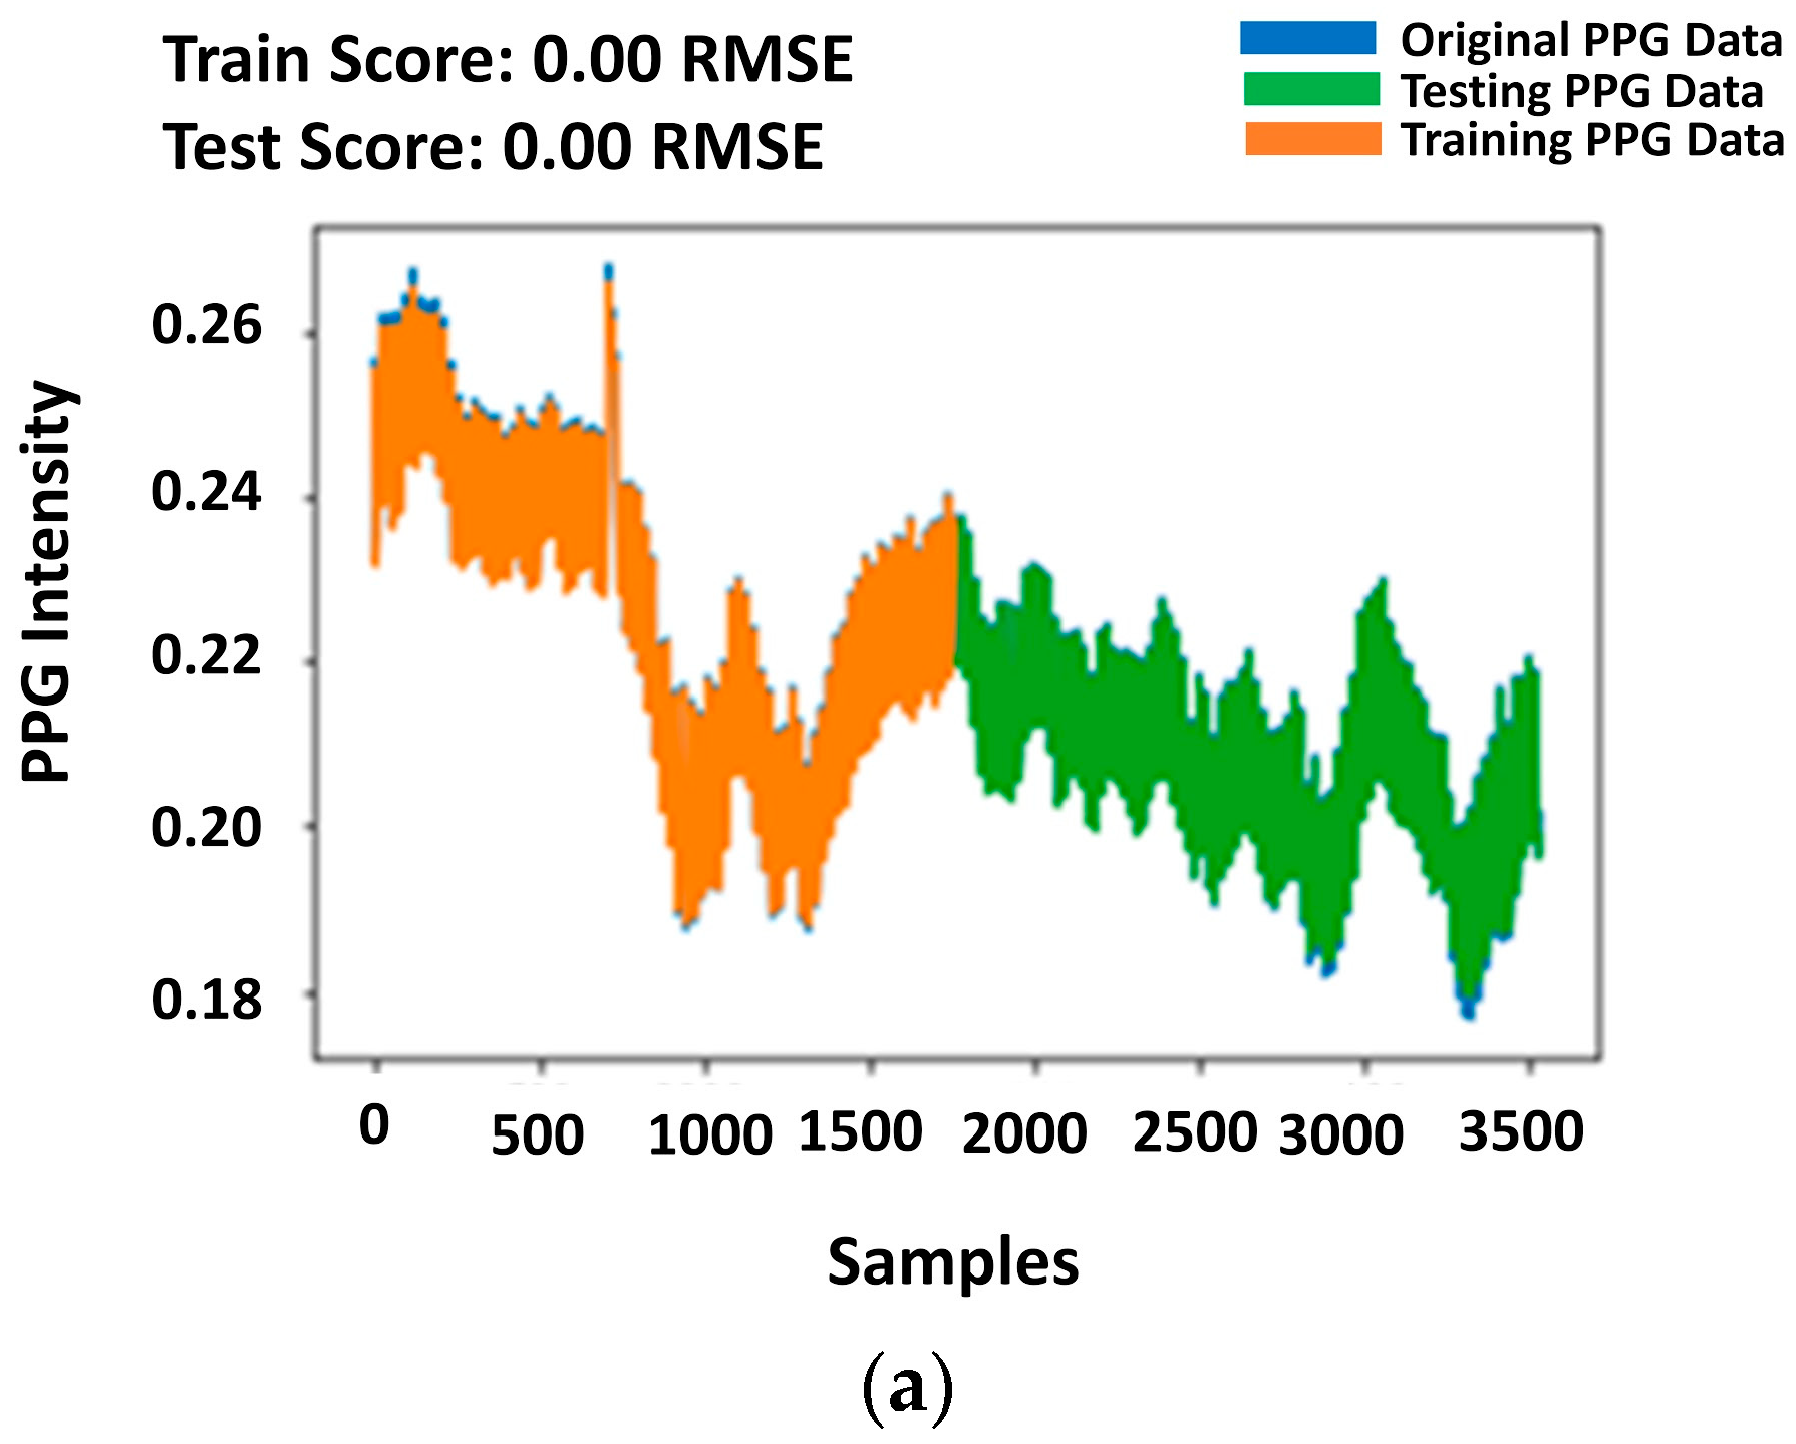
4.1. LSTM Regression Performance

Unlike final predictions of regression models, time series data also have the complexity of high-sequential dependence among the input parameters. Hence, we first evaluate the regression performance of LSTM to assure the performance of LSTM before we use LSTM classification for the UA purpose. A time series prediction was implemented on regression terms by splitting the training and test dataset into 50 vs. 50 or 80 vs. 20 as shown in Figure 9. The scores for the training and testing stages reflected are 0.00 and 0.00, for training and testing, respectively. We varied the splitting ratio in the range of 50/50, 60/40, 70/30, and 80/20 as in [10,36], and 80/20 gives the minimum loss (or lowest score) performance in our experiment.

4.2. LSTM Classification Performance

Table 1 shows how hyperparameters were defined for the training stage with their respective number of subjects considered by using Bi-LSTM on classification mode. Every hyperparameter was defined after finding its optimal value.
We evaluated the performance of our proposed LSTM-based UA algorithm with iPhone X data. The accuracy, recall, precision, and F1-score are considered as performance metrics. We have implemented the LSTM-based UA algorithm using Python [45,46]. Table 2 shows the performance metrics in the four selected subjects-scales using hyperparameters defined in Table 1. We applied a training/testing splitting ratio to the raw data of 80/20 as in [10]. The implemented technique to evaluate the performance of our proposed solution was the one-versus-all technique. One-versus-all implies that the classification process needs to be evaluated individually subject-by-subject. Average training accuracies for each of the tested subjects’ scales are 90.5% for 5 subjects, 90.7% for 10 subjects, 95.1% for 20 subjects, and 96.7% for 30 subjects. Average performance metric values for Bi-LSTM in the classification context are described in Table 2.
We were able to implement the LSTM algorithm by following the functionality diagram exposed in Figure 8, using two different datasets as inputs, which are raw data and features in our UA model. The one-versus-all technique was also the selected classification technique.
Hyperparameters are the determining factor in LSTM model prediction. We performed multiple tests on our PPG hyperparameter settings to examine the influence of each hyperparameter in the classification process. We have chosen three hyperparameters, which are the number of epochs, learning rate, and mini-batch sizes to decide which values were adequate to obtain the performance metrics for the 80/20 training/testing splitting ratio. The three determination factors were: testing accuracy, time consumption, and testing losses. Following the main implementation (as shown in Table 1), we decided to use 250 hidden units as a default value. The default values for the number of epochs, learning rates, and batch sizes were 50, 0.001, and 150. Subject 30 was the default subject for this hyperparameters influence analysis. Figure 10a–c shows the time consumption factor across multiple values of the mentioned hyperparameters.
In the case of the other two determination factors which are testing accuracy and testing loss, we tabulated them to make the final decision on their optimal values Table 3, Table 4 and Table 5 provide testing accuracies and testing losses for three mentioned hyperparameters. Losses represent the problems of identifying in which category a specific observation belongs to a subject. It could be considered the synonym for “inaccuracy”. For UA applications, the lower the testing loss is, the higher the opportunity to provide access to the right user. The type of loss function implemented was categorical cross-entropy loss. Our testing losses are mostly in a fine range [47].
By considering outputs provided in Table 3, Table 4 and Table 5, we made a final decision to obtain average performance metrics of our UA Bi-LSTM model architecture by assigning values to three of the analyzed hyperparameters. The optimal values for the number of epochs, batch sizes, and learning rates were 500, 150, and 0.001 for 30 subjects. Table 6 provides average performance metrics for the testing part in the deep learning approach by using raw signals as Bi-LSTM input. Traditional metrics for UA applications are accuracy, recall, precision, and f1-score. As performance metrics, false rejection rate (FRR), false acceptance rate (FAR), and equal error rate (EER) are calculated. The FAR is the rate which accepts an intruder while the FRR is the rate which rejects a target user. The EER is the rate where FAR and FRR are equal for varying threshold values [10,38]. The FRR, FAR, and EER values are shown in Table 6. As mentioned before, the average training accuracy was 96.7%.
After considering the two basic approaches exposed in Figure 8 where the deep learning approach was implemented in features and raw signals, we were able to obtain results that validated our UA solution as an appropriate methodology. In the case of the feature-based learning approach, we were able to extract 16 different features from the time and the frequency domain.
The features are: (1) the peak-to-peak amplitude difference interval (PPD), (2) the peak-to-trough time interval (PTI), (3) slope ratio (SR), (4) trough values (TV), (5) the peak-to-peak time interval domain (PPI), (6) the frequency of the heart rate (FHR), (7) the root mean square of successive difference (RMSSD), (8) standard deviation (STD), (9) the percentage of the number PPI values varying more than 50 ms (pNN50), (10) the maximum value of amplitude spectrum (max_xas) (using FFT), (11) the minimum value of amplitude spectrum (min_xas) (using FFT), (12) the minimum/maximum amplitude spectrum ratio(min/max_xas) (using FFT), (13) the heart rate frequency difference (dfHR), (14) the maximum value of power spectral density (max_psd) (using the Lomb-Scargle periodogram), (15) the minimum value of power spectral density (min_psd) (using the Lomb-Scargle periodogram), and (16) the minimum/maximum power spectral density ratio (min_/max_psd) (using the Lomb-Scargle periodogram) [10]. In this approach, signals were pre-processed by eliminating direct current (DC) components where the mean value of each segment was extracted with a one-second size on PPG raw signals. After preprocessing, features were calculated and then used as LSTM inputs.
In the case of the deep learning approach, the main input of the algorithm was the raw signals. Deep learning approaches always provide the opportunity to pre-process the data within the creation of the layer in the design of the model. Table 7 shows a comparison of accuracy metrics when LSTM and Bi-LSTM models are applied to feature-based dataset approach. Deep learning approach outcomes are summarized in Table 8. In both cases, Bi-LSTM implementation provided higher accuracy. Features from PPG data were used as the input of the algorithm in Table 7. Raw signals are the input sequence in Table 8.
In summary, our proposed Bi-LSTM based model proved to be efficient after multiple testing settings. After the data collection procedure, we were able to analyze the dataset specifications and tested it to find its optimum points. The data splitting procedure was performed by using one-versus-all since our goal consists of classifying a subject’s identity against the remaining population to make classification more successful. First, we considered the number of subjects and we divided it into four different scales to find whether the proposed solution provided the highest efficiency performance metric for UA recognition procedures. Based on results from Table 1 (where hyperparameters were defined on their optimum points) and Table 2 (where outputs are given based on Table 1 definitions) we found that a 30-subjects scale provided the best classification on the subject’s identity. From Table 2 to Table 5, a demonstration of hyperparameters optimization on the 30-subjects scale is given by considering its testing accuracies and the losses on the testing procedure. Equations (15)–(22) demonstrates how the ADAM optimizer operates. Another important factor is the algorithm’s time consumption, which can be visualized in Figure 10a to Figure 10c. Table 6 provides the overall performance metrics for the UA processes. All results for classification are given by using raw signals as input, except for Table 7 and Table 8. In Table 7 and Table 8, we added a new dataset from physiological-based features, as in [10], from the same subjects and we compared accuracies for training and testing parts in both datasets adding a baseline model as reference.
There have been conventional user authentication methods which are proposed based on (1) passwords, (2) RFID/smart cards, or (3) biometrics. Among these, the iPhone and Android phones authenticate users using their biometrics as inputs, such as facial and fingerprint recognition. However, face-recognition-based user authentication (UA) technologies require ambient light and demand users to constantly configure the device’s settings since physical appearance is not stable in the time domain since readings are based on visible data. When an unauthorized person uses a picture of an authorized person, the unauthorized person can immediately access the phone. On the other hand, an authorized user could not have access due to environmental and external artifacts, e.g., wearing glasses and illumination may affect the recognition process. Moreover, face masks people wear due to COVID-19 are proven effective in preventing the spread of COVID-19 but bother facial recognition. Facial-recognition-based UA will not be effective in people who may have similar facial parameters. Biometrics such as PPG signals are individual markers that could be useful for UA since they do not require external hardware and can provide touchless monitoring, which can effectively reduce the spread of COVID-19. In the case of fingerprints, additional hardware is required to complete the UA process, making it expensive for manufacturers. We have compared our authentication, and other existing methods, including the methods described above, in terms of their advantages and challenges in Table 9.

5. Conclusions

The performance results from our implementation confirm that smartphone PPG signals could satisfy the LSTM and Bi-LSTM criteria partially for low-dependent time-series data when applied to a feature-based learning approach and fully for high-dependent time-series data when applied to a raw-data-based deep learning approach. We have created two tested databases for features and raw signals. We proposed a novel Bi-LSTM-based architecture for smartphone PPG biometrics classification and demonstrated its performance through multiple experiments on raw- and feature-based data. The Bi-LSTM performance on both datasets was 96.7% and 95.0% while LSTM baseline model performance was 96.3% and 59.1%, respectively. The proposed Bi-LSTM-based UA model shows a performance gain in both raw- and feature-based approaches. The results confirm that the proposed approaches were efficient in authenticating subjects. Furthermore, we evaluated the effect of different hyperparameters on our proposed UA technique and obtained satisfactory values of performance metrics. Regression loss scores are calculated for varying the training/testing splitting ratios. As a result, 80/20 is observed to give the minimum loss (or lowest scores). As a result, we used this 80/20 splitting ratio for classification for user authentication. The influence of hyperparameters on predicting the identity of the subjects is a determining factor. Furthermore, we explored Python with our UA system to see the importance of each hyperparameter definition. After completing hyperparameters experiments, we determined the appropriate values, which led to higher performance metric values. The final average testing accuracies for both approaches—feature-based learning and raw-dataset-based deep learning, using our proposed UA-based Bi-LSTM architecture, were 95.0% and 96.7%. Furthermore, our PPG-based UA design has a lower design complexity. Typically, UA-based systems are evaluated by the FAR, FRR, and EER values and overall values for those metrics were 0.03, 0.00, and 0.03, respectively. In future work, we will gather more data from different subjects in different authentication scenarios. For fair comparison with other studies mentioned in Section 2.1, we have recruited 30 subjects. Regarding the impact of splitting ratio on performance metrics such as training scores (or loss), we varied the splitting ratio through 50/50, 60/40, 70/30, and 80/20 and found that the splitting ratio of 80/20 gives the smallest training score (or minimum loss).

Author Contributions

B.L.O. collected the data set from subjects, designed the analysis, wrote the original/revised manuscript, and conducted data analysis and details of the work. V.G. contribute to the data analysis, research design, algorithm implementation, and revised original/final version of the draft. J.W.C. wrote original/revised manuscripts, guided direction of the work, contribute to the development of the software app, and help on the data analysis. K.J. revised original/final version of the draft, contribute on the conceptualization, and data analysis. T.D. contribute on the conceptualization, and revise/edit original and final manuscript version. All authors have read and agreed to the published version of the manuscript.

Funding

This research received no external funding.

Institutional Review Board Statement

The study was conducted in accordance with the Texas Tech University’s Human Research Protection Program and approved by the Institutional Review Board of Texas Tech University (IRB2019-912, approved on 24 February 2021).

Informed Consent Statement

Informed consent was obtained from all subjects involved in the study.

Conflicts of Interest

The authors declare no conflict of interest.

References

  1. Tabei, F.; Kumar, R.; Phan, T.N.; McManus, D.D.; Chong, J. A Novel Personalized Motion and Noise Artifact (MNA) Detection Method for Smartphone Photoplethysmograph (PPG) Signals. IEEE Access 2018, 6, 60498–60512. [Google Scholar] [CrossRef]
  2. Abay, T.Y.; Kyriacou, P.A. Photoplethysmography for blood volumes and oxygenation changes during intermittent vascular occlusions. J. Clin. Monit. Comput. 2018, 8, 447–455. [Google Scholar] [CrossRef] [PubMed]
  3. Tabei, F.; Gresham, J.M.; Askarian, B.; Jung, K.; Chong, J. Cuff-Less Blood Pressure Monitoring System Using Smartphones. IEEE Access 2020, 8, 11534–11545. [Google Scholar] [CrossRef]
  4. Shoushan, M.M.; Reyes, B.A.; Rodriguez, A.R.M.; Chong, J. Contactless Monitoring of Heart Rate Variability during Respiratory Maneuvers. IEEE Sens. J. 2022, 22, 14563–14573. [Google Scholar] [CrossRef]
  5. Ayesha, A.H.; Qiao, D.; Zulkernine, F. Heart Rate Monitoring Using PPG with Smartphone Camera. In Proceedings of the 2021 IEEE International Conference on Bioinformatics and Biomedicine, Houston, TX, USA, 9–12 December 2021; pp. 2985–2991. [Google Scholar]
  6. Lamonaca, F.; Carni, D.L.; Grimaldi, D.; Nastro, A.; Riccio, M.; Spagnolo, V. Blood oxygen saturation measurement by smartphone camera. In Proceedings of the 2015 IEEE International Symposium on Meical Measurements and Applications, Turin, Italy, 7–9 May 2015; pp. 359–364. [Google Scholar]
  7. Plaza, J.L.; Nam, Y.; Chon, K.; Lasaosa, P.L.; Herrando, E.G. Respiratory rate derived from smartphone-camera-acquired pulse photoplethysmographic signals. Physiol. Meas. 2015, 36, 2317–2333. [Google Scholar]
  8. Buriro, A. Behavioral Biometrics for Smartphone User Authentication. Ph.D. Thesis, University of Trento, Trento, Italy, 2017. [Google Scholar]
  9. Abuhamad, M.; Abusnaina, A.; Nyang, D.; Mohaisen, D. Sensor-Based Continuous Authentication of Smartphones’ Users Using Behavioral Biometrics: A Contemporary Survey. IEEE Internet Things J. 2021, 8, 65–84. [Google Scholar] [CrossRef]
  10. Ortiz, B.L.; Chong, J.; Gupta, V.; Shoushan, M.; Jung, K.; Dallas, T. A Biometric Authentication Technique Using Smartphone Fingertip Photoplethysmography Signals. IEEE Sens. J. 2022, 22, 14237–14249. [Google Scholar] [CrossRef]
  11. Wang, S.; Adams, C.; Broadbent, A. Password authentication schemes on a quantum computer. In Proceedings of the 2021 IEEE International Conference on Quantum Computing and Engineering (QCE), Broomfield, CO, USA, 17–22 October 2021; pp. 346–350. [Google Scholar]
  12. Manasseh, T. An Enhanced Password-Username Authentication System Using Cryptographic Hashing and Recognition Based Graphical Password. IOSR J. Comput. Eng. 2016, 18, 54–58. [Google Scholar]
  13. Vikas, B.O. Authentication Scheme for Passwords using Color and Text. IJSRSET 2015, 1, 316–323. [Google Scholar]
  14. Ju, S.; Seo, H.; Han, S.; Ryou, J.; Kwak, J. A Study on User Authentication Methodology Using Numeric Password and Fingerprint Biometric Information. BioMed Res. Int. 2013, 1–7. [Google Scholar] [CrossRef] [Green Version]
  15. Raza, M.; Iqbal, M.; Sharif, M.; Haider, W. A Survey of Password Attacks and Comparative Analysis on Methods for Secure Authentication. World Appl. Sci. J. 2012, 19, 439–444. [Google Scholar]
  16. Sreelekshmi, S.; Shabanam, T.S.; Nair, P.P.; George, N.; Saji, S. RFID based Smart Card for Campus Automation. Int. J. Eng. Res. Technol. 2021, 9, 38–40. [Google Scholar]
  17. Singh, P.K.; Kumar, N.; Gupta, B.K. Smart Card ID: An Evolving and Viable Technology. Int. J. Adv. Comput. Sci. Appl. 2018, 9, 115–124. [Google Scholar]
  18. Henniger, O.; Franke, K. Biometric user authentication on smart cards by means of handwritten signatures. Lect. Notes Comput. Sci. 2004, 547–554. [Google Scholar] [CrossRef] [Green Version]
  19. Singh, A.K.; Solanki, A.; Nayyar, A.; Qureshi, B. Elliptic Curve Signcryption-Based Mutual Authentication Protocol for Smart Cards. Appl. Sci. 2019, 10, 8291. [Google Scholar] [CrossRef]
  20. Mainenti, D. User Perceptions of Apple’s Face ID. In Information Science, Human Computer Interaction (DIS805); 2017; Available online: https://www.researchgate.net/profile/David-Mainenti/publication/321795099_User_Perceptions_of_Apple’s_Face_ID/links/5a31f871458515afb6d97834/User-Perceptions-of-Apples-Face-ID.pdf (accessed on 25 November 2022).
  21. Cappallo, S.; Mensink, T.; Snoek, C.G. Latent factors of visual popularity prediction. In Proceedings of the 5th ACM on International Conference on Multimedia Retrieval, Shanghai, China, 23–26 June 2015; pp. 23–26. [Google Scholar]
  22. Alvappillai, A.; Barrina, P.N. Face Recognition Using Machine Learning; University California San Diego: La Jolla, CA, USA, 2017; pp. 1–6. [Google Scholar]
  23. Dospinescu, O.; Lîsîi, I. The recognition of fingerprints on mobile applications—An android case study. J. East. Eur. Res. Bus. Econ. 2016, 1–11. [Google Scholar] [CrossRef]
  24. Chowdhury, A.M.M.; Imtiaz, M.H. Contactless Fingerprint Recognition Using Deep Learning—A Systematic Review. J. Cybersecur. Priv. 2022, 2, 714–730. [Google Scholar] [CrossRef]
  25. Yang, W.; Wang, S.; Hu, J.; Zheng, G.; Valli, C. Security and Accuracy of Fingerprint-Based Biometrics: A Review. Symmetry 2019, 11, 141. [Google Scholar] [CrossRef] [Green Version]
  26. Tang, K.; Liu, A.; Li, P.; Chen, X. A Novel Fingerprint Sensing Technology Based on Electrostatic Imaging. Sensors 2018, 18, 3050. [Google Scholar] [CrossRef] [Green Version]
  27. Bhattacharyya, D.; Ranjan, R.; Alisherov, F.; Choi, M. Biometric authentication: A review. Int. J. u-e-Serv. Sci. Technol. 2009, 2, 13–28. [Google Scholar]
  28. Schroff, F.; Kalenichenko, D.; Philbin, J. FaceNet: A unified embedding for face recognition and clustering. In Proceedings of the 2015 IEEE Conference on Computer Vision and Pattern Recognition (CVPR), Boston, MA, USA, 7–12 June 2015; pp. 815–823. [Google Scholar]
  29. Smartphone User Statistics. Smartphone Statistics for 2022|Facinating Mobile Phone Stats. Available online: https://www.ukwebhostreview.com/smartphone-statistics (accessed on 9 October 2022).
  30. Apple Backs Finisar with $390 Million for Face ID Technology. Available online: https://www.mercurynews.com/2017/12/13/apple-backs-finisar-with-390-million-for-face-id-technology/ (accessed on 9 October 2022).
  31. Zhang, X.; Qin, Z.; Lyu, Y. Biometric authentication via finger photoplethysmogram. In Proceedings of the 2018 2nd International Conference on Computer Science and Artificial Intelligence, Shenzhen, China, 8–10 December 2018; pp. 263–267. [Google Scholar]
  32. Kavsaoğlu, A.R.; Polat, K.; Bozkurt, M.R. A novel feature ranking algorithm for biometric recognition with PPG signals. Comput. Biol. Med. 2014, 49, 1–14. [Google Scholar] [CrossRef] [PubMed]
  33. Lovisotto, G.; Turner, H.; Eberz, S.; Martinovic, I. Seeing red: PPG biometrics using smartphone cameras. In Proceedings of the IEEE/CVF Conference on Computer Vision and Pattern Recognition Workshops, Seattle, WA, USA, 16–18 June 2020; pp. 818–819. [Google Scholar]
  34. Cherrat, E.M.; Alaoui, R.; Bouzahir, H. Convolutional neural networks approach for multimodal biometric identification system using the fusion of fingerprint, finger-vein and face images. PeerJ Comput. Sci. 2020, 6, 248. [Google Scholar] [CrossRef] [PubMed] [Green Version]
  35. Gupta, V. Voice disorder detection using long short term memory (lstm) model. arXiv 2018, arXiv:1812.01779. [Google Scholar]
  36. Kim, B.H.; Pyun, J.Y. ECG identification for personal authentication using LSTM-based deep recurrent neural networks. Sensors 2020, 20, 3069. [Google Scholar] [CrossRef] [PubMed]
  37. iPhone, X. Available online: https://support.apple.com/kb/sp770?locale=en_US (accessed on 21 September 2021).
  38. Ekiz, D.; Can, Y.S.; Dardagan, Y.C.; Aydar, F.; Kose, R.D.; Ersoy, C. End-to-end deep multi-modal physiological authentication with smartbands. IEEE Sens. J. 2021, 21, 14977–14986. [Google Scholar] [CrossRef]
  39. Elsayed, I.E. Adaptive Signal Processing—Recurrent Neural Networks; Mansoura University: Mansoura, Egypt; Available online: https://www.academia.edu/50985677/Recurrent_Neural_Networks (accessed on 9 October 2022).
  40. Grosse, R. Lecture 15: Exploding and Vanishing Gradients; The University of Toronto Department of Computer Science, University of Toronto: Toronto, ON, Canada, 2017. [Google Scholar]
  41. Mattheakis, M.; Protopapas, P. Recurrent neural networks: Exploding vanishing gradients & reservoir computing. In Advanced Topics in Data Science; Harvard Press: Cambridge, MA, USA, 2019. [Google Scholar]
  42. Neural Network (2): RNN and Problems of Exploding/Vanishing Gradient. Available online: https://liyanxu.blog/2018/11/01/rnn-exploding-vanishing-gradient/ (accessed on 9 October 2022).
  43. How LSTM Networks Solve the Problem of Vanishing Gradients. Available online: https://medium.datadriveninvestor.com/how-do-lstm-networks-solve-the-problem-of-vanishing-gradients-a6784971a577 (accessed on 9 October 2022).
  44. Goodfellow, I.; Bengio, Y.; Courville, A. Deep Learning; MIT Press: Cambridge, MA, USA, 2016; pp. 301–302. [Google Scholar]
  45. Huenerfauth, M.; van Rossum, G.; Muller, R.P. Introduction to Python. Available online: https://m2siame.univ-tlse3.fr/_media/rpi/g2ebi_python_tutorial.pdf (accessed on 25 November 2022).
  46. Welcome to Google Colab. Available online: https://colab.research.google.com/ (accessed on 9 October 2022).
  47. Loss Function in Machine Learning. Available online: https://medium.com/swlh/cross-entropy-loss-in-pytorch-c010faf97bab (accessed on 9 October 2022).
Figure 1. UA-based biometric recognition process visualization.
Mti 06 00107 g001
Figure 2. Raw smartphone signal from Subject 3.
Mti 06 00107 g002
Figure 3. RNN sequence visualization.
Mti 06 00107 g003
Figure 4. LSTM memory cell structure schematic with an inner recurrence s k , and outer recurrence h k , i k , o k , f k , and g k .
Mti 06 00107 g004
Figure 5. LSTM model basic visualization.
Mti 06 00107 g005
Figure 6. Bi-LSTM model visualization. Two parallel PPG readings are given in this procedure by using raw signals and PPG-based features as inputs.
Mti 06 00107 g006
Figure 7. Proposed UA using Bi-LSTM based deep learning architecture.
Mti 06 00107 g007
Figure 8. Proposed UA-system diagram with two alternative deep learning classification systems.
Mti 06 00107 g008
Figure 9. Time series prediction with Bi-LSTM using two different training/testing splitting ratios (a) 50/50 and (b) 80/20 in Subject 3′s PPG data from Figure 2.
Mti 06 00107 g009aMti 06 00107 g009b
Figure 10. Time consumption for (a) learning rates, (b) batch sizes, and (c) number of epochs by implementing our Bi-LSTM model.
Mti 06 00107 g010aMti 06 00107 g010b
Table 1. LSTM hyperparameters definition in our UA Solution for training part in four different subject scales.
Number of SubjectsEpochsLearning RateBatch SizesHidden Units
5600.01150100
101500.001150100
201500.001150250
305000.001150250
Table 2. UA Bi-LSTM-based system average testing performance metrics in different scales.
Number of SubjectsAccuracyF1 ScoreRecallPrecision
590.9%94.8%96.8%92.8%
1090.6%94.9%99.7%90.7%
2095.1%97.3%99.9%95.2%
3096.7%98.0%100%97.0%
Table 3. Testing accuracy and testing losses for multiple number of epochs values.
EpochsTesting AccuracyTesting Losses
1096.6%0.15
5096.7%0.12
20096.5%0.09
50097.6%0.07
100095.5%0.67
Table 4. Testing accuracy and testing losses for multiple batch sizes values.
Batch SizesTesting AccuracyTesting Losses
3296.7%0.09
6496.5%0.10
15096.7%0.12
25696.6%0.015
Table 5. Testing accuracy and testing losses for multiple learning rates values.
Learning RatesTesting AccuracyTesting Losses
0.00196.7%0.12
0.00596.6%0.09
0.0196.7%0.10
0.0596.6%0.15
0.196.7%0.15
Table 6. Testing performance metrics by using raw signals as inputs in our UA model.
Performance MetricPercentage
Accuracy96.7%
Precision97.0%
Recall100%
F1 Score98.0%
FAR0.03%
FRR0.00%
EER0.03%
Table 7. Accuracy metrics by implementing a feature-based database as inputs in LSTM.
ArchitectureTraining AccuracyTesting Accuracy
LSTM baseline model93.2%59.1%
UA-based Bi-LSTM model93.0%95.0%
Table 8. Accuracy metrics by implementing a raw signals-based database as inputs in LSTM.
ArchitectureTraining AccuracyTesting Accuracy
LSTM baseline model96.3%96.3%
UA-based Bi-LSTM model96.7%96.7%
Table 9. Comparison of various UA methods in non-biometric and biometric sides.
AuthorsYearUA-Type SystemAuthentication TechniqueAdvantagesChallenges
Tivkaa et al. [11]2021Non-
biometric
PasswordOnline password guessing attacks.Proof of concept (No implemented).

Online UA solution.
Sherry et al. [12]2016Non-
biometric
PasswordTwo-steps online login attempts.Online UA system.

System unable to learn from previous attacks.
Sreelekshmi et al. [16]2021Non-
biometric
RFID/
smart cards
UA RFID-based school access systemFacility access application.

Hardware implementation.

Inconstant UA solution.
Mainenti et al. [20]2017BiometricFacialApple’s face ID system.

Wearable device UA system.

External sensor.
Privacy issues.

External artifacts affect the UA process.

Inconstant UA recognition.

Face orientation is limited.

Expensive.
Yang et al. [25]2019BiometricFingerprintContactless fingerprint UA system.external hardware required.

High-complexity design.

High cost.
Our Proposed Method2022BiometricFingertipContactless fingertip UA system.

Physiology exclusive data.

No additional hardware.
More testing in different authentication scenarios.
Publisher’s Note: MDPI stays neutral with regard to jurisdictional claims in published maps and institutional affiliations.

