Article

Forming Cognitive Maps of Ontologies Using Interactive Visualizations

Department of Computer Science, Western University, London, ON N6A 3K7, Canada
*
Author to whom correspondence should be addressed.
Multimodal Technol. Interact. 2021, 5(1), 2; https://doi.org/10.3390/mti5010002
Submission received: 6 October 2020 / Revised: 9 December 2020 / Accepted: 7 January 2021 / Published: 11 January 2021

Abstract

:
Ontology datasets, which encode the expert-defined complex objects mapping the entities, relations, and structures of a domain ontology, are increasingly being integrated into the performance of challenging knowledge-based tasks. Yet, it is hard to use ontology datasets within our tasks without first understanding the ontology which it describes. Using visual representation and interaction design, interactive visualization tools can help us learn and develop our understanding of unfamiliar ontologies. After a review of existing tools which visualize ontology datasets, we find that current design practices struggle to support learning tasks when attempting to build understanding of the ontological spaces within ontology datasets. During encounters with unfamiliar spaces, our cognitive processes align with the theoretical framework of cognitive map formation. Furthermore, designing encounters to promote cognitive map formation can improve our performance during learning tasks. In this paper, we examine related work on cognitive load, cognitive map formation, and the use of interactive visualizations during learning tasks. From these findings, we formalize a set of high-level design criteria for visualizing ontology datasets to promote cognitive map formation during learning tasks. We then perform a review of existing tools which visualize ontology datasets and assess their interface design towards their alignment with the cognitive map framework. We then present PRONTOVISE (PRogressive ONTOlogy VISualization Explorer), an interactive visualization tool which applies the high-level criteria within its design. We perform a task-based usage scenario to illustrate the design of PRONTOVISE. We conclude with a discussion of the implications of PRONTOVISE and its use of the criteria towards the design of interactive visualization tools which help us develop understanding of the ontological space within ontology datasets.

1. Introduction

Ontologies are external representations of domain knowledge created by experts through a collaborative examination process [1]. When creating ontologies, experts define an explicit and standardized common vocabulary which they use to transcribe their knowledge into a set of mappings which reflect the entities, relations, and structures of the domain. Ontology datasets are collections of software files which encode the complex objects of ontologies for use in digital environments [2]. Ontology datasets are increasingly being used to help the performance of challenging knowledge-based tasks. For instance, ontology datasets are being applied towards both system-facing computation tasks like information extraction on unstructured text and behavior modeling of intellectual agents, as well as an increasing number of human-facing visualization tasks like decision support systems within critical care environments [3,4,5]. Yet for domains of high complexity, such as biomedical research, environmental sciences, and medical triage, the ontology datasets can be challenging to understand. This is because their complex objects can combine to reflect countless ontology entities, relations, and any number of additional domain-specific concepts [6].
For ontology datasets to be used effectively, we need to understand them. When we encounter unfamiliar complex objects, we use our perception, intuition, and reasoning to form a mental model of their parts, relationships, and behaviors [7]. When encounters present us complex objects that describe a space, like distance, position, or orientation, our cognitive processes form a specific type of mental model, the cognitive map. Through theoretical and experimental work, researchers have explored how our cognitive processes organize our knowledge of spaces and our performances of cognitive activities like sensemaking, navigation, and exploration within spaces. The cognitive map framework describes formation as a set of stages. We first develop landmark knowledge of a space through the internalizing of the complex objects which describe location. Next, we develop route knowledge by building associations of the relationships which connect locations. Finally, we develop our understanding of the overall structure and layout of the space, referred to within the framework as survey knowledge [8,9,10]. We form cognitive maps during encounters with physical spaces, like when encountering the unfamiliar districts, streets, and buildings of a new city. Yet cognitive maps can also form for spaces that we perceive as spatial, yet does not directly exist within the physical dimension, like a website and its webpages [10,11]. Critically, encounters with ontology datasets and the knowledge encoded within their complex objects reflect spatial qualities like location, relation, and structure and thus encapsulate the conditions for cognitive map formation.
Ontology dataset visualizations are increasingly finding use during the performance of challenging knowledge-based tasks. Yet, up until recently, the design of ontology dataset visualizations have typically only considered tasks which presume a level of expertise and experience of the ontology dataset and the ontology it describes, such as ontology management or clinical treatment interfaces [12,13]. As a result, leading considerations towards the design of ontology dataset visualization have not targeted the specific problem space of learning tasks which help us in building understanding of the ontology dataset itself. Therefore, our motivation for this paper is to consider how the design of interactive visualizations of ontology datasets can promote conditions for cognitive map formation so that we can be helped in developing our understanding of the ontological space described within ontology datasets.
This paper begins with an introduction of the topics of cognitive maps, ontologies, and interactive visualization tools. We find that a wide range of theoretical and experimental disciplines have directed their efforts towards understanding the functionality of our cognitive processes and their effect on the performance of our cognitive activities. Next, we introduce the theoretical framework of the cognitive map and its application towards understanding how our brains organized knowledge of complex spaces. Then, we explore the use, creation, and limitations of ontologies, an expert-defined standardized common vocabulary describing the knowledge of a domain. The introductory content concludes with an examination of the fields of information visualization and visual analytics, discussing how designers can create visualization tools using visual representation and interaction design to support our performance of our tasks and their underlying cognitive activities.
Next, we examine existing work on cognitive load and the use of interactive visualizations to support learning tasks. Here, we find that recent studies show that there is no one specific level of cognitive load that is proper for supporting learning tasks. Instead, cognitive load is a set of extraneous, intrinsic, and germane loads which must adjust for the specific conditions of the tool and task context. Through this, we discover that interactive visualization tools are a valuable resource for learning tasks. Studies have found that if designed correctly, interactive visualization tools can be an effective environment for engaging learners. The examination of existing work concludes with an exploration of insight towards the design of visual representations and interactions to support cognitive mapping of spatial knowledge, alongside a summary of the cognitive activities performed within spaces. From these findings, we formalize a set of high-level design criteria for designing interactive visualization tools to support learning tasks through alignment of the cognitive map framework and its formation process. We then perform a review of existing tools which visualize ontology datasets. This review categorizes each tool based on their generalized subview combinations, and for each, we supply analysis of their strengths and weaknesses towards promoting cognitive map formation.
Following this, we present PRONTOVISE (PRogressive ONTOlogy VISualization Explorer), an interactive visualization tool which applies the criteria in its design to support us in understanding unfamiliar ontologies. In this, we explain the technological features of the PRONTOVISE, and describe its workflow and design within the context of our high-level design criteria. We describe PRONTOVISE, an interactive visualization tool that represents ontology datasets using a combination ‘List+Overview+Context+Details’ design. The presentation continues with a detailed description of the considerations made when designing the novel ontology dataset visual representations and interactions within each subview of PRONTOVISE. Through a usage scenario, we describe a set of encounters with the Human Phenotype Ontology (HPO) and show how the underlying design of PRONTOVISE can support the requirements for cognitive map formation. We conclude with a discussion of the implications of the generalized criteria, and assess the strengths and limitations of the design of PRONTOVISE.

2. Background

This section supplies background on the concepts and terminology used when building our design criteria and its use for the design of PRONTOVISE. First, we summarize the current understanding of the cognitive map framework as shown by theoretical and experimental work. Second, we describe the value of ontologies and their constitute parts. Finally, we explore how visual representation and interaction design can be used to create interactive visualization tools.

2.1. Cognitive Map Formation

A long-standing yet nebulous problem space across a wide range of theoretical and experimental disciplines is that of understanding the cognitive processes which form our knowledge of spaces and help us perform our activities within them. These disciplines, like neuroscience, experimental psychology, and human-information interaction, have examined how we internalize our encounters with complex spaces and their constituent parts, and use that knowledge to perform our activities within those spaces [8,10,11]. From these examinations, understanding has been built towards how our brain states process our experiences within unfamiliar spaces, and how our memory of those spaces is encoded internally within our cognitive systems. It has been found that internal representations mapping spatial relationships do, in fact, form when navigating unfamiliar environments and that the quality of that formation is directly affected by external conditions [9]. Studies have also been made on specific parts of our brain, like the hippocampus, to improve our understanding of our cognitive processes which involve space and time. From these studies, it has been found that when processing experiences, our brains leverage externally represented information which describes spatial and temporary knowledge to distill and organize that knowledge within our internal cognitive systems [14].
Integrating leading experimental evidence, current understanding towards how our brains organized knowledge of complex spaces aligns with that of the theoretical work for cognitive map formation and its general coding mechanisms [8]. The cognitive map formation is a staged process which occurs over repeated encounters with external representations of a space. During these encounters, our sensory and cognitive systems process our experiences into internal representations, which promotes the formation mechanisms associated with a cognitive map [15]. Under these mechanisms, cognitive map formation occurs in stages of increased fidelity, depends on the complexity of the space and the level of granularity which we want to understand it. For a space which is unfamiliar, the formation of our cognitive map begins by forming our initial understanding of high-level objects of the space. Our cognitive processes use existing mental models to begin to distinguish distinct locations of the space, and from them, process locations of importance as landmark knowledge. Landmark knowledge is used for activities involving static information of specific locations and objects with a space, like comparison and sensemaking [16,17]. Once forming our initial level of landmark knowledge, our cognitive processes begin to form associations towards the links between locations, contextualizing their pathing and relationships, which the framework refers to as route knowledge. Route knowledge is used for transitional activities involving movement between locations and objects of a space like wayfinding and navigation [11,17]. As landmark and route knowledge grows, we start to form extended associations which map the locations and objects across their relationships and paths. These associations form our survey knowledge of the overall structure and layout of a space. Survey knowledge is involved with generalizing our understanding of a space, and allows us to perform activities which require a refined level of landmark and route knowledge, such as orientation, exploration, and comparison of spaces [17,18].

2.2. Ontologies

Ontologies are an expert-defined standardized common vocabulary describing the knowledge of a domain. Ontologies are increasingly being used to help the performance of challenging knowledge-based tasks. This is because they provide the flexibility, extensibility, generality, and expressiveness necessary to bridge the gap between the requirements for mapping domain knowledge into forms which are generalized for effective computer-facing and human-facing use [19]. After defining an ontology, experts record the complex objects of the ontology into data files which supply standardized ontology specifications. Once generated, these data files can be packaged in a dataset, shared amongst domain stakeholders, and integrated into computation and human-facing resources to support performances of challenging domain tasks. For instance, they are being used within towards both system-facing computation tasks like information extraction on unstructured text, behavior modeling of intellectual agents, as well as an increasing number of human-facing visualization tasks like decision support systems within critical care environments [3,4,5].
The common vocabulary of an ontology is composed of a network of complex objects produced by a systematic review of domain content [1,20]. Experts construct this network using two types of complex objects: the ontology entity and the ontology relation, which together yield various ontology structures. Ontology entities reflect the distinct concepts within the domain, like a phenotype in a medical triage ontology, a processor in a computer architecture ontology, or a precedent in a legal ontology [21]. Ontology entities will typically encode information about their role in the vocabulary, definitions, descriptions, and contexts, as well as metadata that can be used to inform the performance of future ontology engineering tasks. Ontology relations are the links between ontology entities which express the quality of interaction between them and towards the domain as a whole [22]. One of the most common types of ontology relations is that of inheritance. In this relation, the characteristics of one ontology entity act as a template to define another. For instance, an ontology entity in an animal ontology standing for the concept of a ‘dog’ may inherit from an ontology entity reflecting the concept of a ‘domesticated animal’. Typically, ontology relation types are domain-dependent and emerge out of unique interoperability between ontology entities. For instance, an animal ontology may also have an ontology entity reflecting the concept of a ‘human’, which may have the ontology relations ‘domesticates/is domesticated by’ between it and the ‘dog’ ontology entity.
When the size and complexity of a domain rises, so too does the complexity of its ontology. As a result, ontological datasets can become very large and complex, supporting countless complex objects describing ontology entities and relations. When interacting with highly complex spaces like ontologies, the limitations of human cognition can create a bottleneck in human-facing analytic workflows [23]. Therefore, a leading challenge for those who look to use ontologies is maintaining an ontology dataset which accurately describes its domain while still being useful for both computation and human-facing tasks.

2.3. Interactive Visualization Tools

Our daily lives are permeated by encounters with external representations that connect to us through our visual perception, auditory, and other sensory systems. Designers encode their knowledge as information within their external representations, in the hopes that this knowledge can be transferred to the sensing observer. Information visualization is an area of research which concentrates on investigating the use of visual representation as an interface to our cognitive processes, and the mental representation space which they manage [24]. Through theoretical and experimental work, researchers investigate strategies for designing visual representations to support of our cognitive processes [7,25].
We use tools to improve our ability to complete challenging tasks, both physical and cognitive. Rollerblades, hammers, and pencils are examples of tools which augment the physicality of the human body to perform difficult physical activities (i.e., dexterity, strength, speed, precision, etc.). Similarly, we can use tools like language, books, and computational devices to support the performance of activities which are cognitive in nature. We achieve cognitive augmentation through the activation of distributed cognition, where through interaction, complex cognition is offloaded from the internal processes of our mental representation space and into the external representation and computation space of our tools [26]. By offloading complex cognition to tools designed to support complex cognitive activities, this distribution of cognitive responsibility allows us to direct our mental concentration towards other activities which are more aligned with our natural cognitive abilities [27].
These days, designers take advantage of readily available technologies like high resolution monitors, standardized operating systems, and internet services to produce powerful cognitive tools. Research spaces like visual analytics, which concentrate on the using of visual representation to support analytic reasoning, are using these technologies to design visualization tools that support the performance of our complex cognitive activities. For instance, visualization tools have been used for sensemaking activities towards misinformation within the medical domain, search activities on large document sets, and decision-making activities using health data [28,29,30]. Providing the opportunity for interaction with visual representations allows us to become an active participant in our encounters with encoded information. That is, by integrating interactive components within a visualization tool, designers can formulate a dynamic and evolving dialectic between us and the encoded information. Interactive visualization tools allow us to perform actions onto the interface based on our perception of encoded information. Based on an action event, a tool can ingest that action into its internal logic, move into the computation space, formulate potential responses, and then adjust its interface in a way in which we can perceive. These three stages: perception, action, and tool reaction, form an interaction loop, which can be explored by researchers to establish generalized patterns, frameworks, and methodologies which better support our needs as we perform complex cognitive activities [31,32].

3. Methods

In this section, we describe the methods used for formulating a set of high-level design criteria for designing interactive visualizations of ontology datasets which support the performance of activities which promoting cognitive map formation. We begin with related work about cognitive load during complex learning and the use of interactive visualizations to support complex learning. Based on these findings, we outline a set of criteria for designing interactive visualization tools for complex learning by supporting the stages of cognitive map formation. We review existing ontology dataset visualization tools and analyze how they align or mis-align with the conditions that support the cognitive activities performed during complex learning and their promotion of cognitive map formation for unfamiliar ontologies.

3.1. Related Work

Cognitive load theory, a framework for understanding the functional interplay between working and long-term memory, describes that our working memory can be understood as a cognitive load put onto us that forms out of the complexity of a learning task [33]. Within the framework, cognitive load is explained as a combination of three loads: intrinsic load as the mental effort associated with task performance, germane load as the mental effort required for processing an encounter for conversion into long-term memory, and extraneous load as the task-irrelevant activities resulting from poor encounter design [34].
Recent work has targeted the challenging dynamics of cognitive load and its impact on learning. A study by Wang et al. explored the impact of cognitive load and affordance design on the performance of learning tasks using collaborative tools. Within their three-cohort study, three unique interfaces were prepared and assigned to a cohort to support the performance of the same learning task. For the three interfaces, one was noninteractive video-based, one noninteractive text-based, and one providing an interactive interface integrating various multimedia. It was found that the noninteractive video-based interface cohort expressed significant overloaded working memory and performed poorly in their post-task scoring assessment. The text-based interface cohort expressed that they experienced low cognitive loads for working memory and performed adequately in their assessment scores. Yet, they found that the interactive multimedia group produced the highest assessment scores of any cohort, even though they expressed a moderate level of cognitive load [35]. In addition, recent research efforts by Seufert explored the problem space, targeting the performance of self-regulated learning tasks, and arrived at similar conclusions [34]. As such, neither high nor low cognitive load is definitively correlated with the conditions for effective learning. Instead, leading guidance prescribes that proper cognitive load can vary task to task. Therefore, when creating learning environments, designers should: Take care to minimize extraneous load which is unrelated to the learning task, direct intrinsic load towards supporting the specific cognitive activities of the learning task, and unify affordances to best align the information, learning process, and the learner towards maximizing germane load for converting working to long-term memory [36]. Yet, this care is not often observed within the design of interactive visualization tools which support learning tasks involving ontology datasets. This will be examined in depth within our review of existing tools.
Interactive visualization tools can be a valuable resource for learning tasks. We gain a deeper level of understanding when performing learning tasks when we engage mixtures of deeply textured information formats within a flexible learning environment [35]. When we learn, we seek to move beyond our prior knowledge and into the unfamiliar through cognitive engagement [33]. For this, it is critical to consider creative thinking and the underlying processes of divergent thinking, which is the generation of ideas, and convergent thinking, the evaluation of ideas. A two-cohort study was performed by Sun et al. which asked each cohort to perform the same learning task involving divergent thinking. Specifically, one cohort was provided an online system without any assistive support, yet the other was provided an interactive visualization tool to support cognitive mapping during task performance. The results from the study directly exhibited that members of the cognitive mapping resource cohort had an improved task performance over their corresponding non-resource cohort members. It was concluded that members of the cohort were able to manage their working memory through a moderation of cognitive load during cognitive mapping [37]. As such, tasks which involve creative thinking can be improved through the use of interactive visualization tools. This can be achieved by aligning with the requirements for cognitive mapping and its underlying cognitive activities like association, decomposition, combination, and adjustment during divergent thinking, and selection and evaluation for convergent thinking. This is especially important in self-regulated learning environments with interactive visualization tools, where we must guide our own learning tasks through the setting of goals, the planning of our learning process, enacting our process by using our resources to interact with new information, and evaluating our learning achievements [34]. We, however, find that the requirements for supporting cognitive mapping are not accounted for within the design of interactive visualization tools which support learning tasks involving ontology datasets. This will be examined in depth within our review of existing tools.
Visualization can improve our capacity to encounter new information, yet poorly designed visual representation and interaction can also harm learning and the performance of its necessary cognitive activities [38]. This is still true for interactive visualizations of ontology datasets and their ontological spaces. Studies have shown that the inclusion of supplementation information describing a space in visual representations not only affects how our cognitive processes handle new information, such as with memorization and decision-making, but also provides meaningful improvements towards the performance of cognitive activities during cognitive mapping within learning tasks [37,39]. It is important that designers account for the way novel information is processed by learners when designing their visualizations, and be cognizant towards how specific design strategies can facilitate conditions for effective learning [36]. We summarize, in Table 1, the cognitive activities performed within spaces, expounding their relationship to divergent and convergent thinking, and the types of spatial knowledge required for their performance within the framework of cognitive map formation.
The visualization of ontology datasets is an active problem with an expansive set of research themes. New publications are consistently taking the creation, activation, and visualization of ontology datasets into novel and varied directions. Specifically, a literature review performed by Pesquita et al. highlights the range of discussion towards semantic web research. They describe the two leading challenges for supporting semantic web tasks. The first is the challenging of support users of varying levels of expertise. The second is the challenging of generalizing findings across different task contexts, such as different types of information within datasets and what the task wants to do with that information. Additionally, they note that there is a shortfall of research directed towards understanding the performance of open-ended tasks using semantic web visualizations, when considering the users, information, and task context [40].

3.2. Task Analysis

We find five high-level criteria for designing interactive visualization tools of ontology datasets that promote the stages of cognitive map formation for learning tasks. They are provided in Table 2.

3.3. Existing Tool Review

We consider prior survey work by Katifori et al., since updated by Dudáš et al., which provides a high-level collection of design strategies for visualizing ontologies and assist in the record keeping of active tools [41,42]. Additionally, we consider recent work by Po et al. which provides a thorough investigation of linked data visualization with dedicated portions directed towards ontology visualization tools [43]. These resources aid in our determination towards our coverage of existing tools within in our examination, based on three conditions: The tool is currently accessible, is still in a working state, and both loads and represents ontologies of any size. We require the tool to be accessible, as they must still be available for our examination. This eliminates tools like GrOWL and OntoTrix, which are no longer accessible. We require the tool to be in a working state, as it would be unfair to assess a tool that can no longer fulfill its functional purpose in the manner it was intended. This condition eliminates tools like OntoViz and OntoSphere, which are still accessible, but are no longer supported in their original Protégé suite environment. The final condition specifies that the tool must load and represent ontology of any size, as our scope is of a generalized design for visualizing ontology datasets of all sizes. This condition removes a tool like SOVA, which, while accessible and working, cannot load large ontology datasets. Using these criteria, we filter from the full set of ontology dataset visualization tools constructed by Dudáš et al., to produce the following list of ontology visualization tools: Protégé Entity Browser, Protégé OntoGraf, Ontodia (now maintained under the name Metaphactory), OntoStudio, WebVOWL, and TopBraid Explorer [44,45,46,47,48,49]. Additionally, we add consideration towards OntoViewer, a demonstrative tool from a recent publication by Silva et al. [50]. Furthermore, we consider WebProtégé Entity Graph, built within the latest edition of the Protégé software suite [51]. This review is a targeted review of existing tools and their underlying designs towards supporting complex learning and their promotion of the stages of cognitive map formation. Within this review, we categorize the tools based on their included subview types. Table 3 provides a description of each subview type.

3.3.1. List+Details Designs

Protégé Entity Browser is an interactive visualization tool which uses a legacy version of Protégé software suite. It represents ontology datasets using a combination ‘List+Details’ design, as depicted in Figure 1 [47]. The system has two subviews, a list and a details subview. The visual space of the list subview maintains a tree-like list of either entities or relations with standard expand-collapse interactions. When an interaction is made on an entity label, the details subview to the right of the list is shown. When this occurs, the information associated with the selected ontology entity is represented in the details subview, accompanied by buttons which allow for various creation, edit, and removal interactions. If any of the text-based labels refers to an alternative entity within the ontology, selecting it will change the details view to show the information of that entity.
An advantage of the design of Protégé Entity Browser is that it supplies encounters which do not depict any novel visual representations or interactions. Little to no training is needed, as we can apply intuition from mental models of standard text-based interfaces. A disadvantage of Protégé Entity Browser is that its list subview does not scale well to ontologies with high numbers of complex objects, as only a limited number can be represented before going ‘off the screen’. To address this, collapsing interactions are provided; however, this reduces the opportunity for encounters with large sections of the ontological space that may be relevant to activities performed during learning like navigation, exploration and search. Furthermore, the design represents only one of the entities or relations at a time. This reduces our ability to perform sensemaking on entities, forming landmark knowledge, and relations, which form route knowledge. Additionally, this design consideration harms our ability to build strong associations between entities using their shared relations which form the structure and layout for activities which require survey knowledge.

3.3.2. List+Context Designs

Protégé OntoGraf is an interactive visualization tool that also uses a legacy version of the Protégé software suite to visualize ontology datasets using a combination ‘List+Context’ design, as depicted in Figure 2 [45]. The system supplies two subviews, a list and a context subview. The list subview of Protégé OntoGraf uses the same representation and interaction design as the earlier Protégé Entity Browser. While Protégé Entity Browser provided a text-based details subview, Protégé OntoGraf instead provides a subview which supports visualizations with interactions that depict representations of ontology entities and relations. As a representation of an ontology entity is interacted with in the list subview, it appears in the context subview, encoded with interactions which adjust it in various ways. A double-clicking interaction will request the tool to center the selected entity and its relations. A right-clicking interaction allows for the use of some entity-specific actions, like generating its full network of ontology relations. Additionally, a hold-and-drag interaction allows for entities to move within the representation space, and a zoom interaction can make visual representations larger in their display. Protégé OntoGraf also includes a text-based search, though it does not supply any autocomplete or suggestive capabilities.
The advantages and disadvantages of the list subview is shared with the earlier Protégé Entity Browser. However, unlike the Protégé Entity Browser, Protégé OntoGraf does not allow for the list to represent ontology relations. As such, it can only provide encounters with interactions directed towards ontology entities, reducing opportunities for sensemaking activities, and, in turn, the development of non-landmark knowledge within the list subview. A strong advantage for Protégé OntoGraf is its ability to support initial landmark and route knowledge development within its context subview. When an ontology entity is provided in the context subview, we can directly interact with it as an object in space. This allows us to encounter inheritance relationships backwards, as well as open multiple entities at the same time, allowing for navigation, exploration, and even more challenging activities like wayfinding. However, a disadvantage of Protégé OntoGraf’s design is that it is very hard to establish a detailed understanding of any one specific entity, as there is no way to encounter information of ontology entities beyond their text label, as was available in the Protégé Entity Browser. Additionally, the size of a box generated to represent an ontology entity is based on the length of its text-based label. At best, this supplies little to no value during sensemaking activities, but, at worst, may mislead us while we try to understand which ontology entities are important locations within the space, promoting poor landmark knowledge. Furthermore, it is not possible within the context subview to navigate to ontology entities which inherit from a target entity. Finally, the context subview does not scale well to large ontologies. If the generation of any sizable number of ontology entities and relations is requested, the display must be zoomed out to such an extreme point that all individual clarity is lost, reducing the effectiveness in activities like search.

3.3.3. Overview+Details Designs

WebVOWL is an interactive visualization tool that visualizes ontology datasets using a combination ‘Overview+Details’ design, as depicted in Figure 3 [45]. The system supplies two subviews, an overview and a details subview. The details subview of WebVOWL uses a similar representation and interaction design as the earlier Protégé Entity Browser, where information is supplied for ontology entities and relations selected within alternate subviews. Unlike previously discussed tools, WebVOWL maintains an overview subview instead of a list subview. That is, when WebVOWL loads, it applies a similar representation and interaction design for its ontology entities and relations to that of OntoGraf’s context subview, except that the ontology is visualized in full. This adjustment removes the need for users to specifically target ontology entities or relations from a list subview before they are represented in alternate subviews, immediately allowing users to encounter ontology structure. As an entity or relation is interacted with in the overview subview, its information is presented within the details subview. A hold-and-drag interaction allows for entities to move within the representation space, and a zoom interaction can make visual representations larger in their display.
The advantages and disadvantages of the details subview of the design is shared with the earlier Protégé Entity Browser. A strong advantage for WebVOWL is its ability to fully support the performance of many cognitive activities like search, navigation, and exploration within its overview subview, thereby supporting the development of all stages of cognitive map formation. When an ontology dataset loads, we can directly interact with it as an object in space. However, a disadvantage of the design of WebVOWL is that it is very hard to target cognitive activities on specific entities and relations, as the tool forces an overview representation with a very low quality of interactivity towards divergent thinking. Finally, the overview subview does not scale well to large ontologies, because if the generation of any sizable number of ontology entities and relations is requested, the display must be zoomed out to such an extreme point that all individual clarity is lost.

3.3.4. List+Overview+Details Design

Ontodia is an interactive visualization tool which represents ontology datasets using a combination ‘List+Overview+Details’ design, as depicted in Figure 4 [44]. Like previously discussed systems, Ontodia maintains a list subview using the same expand-collapse representation and interaction encodings. Ontodia improves on this by including a text-based search with auto-complete and suggestive features. Ontodia provides a context subview populate based on interactions with the list subview. Ontodia follows the model of Protégé OntoGraf yet differentiates by annotating added high-level information. That is, it supplies a summarized label of inherited ontology entities, an assigned color, and imagery of the entity, if included, and support for all ontology relation types, each relation including a text-based label. Ontodia does supply new interactions for ontology entities, like access to a details subview, a removal interaction for ontology entities, and filters the list subview based on a specific ontology entity. More so, Ontodia represents a high-level overview of the contents of the context subview, which simplifies the active ontology entities based on position in space, their current size, and assigned color. Attached to this is a basic panning interaction. Finally, Ontodia supplies a details subview, which, upon request, will show in text the information content of the selected entity or relation, just as was provided in Protégé Entity Explorer.
The advantages of the list subview is shared with the earlier systems. Yet, Ontodia goes above and beyond with the inclusion of a panel which keeps track of active ontology entities and relations. This addition allows users to reference in text the current state of the view and quickly associate listed entities and relations, supporting sensemaking and orientation activities. The tool aligns with the formation of route knowledge through its explicit labeling of ontology relations within the context subview. Finally, Ontodia includes access to an ontology details subview that was not provided in the prior Protégé OntoGraf. This allows users to have encounters with information during the performance of the more complex activities associated with the later stages of cognitive map formation which receive help from the use of more familiar visual representations. On the side of disadvantages, Ontodia struggles to provide visual representations of large ontologies, as just like Protégé OntoGraf, the only solution for providing a wide view of the overall ontology is to zoom out the context subview at the expense of clarity. Ontodia attempts to provide some solution to this issue with the high-level overview of the contents of the context subview. However, this inclusion does not represent any new information which would support the expansion of survey knowledge, nor include interactions that provide support for any added activities within the space that can support our learning tasks.

3.3.5. List+Context+Details Designs

OntoStudio, TopBraid Explorer, and WebProtégé Entity Graph are three interactive visualization tools which represent ontology datasets using a combination ‘List+Context+Details’ design [46,48,51]. While each of these tools include distinctive qualities, in general, they all have a similar high-level design, as seen with WebProtégé Entity Graph in Figure 5. Like previously discussed systems, each of the three tools support a list subview using the same expand-collapse representation and interaction encodings. WebProtégé improve on this by including a text-based search with auto-complete and suggestive features. These three tools provide a context subview populate based on interactions with the list subview. Each system has slight variations in their representation strategy, but largely follow the model of Protégé OntoGraf. All three build upon Protégé OntoGraf by providing support for all ontology relation types, and with each relation, including a text-based label. However, like Protégé OntoGraf, WebProtégé Entity Graph, OntoStudio and TopBraid Explorer do not supply interactions which support any expansion of inheritance, centering, or sorting. Finally, all three systems supply a details subview, which, upon request, will show in text the information content of the selected entity or relation, just as was provided in Protégé Entity Explorer.
The advantages of the list subview within these systems is shared with the earlier systems. All three tools better align with the formation of route knowledge through their explicit labeling of ontology relations. Additionally, the tools include access to an ontology details subview that were not provided in the prior Protégé OntoGraf. This allows users to have encounters with information during the performance of the more complex activities associated with the later stages of cognitive map formation which receive help from the use of more familiar visual representations. On the side of disadvantages, all three systems struggle to supply visual representations of large ontologies. Similar to Protégé OntoGraf, the only solution for supplying a wide view of the overall ontology is to zoom out the context subview at the expense of clarity. This harms the performance of cognitive activities within spaces like search, wayfinding, and exploration.

3.3.6. List+Overview+Context+Details Design

OntoViewer is an interactive visualization tool that visualizes ontology datasets using a combination ‘List+Overview+Context+Details’ design, as partially depicted in Figure 6 [50]. As with earlier systems, OntoViewer maintains a list subview using similar expand-collapse representation and interaction. Like Ontodia, this list includes a text-based search which supplies filter interactions over the full ontology. However, unlike Ontodia, the list subview does not support both a list of the full ontology and a list of all active ontology entities at the same time. Instead, only a single list is supplied which filters down from the full set to a filtered set. OntoViewer improves on its list subview by encoding more information about the ontology relations associated with each ontology entity. OntoViewer includes a dedicated overview subview which represents the full network of ontology entities and relations, and changes based on the current selections within alternate subviews. The overview represents a node-link radial tree which maps the network of the ontology entities and relations out from the root ontology entity. Yet, this overview is limited to two ‘steps’ of ontology relations out from the root ontology, nor does it maintain any interaction on it. OntoViewer maintains a context subview which supplies novel visual representations and interactions for ontology entities, relations, and structure. OntoViewer supplies a stacked visual space which allows users to select one of three dedicated context subviews to highlight the qualities of ontology entities, relations, structure, and instances. For relations, OntoViewer attempts to improve on the node-link graph representation, as seen in the earlier systems, into what they referred to as 2.5-dimensional space. That is, it represents its network of ontology entities and relations in a radial distribution, just as was done in the overview, except at a perspective which mimics a three-dimensional plane within the two-dimensional display. Concerns with encoding overlap are addressed with interactions which shift the perceived perspective of the representation in various directions and orientations. For ontology entities, OntoViewer provides a dedicated context subview with an icicle tree diagram representing a selected ontology entity, the ontology entities it inherited from, and the ontology entities which inherited from it. Finally, for structure, OntoViewer supplies a dedicated context subview which presents a bar chart describing the spatial calculations for a set of ontology entities like distance between entities, number of relations, and their distance from the root ontology entities.
OntoViewer provides numerous advantages for supporting the stages of cognitive map formation. The advantages and disadvantages of the list subview largely aligns with the advantages of previous systems. However, by improving by including encodings within its list that signal when ontology relations are assigned to an entity ontology, encounters with entities can provide opportunities for initial comparison and sensemaking and can guide navigation activities which develop route knowledge. OntoViewer adds an overview which shows a high-level abstraction of the ontological space. This abstraction can aid us during encounters to orient our activities within the space, act as a wayfinding resource towards further encounters, and suggest structural patterns which can help develop survey knowledge. However, the representation strategy used within the overview subview does not represent the full ontology mapped within the dataset, but instead limits its representation of the network ontology entities and relations at a certain distance away from the root ontology entity. By providing a representation which does not depict a complete mapping of ontology structure, nor provide encodings which clearly afford the existence of obscured ontological features, the potential for bad encounters with ontological space rises. These encounters can lead to misunderstandings towards the information which describes the space and may lead us to misalign our development of spatial knowledge. In its context subviews, OntoViewer advances past other systems in its support of cognitive map formation by appointing three dedicated subviews for ontology entity, relation, and structure. By splitting concerns, each subview can supply encounters that best demonstrate the unique qualities of each form of spatial knowledge. A disadvantage with the specific implementation of the context subviews of OntoViewer is that they share a stacked visual space, where subviews are occluded when not selected. This breaks with the value of distributed presentation, as it is reducing our ability to receive feedback when performing activities which should afford a coupling between multiple types of spatial knowledge.

4. Materials

In this section, we describe the materials of our generalized design of PRONTOVISE and its implementation. We begin with an outline of the technologies used within the PRONTOVISE implementation. Next, we present a high-level look at the workflow of PRONTOVISE and supply a general overview of its design details.

4.1. PRONTOVISE Technologies

We developed PRONTOVISE as a generalized web-based tool which allows for the uploading of correctly formatted OWL RDF ontology data resources, either individually, or within a .zip compression file. The tool processes the uploaded files and indexes its contents for use. We have created the front end of PRONTOVISE using the latest HTML5, CSS, and JavaScript technologies, allowing for cross-browser (Firefox, Chrome, Opera) and cross-platform support. Its back-end technology is also developed with JavaScript. We use the Lunr.js JavaScript service as our ontology entity indexer and search engine [52]. We used the D3.js JavaScript visualization library to create the visualization and interaction experiences found throughout PRONTOVISE [53].

4.2. PRONTOVISE Workflow and Design

PRONTOVISE maintains several systems within its workflow. We will now briefly describe each of their designs in the context of their workflow, as depicted in Figure 7, and highlight their satisfaction of the criteria for designing interactive visualization tools which support complex learning and the stages of cognitive map formation.
The workflow of PRONTOVISE begins first by one loading the PRONTOVISE web application using their computer and browser of choice. PRONTOVISE presents a starting page which asks to upload a valid OWL RDF ontology file. When an upload interaction is performed, the ‘back-end’ ontology processing system uses several technologies to read, validate, and initiate the processing of the data encoded in the uploaded file. Using third-part resources like the Lunr.js library, the data of the ontology file is analyzed, indexed, and stored within browser memory. This temporary storage allows our visualization software to access ontology content and structure, as well as provide an index for text-based search functionality. As we do not consider our work in the ‘back-end’ of PRONTOVISE a novel pursuit, no further description will be directed towards this system.
Once the ontology processing subsystem has completed its work, the ‘front-end’ system which performs the visualization of the ontology dataset starts. The system accesses the stored ontology data, analyzes it, and directs that data to each of the subviews which are shown across the available visual space.
PRONTOVISE is an interactive visualization tool that represents ontology datasets using a combination ‘List+Overview+Context+Details’ design. This combination aligns with the OntoViewer interactive visualization tool, described in the Methods sections within our review of existing tools. Within the review, two concerns were presented towards the implementation of the ‘List+Overview+Context+Details’ design within OntoViewer. To recall, the examination of the overview subview within OntoViewer was that it did not depict a complete mapping of ontology structure, nor supply encodings which clearly afford the existence of obscured ontological features. Thereby, it afforded in such a way that could result in bad encounters with ontological space. Additionally, our examination of its context subview highlighted a concern with its choice to restrict each context subview within a shared visual space, where subviews are occluded when not selected. We stated that this breaks with the value of distributed presentation because it reduces opportunity for feedback when performing activities which should afford a coupling between multiple types of spatial knowledge. PRONTOVISE differentiates from OntoViewer by facilitating improvements on the visual representation and representation designs for each of ‘List+Overview+Context+Details’. Concentration is directed towards improving the quality of affordances within the overview and addressing the concerns which arise due to stacked visual spaces using a distributed series of context subviews. We summarize, in Table 4, the high-level criteria within PRONTOVISE, which can be used for designing interactive visualization tools which support complex learning and the stages of cognitive map formation.
There are seven subviews within PRONTOVISE: Search and Pinning Panel, Ontology Sections Panel, Section Levels Panel, Level Landmark Entities Panel, Entity Network Panel, Path Explorer Panel, and Entity Details Panel. They are presented together in Figure 8. The full set of subviews remain context aware of their neighboring subviews and manage their internal logic to align with the user as they move between each. We summarize each subview in relation to our task analysis in Table 5, followed by discussion for each subview.

4.2.1. Search and Pinning Panel

Search and Pinning Panel, found to the furthest left of PRONTOVISE, maintains a visual space which stacks two ‘list’ subviews called Search and Pinned. These two subviews will now be discussed in more detail.

Ontology Entity Search

We have designed Ontology Entity Search to support text-based search of ontology entities within PRONTOVISE. This interaction is critical to cognitive map formation as it allows us to direct our encounters for self-regulated learning by using our existing understanding of the ontology dataset. We are presented with a search input field where we can type to perform search activities. During search activities, we are also provided with a type-ahead system that suggests possible ontology entities related to our current input and an interaction to Pin the suggestion. After a search is performed, the ontology entities contained within the result list are placed into the Ontology Sections Panel subview. This helps us perform sensemaking activities within the space, orient the position of the entity within the ontology, and to begin activities like wayfinding, navigation, and exploration. When selected, the Pin button found within each result item adds the chosen entity into PRONTOVISE’s pinning system. We reflect this by changing the Pin button into an Unpin button, as well as by assigning a unique color to that entity wherever it is found in PRONTOVISE to support wayfinding activities using that ontology entity. These considerations are depicted in Figure 9.

Ontology Entity Pinning

We have designed the Ontology Entity Pinning to support the management of ontology entities within PRONTOVISE. This feature is critical to cognitive map formation as it allows us a dedicated interface to manage the selection interactions we have made to initiate or continue our various cognitive activities during self-regulated learning. We initialize Ontology Entity Pinning with an empty pinned list which fills as users add entities into the pinning system through Ontology Entity Search. These color assignments are used as cross-subview encodings which support the performance of cognitive activities across PRONTOVISE, as seen in Figure 10.

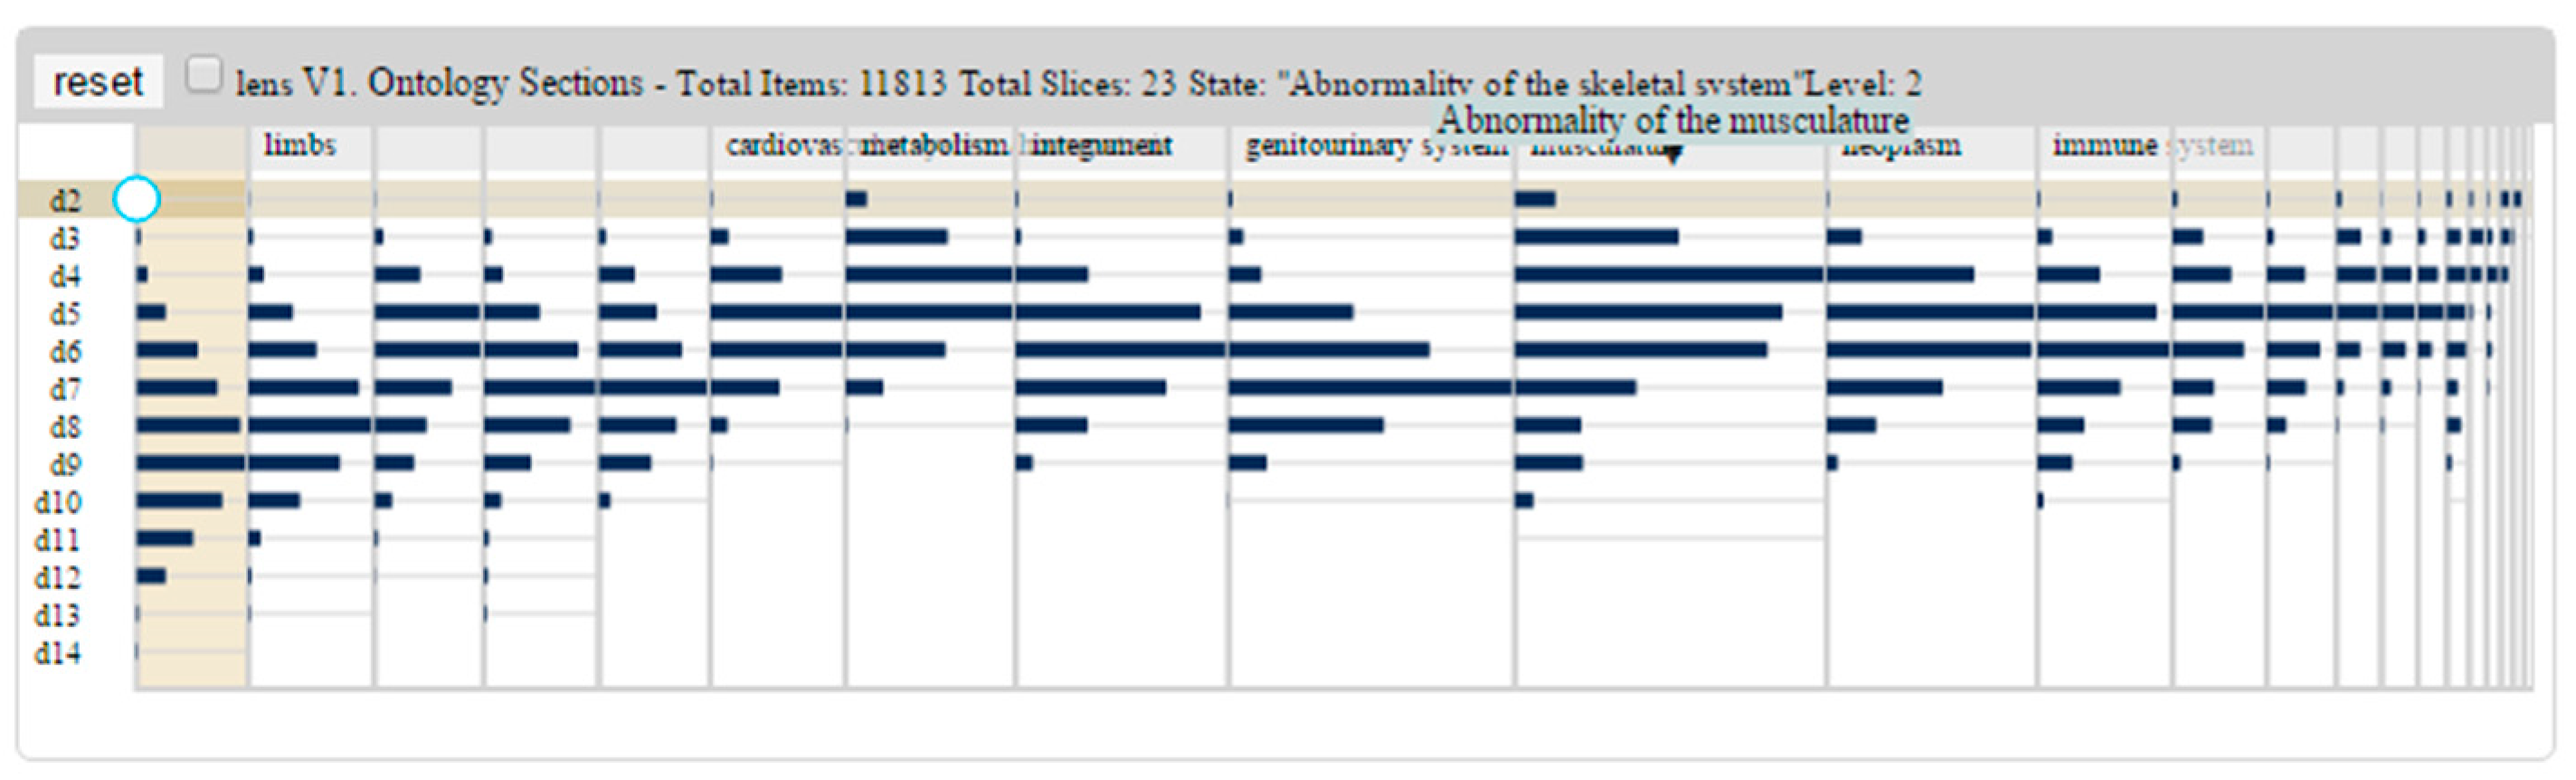
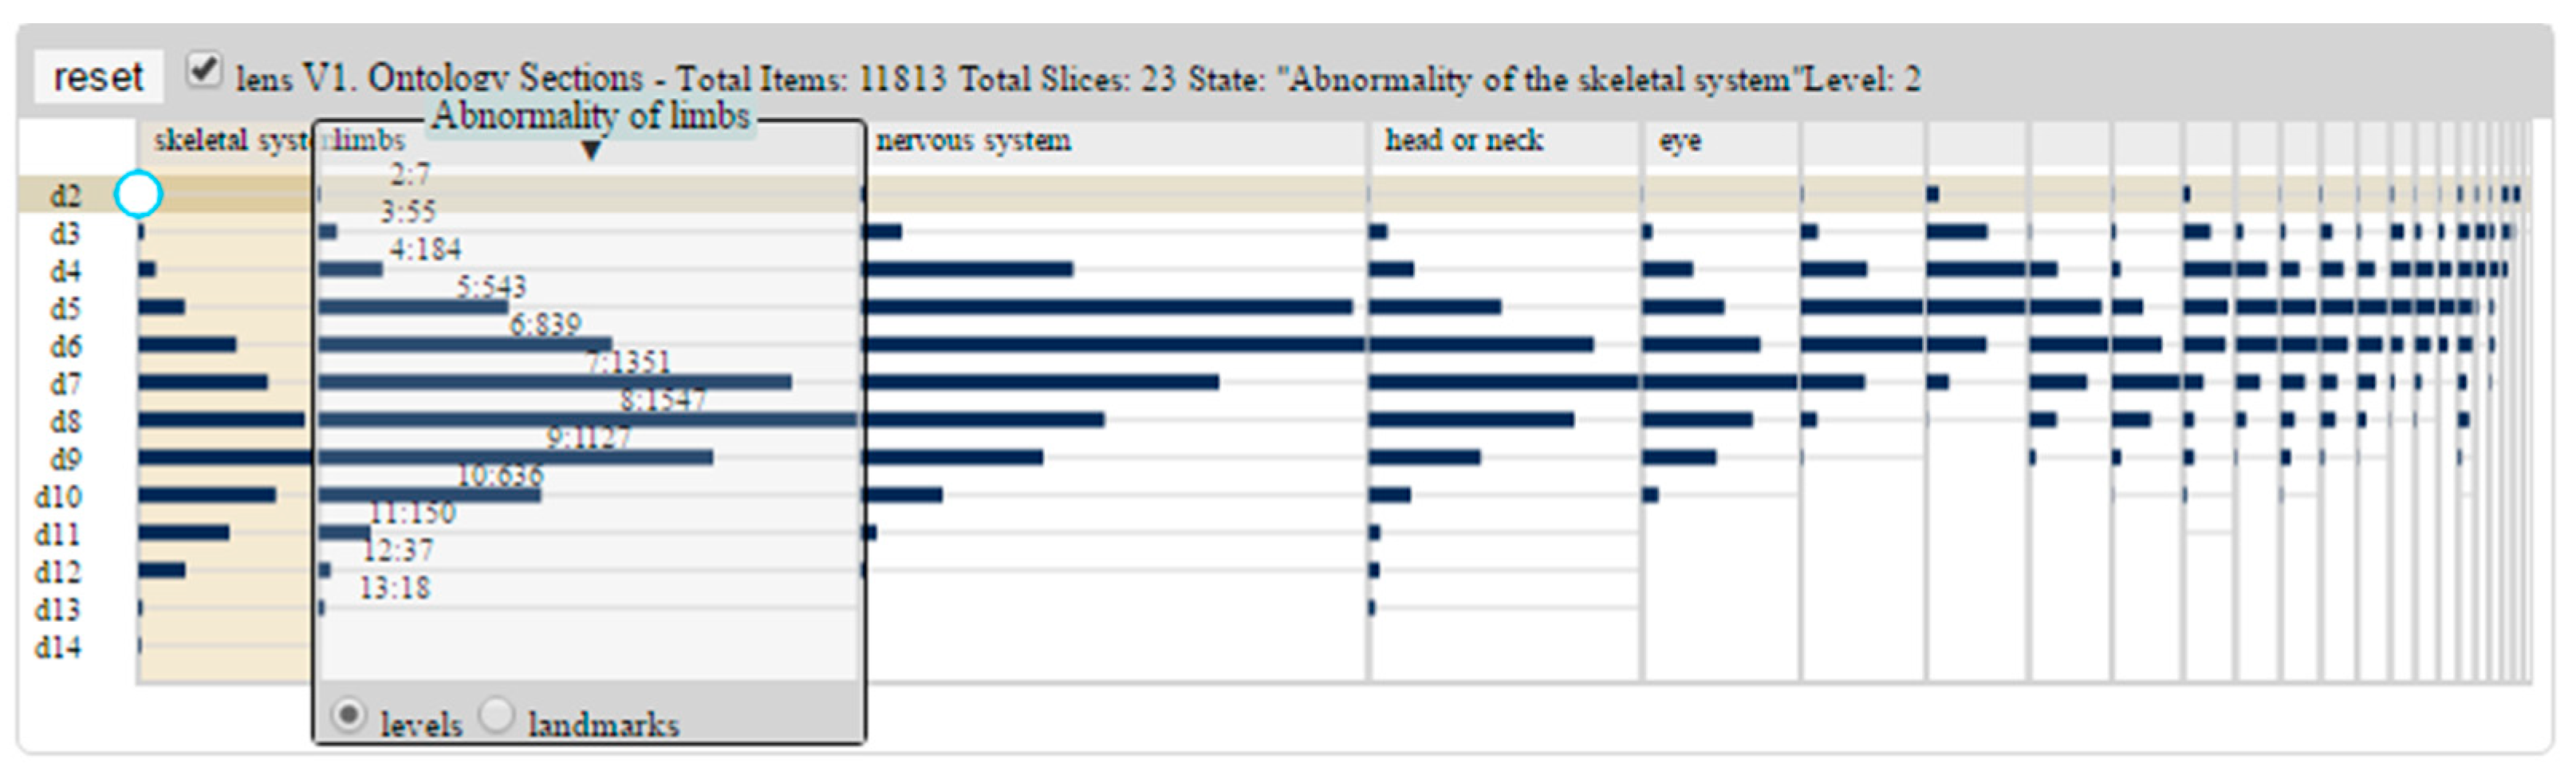
4.2.2. Ontology Sections Panel

The Ontology Sections Panel, which is found at the top center position of PRONTOVISE, presents us with an ‘overview’ subview which fully affords ontology structure and promotes highly connected ontology entities as potential landmarks. We have designed the Ontology Sections Panel to represent a series of ontology sections, headed by its high-level ontology entity, determined from the set of entities associated with direct routes from the root entity of the ontology. We supply information regarding the depth and comparative size of each ontology section to help our sensemaking activities towards the distribution of entities within the ontology, as well as preview the ontology relations between groupings of entities. During encounters with the ontology sections and their structure, the concept of distance from the root ‘super classes’ becomes an important assessment metric. For each ontology section, we are supplied a series of vertically distributed blue bars that are sized proportionately to the number of ontology entities found at that distance from the root superclass. By default, we distort the width of each ontology section by the percentage of entities within it compared to the total number of entities of the ontology. As some ontology sections have a significantly smaller percentage of entities, they can sometimes be adversely affected by this distortion technique. To address this, we have included an interaction which allows us to adjust the scaling from its default state into a fish-eye distortion concentrated on our selected section, as seen in Figure 11.
Additionally, we have supplied a magic lens tool that appears when we click the checkbox labeled ‘lens’ in the subview [54]. With this overlaid magic lens, we can scan the magic lens over specific ontology sections to reveal more information of the ontology structure. There are two types of information available, as seen in Figure 12. First, by selecting the levels radio button, users will be presented with exact level depth, including the total number of entities within each level. The second available magic lens choice is landmarks, which annotates the important ontology entities from the sections, as determined by the entities with the most relations assigned to them within the ontology.
When we select a section header, a specific level bar, or an ontology entity annotated within a section, a red border is placed around it to support wayfinding activities. Then, all relevant subviews within the tool adjust to match the selected position within the ontology.

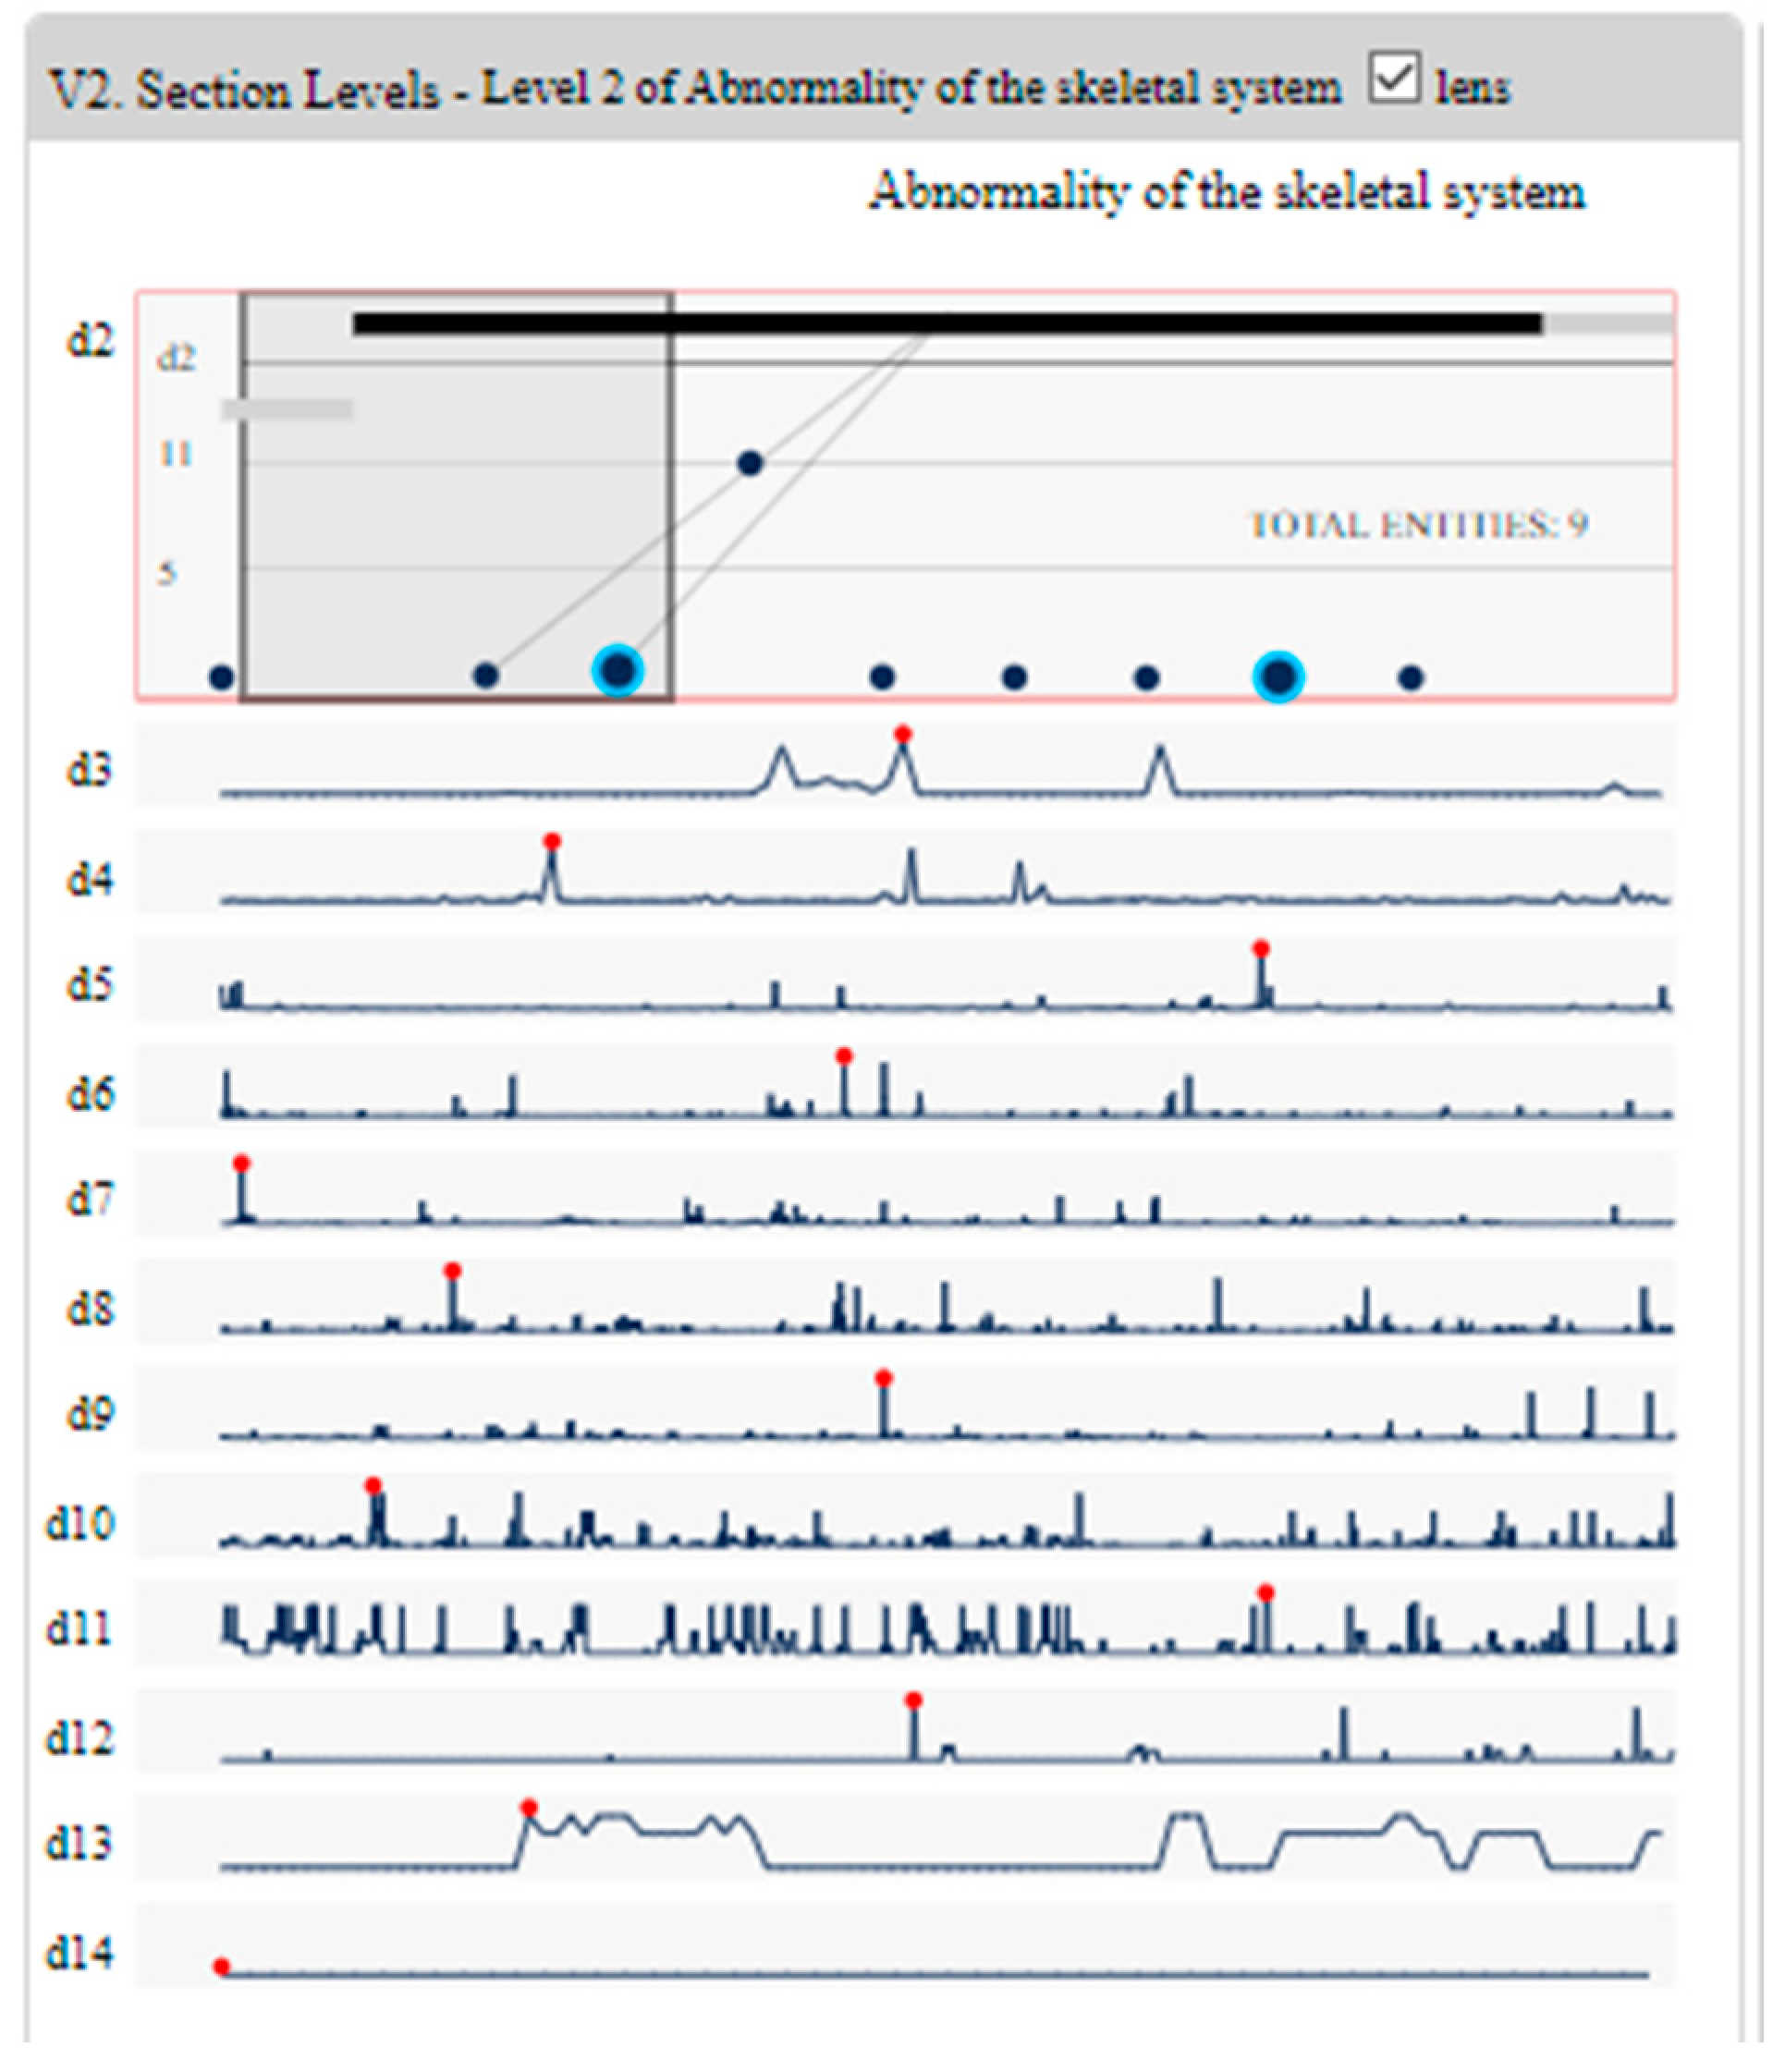
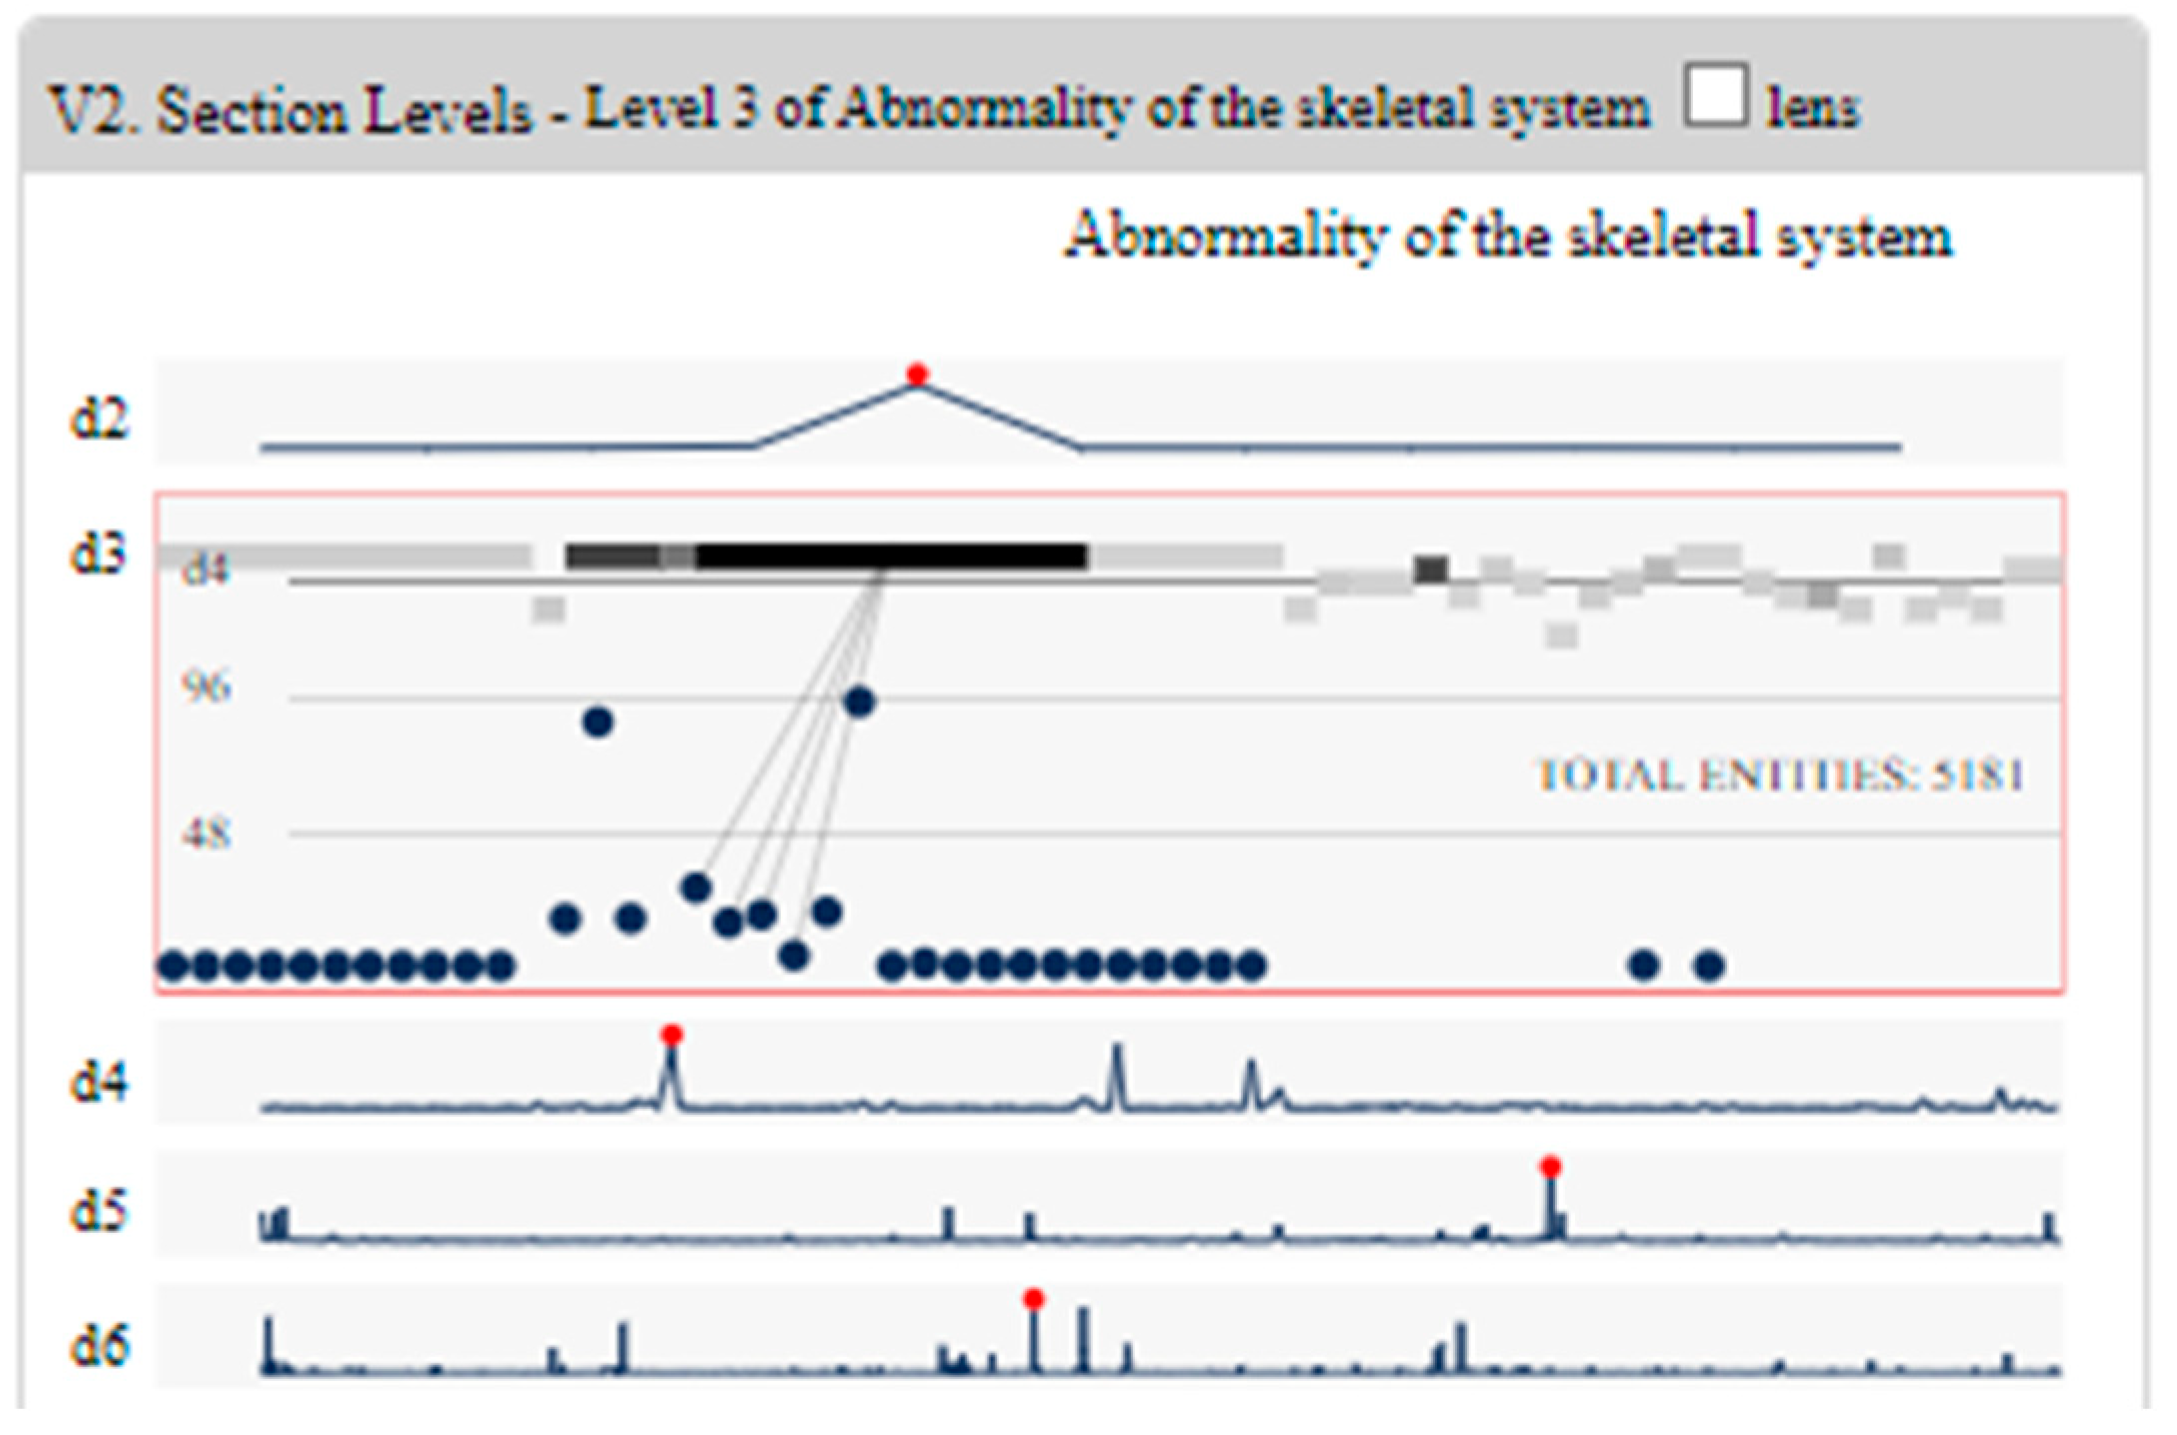
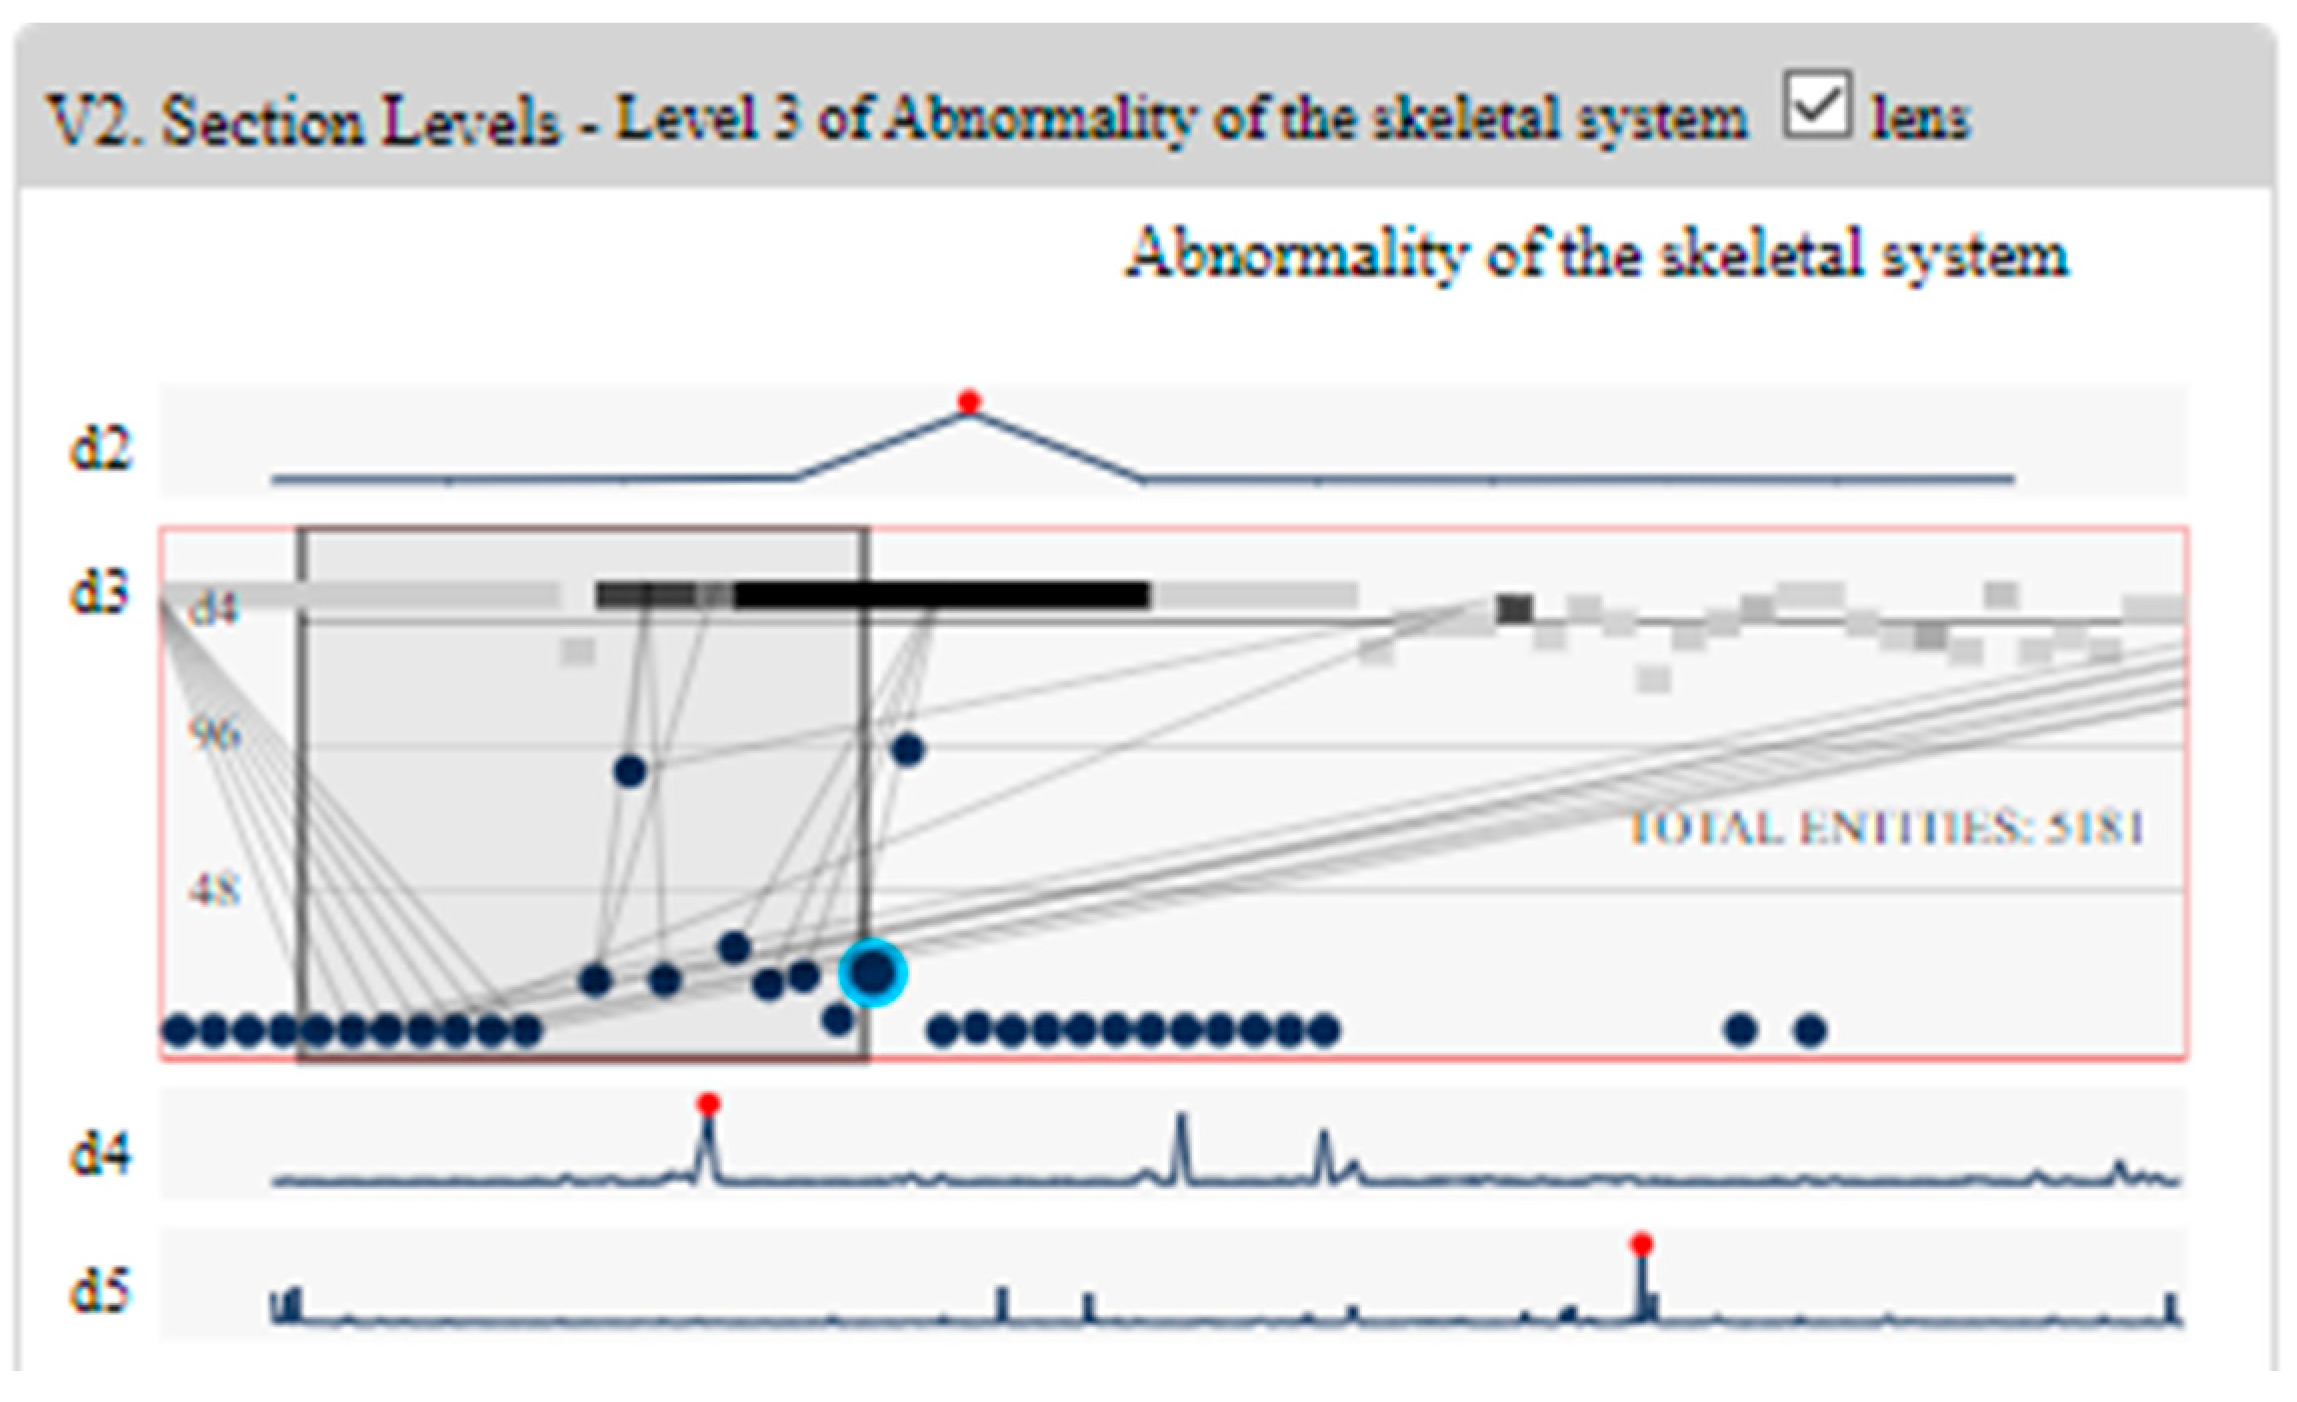
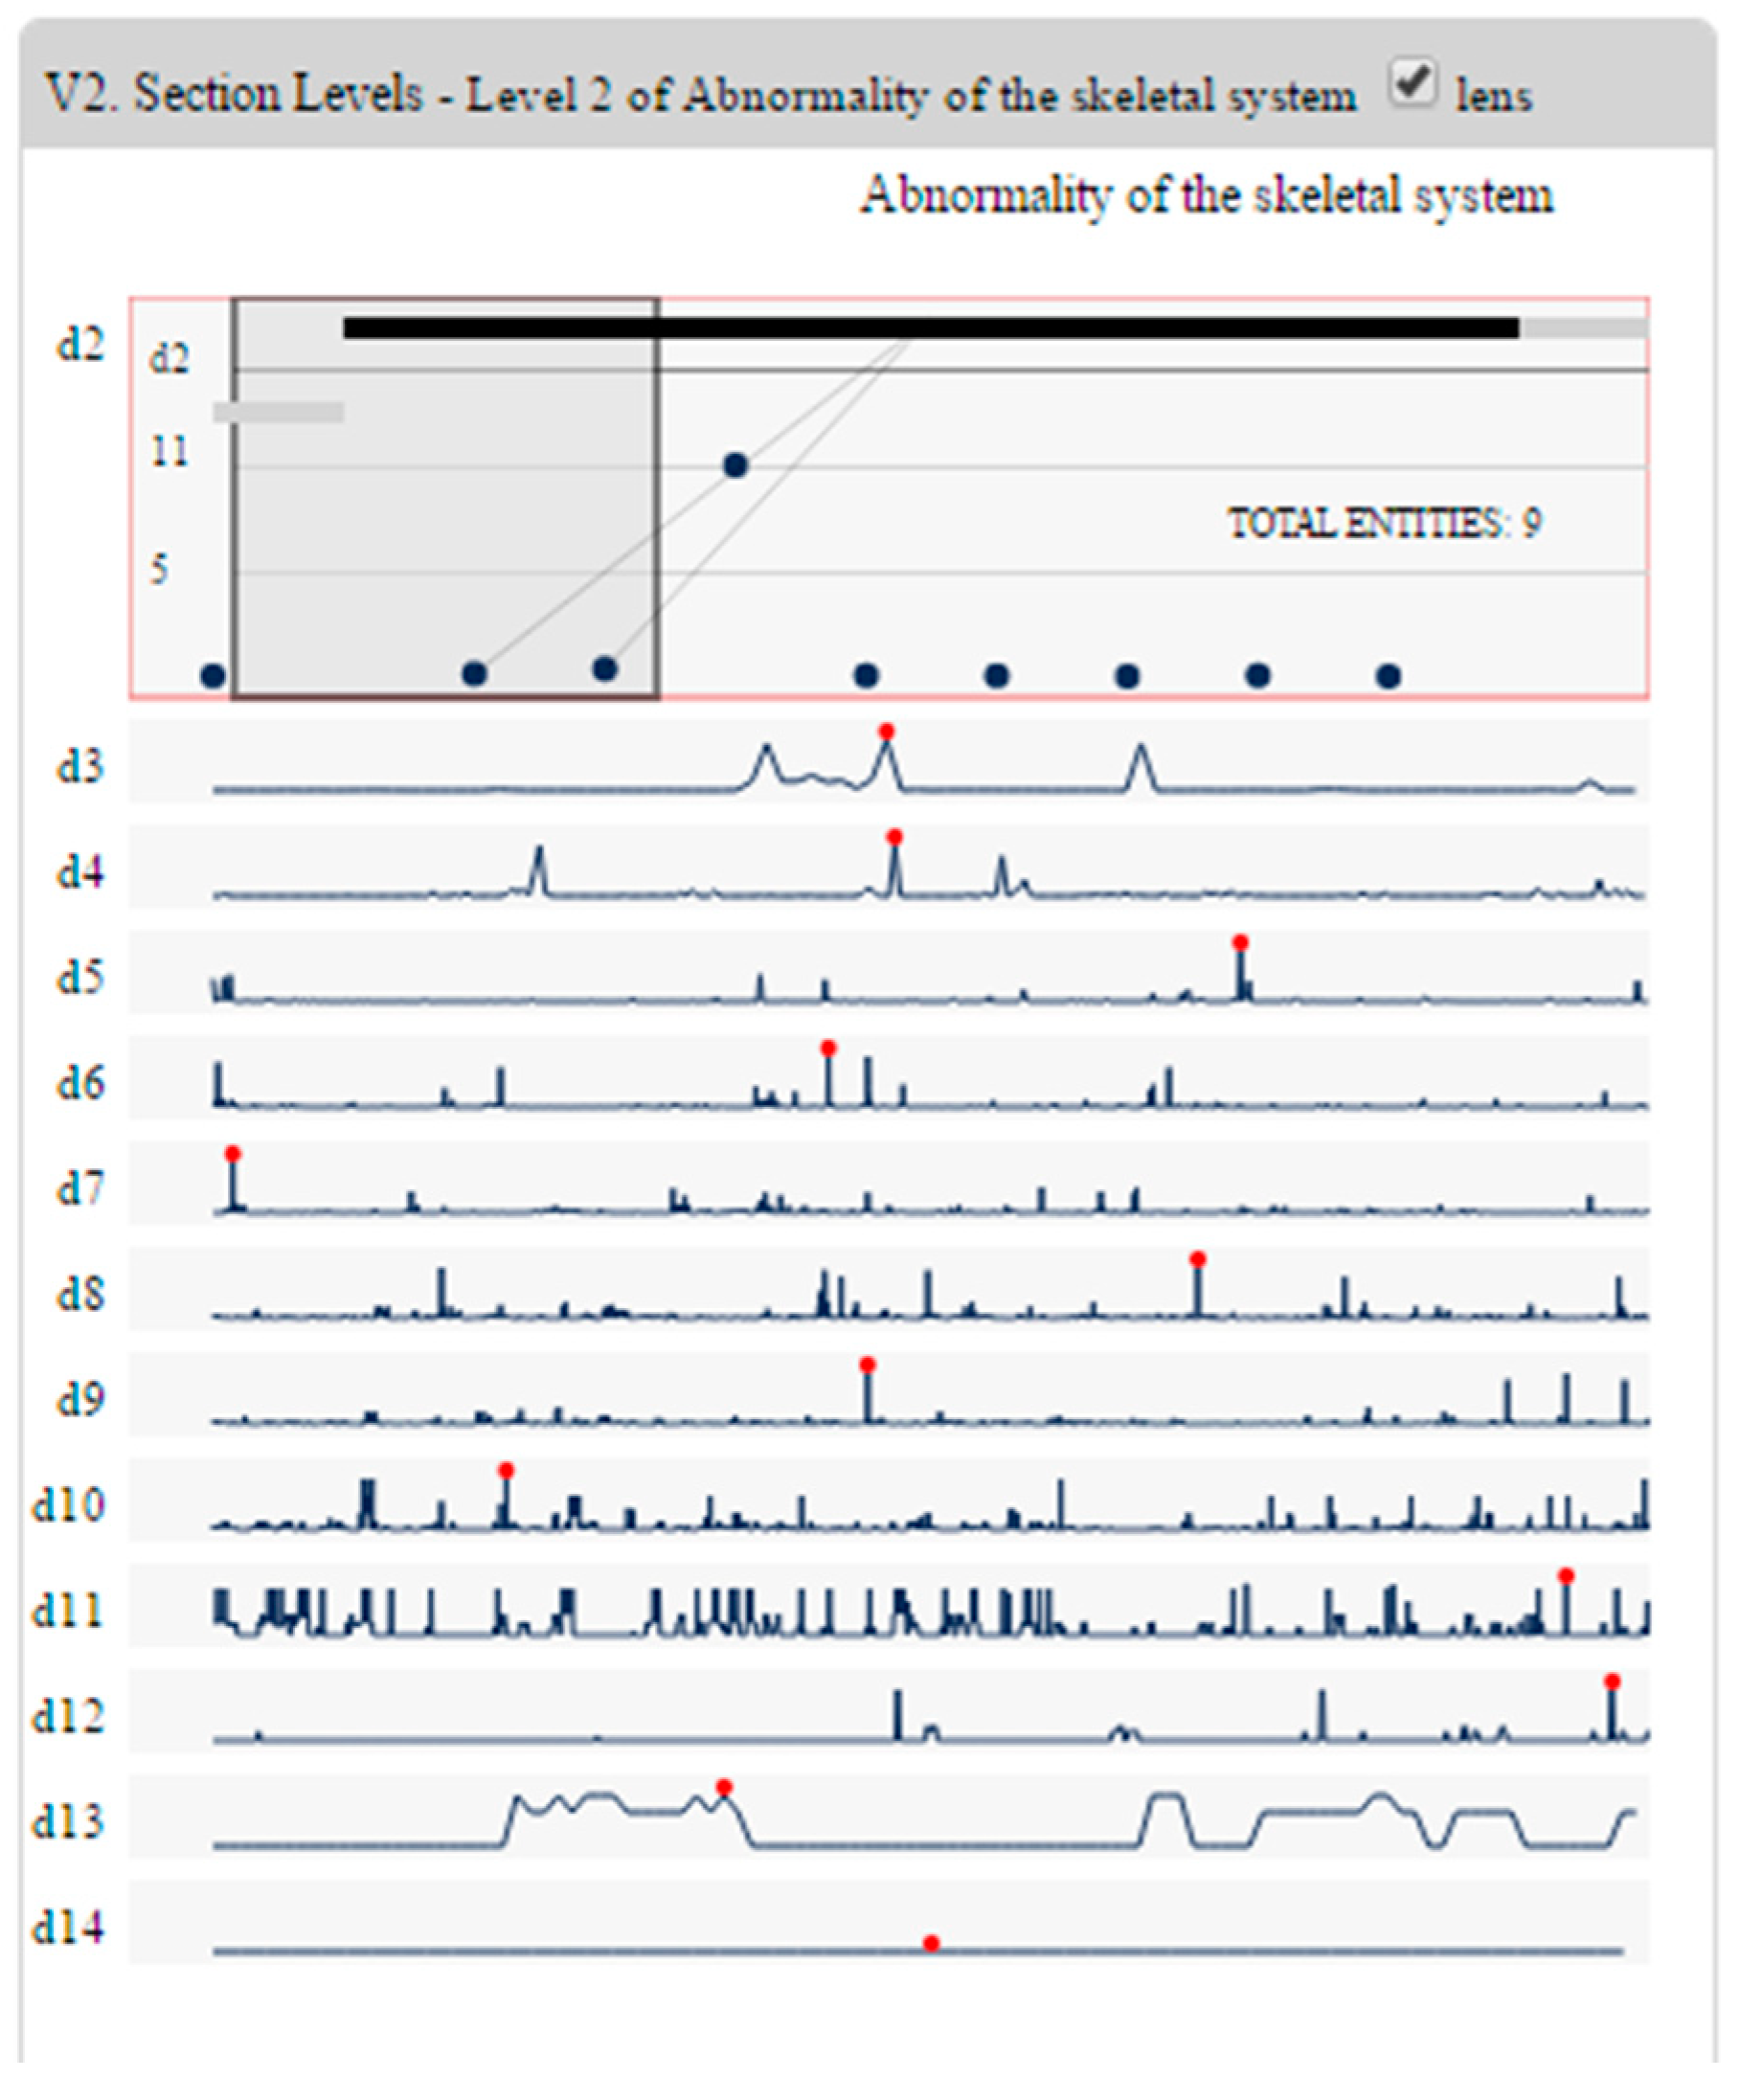
4.2.3. Section Levels Panel

The Section Levels Panel, which is found directly to the right of the Search and Pinning Panel, and below the Ontology Sections Panel, provides a ‘context’ subview depicting the levels of a selected ontology section produced by ontology relations, and the entities contained within them. We have designed this to provide us with the ability to inspect ontology entities and their shared relations within the scope of a section level to promote activities which use and develop landmark and route knowledge.
The Section Levels Panel depicts a list of levels ordered by their depth from the root entity, where an ontology level is the set of entities which share the same distance from the root ontology entity of a section. Each level has a line plot representing a summary distribution of the ontology entities within that level, as well as a red circle plotting the entity which is calculated to be the most linked ontology entity in that level. This metric of importance is calculated as the entity which maintains the highest total number of entities which are descendants through inheritance relations. These levels can be seen in Figure 13.
When we select a level, it expands to show a connected entities chart, allowing us to inspect ontology entities and their shared ontology relations. We are also provided with a count of the number of entities contained within the level. These ontology entities are positioned vertically based on the number of entities that inherit from it and distributed horizontally with others within the level which share the same immediate inheritance. Plotted in the graph as circles, these supply a series of useful interactions, as depicted and described in Figure 14.
An expanded level presents a plot graph above the entity chart with rectangles representing the ontology entities that share relations to the ontology entities within the current level, also seen in Figure 14. A line axis representing specific level’s depth intersects the approximate middle of vertical range of the rectangular plot graph. Furthermore, to represent the effect of similar inheritance within the level, the width of each rectangle is scaled to reflect the number of entities which inherited from it, larger widths representing more inheritances. These representations and interactions provide many encounters with information describing the ontological space and can help the performance of the cognitive activities which promote spatial knowledge for cognitive map formation. For instance, we can use this to determine the impact an entity has on the current level by moving our cursor over a rectangle, which will annotate a blue border around the ontology entities which share an ontology relation, as well as text labels.
Finally, we have developed a magic lens tool within the subview [54]. When we click the checkbox labeled ‘lens’ in the subview header, we can expose more information by scanning the magic lens over a specific range of the level, as depicted in Figure 15. This magic lens also keeps its scope when using zooming and panning interactions.

4.2.4. Level Landmark Entities Panel

The Level Landmark Entities Panel, which is directly to the right of the Section Levels Panel and below the Ontology Sections Panel, provides a ‘context’ subview which allows us to inspect the connectivity between the ontology entities at a specific level of the ontology. The Level Landmark Entities Panel maintains representations and interactions which are particularly useful for ontology levels of significant connectivity, as it can be challenging to navigate through levels which possess large numbers of ontology entities and relations. By supplying an ordered perspective into the connectivity of a level, we can more effectively direct our cognitive activities as we move through our learning task.
The Level Landmark Entities Panel will generate a triangular matrix collecting the 13 most important entities within the level, where the metric of importance is calculated as the total number of entities which are descendants through inheritance relations. When we pin ontology entities, they will be included within the matrix. The Level Landmark Entities Panel also includes a representation maintaining a node-link graph and two text areas which helps us build associations between ontology entities. When we interact with a matrix position, the node-link graph and text areas update to visually represent the inheritance tree between the ontology entities of that matrix position up to their nearest common parent. These representations are depicted and described in Figure 16.
When we select a specific ontology entity or set of entities within the Level Landmark Entities Panel, this will tell the tool to use them as the initial position or positions in the Entity Network Panel, the Path Explorer Panel, and the Entity Details Panel.

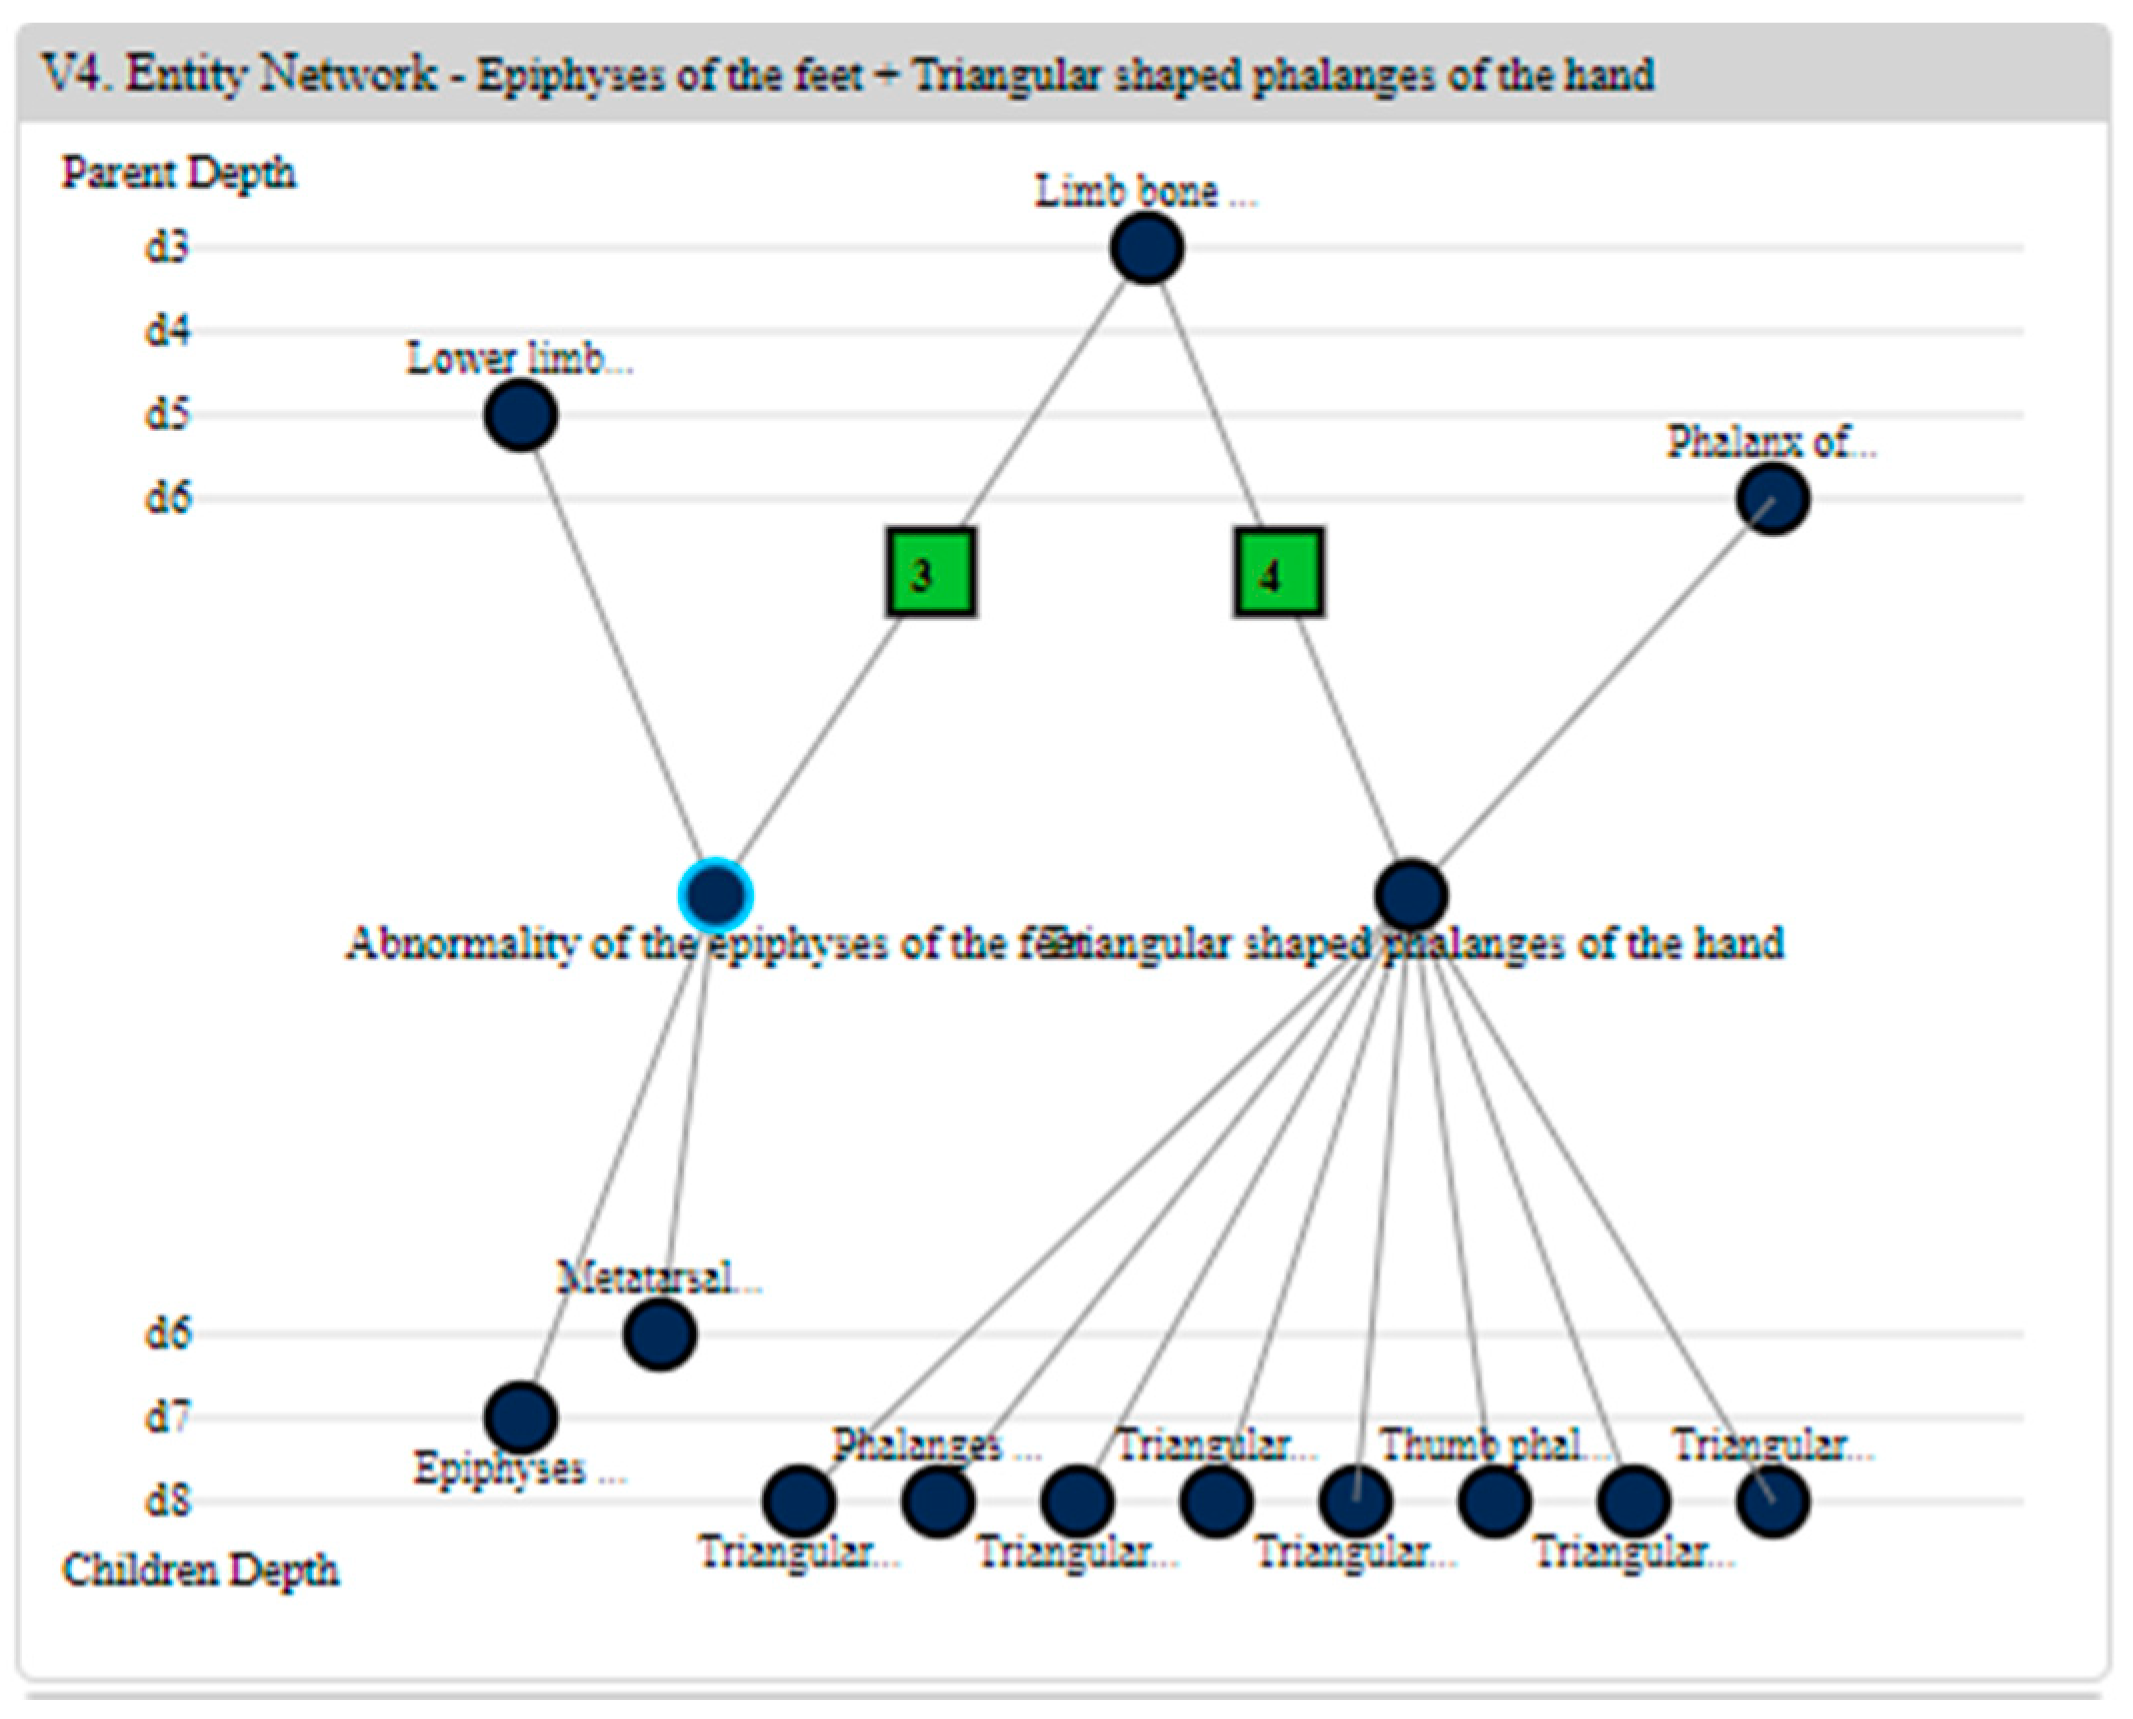
4.2.5. Entity Network Panel

The Entity Network Panel is found directly to the right of the Ontology Sections Panel and above the Path Explorer Panel. This panel provides a ‘context’ subview that allows us to interact with a representation of a network of ontology entities and their relations as we perform our cognitive activities within the space.
The Entity Network Panel maintains three regions: the selected ontologies at the center position, their parents above, and their children below. When the Entity Network Panel is initialized from the Section Levels Panel, a single selected ontology entity is represented as a circle. When the Entity Network Panel is initialized from the Level Landmark Entities Panel, the two ontology entities from that selection are depicted. In either case, all ontology entities are represented by a circle with text label. In these regions, links are depicted between ontology entities reflecting inheritance relations. When two ontology entities are represented, it also represents their lowest common parent. These regions can be seen in Figure 17.
The Entity Network Panel supplies a movement interaction which, when an ontology entity is selected, that ontology entity becomes the new position. This interaction will also adjust positions of the Path Explorer Panel and Entity Details Panel.

4.2.6. Path Explorer Panel

The Path Explorer Panel, which is directly below the Entity Network Panel, provides a ‘context’ subview that allows us to examine the full set of inheritance relations from the root of the ontology section and down to the selected position. These sets of representations and interactions fully expose the low-level structure of the ontological space, and can promote the final, more granular, stages of cognitive map formation.
The Path Explorer Panel represents the set of ontology levels traversed when navigating the inheritance path of the current entity, and in each, the full set of sibling ontology entities. Ontology entities which share a relation to the current position are represented in the bottom as rectangles, where their width and color represents the number of ontology entities that are their children. This color fill ranges from white to red, where red is the highest number of inheritances within the level. When an ontology entity is never inherited, it is a leaf of the ontology structure. For these, their height is slightly increased to promote visibility and are given a purple fill. Ontology entities which are within inheritance lineage of the selected ontology entity have a slightly increased height to improve the visibility of the inheritance path. Links are provided between ontology entities to reflect their connectivity throughout the inheritance path. These design considerations can be seen in Figure 18.
The Path Explorer Panel has an interaction which, when an ontology entity is selected, that ontology entity becomes the new position. This interaction also adjusts the positioning of the Entity Network Panel and Entity Details Panel.

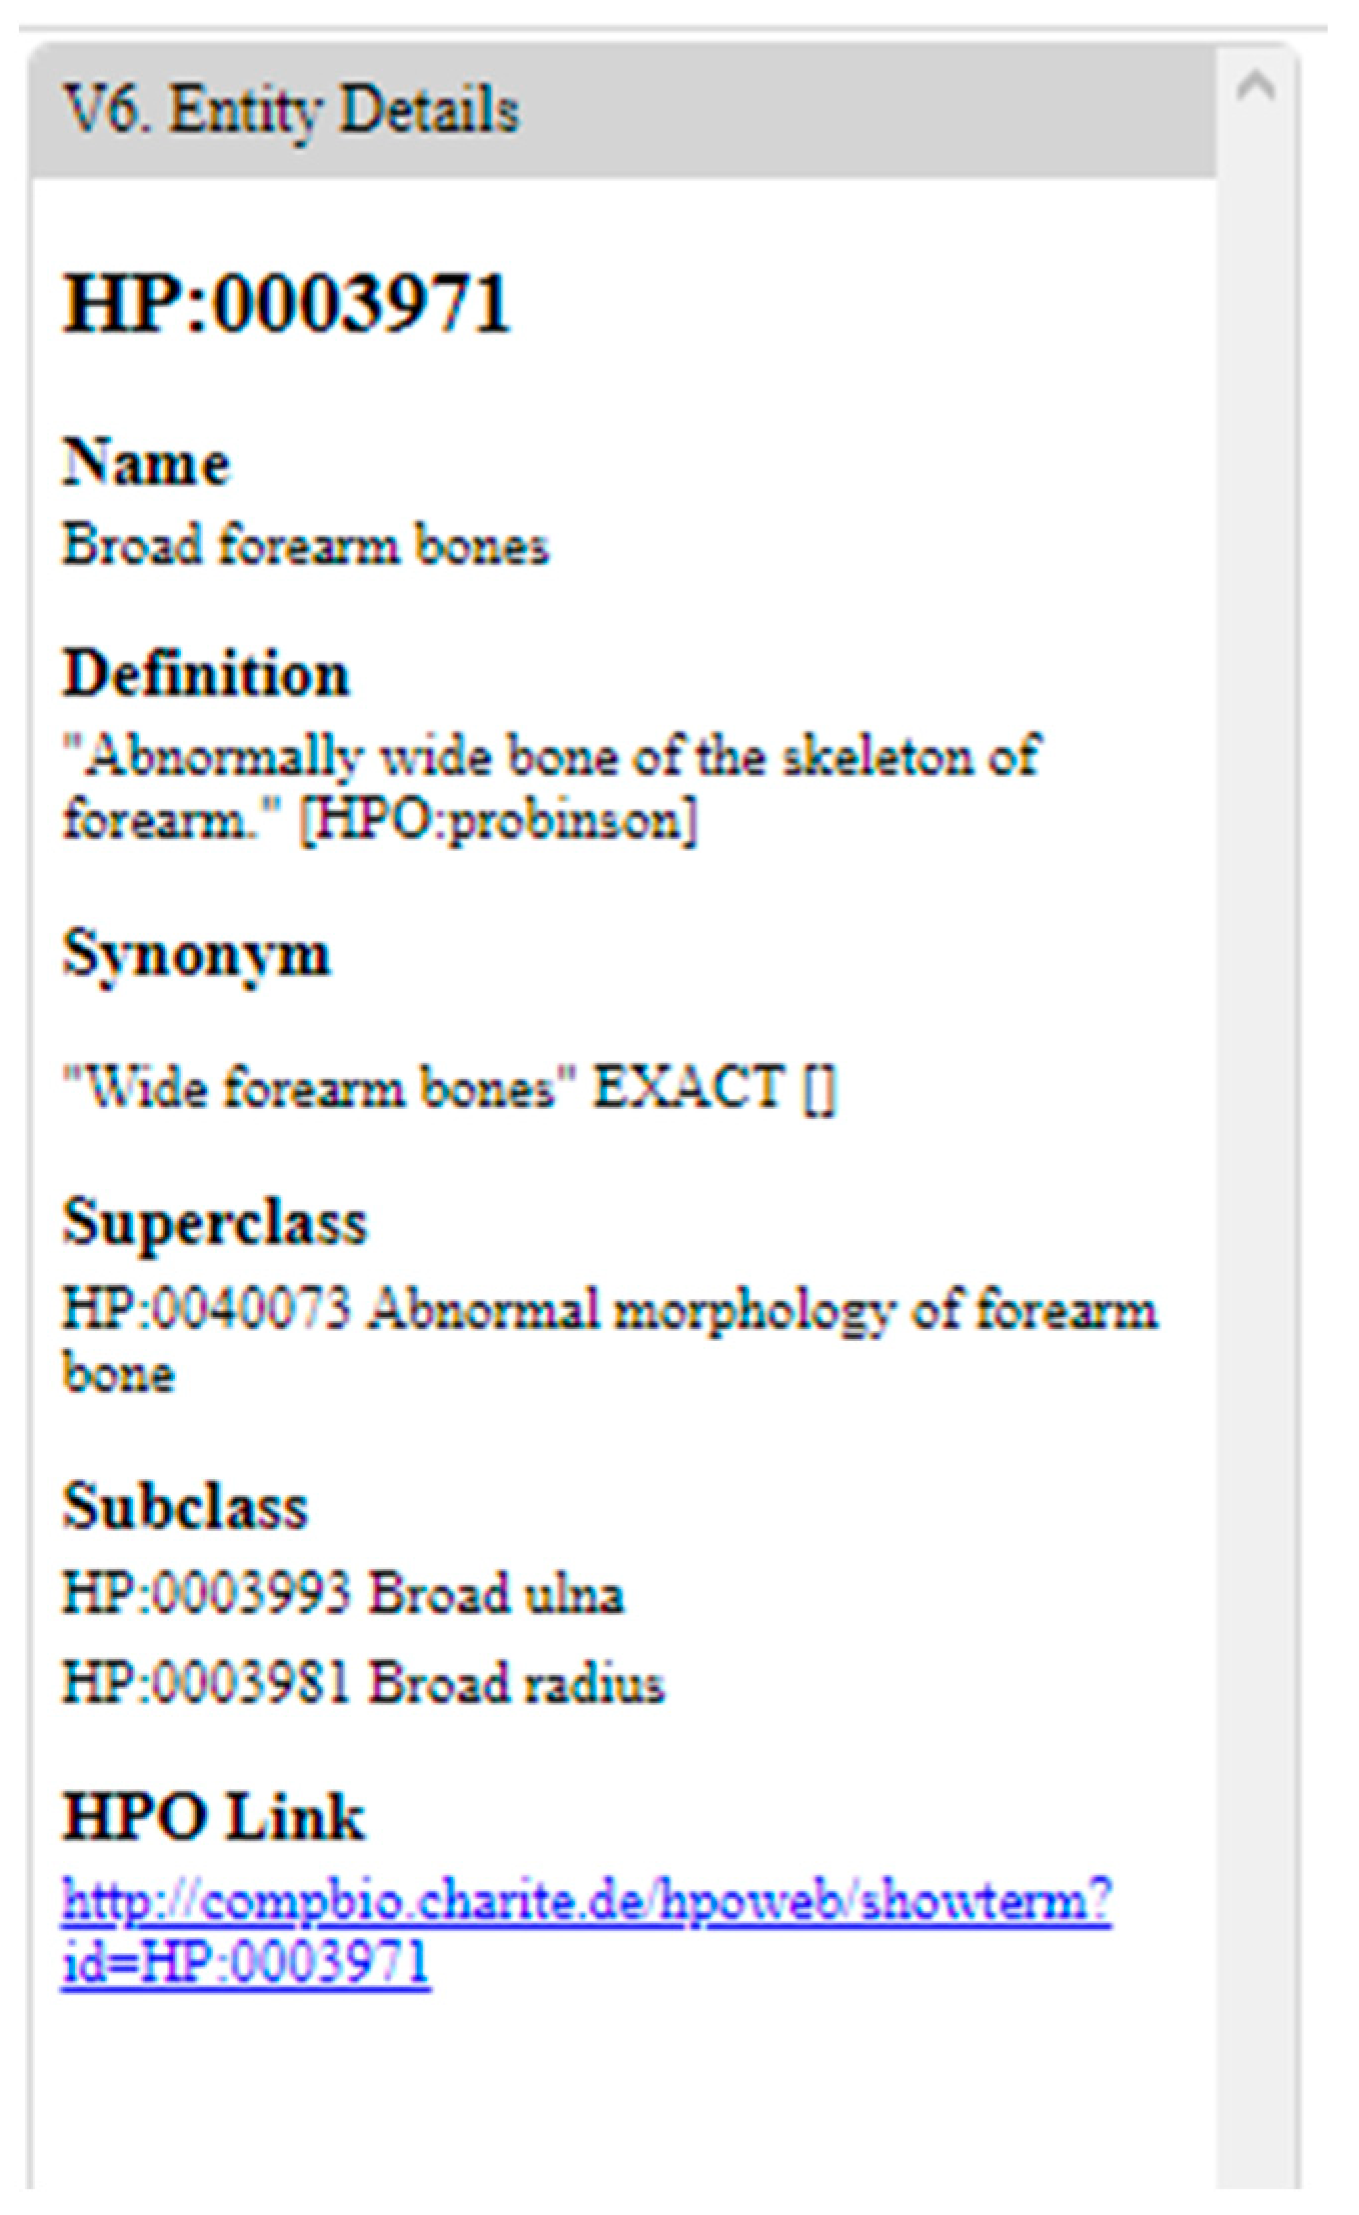
4.2.7. Entity Details Panel

The Entity Details Panel, which is to the far right of the system, presents a ‘details’ subview which depicts the information of an ontology entity in the form of a standard listing. This listing is based on the specification of the ontology, although will typically reflect information like Index, Name, Definition, Synonym, Superclass, Subclass, and External Link.
Each of the Synonym, Superclass, Subclass, and Link listings within the Entity Details Panel provide two interactions. The first interaction, provided by Synonym, Superclass, and Subclass, allows us to select an ontology entity represented in text, which will show it as the new position in the Entity Details Panel, Entity Network Panel, and the Path Explorer Panel. The second interaction, if supported by the ontology specification, allows users to leave PRONTOVISE and inspect the ontology creator’s official documentation on the web.

5. Usage Scenario

In this section, we will describe a usage scenario which demonstrates how PRONTOVISE can support the stages of cognitive map formation of an ontology. For an expanded demonstration of PRONTOVISE, we also provide a demonstration video “Visual Demonstration of PRONTOVISE” in the Supplementary Materials.
Domain expertise can be assessed as a spectrum of knowledge, ranging from a member of the general public with no expertise, up to domain expert such as a geneticist, doctor, or medical researcher. We will collapse this range into two general user types—the ‘non-expert’ and the ‘expert’. A scenario will be presented to demonstrate their ability to begin, or in the case of the ‘expert’, build upon, their cognitive map of an ontology.
For purposes of demonstration, the Human Phenotype Ontology (HPO) will act as the ontology dataset of choice within this usage scenario and shared demonstration materials. HPO has been selected because of its high complexity resulting from its exhaustive and expert-defined domain coverage. HPO is a controlled and standardized vocabulary reflecting the human disease and phenotypic abnormality domain, and includes associated annotations in the domains of bioinformatics, biochemistry, and human genetics. HPO is an active ontology, consisting of over 11,000 ontology entities, as well as over 110,000 disease annotations [55]. For instance, HPO maintains an ontology entity for Blindness, which possesses a superclass of Visual Impairment, a subclass of Congenital Blindness, and is annotated to be associated with a variety of diseases, such as a variant of colorblindness defined as Achromatopsia 2 [56]. Each HPO ontology entity and relation is accompanied by attributes such as names, definitions, ontology indexing, synonyms, class relationships, logical definitions, and domain expert commentary, to name a few. For additional details on the Human Phenotype Ontology, see [57,58].
PRONTOVISE allows users to upload valid RDF OWL file types, such as the ones produced by Stanford University’s Protégé Editor and Cognitum’s Fluent Editor. For this usage scenario, we will be using the Human Phenotype Ontology (HPO) as our selected ontology dataset describing an unfamiliar ontology. We will begin these usage scenarios with the tool in its initial state, as seen in Figure 19.
In our usage scenario, we take on the role of a user who has no prior experience with HPO. This means that we have not developed any level of understanding towards the ontology. Our initial interactions will require the tool to support our cognitive map formation through encounters with the ontological entities and relations to promote the early stages of landmark, route, and survey knowledge.
In the Ontology Sections Panel subview, we see an overview of the ontology structure. From Figure 20, we see that each of the sections of HPO are headed by a root ontology entity. To begin, we would like to examine the various top ontology entities, so that we can become aware of the entities of HPO which could act as initial landmarks.
During encounters within the Ontology Sections Panel, we can begin to develop initial survey knowledge towards the structure of HPO. For example, we see that there are quite a few sections in HPO. We also see that the sections represented by ontology entities like “Abnormality of the Skeletal System” and “Abnormality of Limbs” consume significantly larger portions of HPO. Notably, there are a few sections with very small visual spaces. Additionally, we see the general shapes of each section, suggesting the potential ontology entities and relations which form its structure. Some sections like “Skeletal System” have very extended paths, going up to 14 levels away from the top entity acting as our landmark for the section, while other sections expand out only five steps away. We further inspect the smaller sections like the section headed by the “Abnormality of the Musculature” by holding the Shift key while directing our mouse over a section, as seen in Figure 21. Releasing the Shift key will end the interaction event and lock in the sizing adjustments.
We inspect the contents of each section. PRONTOVISE provides us with information regarding the number of ontology entities and ontological distance of each level relative to the entity acting as a landmark for that section. Additionally, when we select the checkbox labeled ‘lens’ in the subview header, a magic lens is added to our mouse, allowing us to rapidly scan each section. This reveals structural information of the ontology and previews the potential information in that section which could support the building of route knowledge. Figure 22 shows a magic lens activation on the “Abnormality of Limbs” ontology section, depicting the depths and the number of individual ontology entities within each level.
We also select a second available magic lens choice labeled “landmarks”, which changes the functionality of the scanning lens to preview the potential landmark knowledge available in that section. Figure 23 depicts our interaction where the magic lens is placed over the “Abnormality of Limbs” ontology section, encoding the most prominent ontology entities which we can use as our landmarks for each level.
As we select a section header, a specific level bar, or an annotated entity within a section, the subview updates to represent the confirmation of this interaction, as well as signal other subviews to change their positions to match. As seen in Figure 24, we further our exploration of HPO within the “Abnormality of the Skeletal System” section by selecting for deeper inspection.
We now move to the Sections Levels Panel subview, directly below the Ontology Sections Panel subview, which magnifies the levels of the selected ontology section and the ontology entities contained within it. We begin our inspection of the various levels of this ontology section, seeing the number of ontology entities in each level. This provides us the potential to build route knowledge of the ontology entities we have encountered and used as landmarks. Figure 25 shows the initial state of the Sections Level Panel subview. We see that there are 14 levels within the section and that there are 9 ontology entities in the second level of the section. We also see a more detailed representation of the contents of each level, where levels like depth 11 (d11) carry a significant number of ontology entities, while others carry less.
We are interested in d13, so we select that level for inspection. In response, PRONTOVISE has expanded the subview to display the ontology entity and relations of the 13th level of the section. Here, the connected parentage and landmark chart supplies many opportunities for insight. Using mouse over and click interactions, we interact with the different ontology entities in the level. This allows us to form associations between ontology entities, preview an overview of the ontology relations between its ontology entities, as well as signal other subviews to preview our target ontology entity. As seen in Figure 26, then we select the “Duplication of Phalanx of 3rd Finger” found in the 9th level of the section to see what ontology entities in this level have inherited from it. We also use the magic lens that shows ontology relations between ontology entities to promote route and survey knowledge, shown in Figure 27.
We select the 3rd level of the ontology section for deeper inspection. We direct our attention to the Level Landmark Entities Panel subview, found to the right of the Section Levels Panel subview. The Level Landmark Entities Panel subview allows us to inspect the ontology relations between the major ontology entities contained within the chosen level. As depicted in Figure 28, we begin to encounter the ontological space in increasingly lower levels of visual abstraction. We see individual ontology entities with numerical values describing the ontological distance between each of the ontology entities of the level. We select the meeting point between “Abnormal Appendicular Skeleton Morphology” and “Abnormal Bone Structure”, highlighting that those ontology entities have a two-step separation. Additionally, we see that this choice has provided a description of the matching ontology entities, as well as a line demonstrating the full network of ontology relations. We see that their distance separation of 2 is because they each inherit from a shared parent, that of “Abnormality of Skeletal Morphology”. We also investigate a different pair of ontology entities, “Abnormal Joint Morphology” and “Epiphyseal Stippling” and see those ontology entities sharing a more distant relationship, as depicted in Figure 29.
So far, PRONTOVISE has presented us encounters with ontology entities, providing us opportunities to build our landmark knowledge, make associations between our landmarks helping the development of route knowledge, and combining for initial survey knowledge of the structure of HPO. We now want to begin comparing specific ontology entities and relations in the context of the full HPO system. Therefore, we direct our interest towards the Entity Network Panel subview, positioned to the right of the previously encountered subviews. The Entity Network Panel subview allows us to inspect the low-level abstractions of specific ontology entities within the system, gathering insight towards exact entity positioning for parent and child ontology entities and the shared ontology relations which reflect ontology structure. We select “Abnormal Appendicular Skeleton Morphology” in a prior subview, generating that entity as the target of the Entity Network Panel subview, as seen in Figure 30.
We see that the chosen “Abnormal Appendicular Skeleton Morphology” entity directly inherits from a single ontology entity and is inherited from four other ontology entities on various ontology section levels. We then select two entities for the entity network within the prior Level Landmark Entities Panel subview, and the two ontology entities are used as positions side-by-side, as depicted in Figure 31.
Notably, our interactions with the Entity Network Panel subview have updated the Path Explorer Panel subview. If the ontological distance between ontology entities is larger than one step, the Entity Network Panel subview shows us a simplified encoding of that extended routing. The Path Explorer Panel subview allows us to explore the complete ontology structure and content along a full inheritance path originating from the ontology section root all the way to the current position. We see that whenever we interact with the current entity, this subview will depict the full ontology from that entity relative up to the top level. This can be seen in Figure 32, when we chose “Abnormal Appendicular Skeleton Morphology” as our ontology entity of interest. Just like in the earlier subview, we interact with each part of the subview to inspect, compare, and navigate through each to generate new encounters which promote cognitive map formation.
PRONTOVISE provides us with three support subviews that can extend our ability to generate encounters. The first two of these exist within the Search and Pinning Panel subview, Search and Pinning, respectively, and the third is the Entity Details Panel subview.
After using PRONTOVISE, we have developed some level of understanding towards HPO. The search functionality found with the Search and Pinning Panel subview allows us to use a text-based search bar to specifically target ontology entities with the assistance of suggestions from a type-ahead. Based on our experiences so far, we are interested to see if there are any other “skeleton”-related entities existing in HPO outside of the section we have already encountered. We type in the search bar, as seen in Figure 33. We see that many relate to “skeleton”, the Ontology Sections Panel, which has updated in response to the search query, suggesting that there are indeed some outside of the “Skeletal System” section that relate to “skeleton”.
We record our interest in a new ontology entity, “Broad Forearm Bones”, by pinning it within PRONTOVISE. Clicking the “Pin” button, the ontology entity is added to the Pinning Panel, which we access by selecting the tab in the subview, as seen in Figure 34. The ontology entity has received a permanent point of reference within the tool and has been assigned a unique color which will be used whenever we encounter it within the tool.
After we select the “Broad Forearm Bones” ontology entity during our interaction with PRONTOVISE, a third and final support subview, the Entity Details Panel subview, becomes active. At this subview, we are presented with the full set of HPO information for our ontology entity. In Figure 35, we see that the subview supplies us the following ontology details for a specific entity: HPO Index Number, Name, Definition, Synonym, Superclass, Subclass, and HPO Link.

6. Discussion and Conclusions

In this paper, we began with an introduction of the topics of cognitive maps, ontologies, and interactive visualization tools. It was found that various research at varying levels of granularity across a wide range of theoretical and experimental disciplines has been directed towards understanding the functionality of our cognitive processes and the effect they have on the performance of our cognitive activities. The theoretical framework of the cognitive map and its formation process was introduced, which leads current understanding towards how our brains organized knowledge of complex spaces. Then, an introduction to the use, creation, and limitations of ontologies was presented. This section described that ontologies are an expert-defined standardized common vocabulary describing the knowledge of a domain. The introductory content concluded with an examination of the fields of information visualization and visual analytics, discussing how designers can create visualization tools using visual representation and interaction design to support our performance of cognitive activities.
Next, we examined existing work on cognitive load and the use of interactive visualizations to support learning tasks. Here, it was found that recent studies have established that for supporting learning tasks, there is no one specific level of cognitive load that is appropriate. Instead, cognitive load should be understood as a set of extraneous, intrinsic, and germane loads which adjust for the specific conditions of the tool and task context. It was found that interactive visualization tools are a valuable resource for complex learning, as studies have found that if designed correctly, they can provide an effective environment for engaging learners with the types of information encodings which best align with the needs for learning tasks. The examination of existing work concluded with an exploration of leading insight towards the design of visual representations and interactions to support cognitive mapping of spatial knowledge, alongside a summary of the cognitive activities performed within spaces. From these findings, we formalized a set of high-level design criteria for designing interactive visualization tools which support learning tasks through alignment with the cognitive map framework and its formation process. A review was performed on existing tools which visualize ontology datasets. This review categorized each tool based on generalized subview components and, for each, analyzed their strengths and weaknesses towards supporting the conditions for cognitive map formation.
Following this, we presented PRONTOVISE (PRogressive ONTOlogy VISualization Explorer), an interactive visualization tool which applied the criteria in its design to support us in understanding unfamiliar ontologies. In this, we explained the technological features of the PRONTOVISE, and described its workflow and design within the context of our high-level design criteria. PRONTOVISE was described as an interactive visualization tool that represents ontology datasets using a combination ‘List+Overview+Context+Details’ design. The presentation continued with a detailed description of the considerations made when designing each of the subviews of PRONTOVISE to satisfy the established high-level criteria. Through a usage scenario which describes an initial set of encounters with the Human Phenotype Ontology (HPO), we demonstrated how the design of PRONTOVISE uses novel ontology dataset visual representations and interactions to provide us valuable encounters which support the requirements for cognitive map formation.
From our investigation of related work and existing tools, as well as through our description and usage scenario of the PRONTOVISE design, several implications arise. We find that there is value in design criteria which generalize a set of high-level requirements yet refrain from specifying the exceedingly granular patterns and processes which are often associated with low-level design frameworks. Through this higher level, we were able to see that many fashions of interactive visualization tools were possible, each providing us encounters with visual representations and interactions at various levels of novelty within their design. We believe a strength within the design of PRONTOVISE fully encompasses the strengths presented within the spread of existing designs, while having the opportunity to appropriately assess and address the weaknesses present in preceding work. We also believe that using the design criteria, PRONTOVISE provides the support for any ontology dataset learning task, as it provides a stable, iterative, and scalable design which supports use for any appropriately encoded domain, and for use by any level of expertise.
Yet, from our work on the design and PRONTOVISE, we also find limitations. First, we acknowledge the limited scope of evaluation within the paper. It is our intention to explore expanded evaluations of the design within future work. Next, we found that a number of subviews were needed to fulfill the requirements of the design criteria. As a result, we find that PRONTOVISE requires a significant amount of display space, such that it would not be able to facilitate the same level of quality towards the performance of learning tasks within a reduced display space. This means that the current design of PRONTOVISE is not practical for small screens like notepad laptops or mobile devices. A target for future work may then be to investigate this problem space for small screens. Another limitation with PRONTOVISE is that it takes full advantage visualization technologies to produce its many novel visual representations and interactions within its subviews and thus demands an attunement period before it can be used optimally. This aspect of design, that of attunement, may also be a valuable topic of interest for future research. Finally, PRONTOVISE currently supports the OWL RDF ontology dataset format, however, there are many formats available. PRONTOVISE would be improved by expanding its support to all formats which are used to digitally encode ontologies.
In conclusion, we hope that insight gathered from this paper inspires innovative research and provides valuable guidance in the design of future work which visualizes ontologies for learning tasks. We hope to continue exploring this problem space, including but not limited to a deeper inspection of PRONTOVISE through an expanded usability study and further investigation towards the design of interactive visualization tools that support the performance of other challenging knowledge-based tasks.

Supplementary Materials

The following are available online at https://www.mdpi.com/2414-4088/5/1/2/s1, Video S1: Visual Demonstration of PRONTOVISE.

Author Contributions

Conceptualization, J.D. and K.S.; methodology, J.D. and K.S.; software, J.D.; validation, J.D. and K.S.; formal analysis, J.D. and K.S.; investigation, J.D. and K.S.; resources, Insight Lab, J.D. and K.S.; data curation, J.D.; writing—original draft preparation, J.D.; writing—review and editing, J.D. and K.S.; visualization, J.D.; supervision, K.S.; project administration, J.D.; funding acquisition, K.S. All authors have read and agreed to the published version of the manuscript.

Funding

We acknowledge the support of the Natural Sciences and Engineering Research Council of Canada (NSERC).
Mti 05 00002 i001

Data Availability Statement

No new data were created or analyzed in this study. Data sharing is not applicable to this article.

Acknowledgments

We would like to acknowledge NSERC and its support of our research. We would also like to thank all authors and publishers who have allowed us to use images of their tools.

Conflicts of Interest

The authors declare no conflict of interest.

References

  1. Rector, A.; Schulz, S.; Rodrigues, J.M.; Chute, C.G.; Solbrig, H. On beyond Gruber: “Ontologies” in today’s biomedical information systems and the limits of OWL. J. Biomed. Inform. X 2019, 2, 100002. [Google Scholar] [CrossRef]
  2. Priya, M.; Kumar, C.A. A survey of state of the art of ontology construction and merging using Formal Concept Analysis. Indian J. Sci. Technol. 2015, 8. [Google Scholar] [CrossRef]
  3. Jusoh, S.; Awajan, A.; Obeid, N. The Use of Ontology in Clinical Information Extraction. J. Phys. Conf. Ser. 2020, 1529. [Google Scholar] [CrossRef]
  4. Lytvyn, V.; Dosyn, D.; Vysotska, V.; Hryhorovych, A. Method of Ontology Use in OODA. In Proceedings of the 2020 IEEE Third International Conference on Data Stream Mining & Processing (DSMP), Lviv, Ukraine, 21–25 August 2020; pp. 409–413. [Google Scholar]
  5. Román-Villarán, E.; Pérez-Leon, F.P.; Escobar-Rodriguez, G.A.; Martínez-García, A.; Álvarez-Romero, C.; Parra-Calderóna, C.L. An ontology-based personalized decision support system for use in the complex chronically ill patient. Stud. Health Technol. Inform. 2019, 264, 758–762. [Google Scholar]
  6. Dessimoz, C.; Škunca, N. The Gene Ontology Handbook; Springer Nature Open Access: New York, NY, USA, 2017; Volume 1446, ISBN 978-1-4939-3741-7. [Google Scholar]
  7. Sedig, K.; Parsons, P.; Liang, H.-N.; Morey, J. Supporting Sensemaking of Complex Objects with Visualizations: Visibility and Complementarity of Interactions. Informatics 2016, 3, 20. [Google Scholar] [CrossRef] [Green Version]
  8. Behrens, T.E.J.; Muller, T.H.; Whittington, J.C.R.; Mark, S.; Baram, A.B.; Stachenfeld, K.L.; Kurth-Nelson, Z. What Is a Cognitive Map? Organizing Knowledge for Flexible Behavior. Neuron 2018, 100, 490–509. [Google Scholar] [CrossRef] [Green Version]
  9. Craig, M.; Dewar, M.; Harris, M.A.; Della Sala, S.; Wolbers, T. Wakeful rest promotes the integration of spatial memories into accurate cognitive maps. Hippocampus 2016, 26, 185–193. [Google Scholar] [CrossRef]
  10. Epstein, R.A.; Patai, E.Z.; Julian, J.B.; Spiers, H.J. The cognitive map in humans: Spatial navigation and beyond. Nat. Neurosci. 2017, 20, 1504–1513. [Google Scholar] [CrossRef]
  11. Weisberg, S.M.; Newcombe, N.S. How do (some) people make a cognitive map? Routes, places, and working memory. J. Exp. Psychol. Learn. Mem. Cogn. 2016, 42, 768–785. [Google Scholar] [CrossRef]
  12. Schlegel, D.R.; Elkin, P.L. Ontology Visualization Tools to Assist in Creating and Maintaining Textual Term Definitions. Available online: https://pdfs.semanticscholar.org/3ffb/60e33e8009761b4465dee57c7ef86c4eda22.pdf (accessed on 28 November 2020).
  13. Borland, D.; Christopherson, L.; Schmitt, C. Ontology-Based Interactive Visualization of Patient-Generated Research Questions. Appl. Clin. Inform. 2019, 10, 377–386. [Google Scholar] [CrossRef]
  14. Ekstrom, A.D.; Ranganath, C. Space, time and episodic memory: The Hippocampus is all over the Cognitive Map. Hippocampus 2018, 28, 680–687. [Google Scholar] [CrossRef] [PubMed]
  15. Waller, D.E.; Nadel, L.E. Handbook of Spatial Cognition; American Psychological Association: Washington, DC, USA, 2013; ISBN 978-1-4338-1204-0. [Google Scholar]
  16. Kallioniemi, P.; Hakulinen, J.; Keskinen, T.; Turunen, M.; Heimonen, T.; Pihkala-Posti, L.; Uusi-Mäkelä, M.; Hietala, P.; Okkonen, J.; Raisamo, R.; et al. Evaluating landmark attraction model in collaborative wayfinding in virtual learning environments. PUZZLE Rev. Hisp. la Intel. Compet. 2013, 4, 15–18. [Google Scholar]
  17. Fast, K.V. Human-Information Interaction for Digital Libraries: From Document Repositories to Knowledge Environments. Ph.D. Thesis, University of Western Ontario, London, ON, Canada, 2010. [Google Scholar]
  18. Sedig, K.; Rowhani, S.; Liang, H. Designing interfaces that support formation of cognitive maps of transitional processes: An empirical study. Interact. Comput. 2005, 17, 419–452. [Google Scholar] [CrossRef]
  19. Saleemi, M.M.; Rodríguez, N.D.; Lilius, J.; Porres, I. A framework for context-aware applications for smart spaces. In Smart Spaces and Next Generation Wired/Wireless Networking; Springer: Berlin/Heidelberg, Germany, 2011; Volume 6869 LNCS, pp. 14–25. ISBN 9783642228742. [Google Scholar]
  20. Jakus, G.; Milutinovic, V.; Omerović, S.; Tomazic, S. Concepts, Ontologies, and Knowledge Representation; Springer: New York, NY, USA, 2013; ISBN 978-1-4614-7821-8. [Google Scholar]
  21. Tobergte, D.R.; Curtis, S. A Survey on Ontologies for Human Behavior Recognition. J. Chem. Inf. Model. 2013, 53, 1689–1699. [Google Scholar]
  22. Katifori, A.; Torou, E.; Vassilakis, C.; Lepouras, G.; Halatsis, C. Selected results of a comparative study of four ontology visualization methods for information retrieval tasks. In Proceedings of the 2008 Second International Conference on Research Challenges in Information Science, Marrakech, Morocco, 3–6 June 2008; pp. 133–140. [Google Scholar]
  23. Zhao, K.; Ward, M.; Rundensteiner, E.; Higgins, H. MaVis: Machine Learning Aided Multi-Model Framework for Time Series Visual Analytics. Electron. Imaging 2017, 2016, 1–10. [Google Scholar] [CrossRef] [Green Version]
  24. Parsons, P.; Sedig, K. Common visualizations: Their cognitive utility. In Handbook of Human Centric Visualization; Huang, W.D., Ed.; Springer: New York, NY, USA, 2014; pp. 671–691. [Google Scholar]
  25. Shneiderman, B. The Eyes Have It: A Task by Data Type Taxonomy for Information Visualizations. In Proceedings of the 1996 IEEE Symposium on Visual Languages, Boulder, CO, USA, 3–6 September 1996; pp. 336–343. [Google Scholar]
  26. Davies, J.; Michaelian, K. Identifying and individuating cognitive systems: A task-based distributed cognition alternative to agent-based extended cognition. Cogn. Process. 2016, 17, 307–319. [Google Scholar] [CrossRef] [Green Version]
  27. Pereira Rocha, J.A.; de Paula, C.P.; Sirihal Duarte, A.B. Distributed Cognition as a Theoretical Framework for Information Behavior Studies. Inf. Soc. 2016, 26, 91–105. [Google Scholar]
  28. Ninkov, A.; Sedig, K. VINCENT: A visual analytics system for investigating the online vaccine debate. Online J. Public Health Inform. 2019, 11. [Google Scholar] [CrossRef] [Green Version]
  29. Demelo, J.; Parsons, P.; Sedig, K. Ontology-Driven Search and Triage: Design of a Web-Based Visual Interface for MEDLINE. JMIR Med. Inform. 2017, 5, e4. [Google Scholar] [CrossRef]
  30. Ola, O.; Sedig, K. Beyond simple charts: Design of visualizations for big health data. Online J. Public Health Inform. 2016, 8. [Google Scholar] [CrossRef] [Green Version]
  31. Sedig, K.; Parsons, P. Interaction Design for Complex Cognitive Activities with Visual Representations: A Pattern-Based Approach. AIS Trans. Hum.-Comput. Interact. 2013, 5, 85–133. [Google Scholar] [CrossRef] [Green Version]
  32. Parsons, P.; Didandeh, A. Interactivity in Visual Analytics: Use of Conceptual Frameworks to Support Human-Centered Design of a Decision-Support Tool. In Proceedings of the 2015 48th Hawaii International Conference on System Sciences, Kauai, HI, USA, 5–8 January 2015; pp. 1138–1147. [Google Scholar]
  33. Mayer, R.E. The Cambridge Handbook of Multimedia Learning; Cambridge University Press: Cambridge, UK, 2014; ISBN 1107035201. [Google Scholar]
  34. Seufert, T. The interplay between self-regulation in learning and cognitive load. Educ. Res. Rev. 2018, 24, 116–129. [Google Scholar] [CrossRef]
  35. Wang, C.; Fang, T.; Gu, Y. Learning performance and behavioral patterns of online collaborative learning: Impact of cognitive load and affordances of different multimedia. Comput. Educ. 2020, 143, 103683. [Google Scholar] [CrossRef]
  36. Mutlu-Bayraktar, D.; Cosgun, V.; Altan, T. Cognitive load in multimedia learning environments: A systematic review. Comput. Educ. 2019, 141, 103618. [Google Scholar] [CrossRef]
  37. Sun, M.; Wang, M.; Wegerif, R. Using computer-based cognitive mapping to improve students’ divergent thinking for creativity development. Br. J. Educ. Technol. 2019, 50, 2217–2233. [Google Scholar] [CrossRef]
  38. Yalçin, M.A.; Elmqvist, N.; Bederson, B.B. Cognitive stages in visual data exploration. In Proceedings of the Sixth Workshop on Beyond Time and Errors on Novel Evaluation Methods for Visualization, Baltimore, MD, USA, 24 October 2016; pp. 86–95. [Google Scholar]
  39. Ragan, E.D.; Bowman, D.A.; Huber, K.J. Supporting cognitive processing with spatial information presentations in virtual environments. Virtual Real. 2012, 16, 301–314. [Google Scholar] [CrossRef]
  40. Pesquita, C.; Ivanova, V.; Lohmann, S.; Lambrix, P. A framework to conduct and report on empirical user studies in semantic web contexts. In European Knowledge Acquisition Workshop; Springer: Cham, Switzerland, 2018; Volume 11313, pp. 567–583. [Google Scholar]
  41. Katifori, A.; Halatsis, C.; Lepouras, G.; Vassilakis, C.; Giannopoulou, E. Ontology visualization methods—A survey. ACM Comput. Surv. 2007, 39, 10-es. [Google Scholar] [CrossRef] [Green Version]
  42. Dudáš, M.; Lohmann, S.; Svátek, V.; Pavlov, D. Ontology Visualization Methods and Tools: A Survey of the State of the Art; Cambridge University Press: Cambridge, UK, 2018; Volume 33, ISBN 0269888918. [Google Scholar]
  43. Po, L.; Bikakis, N.; Desimoni, F.; Papastefanatos, G. Linked Data Visualization: Techniques, Tools, and Big Data. Synth. Lect. Semant. Web Theory Technol. 2020, 10, 1–157. [Google Scholar] [CrossRef] [Green Version]
  44. Mouromtsev, D.; Pavlov, D.; Emelyanov, Y.; Morozov, A.; Razdyakonov, D.; Galkin, M. The Simple Web-based Tool for Visualization and Sharing of Semantic Data and Ontologies. In Proceedings of the International Semantic Web Conference (Posters & Demos), Bethlehem, PA, USA, 11–15 October 2015. [Google Scholar]
  45. Falconer, S. OntoGraf. Available online: https://protegewiki.stanford.edu/wiki/OntoGraf (accessed on 21 May 2020).
  46. Semafora Systems OntoStudio. Available online: https://www.semafora-systems.com/ontobroker-and-ontostudio-x (accessed on 21 May 2020).
  47. Musen, M.A.; Team, P. The Protégé Project: A Look Back and a Look Forward. AI Matters 2015, 1, 4–12. [Google Scholar] [CrossRef]
  48. TopQuadrant TopBraid Explorer. Available online: https://www.topquadrant.com/products/topbraid-explorer/ (accessed on 21 May 2020).
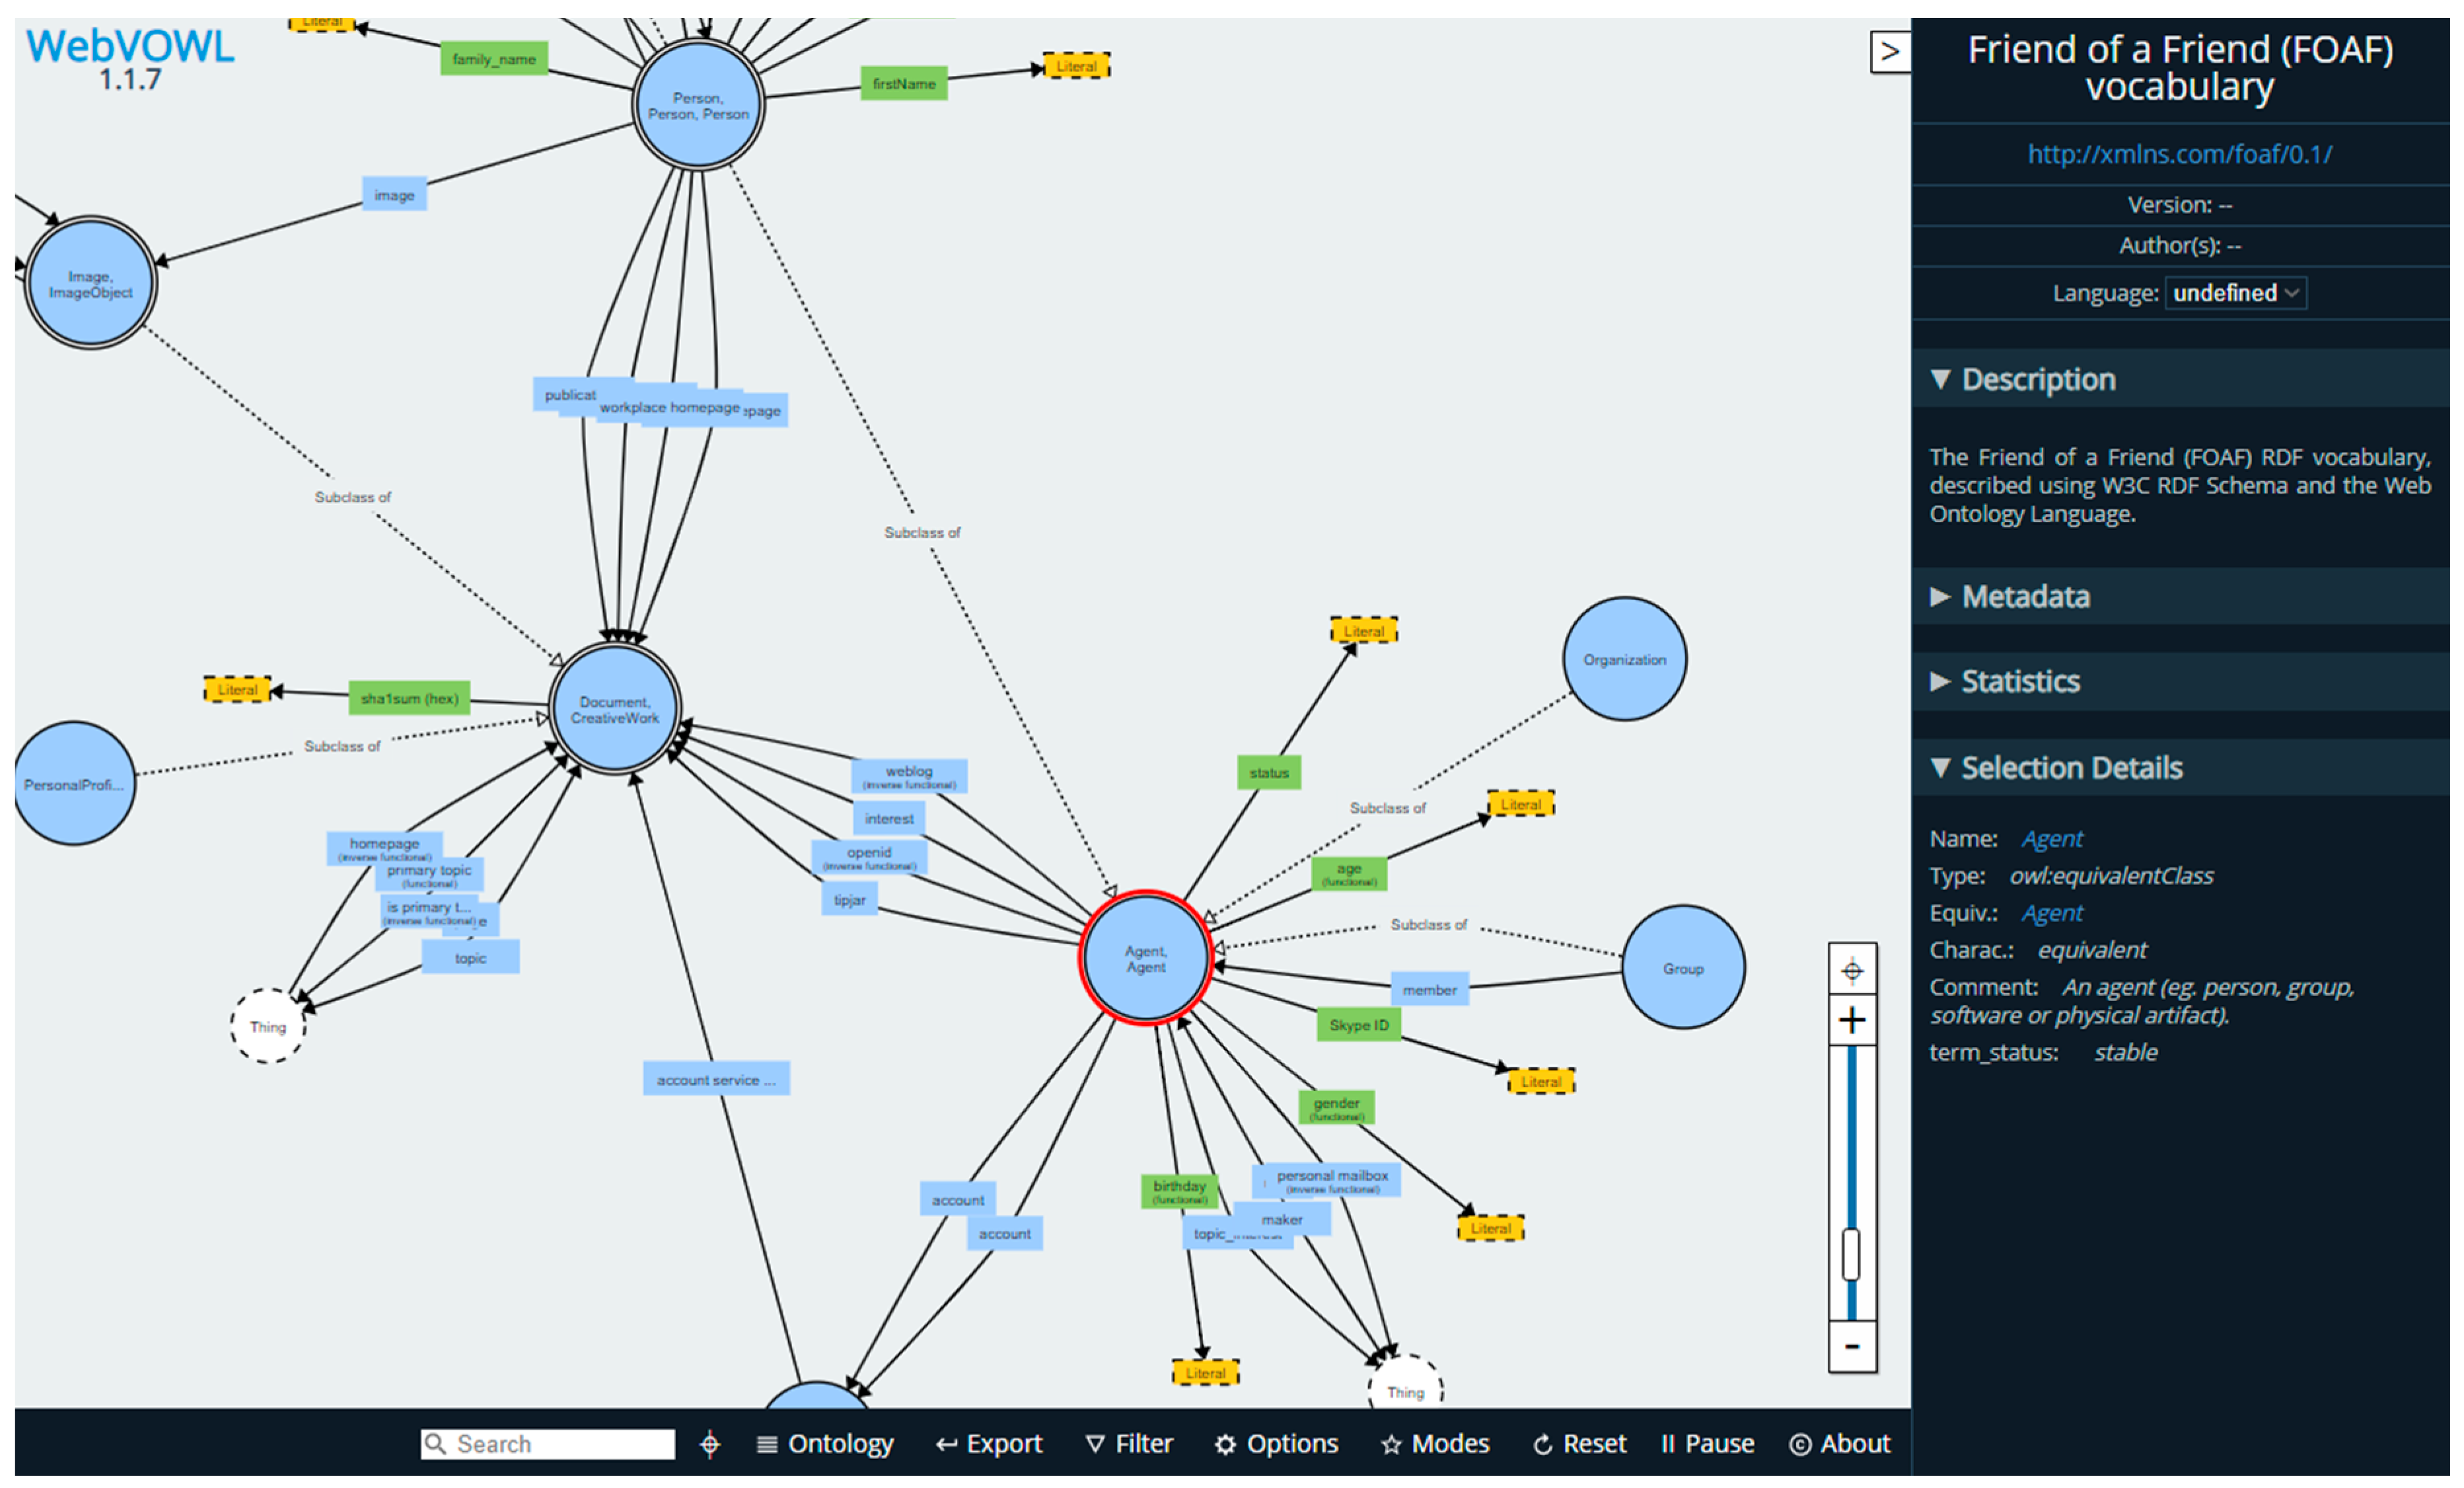
  49. Lohmann, S.; Negru, S.; Haag, F.; Ertl, T. Visualizing Ontologies with VOWL. Semant.-Web-J. Net 2016, 7, 399–419. [Google Scholar] [CrossRef] [Green Version]
  50. Silva, I.C.S.; Santucci, G.; Freitas, C.M.D.S. Visualization and analysis of schema and instances of ontologies for improving user tasks and knowledge discovery. J. Comput. Lang. 2019, 51, 28–47. [Google Scholar] [CrossRef]
  51. Tudorache, T.; Nyulas, C.; Noy, N.F.; Musen, M.A. WebProtégé: A collaborative ontology editor and knowledge acquisition tool for the web. Semant. Web 2013, 4, 89–99. [Google Scholar] [CrossRef] [PubMed] [Green Version]
  52. Nightingale, O. Lunr.js. Available online: http://lunrjs.com/ (accessed on 10 August 2020).
  53. Bostock, M. D3.js Data-Driven Documents. Available online: https://d3js.org/ (accessed on 9 December 2020).
  54. Ukrop, J.; Číková, Z.; Kapec, P. Visual Access to Graph Content Using Magic Lenses and Filtering. In Proceedings of the 28th Spring Conference on Computer Graphics, Budmerice, Slovakia, 2–4 May 2012; Volume 1, pp. 23–30. [Google Scholar]
  55. Kohler, S.; Doelken, S.C.; Mungall, C.J.; Bauer, S.; Firth, H.V.; Bailleul-Forestier, I.; Black, G.C.M.; Brown, D.L.; Brudno, M.; Campbell, J.; et al. The Human Phenotype Ontology project: Linking molecular biology and disease through phenotype data. Nucleic Acids Res. 2014, 42, 966–974. [Google Scholar] [CrossRef] [PubMed] [Green Version]
  56. Köhler, S.; Robinson, P. HPO Web Browser: Blindness Infopage. Available online: http://compbio.charite.de/hpoweb/showterm?id=HP:0000618 (accessed on 9 December 2020).
  57. The Human Phenotype Ontology. Available online: https://hpo.jax.org/app/ (accessed on 10 May 2020).
  58. Köhler, S.; Carmody, L.; Vasilevsky, N.; Jacobsen, J.O.B.; Danis, D.; Gourdine, J.-P.; Gargano, M.; Harris, N.L.; Matentzoglu, N.; McMurry, J.A.; et al. Expansion of the Human Phenotype Ontology (HPO) knowledge base and resources. Nucleic Acids Res. 2018, 47, D1018–D1027. [Google Scholar] [CrossRef] [PubMed]
Figure 1. Protégé Entity Browser: List and details subviews loaded with the Human Phenotype Ontology. Source: Image with permission courtesy of Center for Biomedical Informatics Research, Stanford University School of Medicine, Protégé Team, https://protege.stanford.edu.
Mti 05 00002 g001
Figure 2. Protégé OntoGraf: List and context subviews loaded with the Human Phenotype Ontology. Source: Image with permission courtesy of Center for Biomedical Informatics Research, Stanford University School of Medicine, Protégé Team, https://protege.stanford.edu.
Mti 05 00002 g002
Figure 3. WebVOWL: Context and details subviews loaded with supplied Friend of a Friend Ontology. Source: Image generated from WebVOWL: Web-based Visualization of Ontologies resource http://vowl.visualdataweb.org/webvowl.html.
Mti 05 00002 g003
Figure 4. Ontodia (now contained within the Metaphactory software suite): List, context, and details subviews. Source: Image with permission courtesy of Metaphacts, metaphacts.com.
Mti 05 00002 g004
Figure 5. WebProtégé Entity Graph: List and context subviews. Source: Image with permission courtesy of Center for Biomedical Informatics Research, Stanford University School of Medicine, Protégé Team, https://protege.stanford.edu.
Mti 05 00002 g005
Figure 6. OntoViewer: List, overview, and relations context subviews. Source: Image with permission courtesy of “Visualization and analysis of schema and instances of ontologies for improving user tasks and knowledge discovery”, School of Informatics, UniRitter Laureate International Universities.
Mti 05 00002 g006
Figure 7. Depiction of the workflow of PRONTOVISE (PRogressive ONTOlogy VISualization Explorer). Yellow boxes represent the processes performed within the back-end computation system. Blue boxes represent the object types which are persisted within browser storage. Orange boxes represent the various subviews within the front-end visualization system. The green box represents the types of low-level interactions which can be made to the system.
Mti 05 00002 g007
Figure 8. An overall view of the PRONTOVISE ontology visualization system, which has seven subviews: Search and Pinning Panel subview (a); Ontology Sections Panel subview (b); Section Levels Panel subview (c); Level Landmark Entities Panel subview (d); Entity Network Panel subview (e); Path Explorer Panel subview (f); and Entity Details Panel subview (g).
Mti 05 00002 g008
Figure 9. A depiction of Ontology Entity Search, showing a search activity which has resulted in three ‘Pin’ interactions.
Mti 05 00002 g009
Figure 10. A depiction of Ontology Entity Pinning, where pinned entities are represented in the same fashion as they were found in Ontology Entity Search, with a name label, an Unpin button, and a unique color. We have included a button located at the topmost position of Ontology Entity Pinning labeled ‘Remove All Pinned Entities’. When clicked, this button removes all pinned landmarks from the system. When an ontology entity is removed, its annotated representations will be removed from all subviews.
Mti 05 00002 g010
Figure 11. A depiction of the distortion technique within the Ontology Sections Panel. This technique can be adjusted through interaction. This is achieved by holding the Shift key while directing the mouse over a section. Releasing the Shift key will end the interaction event and lock in the sizing adjustments. If adjustments have been made, yet the user would like to return to the original distortion scaling, we have provided a Reset button at the top left corner of the Ontology Sections Panel.
Mti 05 00002 g011
Figure 12. A depiction of the magic lens within the Ontology Sections Panel. We have designed an interaction to occur when users drag the bottom portion of the magic lens horizontally across the ontology sections, which will both refresh the ontology section’s distortion technique and expose information for that section.
Mti 05 00002 g012
Figure 13. The initial list of levels within the Ontology Section Levels Panel.
Mti 05 00002 g013
Figure 14. A level within the Ontology Section Levels Panel. The level has three main interactions. First, when we move our cursor over a circle, a label is generated which displays the name of the entity and annotates the location of the ontology entity within the Level Landmark Entities Panel. Second, if we click on a circle, we perform an interaction which selects that entity as the initial position within the Entity Network Panel, the Path Explorer Panel, and the Entity Details Panel. Additionally, when a level has many ontology entities, the available visual space may become very crowded. To address this, we designed an interaction which allows us to distort the space by holding Shift and activating our mouse scroll wheel, which expands and contracts the horizontal scale of the plot graphs. We then can drag the plot graphs left or right using a single mouse click and drag action, allowing us the ability to closely inspect the full set of ontology entities and relations within the level.
Mti 05 00002 g014
Figure 15. The magic lens within the Ontology Section Levels Panel. We have designed the magic lens with an interaction which generates lines to represent the set of ontology relations within the level as we drag horizontally across the visual space.
Mti 05 00002 g015
Figure 16. The Level Landmark Entities Panel depicting an ontology level with significant connectivity within its matrix representation. We can see, using the magic lens of the Section Levels Panel, that the level has countless numbers of ontology entities and relations, which have been analyzed and presented in a usable manner with the Level Landmark Entities Panel. Within the matrix representation, each ontology entity is represented as a circle accompanied by a text label. Each circle maintains a red to white fill encoding reflecting its importance calculation, red being the most inherited, and white being the least. When we move our cursor over a circle, the text label grows and boldens for rapid association between the matrix position and its row and column labels. A color spectrum and text label is provided at the intersection points of the matrix representing ontological distance. This distance calculation is determined by the number of inheritances performed when defining the ontologies up to their nearest common parentage. For example, when a matrix position reflects the intersection between two ontology entities which inherit from the same immediate parent, their distance will be calculated and displayed as 2.
Mti 05 00002 g016
Figure 17. The Entity Network Panel depicting a low-level graph-like abstraction of specific ontology entities within the ontology network: parents (super classes), children (sub classes), and shared inheritances. Ontology entities are represented by a blue filled circle and text label. In these regions, relations are depicted with lines which link ontology entities to reflect relationship and localized structure. When two ontology entities are selected, their shared network is depicted with an additional representation maintaining the relations between each, their shared inherited parent, and distance. Additional information is exposed by moving the mouse over.
Mti 05 00002 g017
Figure 18. The Path Explorer Panel depicting all the levels within the selected path of the ontology, where each level maintains a set of rectangles representing all sibling entities and a text label reflecting its depth within the levels of the ontology.
Mti 05 00002 g018
Figure 19. An overall view of the PRONTOVISE ontology visualization system in its initial state after the Human Phenotype Ontology has been uploaded.
Mti 05 00002 g019
Figure 20. The initial stage of the Ontology Sections Panel subview.
Mti 05 00002 g020
Figure 21. Adjusting the scaling of the Ontology Sections Panel subview to enlarge the “Abnormality of the Musculature” section, which is normally represented as a much smaller portion of the visual space.
Mti 05 00002 g021
Figure 22. The result of a magic lens levels’ activation on the “Abnormality of Limbs” ontology section.
Mti 05 00002 g022
Figure 23. The result of a magic lens on the “Abnormality of Limbs” ontology section.
Mti 05 00002 g023
Figure 24. The selection of the “Abnormality of the Skeletal System” section.
Mti 05 00002 g024
Figure 25. An overview of the Section Levels Panel subview depicting the “Skeletal System” ontology section levels after navigating from the Ontology Sections Panel subview.
Mti 05 00002 g025
Figure 26. Inspecting the 13th level of the “Skeletal System” ontology section.
Mti 05 00002 g026
Figure 27. Using the magic lens to inspect a set of ontology entities and their inheritance relations.
Mti 05 00002 g027
Figure 28. An overview of the Level Landmark Entity Subview, representing the 3rd level of the “Abnormality of Skeletal System” ontology section.
Mti 05 00002 g028
Figure 29. Route between of “Abnormal Joint Morphology” and “Abnormal Epiphyseal Stippling”.
Mti 05 00002 g029
Figure 30. The initial state of the Entity Network Panel subview when an ontology entity is chosen as the initial position. In this case, “Abnormal Appendicular Skeleton Morphology” has been selected.
Mti 05 00002 g030
Figure 31. The initial state of the Entity Network Panel subview when two ontology entities are chosen as the initial positions. In this case, “Abnormal Appendicular Skeleton Morphology” and “Abnormal Joint Morphology” have been selected.
Mti 05 00002 g031
Figure 32. The Path Explorer Panel subview after selecting “Abnormal Appendicular Skeleton Morphology” as its current position.
Mti 05 00002 g032
Figure 33. The Ontology Landmark Search results from typing “skeleton”.
Mti 05 00002 g033
Figure 34. “Broad Forearm Bones” has been pinned, designating it as an important ontology entity, which is to be highlighted with its assigned color whenever it appears in a PRONTOVISE subview.
Mti 05 00002 g034
Figure 35. When “Broad Forearm Bones” has been selected within any subview, the Entity Details Panel subview depicts all information for that ontology entity as provided by HPO.
Mti 05 00002 g035
Table 1. Summary of the cognitive activities performed within spaces. Included is the name and description, the underlying processes of creative thinking which relate to the cognitive activity, and the types of spatial knowledge which must be developed within a cognitive map of a space before the activity can be performed within that space.
NameDescriptionRelated Thinking ProcessesRequired Spatial Knowledge
SensemakingReasoning and the mental manipulation of representations to develop, build upon, and refine mental models [7].ConvergentNone
NavigationObserving, orientating, and decision-making for directed movement towards a known objective [4,11,31].ConvergentLandmark, Route
ExplorationObserving, orientating, and decision-making for undirected movement without an objective [4,38].Divergent, ConvergentNone
SearchObserving, orientating, and decision-making for directed movement towards an unknown objective [31].Divergent, ConvergentLandmark, Route, Survey
WayfindingConstructing and memorizing movement sequences for future objective-oriented activities [16,39,40].Divergent, ConvergentLandmark, Route, Survey
Table 2. The high-level criteria for designing interactive visualization tools of ontology datasets which promote the stages of cognitive map formation for learning tasks.
CriteriaDescription
Provide generalized support for ontology datasetsDesigns should provide a generalized environment which facilitate the loading of ontology datasets of any size under the guidance of existing ontology file specifications. This is so that we may build our understanding of ontology datasets which are relevant to our challenging knowledge-based tasks.
Tune cognitive load to specific needsDesigns should provide a cognitive load which is aligned with the conditions for an effective learning environment for ontology datasets. Specifically, extraneous load which is unrelated to the learning task should be minimized, intrinsic load should be tuned to support the specific cognitive activities of the learning task, and germane load should provide affordances which unify the needs of the learner, space, and chosen process for learning.
Afford the spatial knowledge within ontological spaceDesigns should supply encounters which afford to us an authentic internal encoding of the entities, relations, and structures of the ontology dataset to support our development of spatial knowledge for the formation of our cognitive maps.
Facilitate the performance of the cognitive activities necessary to learn a spaceDesigns should provide encounters which allow us to perform the cognitive activities necessary to build understanding of a space. This is because not supporting any one of sensemaking, navigation, exploration, wayfinding, and search would lessen our ability to leverage our various cognitive processes and hamper the stages of cognitive map formation.
Support self-regulated learningDesigns should provide encounters which allow us to guide our own learning tasks: through setting goals, planning our learning process, enacting our process by using our resources to interact with new information, and evaluating our learning achievements.
Table 3. The types of subviews within an ontology dataset visualization interface.
TypeDescriptionTypical Implementation StrategyCognitive ActivitiesUse in Review Tools
ListA subview that depicts components of the ontology datasets like entities and relations within a list.A text-based visual representation strategy with interactions for selection and management.Sensemaking,
Navigation,
Exploration,
Search,
Wayfinding
Protégé Entity Browser, Protégé OntoGraf, Ontodia OntoStudio, TopBraid Explorer, WebProtégé Entity Graph, OntoViewer
OverviewA subview that depicts the full contents of an ontology dataset. A pictorial-based visual representation strategy with interactions for selection and filtering.Sensemaking,
Navigation,
Exploration,
Search,
Wayfinding
WebVOWL, Ontodia, OntoViewer
ContextA subview that depicts a subset of the ontology dataset contents determined through interaction.A pictorial-based visual representation strategy with interactions for selection and comparison.Sensemaking,
Exploration,
Wayfinding
Protégé OntoGraf, OntoStudio, TopBraid Explorer, WebProtégé Entity Graph, OntoViewer
DetailsA subview that depicts the information of a specific object within the ontology dataset. A text-based visual representation strategy with minimal opportunities for interaction.SensemakingWebVOWL, Ontodia OntoStudio, TopBraid Explorer, WebProtégé Entity Graph, OntoViewer
Table 4. A summary of the high-level criteria within PRONTOVISE, which can be used for designing interactive visualization tools which support complex learning and the stages of cognitive map formation. The satisfaction of these criteria at the implementation level are discussed in detail later within the workflow.
CriteriaPRONTOVISERelated Systems/Views
Provide generalized support for ontology datasetsPRONTOVISE provides a generalized environment which supports the loading of ontology datasets of any size and from any domain when they fulfill the requirements of OWL RDF, the leading ontology dataset format. Additionally, its visual representation and interaction designs are built to scale for any number of encoded complex objects.Ontology processing system; all front-end subviews
Tune cognitive load to specific needsCognitive load is actively considered within the design of PRONTOVISE. PRONTOVISE is designed to be a complex learning environment, so design features which produce extraneous load unrelated to learning tasks are minimized. PRONTOVISE provides a level intrinsic load which targets a promotion of the stages of cognitive map formation. PRONTOVISE accounts for germane load by specifically being designed to provide a learning environment for those who are unfamiliar with an ontology dataset. This is achieved through visualizations which address the specific spatial knowledge of the various complex objects within ontology datasets.All front-end subviews
Afford the spatial knowledge within ontological spacePRONTOVISE includes numerous subviews which provide encounters that afford perspectives of authentic internal encodings of the entities, relations, and structures of the ontology dataset.Various front-end subviews
Facilitate the performance of the cognitive activities necessary to learn a spacePRONTOVISE facilitates the performance of sensemaking, navigation, exploration, wayfinding, and search cognitive activities within ontological space over numerous subviews to support our thinking processes and the stages of cognitive map formation.Various front-end subviews
Support self-regulated learningThe design of PRONTOVISE includes a modular set of subviews which support nonlinear interaction loops, which together provide the freedom to set, plan, enact, and evaluate any set of learning tasks for ontological space, all while following the requirements for cognitive map formation.Ontology processing system; all front-end subviews
Table 5. A summary of the subviews of PRONTOVISE, describing their subview type, supported cognitive activities, and their relationship to the stages of cognitive map formation.
SubviewType of SubviewCognitive ActivitiesSpatial Knowledge
Search and Pinning PanelListSensemaking, Navigation,
Search, Wayfinding
Landmark
Ontology Sections PanelOverviewSensemaking, Navigation,
Exploration, Search, Wayfinding
Landmark, Survey
Section Levels PanelContextSensemaking, Exploration, Search, WayfindingLandmark, Route, Survey
Level Landmark Entities PanelContextSensemaking, Navigation, Exploration, WayfindingLandmark, Route
Entity Network PanelContextSensemaking, Navigation, Exploration, WayfindingLandmark, Route
Path Explorer PanelOverviewSensemaking, Navigation, Exploration, WayfindingRoute, Survey
Entity Details PanelDetailsSensemakingLandmark
Publisher’s Note: MDPI stays neutral with regard to jurisdictional claims in published maps and institutional affiliations.

