Abstract
The design of patrol boats, especially in Indonesian waters with extreme sea conditions, requires good stability capabilities and self-righting moments. These conditions require patrol boats to have anti-capsized capabilities where, with these capabilities, the patrol boat can return to an upright position at extreme heeling angles. This study investigates how changing the center of gravity (CoG) due to the deckhouse height factor improves self-righting moment capabilities. Four different deckhouse heights are examined to find the optimal self-righting roll moment, with a deckhouse height in the 2.01–2.31 m range. In addition, the presence of the self-righting roll moment is also validated by the computational fluid dynamics (CFD) method using three different mesh sizes. The height of the deckhouse can significantly influence the ship’s stability. The initial investigation shows ships with minimum deckhouse heights of 2.06 m have positive righting lever arms at 170° and are classified as anti-capsized ships. It has been discovered that buoyancy and the center of gravity are crucial variables in obtaining the self-righting moment. The deckhouse’s height increases the stability of the ship’s righting arm by enhancing the metacenter point. The findings demonstrate that more excellent stability is achieved with a larger deckhouse height.
1. Introduction
Indonesia is an archipelago state with a large number of islands. However, there are still not enough patrol vessels. There are numerous infractions along the maritime boundary as a result. The patrol boat was built to function in calm and challenging environments and was utilized for search and rescue missions in challenging circumstances. In addition, a ship may become incapable of maintaining ship operability in harsh circumstances. The ship could sink due to a loss of capability at a self-righting moment during ship in waves. The ship’s capability to have the self-righting moment is a unique ability that could give the ship a positive moment in all conditions. In contrast, the ship will usually capsize due to the loss capability of the upright moment during harsh conditions.
Strengthening safety in the transportation system is essential to reducing the devastating consequences of accidents and ensuring the sustainability of our transit networks [1,2]. Specifically, several previous investigations of the anti-capsized patrol boat in marine transportation have been conducted. Designing a self-righting ship is closely linked to the ship’s stability, influenced by the high and low CoG, which, in turn, is affected by cargo and the ship’s height. Various factors impact the ship’s self-righting capabilities. These studies discuss the design of an anti-capsized patrol boat using the inherent self-righting method with four deckhouse height variations [3]. This study’s findings reveal that increasing the superstructure height by 0.1 m in four ship prototype models resulted in a noticeable effect on the ship’s self-righting moment. Specifically, the comparison indicates that a superstructure height ranging from 0.7 to 1 m significantly impacts the ship’s self-righting moment. However, the model with a 1 m high superstructure experienced a failure in the self-righting moment. This failure was attributed to the stability arm showing a negative value, categorizing the ship model as having negative stability [4].
Numerous notable prior investigations have been examined to explore the utilization of anti-capsize mechanisms for ships. The exploration of a self-righting force was studied in the context of search and rescue (SAR) and patrol operations, as detailed in references [5,6]. The research suggests that the ability for a self-righting force persists even when the rolling exceeds 180°. Rolling represents a hazardous motion for a ship. Losing the self-righting force during rolling can lead to the ship capsizing.
Several studies have delved into ship rolling under extreme conditions, often employing numerical methods such as CFD analysis for ship stability analysis. Liu et al. [7] utilized CFD to predict full-scale ship parametric rolling in heading waves, demonstrating CFD’s capability to replicate ships in waves. Xu et al. [8] applied CFD to forecast the roll response of damaged ships experiencing quasi-steady flooding in beam waves.
Limited research has been conducted on ship designs incorporating inherent anti-roll features without additional devices. Most studies have focused on ships capsizing due to waves, as seen in Liu et al. [9] investigating the interaction between pure stability loss, surf-riding, and broaching. The study suggests a notable connection between these stability failure modes. Lin et al. [10,11,12] explored the Magnus anti-rolling device, which utilizes swinging rotating cylinders based on the Magnus effect to offer anti-rolling measures at any ship speed. Zhang et al. [13] proposed a new anti-rolling hydrofoil design that connects the main hull and the side hull below the waterline, generating reverse roll moments through substantial hydrodynamic pressure during roll motion. Additionally, a novel design alternative called the buoyancy support system (BSS) has been suggested by Zhang et al. [14], proving technically and economically feasible for securing residual buoyancy.
Using the rolling period calculation approach, this study will determine the effect of the patrol boat’s deckhouse height on the roll period. It explores four different deckhouse heights to determine the optimal self-righting roll moment, focusing on heights within the 2.01–2.31 m range.
The existence of the self-righting roll moment is further confirmed using computational fluid dynamics (CFD) with three different mesh sizes (coarse, medium, and fine). Dynamic fluid body interaction (DFBI) and unsteady Reynolds-averaged Navier–Stokes (RANS) will validate the minimum height to find the anti-capsized capability.
2. Methods
2.1. Reference Model
The initial step in creating the hull model was constructing a prototype based on a simple design. A single chine was incorporated into the hull to enhance the ship’s speed. This design utilized the spray effect generated by water flowing past the hull, causing it to curve around the ship’s side and serve as a lifting force. Incorporating a chine was motivated by the specific objective of designing the ship for rapid patrol, making it a key element in achieving increased speed. The 3D reference patrol boat model of MV. Barracuda and the main size of the ship can be seen in Table 1 and Figure 1. The linesplan and general arrangement are illustrated in Figure 2 and Figure 3. The body plan comprehensively depicts the ship from a longitudinal perspective (side and bottom views) and a transverse angle (front view). The ship was designed for six passengers and had six pieces of baggage and cargo.

Table 1.
Principal dimensions of MV. Barracuda.
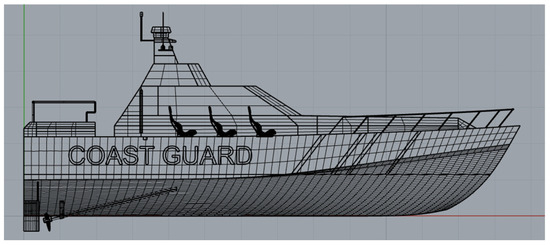
Figure 1.
Three-dimensional model of a patrol ship.
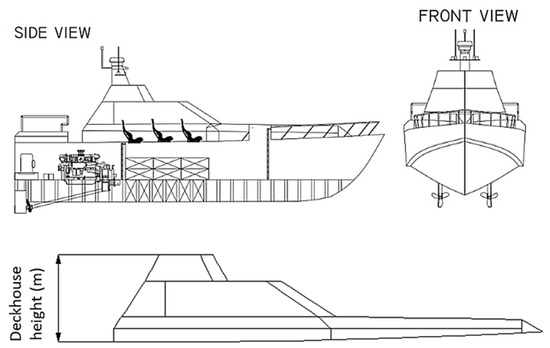
Figure 2.
General arrangement of the patrol ship.
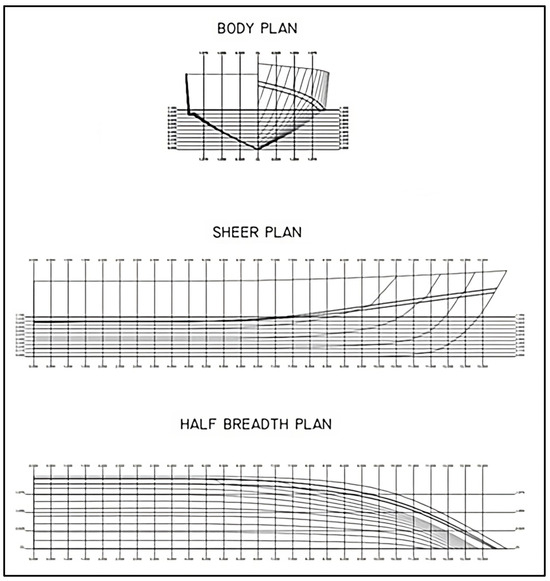
Figure 3.
Linesplan of patrol vessel and SAR.
Modifications to the deckhouse are undertaken to achieve the minimum height required for the designed patrol boat to possess anti-capsizing capability. This study utilized reference variations for superstructure heights in the load test, drawing from previous studies conducted by Trimulyono et al. [3]. Four types of deckhouse heights were considered, each differing in superstructure height by 5%, 10%, and 15% from the original height of 2.01 m. Consequently, each model featured an additional height of 0.1 m.
Moreover, roll period tests will be conducted on vessels with deckhouse heights of 2.07 m, 2.06 m, and 2.04 m. The vessel with a deckhouse height of 2.01 m yielded unsatisfactory analysis results, failing to meet the criteria for an anti-capsized ship. On the other hand, a deckhouse height of 2.11 m demonstrated favorable stability analysis and is classified as an anti-capsized ship. This classification is based on the positive lever value observed in the GZ curve at a heel angle of 180°. Modifications in the deckhouse height will induce changes in construction weight, resulting in corresponding modifications in the lightweight tonnage (LWT) data, as depicted in Table 2. It can be found that the increase in deckhouse height caused a slight increase in construction weight. In addition, the equipment weight consists of the components of the ship’s equipment, which includes propellers, main engines, shafts, cargo boxes, navigation equipment, and other equipment.

Table 2.
LWT data of different deckhouse heights.
The GZ curve data acquired will undergo further analysis to ascertain the metacenter height (GM) value at a tilt angle of 170°, validating the deckhouse. The calculation of the GM value aims to determine whether the designed ship falls into the positive, negative, or indifferent stability category. The formula used to derive the GM value is grounded in the principles of hydrostatics and stability. It is assumed that the diverse GM values obtained will impact the rolling period of the vessel. Using Equation (1), the GM value data will be computed for the rolling period in Equation (2). This function aids in determining whether the ship possesses a negative GM value [15,16].
where GM is the point value gravity to metacenter point; GZ is the righting lever value; and sin θ is the heel angle. For the rolling period, the k value is based on the gyration radius from the vessel, and g is the gravity.
2.2. Simulation Setup and Domain
The computational domain for CFD setup, the self-righting moment, was simulated with roll decay analysis to prove that the boat could return to an upright condition after rolling at a high angle. Roll decay simulation was conducted in this study using commercial CFD software, Siemens Star-CCM+ version 16.04. In the modeling stage, 3D software was used for the full-scale hull modeling of MV. Barracuda based on the linesplan data in Figure 3. The first step is to import the geometry of the 3D ship model that has been designed using the modeling application into STAR-CCM+. The meshing method performed in this study uses overset meshing, which has two roles of geometry: the virtual tank (domain) and the overset that envelops the object as an acceptor. To ensure a smooth roll decay simulation, overlap refinement was applied between two regions. A free surface refinement was also used near the water’s surface to precisely distinguish between the water and air phases. For mesh generation, the automatic mesh tool in Star CCM+ was utilized, specifically employing a trimmed cell mesh and a surface remesher. This tool uses the Cartesian cut cell method for meshing.
In this instance, the integral form of the Unsteady Reynolds-Averaged Navier–Stokes (URANS) equations was discretized using the finite volume method (FVM). A second-order convection scheme was applied to handle the convective terms. A first-order approach was employed in terms of temporal discretization for the time-domain solution. The continuity and momentum were interconnected through a predictor–corrector scheme. The flow equations were addressed in an uncoupled manner. The entire solution process was executed utilizing the semi-implicit method for pressure-linked equations (SIMPLE) algorithm.
The turbulence impact within the boundary layer region was simulated employing the shear stress transport (SST) model [17], which integrates a k-ɛ model in the far field with a k-ω model near the wall. The y+ treatment scheme was applied for the boundary layer region, either on fine grids (when y+ < 5) or coarse grids (when y+ > 30). The volume of fluid (VoF) method, as introduced by Hirt and Nichols [18], was utilized to account for the free surface. VoF defines two phases of the fluid (water and air) by assigning a scalar value of 0 to air and 1 to water in each cell. The interface between the two fluid phases (cells containing water and air) is 0.5. Flat wave modules with zero velocity were employed to represent fluid in the computational domain without waves when the boat was at zero velocity.
The DFBI module was employed in the roll decay simulation to model the boat’s two degrees of freedom: roll and heave. This module calculates the forces, moments, and gravitational forces exerted on the hull surface, and it solves the governing equation to ascertain the new position at each time step. Figure 4 illustrates the two designated areas, overset and background, utilized in this research. The depiction of the domain used is based on prior research [3], which investigated roll decay capabilities using the CFD overset meshing method. The study outlined the background domain size and overset as the simulation sites. A virtual tank, acting as a damping system akin to a water damper, will mitigate the external effects of rotational waves on the relevant boundary, facilitating a more natural application of roll response analysis. The dimensions of the virtual tank and overset are detailed in Table 3, and the visual representation of the domain in Figure 4 is adapted from the earlier study [3]. This study demonstrated that the roll decay of the 1-DoF model yielded highly accurate predictions for significant initial roll angles (13.5° and 15°). For simulations with a 4° initial angle, the coefficients derived from the 6 DoF simulation precisely matched the experimental curve [19]. The upcoming simulation will incorporate three mesh variations with varying cell numbers. Table 4 and Figure 5 illustrate the three mesh types under different density conditions: fine, medium, and coarse.
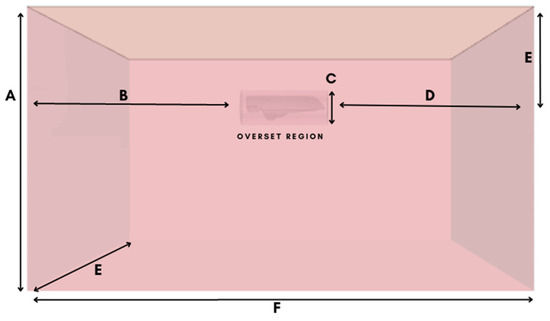
Figure 4.
Overset region and domain representation.

Table 3.
Domain dimensions.

Table 4.
Meshing size between fine, medium, and coarse.

Figure 5.
Comparison of mesh refinement: (a) coarse, (b) medium, and (c) fine.
Fourier series (FS) analysis was used to quantify the results of the roll decay simulation, which considered the unsteady time series of roll amplitude. This analysis converted the time-domain results into frequency-domain results [20]. It was undertaken for the three mesh configurations, which were fine, medium, and coarse. Next, the roll response in the frequency domain for different mesh configurations was compared. Each unsteady history φ(t) could be represented by a Fourier series in time, as shown in Equation (3).
where φn is the nth harmonic amplitude and γn is the corresponding phase, which can be determined by Equations (4) and (5).
where:
where the 0th harmonic amplitude φ0 is the average value of the time history of φ(t).
The verification process employed the grid convergence index (GCI) analysis [21]. The GCI is typically expressed as a percentage, and a lower GCI indicates better mesh convergence, meaning that further mesh refinement would lead to smaller changes in the solution. The GCI method is valuable because it provides a standardized way to report the uncertainty due to grid discretization. Valuing CFD simulations and ensuring the numerical results are reliable is critical. The adapted discretization check involves comparing meshing results and determining the amount of error. The results become closer to the original as the meshing amount increases. This approach relies on an extrapolation method. It involves initially determining the order of convergence (p) value and then using the exact amplitude result to find the discretization error value. This value can be calculated using a formula based on Richardson extrapolation [22].
Equations (9)–(13) are used to calculate the results of the comparison mesh and the estimated error in the simulation. is approximate relative error. S1, S2, and S3 are the frequency-domain roll responses obtained from the fine, medium, and coarse configurations. In addition, R is the convergence ratio, which is monotonic for 0 < R < 1, oscillatory convergence for −1 < R < 0, and a divergent solution (R) is ranged R < 1 or R > 1. In this case, the convergence ratio (R) is set to monotonic type with a value of 0.4463. Moreover, p is the order of accuracy, φ is Fourier series in time, and the refinement ratio (r) is set 2.
3. Results and Discussion
3.1. Loadcase Test and Roll Periods
In this case, four conditions will be tested with different displacements: longitudinal center of gravity (LCG) and vertical center of gravity (VCG), as seen in Figure 6. Loadcase 1 is the ship’s condition with 50% cargo weight, 0% passenger baggage, and 100% passengers totaling six people. Then, Loadcase 2 consists of 50% of the total passengers, with 0% passenger baggage and 50% cargo. Loadcase 3 consists of only 50% of all passenger baggage and 100% of passenger and cargo. Lastly, Loadcase 4 consists of 100% baggage and cargo with no passengers. Moreover, Table 5 shows each component’s weight at different deckhouse heights. Deckhouse heights of Deckhouses 1–4 are 2.01, 2.11, 2.21, and 2.31 m, respectively.
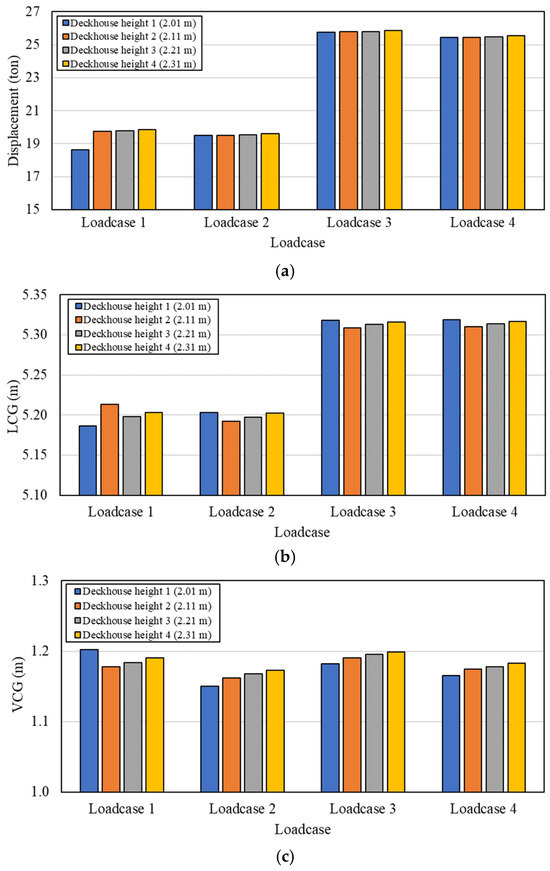
Figure 6.
Comparison of displacement and center of gravity under various deckhouse heights, (a) displacement, (b) LCG, and (c) VCG.

Table 5.
Variation of each component’s weight in various cases.
The ship’s displacement comprises two main components: dead weight tonnage (DWT) and lightweight tonnage (LWT). Alterations in the superstructure, hull, and glass of the superstructure impact both the size and overall weight of the ship’s LWT, necessitating a reassessment of these modifications. Utilizing the radius of the gyration calculation method facilitates determining the CoG for the various parts and components on the ship. The GZ curve, representing the righting lever arm, was calculated using strip theory, a method implemented in Maxsurf 17.0 software version. This approach involves dividing the ship’s hull into numerous small sections, allowing for precise analysis of each segment’s contribution to the overall stability. The strip theory method is beneficial for complex hull shapes, accounting for vessel length variations. By summing the contributions from all sections, the software generates a comprehensive GZ curve that reflects the ship’s stability characteristics at various heel angles.
In Figure 7a, each ship’s deckhouse height modification demonstrates excellent stability under Loadcase 1. No ship models reach negative GZ at a 180° heel angle, indicating a self-righting moment for each model under this load condition. Consequently, all deckhouse heights are categorized as anti-capsized for this loadcase. Figure 7b illustrates the lack of a self-righting moment at a 170° heel angle. Moreover, Figure 7c reveals that every alteration to the ship’s deckhouse ensures stability, with no ship models experiencing negative GZ at a 180° heel angle. Despite this anti-capsized classification for all deckhouse heights, an imbalance arises because the passenger load is concentrated on one side, causing a shift in the CoG along the transverse axis. In Figure 7d, Deckhouse 1 fails to return to its upright position at a 170° angle. At the same time, the remaining deckhouses exhibit good self-righting moments, resulting in Deckhouse 1 (2.01 m) being ineligible for anti-capsized classification under this loading condition.
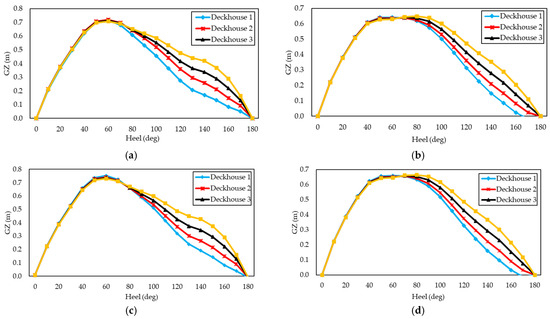
Figure 7.
Comparison of GZ curves at different loadcases: (a) Loadcase 1, (b) Loadcase 2, (c) Loadcase 3, and (d) Loadcase 4.
In addition, Figure 7 demonstrates that the height of the deckhouse on a ship can significantly influence the ship’s stability. Factors such as the CoG, buoyancy, mass distribution, and GM should be considered. It can be concluded that various aspects affect the GZ value of ship stability, including the height of the deckhouse, whether high or low, the changes in ship construction and volume, and the distribution of cargo weight and ship displacement.
Due to the previous loadcase analysis revealing a failure in the self-righting moment of Deckhouse 1 at a 170° heel angle under specific load conditions, the research continued to identify the lowest deckhouse height. Three height variations were considered: 2.07 m, 2.06 m, and 2.04 m.
The results from Figure 8 appear very similar to the variations in the ship’s deckhouse, and the difference is not readily visible. The analysis results highlight a crucial distinction at a heel angle of 170°. The ship with a deckhouse height of 2.04 m exhibits a negative GZ righting lever, indicating that the ship is already capsized at that angle. Consequently, it can be concluded that the deckhouse with a height of 2.04 m lacks a self-righting moment and is not classified as an anti-capsized ship at the heel angle of 170°. Therefore, it can be stated that the ship does not possess a self-righting moment at an angle of 170°, even though the difference between deckhouse heights is not significant.
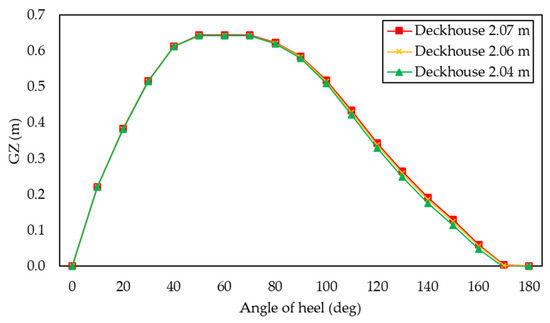
Figure 8.
Comparison of GZ curve in three different deckhouse heights on the full-load condition.
Table 6 explains that the deckhouse with a height of 2.04 m experiences negative stability, as the negative GM value signifies that the CoG point at an angle of 170° surpasses the metacenter. Consequently, the ship tends to capsize at that angle. Table 6 elucidates the calculation results of the roll period for each difference in deckhouse height. The results indicate that a decrease in the deckhouse height leads to a faster roll period, while an increase in deckhouse height shortens the roll period. These findings align with the applicable theory, where the GM value follows the change in deckhouse height, and a higher GM value is inversely proportional to the tilt period. Although the time difference in the roll period is not too significant, it is noteworthy that the change in deckhouse height is not substantial.

Table 6.
GM value at 170° and roll period between deckhouse height.
3.2. Computational Fluid Dynamics Analysis
The comparison of rolling amplitudes across different mesh densities in deckhouse height 2.07 m is illustrated in Figure 9 and summarized in Table 7. The graph indicates that as the number of grids increases, the amplitude results closely approach the original values. It demonstrates a direct proportional relationship between the number of grids and the increase in roll amplitude, with finer grids almost reaching the exact amplitude. Additionally, Table 7 presents the percentage error for the simulation across three different meshing types, all of which are low. Even for the coarse grid type, the value remains below 1%, affirming the accuracy of the obtained amplitude results.
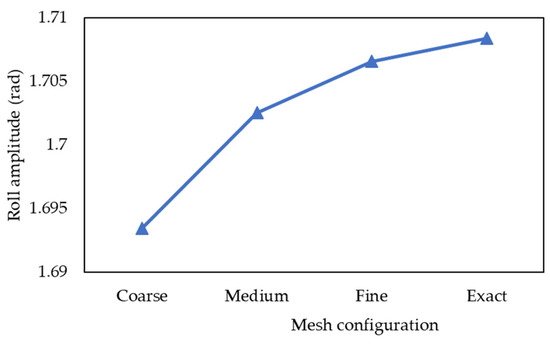
Figure 9.
Comparison of roll amplitudes between different mesh sizes and exact solution.

Table 7.
Comparison of roll amplitudes at different mesh sizes.
The GCI results indicate the extent of simulation error by comparing various meshing outcomes. It is recommended that the GCI percentage be kept below 5%. When the convergence value approaches 1, the simulation results exhibit minimal change with further increases in grid resolution (number of grid cells). The aim of achieving grid independence is to ensure that simulation results maintain an adequate level of accuracy without being excessively reliant on grid size or resolution. In some instances, simulation outcomes may vary significantly when there are changes in grid resolution, particularly with coarse grid resolutions, potentially leading to inconsistent or inaccurate results.
The results reveal that this analysis has a convergence value close to 1, about 0.9295, indicating proximity to the actual solution and demonstrating grid independence. A monotonic convergence type is considered more stable and preferable in numerical simulations. It suggests that the simulation consistently and continuously approaches the correct solution without encountering drastic changes or significant fluctuations in the numerical results.
The CFD simulation will yield results in the time domain illustrating the ship’s rolling motion at 170° until stability is regained. The ship is modeled at a 1:1 scale from its original size. The analysis results in Figure 10 indicate that the ship, with a deckhouse height of 2.07 m, can return to the upright position within a total time of 14 s. Compared to prior studies conducted at a smaller scale, a considerable difference in the time required for the ship to return to the upright position is evident. This simulation takes nearly five times longer due to the ship’s significantly larger size and weight than the scaled-down model. Different mesh densities also impact the results for each tilt angle, although the differences are not too significant, only reflecting changes in the decimals of each tilt angle.
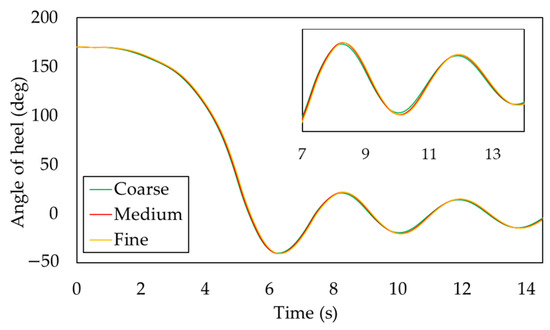
Figure 10.
Comparison of roll decays between the mesh sizes.
Moreover, Figure 11 illustrates that the ship with 2.07 m deckhouse height attains stability starting from the 5th second. From this point onward, the ship consistently attempts to return upright and stationary. It is observed that starting from the fifth second, a transverse wave forms, allowing for the calculation of the ship’s rolling-period speed. The Fast Fourier transform (FFT) method can be employed to convert the time domain in the graph in Figure 11 into the frequency domain, aiding in determining the roll amplitude of the ship.
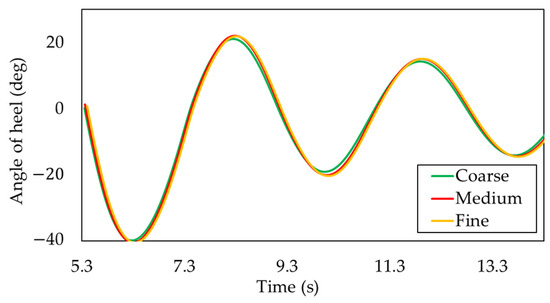
Figure 11.
Angle of the heel at eight orders and two rolling cycles.
Because FFT requires data exponentially increasing by a factor of 2, we consider eight orders starting from order 0. The data are extracted from the roll decay graph, covering the rolling cycle two times, starting from 0° at approximately 5 s angle and extending to about 12 s, as depicted in Figure 10. Performing FFT from a 170° angle would yield too distant results, introducing inaccuracies in the data analysis. The calculation results in yield frequency units, which are subsequently converted to rad/s. The outcomes are presented in Table 8 and Figure 12, illustrating the results of the FFT calculation.

Table 8.
FFT results at different mesh sizes.
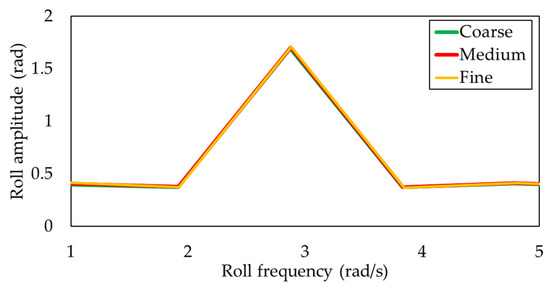
Figure 12.
Roll amplitude from the frequency domain.
The peak of the curve represents the roll amplitude occurring at the natural roll frequency. Data from this peak will be further analyzed using the discretization check method to assess the accuracy of the results. Figure 12 illustrates that increasing the meshing grid value raises the roll amplitude, with only a slight difference between meshing values. It can be concluded that the simulation results are reasonably close to those obtained using the previous approach for calculating the roll period. The roll period time for deckhouse height of 2.07 m is 3.162 s, while the average simulation results across different meshing yield a time of 3.6437 s. It can be inferred that the simulation results are approaching accuracy, with a relatively insignificant difference between the calculation and numerical simulation.
This study demonstrates the significant influence of deckhouse height on enhancing the ship’s metacentric height. An increased deckhouse height contributes to additional buoyancy, especially at extreme heeling angles, such as 170°. When the ship heels to starboard, the center of buoyancy shifts downward while the center of gravity moves upward. As the center of buoyancy aligns with the center of gravity, the ship generates a positive righting moment, initiating a return to its upright position, as illustrated in Figure 13.
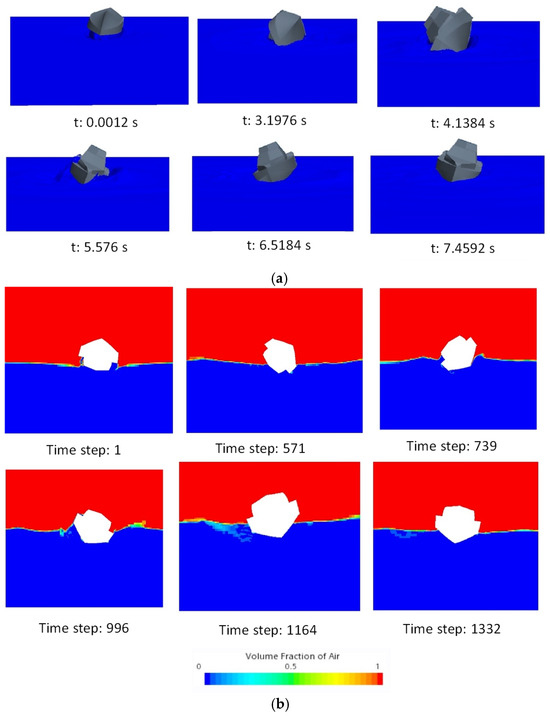
Figure 13.
Visualization: (a) 3D roll decay simulation and (b) 2D roll decay simulation.
This behavior highlights the importance of maintaining a low center of gravity. When the center of gravity is sufficiently low, the shift in the center of buoyancy results in a positive moment that helps the ship recover from a heeled position. Conversely, if the center of gravity is high, the opposite effect occurs: the center of gravity rises further while the center of buoyancy moves downward. This creates a negative moment, leading to a new equilibrium where the center of gravity is above the center of buoyancy, potentially causing the ship to capsize.
The interplay between the center of gravity and the center of buoyancy is crucial in determining the ship’s stability, particularly under extreme conditions. The deckhouse height can have a dual effect depending on the overall design and loading conditions, contributing to the ship’s buoyancy. While an increased deckhouse height can improve metacentric height and provide additional righting force at large heel angles, it can also raise the vessel’s overall center of gravity if not properly designed. This dual effect underscores the importance of a balanced design approach where the benefits of additional buoyancy are carefully weighed against the potential risks of raising the center of gravity. Understanding these dynamics is essential for ensuring the vessel’s stability across various operating conditions. Figure 13 shows that CFD simulation used two phases, which are air and water, to capture the free surface between both phases; the Volume of Fluid (VoF) method was used. Figure 13 illustrates the result of air volume fraction with the color scale from blue to red, or from 0 to 1, in 2D view. The red color indicates the volume fraction of air is 1, which is the phase that contains the air. When the air volume fraction is zero, the phase does not contain the air phase. This means that the phase contains the water phase (blue color). The free surface, which is located between two phases, has a volume fraction of air of 0.5.
4. Conclusions
This research explores the effect of deckhouse height on enhancing self-righting moment capabilities. Four different deckhouse heights were evaluated to determine the optimal self-righting roll moment, focusing on a height range of 2.01–2.31 m. It was found that the self-righting moment had a linear effect on the deckhouse height of the patrol boat. It can be summarized that deckhouse height is an important factor in analyzing self-righting moments. A higher deckhouse height can negatively impact a ship’s stability by raising its center of gravity. However, stability can be improved if the load is placed as low as possible, thereby lowering the overall center of gravity and counteracting the effects of the elevated deckhouse. In this case, the minimum deckhouse height of 2.06 m at a heel angle of 170° has a self-righting moment and can be classified as an anti-capsized ship.
Moreover, CFD analysis shows a direct proportional relationship between the number of grids and the increase in roll amplitude, with finer grids almost reaching the exact amplitude. The CFD result proves that the ship with a deckhouse height of 2.07 m has a self-righting moment. However, in this study, the distribution of weight was neglected. Future works on the effect of weight distribution are an interesting topic.
Author Contributions
Conceptualization, A.T., P.M., S.S. and M.I.; methodology, T.T., O.M. and G.R.; software, H.F.M.T., T.T. and O.M.; validation, H.F.M.T., T.T. and O.M.; formal analysis, G.R. and M.I.; investigation, S.S. and A.T.; resources, S.S. and A.T. data curation, S.S. and A.T.; writing—original draft preparation, H.F.M.T., T.T. and O.M.; writing—review and editing, S.S. and M.I.; visualization, G.R. and M.I.; supervision, A.T. and P.M.; project administration, A.T., P.M. and S.S.; funding acquisition, A.T., P.M. and S.S. All authors have read and agreed to the published version of the manuscript.
Funding
This research was funded by the Institute for Research and Community Services of Universitas Diponegoro (LPPM UNDIP) under the scheme International Publication Grant (RPI) 2024, grant number 569-169/UN7.D2/PP/IV/2023.
Data Availability Statement
The datasets generated and analyzed during the current study are available from the corresponding author upon reasonable request.
Conflicts of Interest
The authors declare no conflicts of interest.
References
- Li, L.; Xu, P.; Xu, W.; Lu, B.; Wang, C.; Tan, D. Multi-field coupling vibration patterns of the multiphase sink vortex and distortion recognition method. Mech. Syst. Signal Process. 2024, 219, 111624. [Google Scholar] [CrossRef]
- Tan, Y.; Ni, Y.; Xu, W.; Xie, Y.; Li, L.; Tan, D. Key technologies and development trends of the soft abrasive flow finishing method. J. Zhejiang Univ. Sci. A 2023, 24, 1043–1064. [Google Scholar] [CrossRef]
- Trimulyono, A.; Fuadi, M.A.; Zakki, A.F.; Mursid, O.; Iqbal, M. Design of Anti-Capsize Ship for Patrol Vessel with the Self-Righting Moment. J. Mar. Sci. Eng. 2023, 1, 133. [Google Scholar] [CrossRef]
- Bai, T.; Ding, Z.; Wang, X.; Zhang, Z.; Zhang, F. Theoretical Analysis of the Performance of a Self-Righting Boat. In Volume 1: Offshore Technology; American Society of Mechanical Engineers: New York, NY, USA, 2017. [Google Scholar] [CrossRef]
- Putra, A.B.C.; Hasanudin, H. Desain Self-Righting Rescue Boat Untuk BASARNAS. J. Tek. ITS 2019, 2, G99–G105. [Google Scholar] [CrossRef]
- Trimulyono, A.; Zakki, A.F.; Fuadi, M.A. Experimental Study of a Ship with the Self-Righting Moment in Extreme Condition. In IOP Conference Series: Earth and Environmental Science; IOP Publishing: Bristol, UK, 2022; Volume 1081, p. 012006. [Google Scholar] [CrossRef]
- Liu, L.; Chen, M.; Wang, X.; Zhang, Z.; Yu, J.; Feng, D. CFD Prediction of Full-Scale Ship Parametric Roll in Head Wave. Ocean. Eng. 2021, 233, 109180. [Google Scholar] [CrossRef]
- Xu, S.; Gao, Z.; Xue, W. CFD Database Method for Roll Response of Damaged Ship during Quasi-Steady Flooding in Beam Waves. Appl. Ocean Res. 2022, 126, 103282. [Google Scholar] [CrossRef]
- Liu, L.; Yao, C.; Feng, D.; Wang, X.; Yu, J.; Chen, M. Numerical Study of the Interaction between the Pure Loss of Stability, Surf-Riding, and Broaching on Ship Capsizing. Ocean Eng. 2022, 266, 112868. [Google Scholar] [CrossRef]
- Jianfeng, L.; Han, Y.; Su, Y.; Wang, Y.; Zhang, Z.; Jiang, R.Q. Hydrodynamic Performance of a Magnus Anti-Rolling Device at Zero and Low Ship Speeds. Ocean Eng. 2021, 229, 109008. [Google Scholar] [CrossRef]
- Jianfeng, L.; Guo, C.; Zhao, D.; Han, Y.; Su, Y. Hydrodynamic Simulation for Evaluating Magnus Anti-Rolling Devices with Varying Angles of Attack. Ocean Eng. 2022, 260, 111949. [Google Scholar] [CrossRef]
- Jianfeng, L.; Hua-Dong, Y.; Yang, H.; Yumin, S. Shape Optimization and Hydrodynamic Simulation of a Magnus Anti-Rolling Device Based on Fully Parametric Modeling. Phys. Fluids 2023, 35, 5. [Google Scholar] [CrossRef]
- Zhang, Y.; Hu, J.; Ma, S.; Wang, P. Anti-Rolling Analysis and Resistance Optimization of a New Anti-Rolling Hydrofoil for the Trimaran Vessel. Ocean Eng. 2023, 272, 113837. [Google Scholar] [CrossRef]
- Lee, G.J.; Hong, J.; Lee, K.K.; Kang, H.J. Application of Buoyancy Support System to Secure Residual Buoyancy of Damaged Ships. J. Mar. Sci. Eng. 2023, 3, 656. [Google Scholar] [CrossRef]
- Biran, A.; López-Pulido, R. Ship Hydrostatics and Stability; Elsevier: Amsterdam, The Netherlands, 2014. [Google Scholar] [CrossRef]
- Barrass, C.B.; Derrett, D.R. Ship Stability for Masters and Mates; Elsevier: Amsterdam, The Netherlands, 2012. [Google Scholar] [CrossRef]
- Menter, F.R. Two-Equation Eddy-Viscosity Turbulence Models for Engineering Applications. AIAA J. 1994, 8, 1598–1605. [Google Scholar] [CrossRef]
- Hirt, C.W.; Nichols, B.D. Volume of Fluid (VOF) Method for the Dynamics of Free Boundaries. J. Comput. Phys. 1981, 1, 201–205. [Google Scholar] [CrossRef]
- Mancini, S.; Begovic, E.; Day, A.H.; Incecik, A. Verification and Validation of Numerical Modelling of DTMB 5415 Roll Decay. Ocean Eng. 2018, 162, 209–213. [Google Scholar] [CrossRef]
- Brigham, E. The Fast Fourier Transform and Its Applications; Prentice Hall: Hoboken, NJ, USA, 1988. [Google Scholar]
- Celik, I. Procedure for Estimation and Reporting of Uncertainty Due to Discretization in CFD Applications. J. Fluids Eng. 2008, 7, 078001. [Google Scholar] [CrossRef]
- Richardson, L.F. The Approximate Arithmetical Solution by Finite Differences of Physical Problems Involving Differential Equations, with an Application to the Stresses in a Masonry Dam. Philos. Trans. R. Soc. Lond. Ser. A Contain. Pap. A Math. Phys. Character 1911, 459–470, 307–357. [Google Scholar] [CrossRef]
Disclaimer/Publisher’s Note: The statements, opinions and data contained in all publications are solely those of the individual author(s) and contributor(s) and not of MDPI and/or the editor(s). MDPI and/or the editor(s) disclaim responsibility for any injury to people or property resulting from any ideas, methods, instructions or products referred to in the content. |
© 2024 by the authors. Licensee MDPI, Basel, Switzerland. This article is an open access article distributed under the terms and conditions of the Creative Commons Attribution (CC BY) license (https://creativecommons.org/licenses/by/4.0/).