Article

System Design and Stress–Strain Analysis for Cranking and Motoring Small-Size Engines

by
Giovanni Cecere
1,2,
Adrian Irimescu
1,* and
Simona Silvia Merola
1
1
CNR–STEMS Science and Technology Institute for Sustainable Energy and Mobility, 80125 Napoli, Italy
2
Department of Energy (DENERG), Politecnico di Torino, 10129 Torino, Italy
*
Author to whom correspondence should be addressed.
Designs 2024, 8(1), 14; https://doi.org/10.3390/designs8010014
Submission received: 19 December 2023 / Revised: 22 January 2024 / Accepted: 25 January 2024 / Published: 29 January 2024
(This article belongs to the Topic Multi-Energy Systems, 2nd Volume)

Abstract

:
The characterization of small-size engines requires dedicated rigs that are usually used for loading the power unit. Adding the possibility of motoring the engine is an important advantage that allows more detailed information on operating characteristics. It can be used for obtaining precious data that contribute to the development of more accurate numerical models and subsequent validation. Cost competitiveness is another essential aspect of small-size engines, given that development efforts need to be contained as much as possible. Within this context, the present work developed and tested a setup capable of cranking and motoring a small-size 50 cc spark ignition engine. Two configurations were considered for coupling an electric motor to the power unit: the first through a pulley-belt transmission and the second via a plastic clutch assembly. The main idea was to ensure the capability of motoring the engine up to a rotational velocity of 6000 rpm. Engine load was applied through a 1 kW electric generator connected directly to the crankshaft. The overall setup was designed in the two configurations and a stress–strain analysis was performed. The belt-driven option was found to be more favorable in terms of mechanical component requirements, showing a safety factor of around 4.0, while the plastic clutch assembly involved a more complex design phase and turned out to be more demanding, with a safety factor of around 2.9.

1. Introduction

Nowadays, in a global context of constant research for new and alternative energy sources aimed at tackling polluting emissions effects [1], the continued development of ever more complex technologies and control strategies for the improvement of internal combustion engines (ICEs) and their sustainability still represents a central target [2]. This applies to the two main types of such power units, i.e., spark ignition (SI) and compression ignition (CI) engines. Coupling with one or more electric motors (i.e., hybrid architecture) remains a viable intermediate solution for improving the efficiency of automotive powertrains before complete replacement [3,4], a process that would take several years and will not necessarily cover all road sectors [5]. An internal combustion engine is characterized by a multitude of parameters that define its working conditions and related output performance [6]. Crankshaft rotation speed, intake and exhaust valve timing, and injection and ignition strategies are just some of the control parameters that exert a direct influence on the quality of combustion and emission processes. For studying the phenomena related to ICE operation, dedicated rigs are often designed and set up, with a focus on the degree of understanding intended for the actual application [7]. Characterizing engine performance can be performed in motored and firing conditions [8,9] that is usually achieved by coupling the power unit to an electric machine (EM). The detailed understanding of underlying phenomena such as intake pressure profile, ignition strategy, and injection timing can ensure additional margins to improve the accuracy of numerical models within which the sensitivity of the single control components can be studied in a cost-effective way through simulations [10]. In addition, within the context of a need for reducing emissions, the correct characterization of related phenomena is fundamental for addressing the environmental impact of ICEs [11,12]. This aspect is becoming ever more prominent for diesel power units, with particulate matter and related control systems becoming ever more complex [13].
As previously mentioned, ICEs are often connected to an EM and for most cases, there are two configurations that can be considered: using two crankshafts connected on the same axis or using a belt-driven solution [14]. The first category allows to directly connect the two power units, normally using a metallic/rubber joint component [15] or employing a clutch-based system [16]. A joint configuration is normally preferred thanks to its relatively easy assembly concept and low design costs, even if several aspects need to be covered such as the analysis of joints used for sub-ensembles [17]. On the other hand, the latter limits the rotational speed of the engine to that of the electric machine and does not allow mechanical decoupling. A clutch-based solution features the characteristic of the same rpm for the two components, and has the advantage that it ensures the decoupling of the shafts, but it requires a more complex design [18,19]. The literature widely covers its design and structural validation for practical applications [20,21] but shows limited use for engine test benches [22]. As for the belt-coupling configuration, its main advantage comes from the possibility of using pulleys with different gear ratios, thus ensuring the option of combining ICEs and EMs with a different rpm range. This advantage can be of significant importance for, e.g., small-size engines that need to be run at high rpm [23] but usually feature reduced torque and can therefore be coupled with cost-effective high-torque/low-rpm EMs. The actual design of belt-coupling solutions has remained essentially unchanged for decades [24], even if their main limitation is the belt slip phenomenon that hinders its widespread diffusion in large displacement power units (e.g., for trucks).
Regarding the EM component, the extensive application of magnetic bearings has been the subject of different studies aimed to predict their dynamic behavior and structural strength. The absence of contact, friction, and lubrication makes this component suitable for high-speed operations, with a relatively reduced design complexity. On the other hand, depending on the type of magnetic bearings, i.e., active/non active, AC/DC driving current, it is necessary to employ an optimized control strategy, which still represents the main complexity in their control. In this regard, the available literature includes a large number of studies in which different algorithms were used to reduce the finite element analysis (FEM) computational efforts while experimental tests ensured the improved reliability and performance of the entire test bench [25,26].
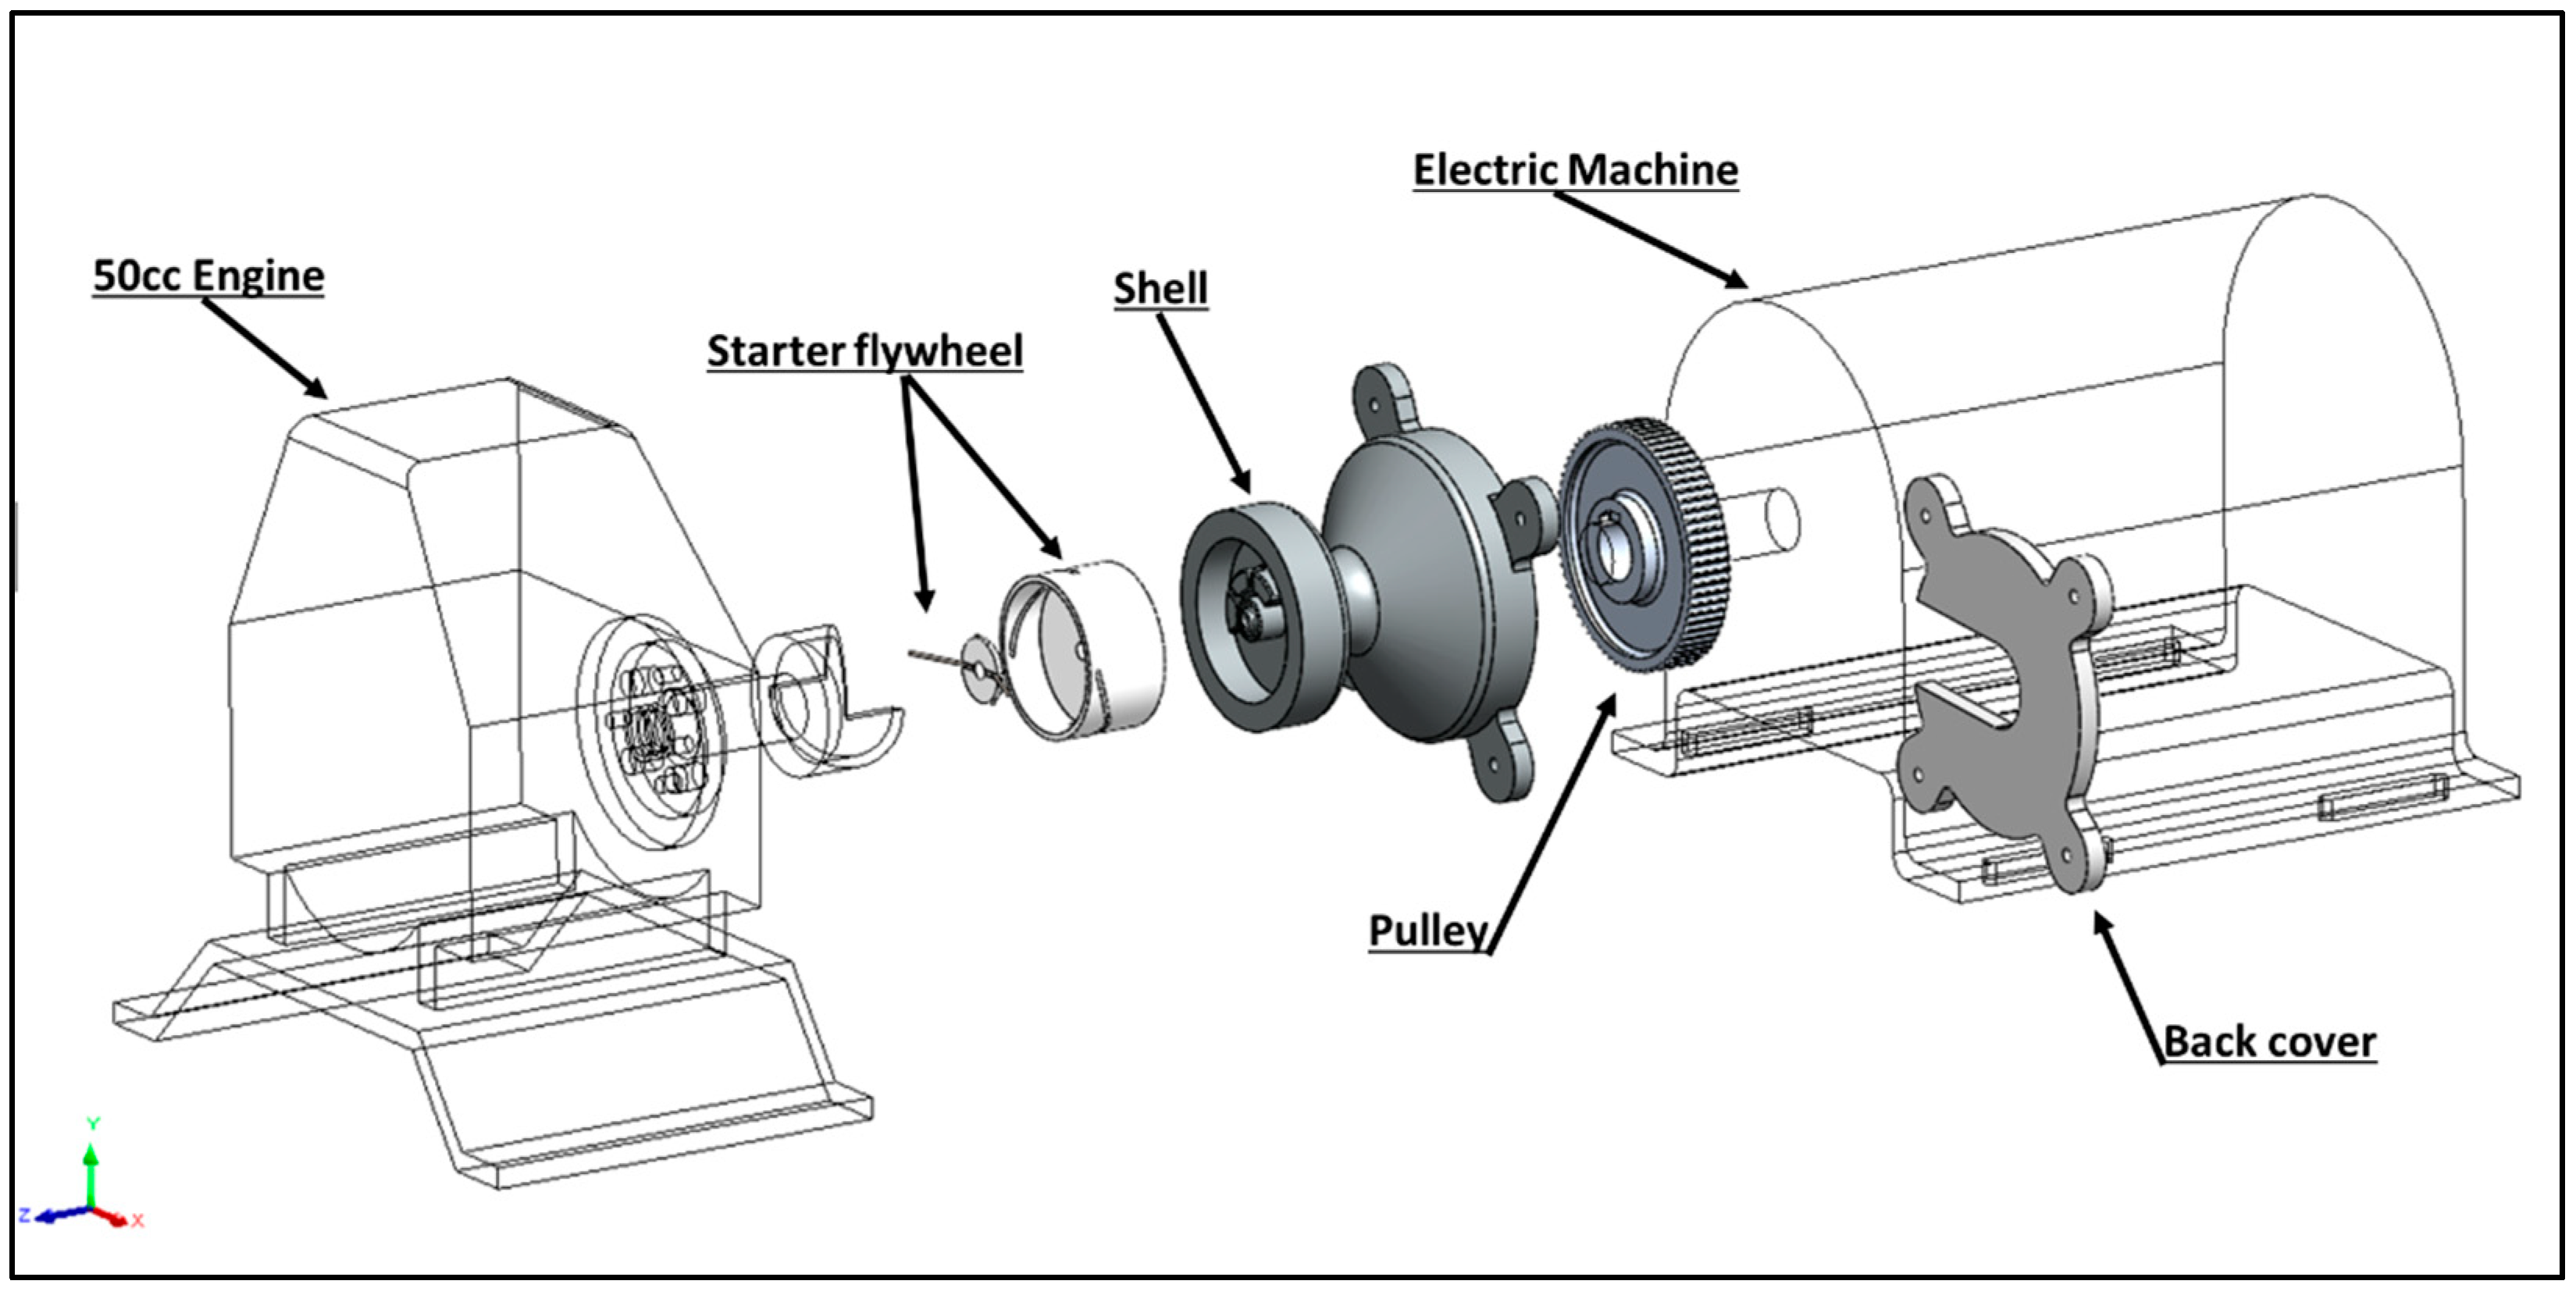
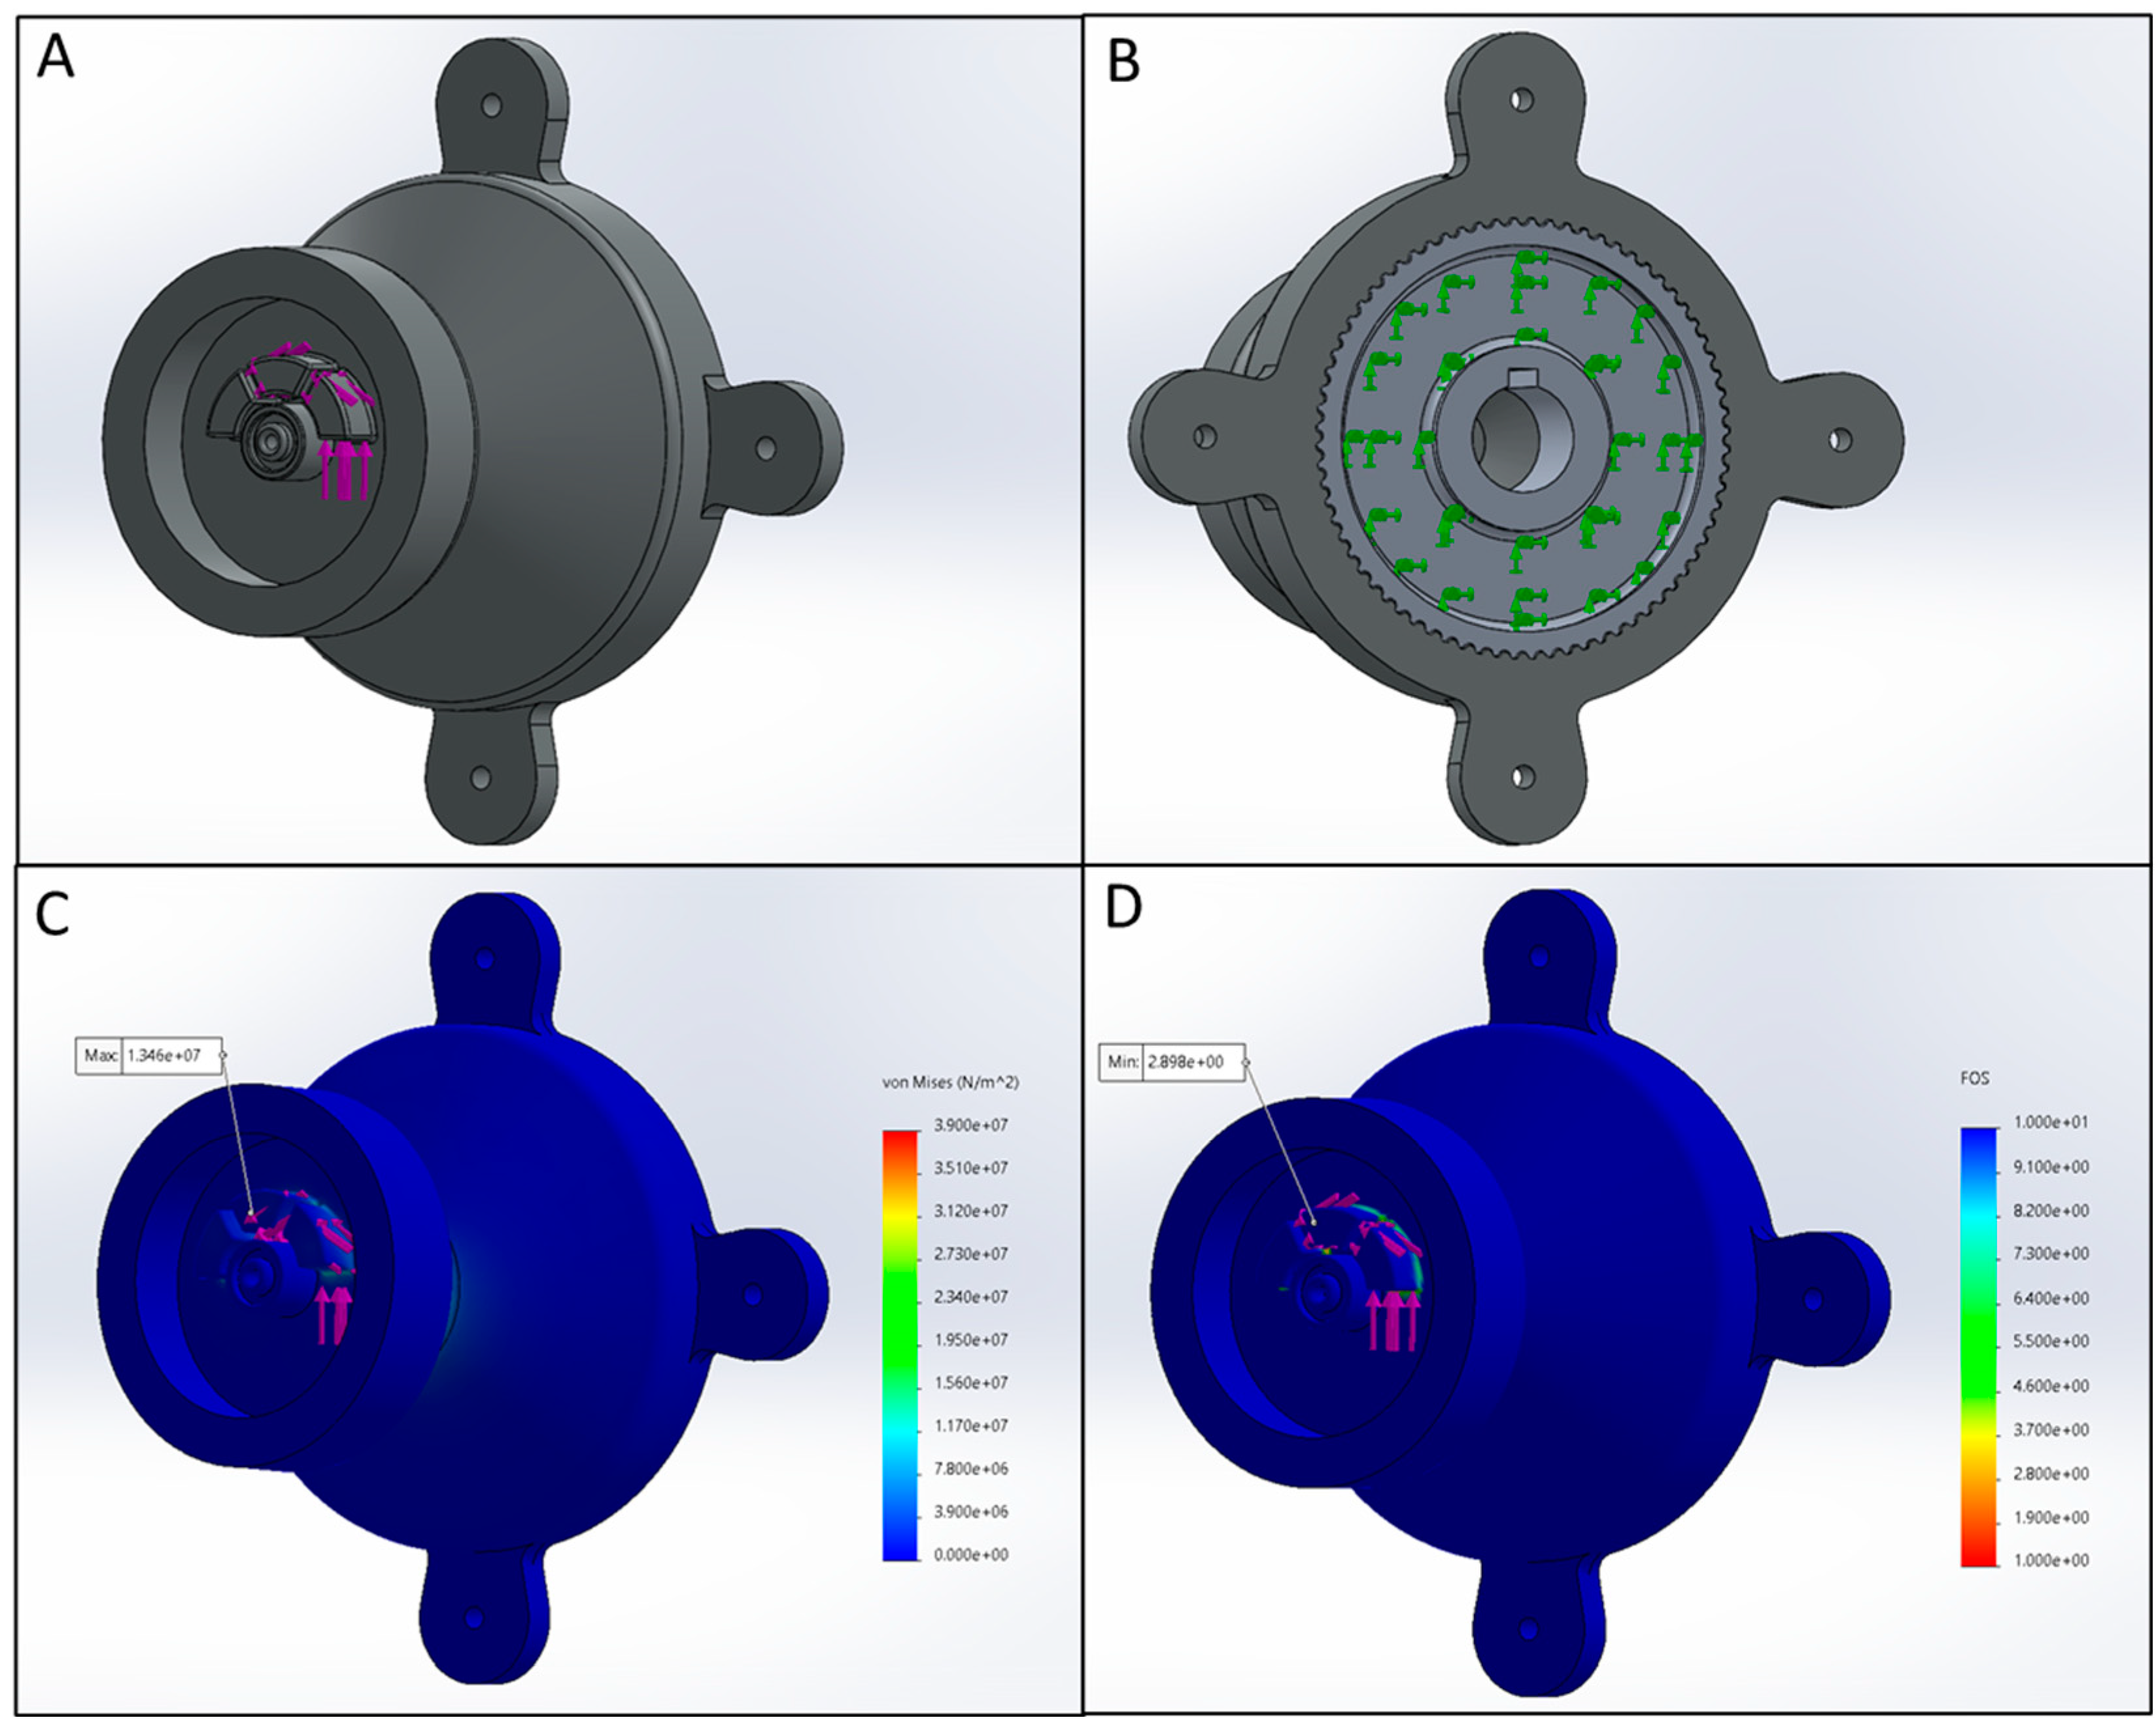
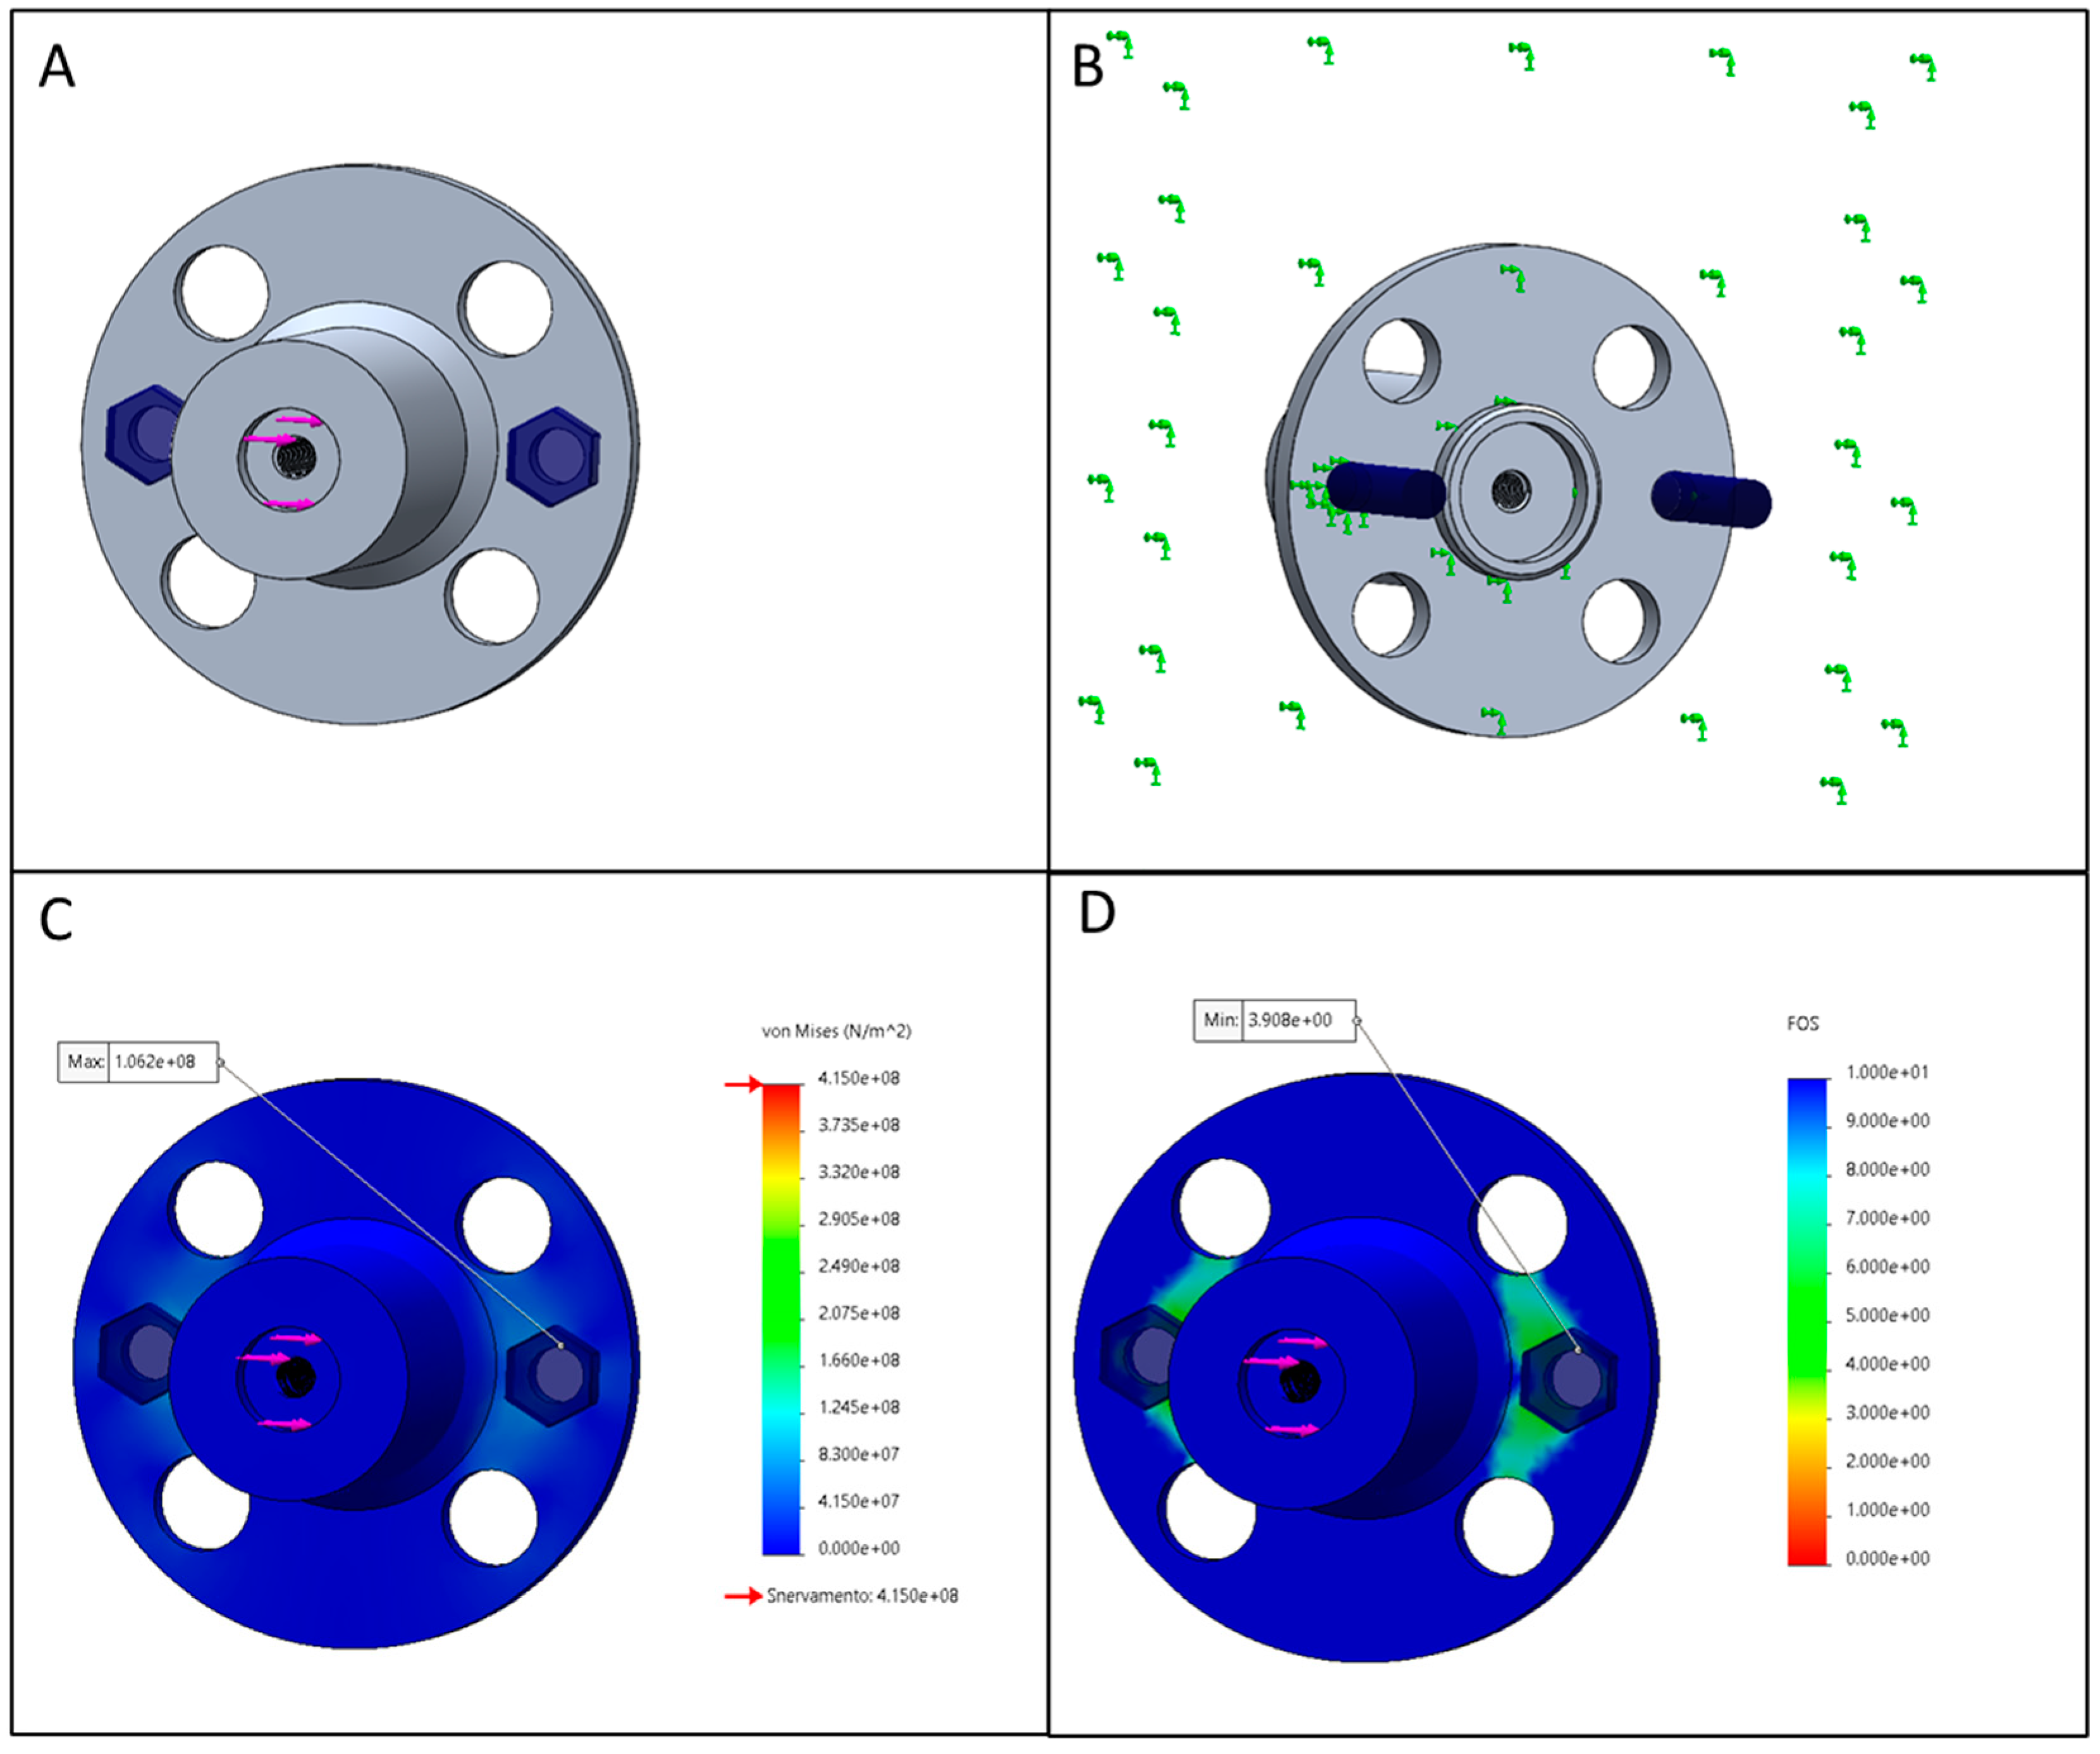
In this work, given the need to mechanically couple a small-size spark ignition (SI) engine capable of reaching high rotational speeds, two mechanical configurations were considered, i.e., clutch and belt-driven assemblies. Compared to studies present in the literature, this manuscript proposes the design of two cost-effective configurations with the lowest number of components possible, characterized by relatively simple geometries. In addition, the belt-driven configuration involved the design of a single metallic flange, while the clutch assembly demonstrated the suitability of using additive manufacturing for mechanical applications with a significant containment of cost. Once the new components were designed, a finite element analysis (FEM) was performed in order to assess the capacity to guarantee reliable safety factors for the various operating conditions in which they are intended to operate. The validation phase entailed the study of “worst case scenarios” in terms of applying load on the most critical sections of the new components. The two new configurations, i.e., a clutch-based system and a belt-driven solution with a gear ratio of 1 to 5, showed good reliability with safety factors well beyond the critical threshold, i.e., 4.0 for the clutch and around 2.9 for the belt-driven option. They were used to fully characterize the thermal unit so as to gain comprehensive understanding on air flow characteristics and in-cylinder processes, with data recorded for 42 operating points, including 7 firing conditions.

2. Experimental Setup

The experimental setup used for the current study included a small-size spark ignition (SI) engine (Honda GHX50) directly connected to a 1 kW electric generator (fitted with an inverter for a variable-speed generation of electricity); the power unit was capable of delivering a maximum output power of 1.6 kW at 7000 rpm and a torque of 2.7 Nm at 2500 rpm. The specifications of the thermal unit are listed in Table 1. In-cylinder and intake pressure were the two essential parameters used for characterization. Measurement devices included a low (absolute) pressure Bosch piezo-resistive sensor (0 261 230 029) that was mounted along the intake line after the throttling valve; accuracy was ±1% and this signal was used for referencing the in-cylinder pressure. Measurements inside the combustion chamber were performed with a piezo-electric pressure sensor integrated in the spark plug (AVL, ZI22) that features a pressure range of up to 200 bar and a linearity of ±0.3%. The second component of the setup was an electric generator capable of delivering 4 kW power at 1500 rpm when powered at 380 V; the inverter used for the trials was a 220 V unit that employs single-phase current to drive the three-phase electric motor. Even if the combination of the 220 V inverter with the electric motor results in peak power derating, the requirements for motoring the SI unit were more than covered.
The design of a mechanical connection between the engine and electric motor was approached by defining the operating conditions. Two regimes were identified: cranking (with relatively low rpm) and motoring (with a wide range of crankshaft rotational speeds). A simple evaluation of frequency during engine cranking with a pull starter revealed that an rpm of around 1000 rev/min ensures appropriate combustion initiation at temperatures as low as 15 °C even without closing the choke valve. As such, the direct coupling of the engine and motor would ensure the cranking regime; it was evident, however, that once the engine started, the two components would have to be decoupled. This mode of operation would ensure automated engine start-up, an essential advantage in light of applications such as powering remote appliances without supervision.
Motoring, on the other hand, cannot be ensured within the entire range of the engine without rpm multiplication. Therefore, a pulley-belt assembly would be appropriate for motoring the SI unit even up to the peak power speed of 7000 rpm; in theory, this setup could also be used during firing, but attempts in this direction revealed that the control unit of the engine–generator assembly could not achieve stable operation. This was due to the fact that once the engine was started, the inverter that controls the motor would go into over-run mode and shutdown; the additional load of the electric motor (mainly due to its cooling fan) was simply too high for the engine control unit to successfully achieve stable operation. Even if the wide rpm range could be achieved only in motored mode, the information that was recorded in this way allowed the calibration of the throttle valve flow coefficient.

3. CAD Model Design

3.1. Clutch Assembly

The starting point for designing the direct coupling setup (denominated as the clutch assembly) for the EM–SSICE (i.e., Electric Machine–Small-Size Internal Combustion Engine) was to define the geometric characteristics of the two components, with a focus on the drive shafts and their positioning. In this regard, in order to align the two components at the same height, a base was designed for the thermal unit, made of plastic material.
Once the two shafts were correctly positioned, it was decided to use the official equipment manufacturer (OEM) pull-starter mechanism (Figure 1) for transferring torque from the EM to the engine during cranking and then decoupling the two once firing was achieved (i.e., once the rpm of the SI unit was over that of the EM). For this purpose, an external “shell” (Figure 2) that contains the mechanism was designed, along with a coupling that fits the shell to the EM shaft. Allowing quick switching from one setup to the other would also be beneficial, and so it was decided to couple the shell with the pulley that was fitted to the EM shaft. Given that the CAD model of the pulley was not available, the “shell” was designed through a reverse engineering technique. Therefore, starting from the known geometric characteristics like the number of teeth, pitch, and external diameter, a model of the pulley was re-created in the SolidWorks (SWs) environment and subsequently, thanks to the extruded cutting function, the component “footprint” was obtained. The additive manufacturing accuracy was found to be around 1 mm for large diameters, and so it was decided to allow increased tolerance for the inner shell diameter.
Figure 2 gives an overview of the geometry of the “shell” and how it is mechanically joined with the pulley mounted on the electric generator shaft at the rear and the starter mechanism housed at the front. From the front view, it can be noted that within the seat, there are three extruded teeth intended to lock the external component. In addition, along the axis, there is a carved cylindrical section where the screw is fitted to hold the flywheel in position, and it should be noted that the central region is slightly raised with reference to the surrounding surfaces (Figure 2, detail B). This gap, coupled with the clearance left by the screw, is of paramount importance to ensure that the two metal tabs of the flywheel subgroup are free to rotate, depending on the operative mode.
As previously mentioned, the OEM pull-starter mechanism was used for cranking purposes, and so the component was reproduced in the SWs environment. Therefore, the mechanical connection between the starter flywheel and the electric machine was obtained by designing a seat in the shell to house the component. The mechanism was fixed within the shell, applying an epoxy resin to further improve the overall strength of the coupling. Figure 3 shows an expanded view of the clutch assembly. The working principle of the coupling–decoupling system is based on the free motion of the subcomponent mounted on the starter mechanism, on which there are two metal tabs. Indeed, during the start-up phase, the starter mechanism is free to rotate, thanks to the clearance left by the screw. Therefore, the inertia causes the two metal tabs to rotate in the opposite direction with respect to the shaft, thus leading them to the end of the guideway carved in the outer edges. In this way, they go in the “lock” position where they make contact with flange that is fixed on the shaft of the thermal unit (Figure 4). The two units are mechanically connected when the metal tabs are in this position, and the ICE is running in cranking/motored condition. At this point, when the fuel supply line and ignition are activated (i.e., fuel flows through the carburetor and the rpm overcomes the minimum threshold for generating a discharge at the spark plug electrodes), the engine will switch to the firing operating condition, thus quickly reaching higher velocities than those of the electric machine (i.e., around 4000 rpm during idling compared to the maximum 1500 rpm of the EM). Therefore, the two metal tabs will be moved from the lock position back to the opposite end of the guideway, no longer in contact with the shaft flange of the thermal unit.

3.2. Pulley-Belt Assembly

The second option, the belt-driven assembly, involved a minor design effort, as the sole component to design was the flange required to house the small-diameter pulley on the SI unit. The basic principle is that the difference in diameter determines the higher rpm at the engine end. A toothed pulley-belt assembly was chosen, with 14 teeth for the small diameter pulley and 72 for the large one; the pitch was 5 mm. Therefore, the peak EM rotational speed of 1500 rpm ensures a speed of over 7700 rpm at the engine crankshaft; the frequency setting for the inverter was adjusted so as to achieve the desired engine rpm, between 500 and 6000 rpm. Naturally, given the high rpm and expected mechanical stresses acting on the flange connected to the small pulley, an aluminum alloy was chosen in order to guarantee safe and reliable operations. Figure 5 illustrates the new component so designed. The back of the flange was designed starting from the existing profile of the OEM engine flange, to match the guidelines of the screws and the centering bolts. A screwed hole was made along the cross section of the flange to allow the connection with the pulley. In order to improve the fatigue strength, a chamfer was practiced at the base of the diameter of the central body. Figure 6 displays the belt assembly layout.

3.3. FEM Analysis

Once the new components were designed, a finite element analysis (FEM) was performed in order to assess the capacity to guarantee reliable safety factors for the various operating conditions. It was decided to use acrylonitrile butadiene styrene (ABS) material to construct the clutch assembly, for the easier application of additive manufacturing [27], with a decisively cost-effective approach. During engine cranking, the highest stress is the initial phase, when the EM is accelerating. The direct contact between the EM and the SI unit is ensured through the two metal tabs. Given that ABS has a lower material strength, it is plausible to assume that the most critical component is the shell. Another critical aspect to consider with plastic materials is that commonly the manufactures do not provide several details on the mechanical properties, and thus wider margins need to be considered, with data generally available in the literature. For this study, a series of properties were taken to be equal to the average values suggested in the literature (i.e., a modulus of elasticity of 1685 N/mm2, a Poisson coefficient of 0.394, a shear modulus of 319 N/mm2, a density of 1020 kg/m3, and a yield strength of 39 N/mm2 [28,29]), with a conservative approach in order to avoid the overestimation of mechanical properties. With respect to the load and the way it was applied to the component, it was chosen on the basis of the engine specifications provided by the manufacturer. The GXH50 engine (in the version coupled to the EU10i generator) delivers a maximum net torque of around 2.7 Nm at 2500 rpm [30], but during the start-up phase, it is plausible to assume a higher resultant force acting on the flywheel, and thus on the shell.
It was decided to apply a calculated force, corresponding to five times the maximum torque that the engine can deliver, on the teeth carved in the shell (Figure 7A). Therefore, hypothesizing an instantaneous torque of 13.5 Nm acting during the contact phase, and given that the average distance of the teeth surface from the rotation axis is known, a total force of 750 N was applied to the surfaces of the teeth. In parallel, an opposite force was applied, to simulate the braking action of the electric machine by locking the rear face of the pulley, as shown in Figure 7B. The static stress analysis confirmed that the inner teeth are critical for the design of the component as the maximum stress takes place at their base, reaching a value of 13.7 N/mm2; this value still ensures a good margin with respect to the Von Mises yield strength value (it should be noted that Figure 7C features a scale of 20:1 to highlight the deformation). The lowest safety factor was indeed found to be at the same points in which it was hypothesized from the beginning, with a value of around 2.9 (Figure 7D). It should be noted that the presence of the epoxy resin was not considered for the current analysis; thus, it is reasonable to assume that the true safety factor is much higher. However, after implementing the static approach, it was not possible to proceed with the fatigue stress analysis due to the lack of literature data on the behavior of such plastic materials, with common cycle–stress curves being quite different from one investigation to another.
The belt-pulley assembly involved the stress analysis on the flange, which is made of aluminum alloy, thus with known properties and the possibility to extend the investigation to the fatigue influence on the component. The belt used was a 750-5M-15-PROTORQUE, for which a pre-load of 130 N is suggested by the manufacturer [31]. Nevertheless, similarly to the clutch case, a cautionary approach was also considered for this case, by imposing a force of 300 N along the edge of the pulley seat carved in the flange. Then, in line with the system layout, the force was directed towards the other pulley mounted on the electric machine, parallel to the belt. It is noteworthy to say that during normal operations, the flange rotates; hence, it is credible to assume that the mechanical stresses are discharged homogeneously at the base.
Nevertheless, it was not possible to simulate the load action on the component while rotating, and thus the following analysis can be viewed as a rough investigation of the capacity of the component to ensure reliable safety factors in the worst condition with respect to the load that can be applied. The action of the two bolts was reproduced in SWs (Figure 8A) by setting a cylindrical edge corresponding to the location of the head and a “dummy” wall to simulate the threaded cylindrical surface. In addition, a dummy wall was also used to avoid the interpenetration of the flange on the rear side (Figure 8B).
The static approach showed a maximum stress value of around 106 N/mm2 (Figure 8C), sufficiently below the yield strength value of the 2014-T6 aluminum alloy used for manufacturing the flange. As expected, the bolted holes correspond to the critical points, but as already anticipated, given the rotary motion of the flange, the stress should be more homogenously distributed in a real operating condition. However, the lowest safety factor itself was detected on the edge of the bolt’s holes, with a value slightly less than 4 (Figure 8D), thus leaving a very good margin with respect to the critical conditions. After the analysis with the static approach, it was possible to perform a fatigue analysis by imposing 1 billion cycles with variable load, from 0 to 300 N per cycle. The software predicted excellent behavior for the aluminum flange, without evidencing any damage or relevant aging effects that could influence the component and its function.

4. 0/1D Numerical Model

Once the structural integrity of the new components was verified, they were manufactured and the experimental campaign was implemented. A 0D/1D model of the engine was built by using the GT-Suite software [32] so as to illustrate the potential of calibration and validation data that can be obtained with the two setups that were designed.
In order to achieve a satisfying accuracy, the engine was disassembled and the dimensions of each component were measured. The thermal unit features a single camshaft that determines the valve timings of both intake and exhaust sides. Therefore, the latter was hand-rotated, and the lift profiles measured step-by-step. Furthermore, particular attention was paid to the reproduction of the air filter behavior by changing the number and size of holes of the orifice component (Figure 9) in order to match the intake pressure traces as well as possible. The muffler mounted at the end of the exhaust line was simply modelled as an orifice component and, similar to the air filter, the number and size of holes were varied to simulate the backpressure action. However, it should be noted that once the muffler geometrical properties were calibrated, they were kept the same for all tests.
Figure 9 shows the components that were used in the model to represent the engine gas path (e.g., the intake line, passing through the cylinder and to the exhaust line) and the interaction with the crank train. The data recorded in motored conditions up to 1500 rpm were used for model validation by employing the simulated in-cylinder and intake traces. Several operative conditions with different degree of throttle valve opening were used to characterize the forward and reverse discharge flow coefficients. The choke valve was not included in the model, as it was open at all times during the experiments.
Considering the single-cylinder architecture, it was essential to correctly setup the length of subcomponents along the intake line, so as to best match the airflow fluctuations. The discharge coefficient (Cd) profile of the throttle component was adjusted to match the measured intake pressure trace, and then the compression ratio was varied to match the in-cylinder pressure traces recorded during motored operation (i.e., it is reasonable to assume that the effective compression ratio is lower due to increased piston-liner clearance). 
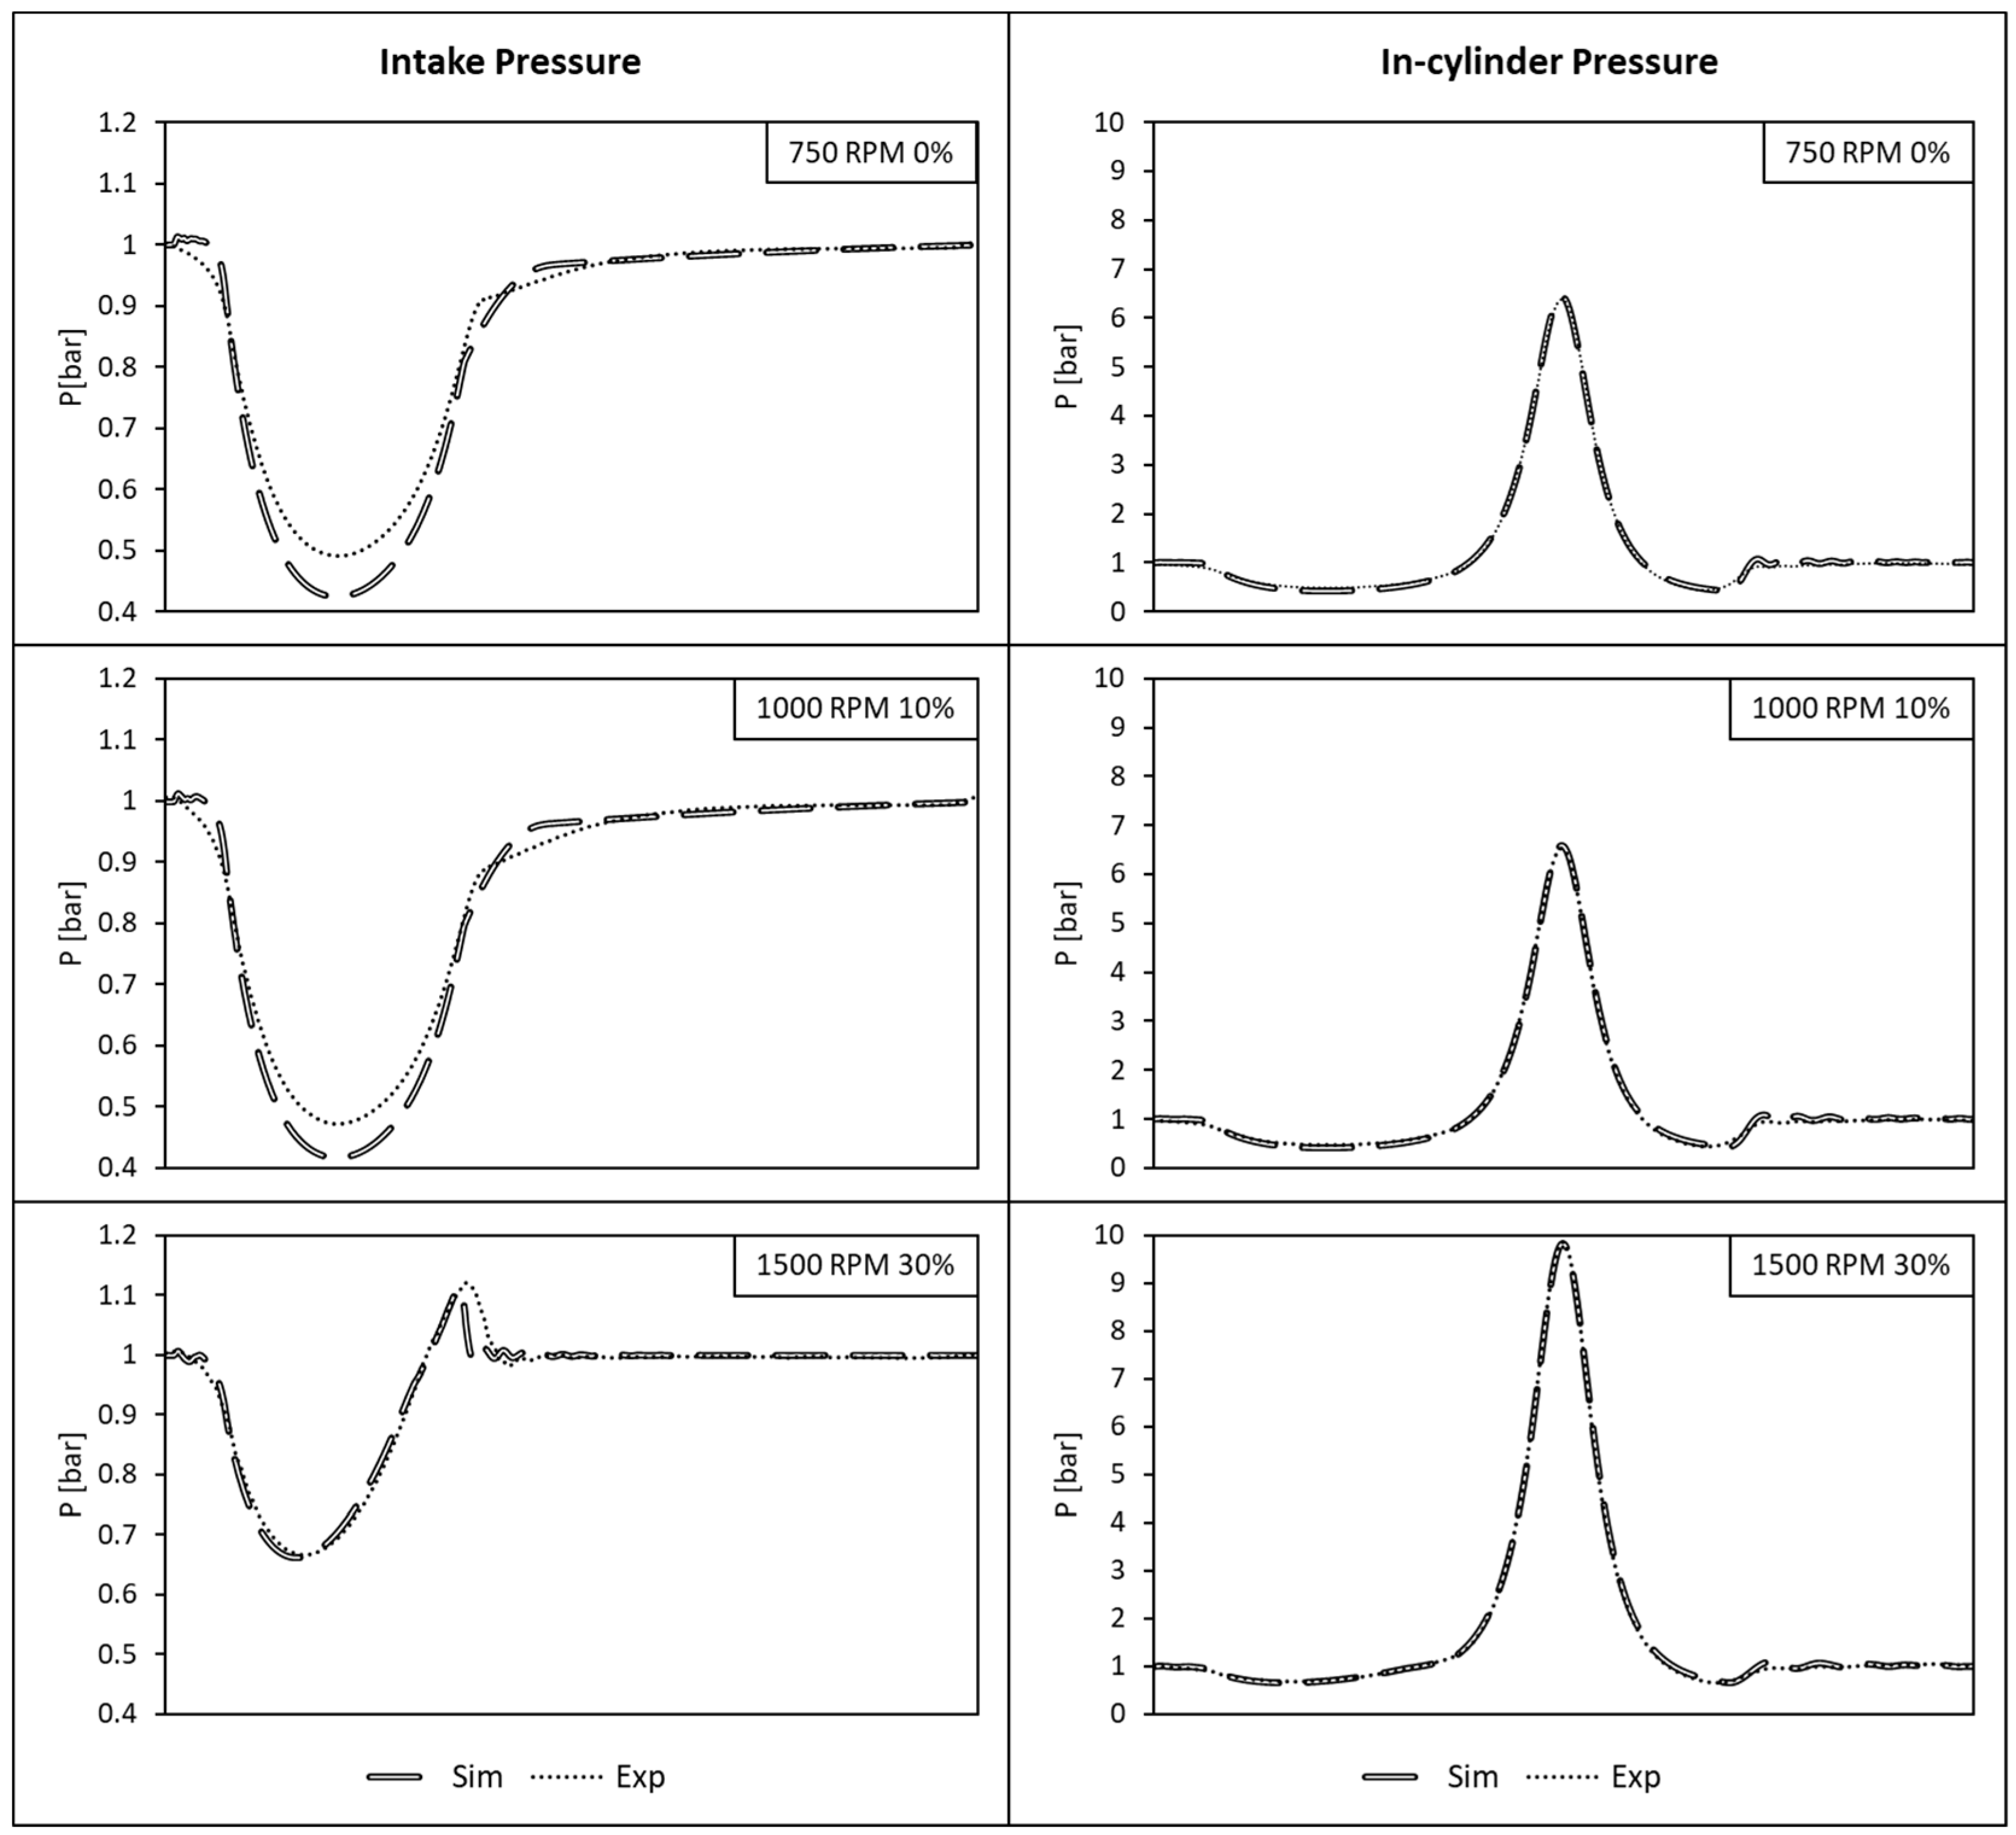
Figure 10 shows the comparison of measured and simulated in-cylinder and intake pressure traces, highlighting the good accuracy of the predicted results.
Indeed, focusing on the throttled conditions, it can be noted that the model correctly predicts the increasing pressure drop during the intake stroke as the throttle is closed. With respect to the intake pressure traces, the completely closed throttle situation features a maximum difference of around 65 mbar, while for the 30% opening, the two traces are almost identical. The accuracy of in-cylinder simulations was found to be more than acceptable for all three cases.

5. Cranking/Motoring Results

In this section, several engine tests are discussed, highlighting the benefits of using both mechanical connection layouts to fully characterize the thermal unit. For the sake of brevity, only the experimental data are shown. The principle behind the experimental campaign was to characterize a wider rpm range in motored conditions (e.g., data valuable for calibrating the parts of the model related to non-combustion predictions) and demonstrate cranking capabilities that ensured data in firing conditions.
Table 2 lists the conditions during which the intake and in-cylinder pressure were measured. One characteristic of the SI unit is that it features the electric actuation of the throttle. This is required by the variable generation mode, which ensures significant fuel economy benefits, especially during part load. Essentially, the throttle is controlled based on generator voltage feedback and rpm readings. More to the point, if load is applied to the generator, voltage tends to drop and the electronic control unit (ECU) responds by opening the throttle valve. If engine rpm drops below 4000 rpm (idle setting), the control unit also responds by opening the throttle. Actuation is achieved through a stepper motor and therefore there is no actual feedback on throttle position. During motored trials, the impulses from the OEM ECU were replaced with impulses generated using a National Instruments PCI DAQ, and the throttle position was estimated by dividing the number of pulses sent from a fully closed valve with the number of pulses required for opening the valve from 0 to 100%. Engine speed was calculated based on the signal generated by the ignition pulser; this signal was also used for cycle phasing, given that the unit features fixed ignition timing at 30° bTDC. The crank angle was interpolated by using a signal recorded on the generator line that features a sine wave with 14 zero crossings for each turn. Even if the accuracy of these measurements does not allow the precise determination of indicated performance, it ensures a good estimate of indicated mean effective pressure (IMEP).
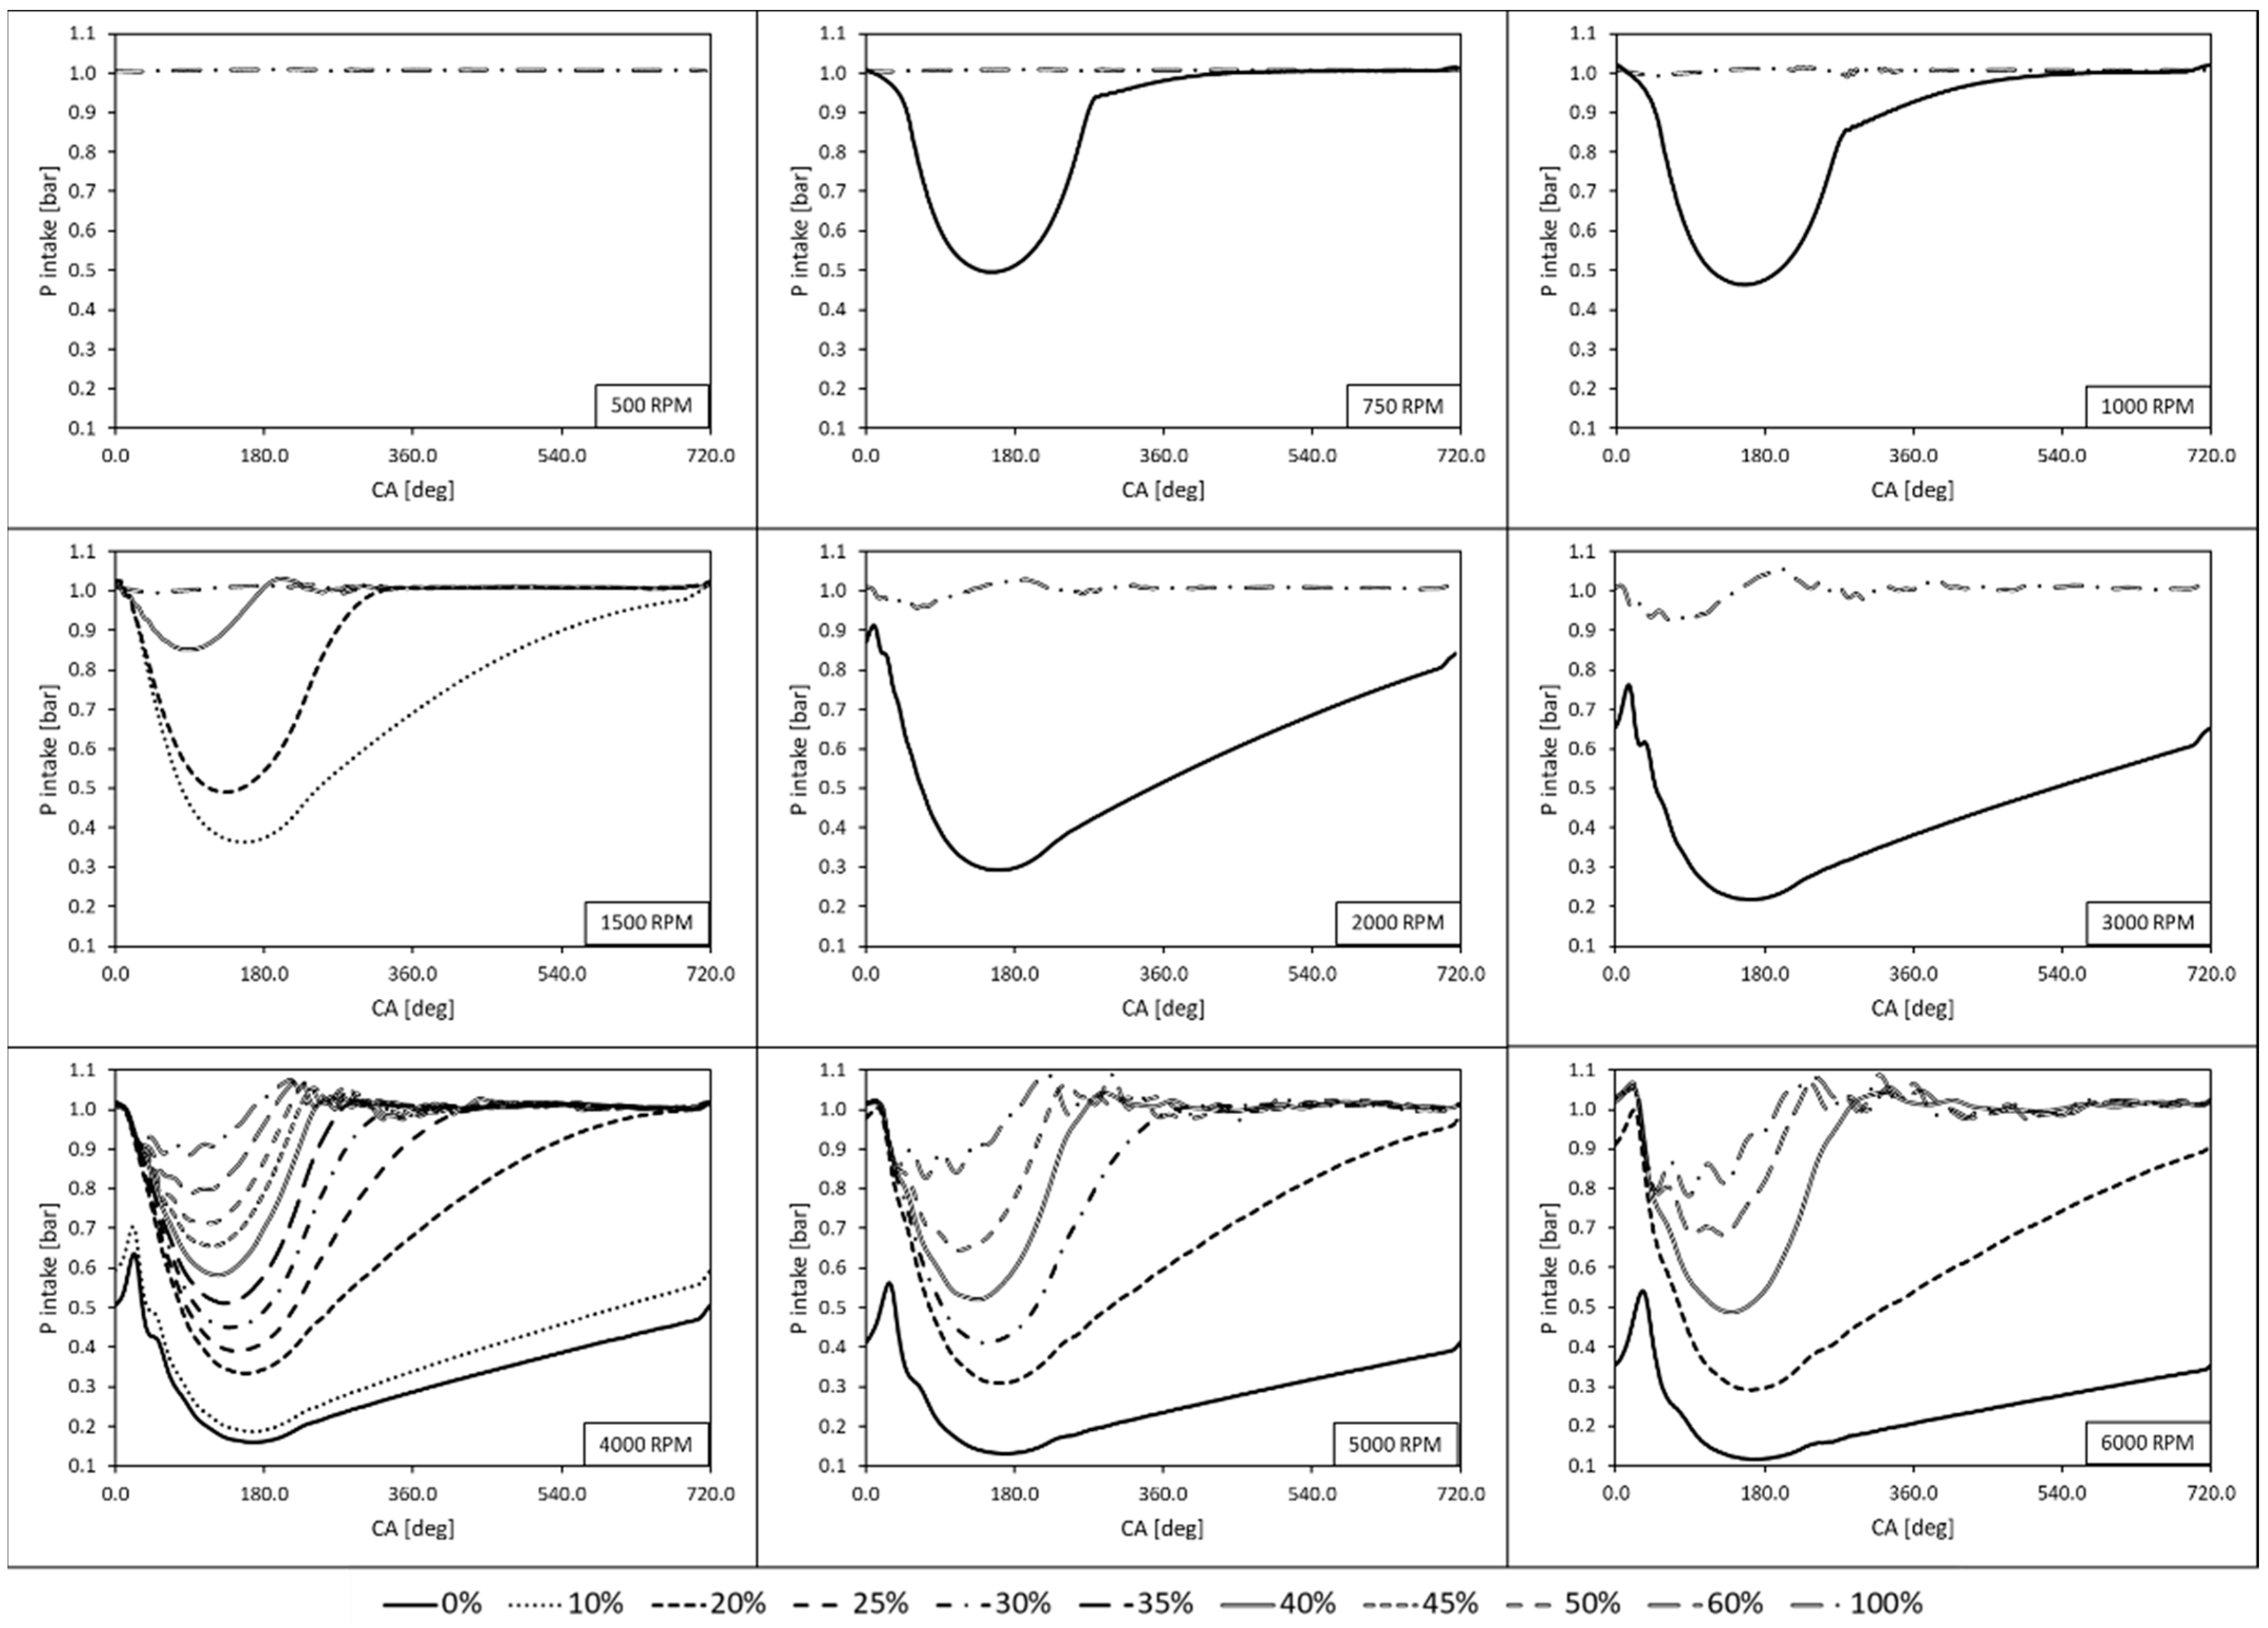
Figure 11 illustrates the intake pressure traces obtained by varying the throttle valve opening degree at different velocities of the crankshaft, with the engine motored by using the belt-coupling layout. As expected, the lower limit value reached by the pressure decreases as the velocity increases. This is mainly due to the lamination effect and the subsequent local low-pressure area which is found when throttling the engine. One interesting observation is that as velocity increases, the pressure fluctuation features various harmonics, even in wide open throttle conditions. This phenomenon can be mainly attributed to the combined effects of pressure waves coming from the cylinder chamber and the presence of the valve central body, the influence of which becomes increasingly evident as the speed increases. This also illustrates the highly pulsating nature of air flow due to the single-cylinder layout.
Once the intake pressure traces were acquired throughout the intended rpm range, the profiles shown in Figure 11 were used to obtain an estimate of throttle opening during firing conditions. This is essential in light of the specific cost-effective nature of small-size engine applications. More to the point, once the motored data can be used for estimating intake pressure (and, indirectly, engine load), a control strategy can be implemented for, e.g., fuel injection adjustment with an intake pressure sensor or throttle positioning sensor (or, to be more precise, by implementing a virtual sensor approach [33]). Once the data are employed for calibrating the 0D/1D model, a complete digital twin can be envisaged so as to develop control strategies and test their response in a wide range of possible situations.
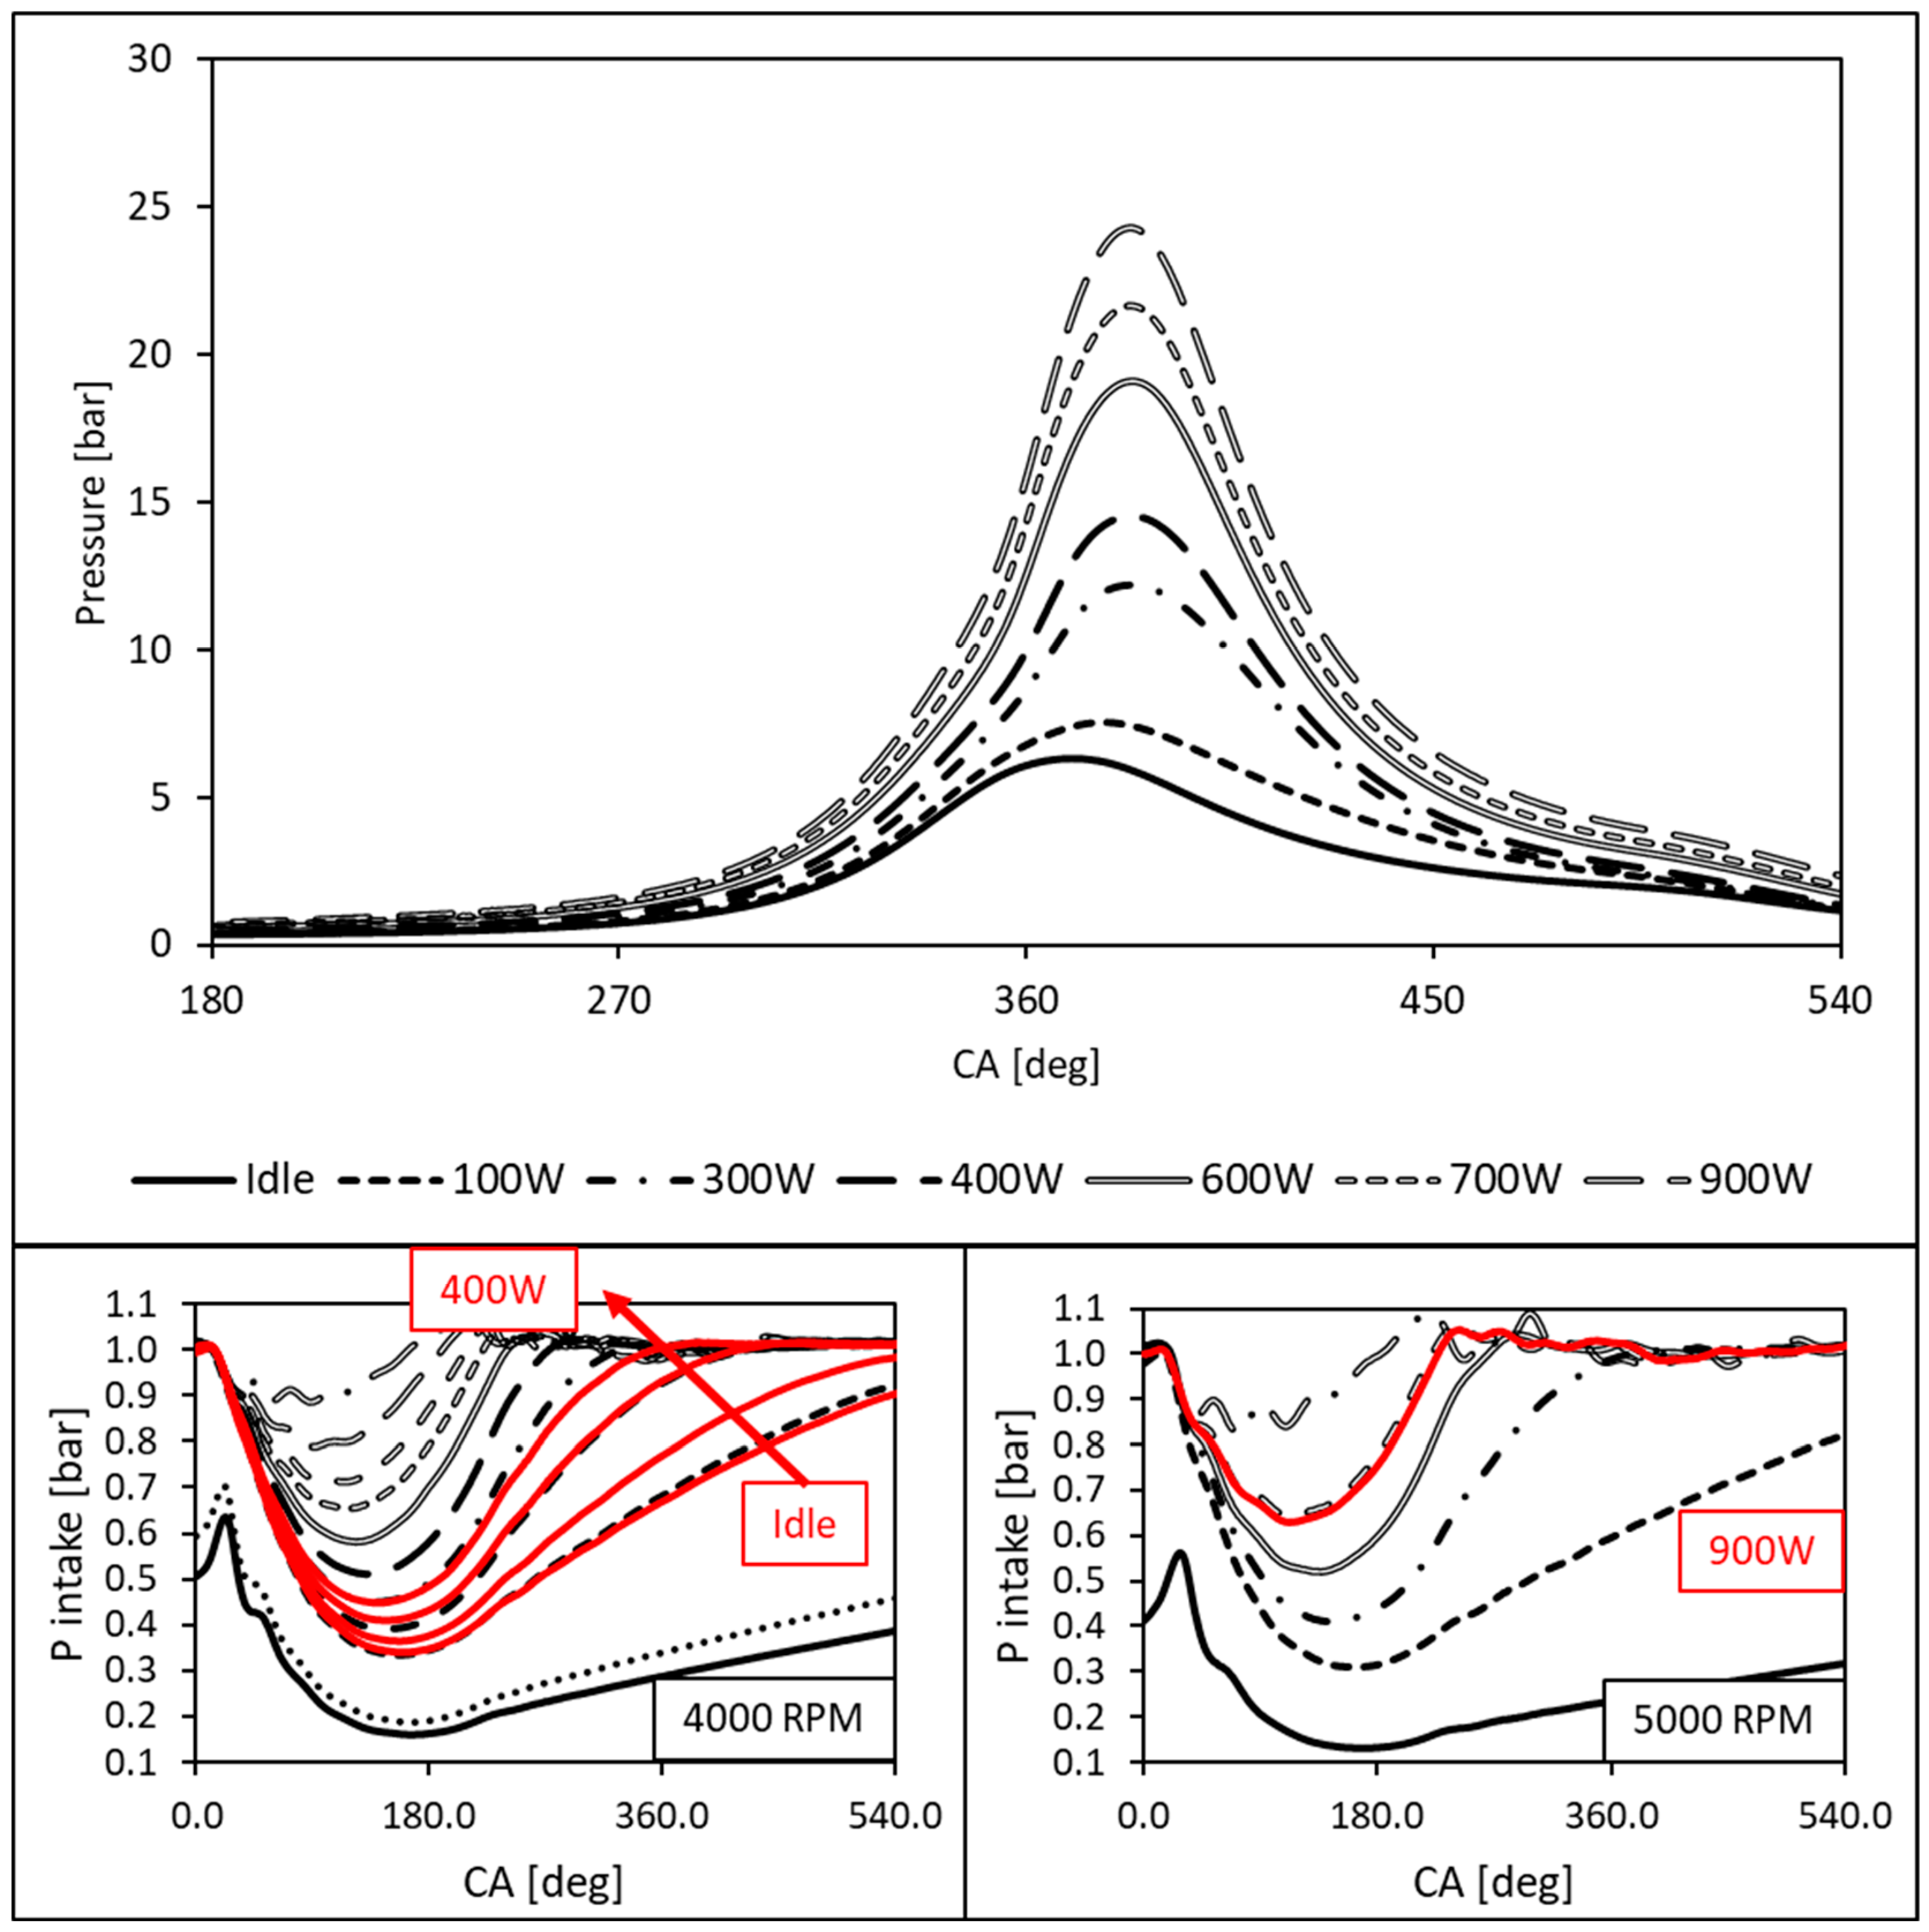
Figure 12 shows the in-cylinder pressure profiles (top) and intake traces (red solid lines, bottom) acquired with engine running in firing mode. An interesting result is that the intake pressure profile is within a narrow range with respect to the investigated motored trials. The idle, 100, 300, and 400 W load conditions correspond to the intake profiles between 20 and 30% valve opening, while the case of 900 W load corresponds to the 50% trace. A bilinear interpolation would be required for the other two cases at 600 and 700 W that were acquired with an engine speed of around 4500 rpm. However, as a first approximation and considering the relatively small variation in the intake pressure profiles when switching from 4000 to 5000 rpm (Figure 11), the 600 and 700 W traces fall in the range between 35 and 40% valve opening. The throttle position-intake pressure map for the complete rpm range can therefore be used for developing a virtual sensor that estimates engine load. This calculated parameter can be employed for adjusting fuel delivery more precisely compared to the carburetor, with important possible benefits in terms of fuel economy. A modified ignition system that adjusts spark timing could also be used for obtaining further benefits in terms of brake efficiency compared to the fixed timing approach.
SI engines that drive gensets are usually operated in throttled conditions, so as to ensure enough power excess (of around 30%) that provides the required control margins and the possibility of accelerating the engine even when the generator is at full load. 
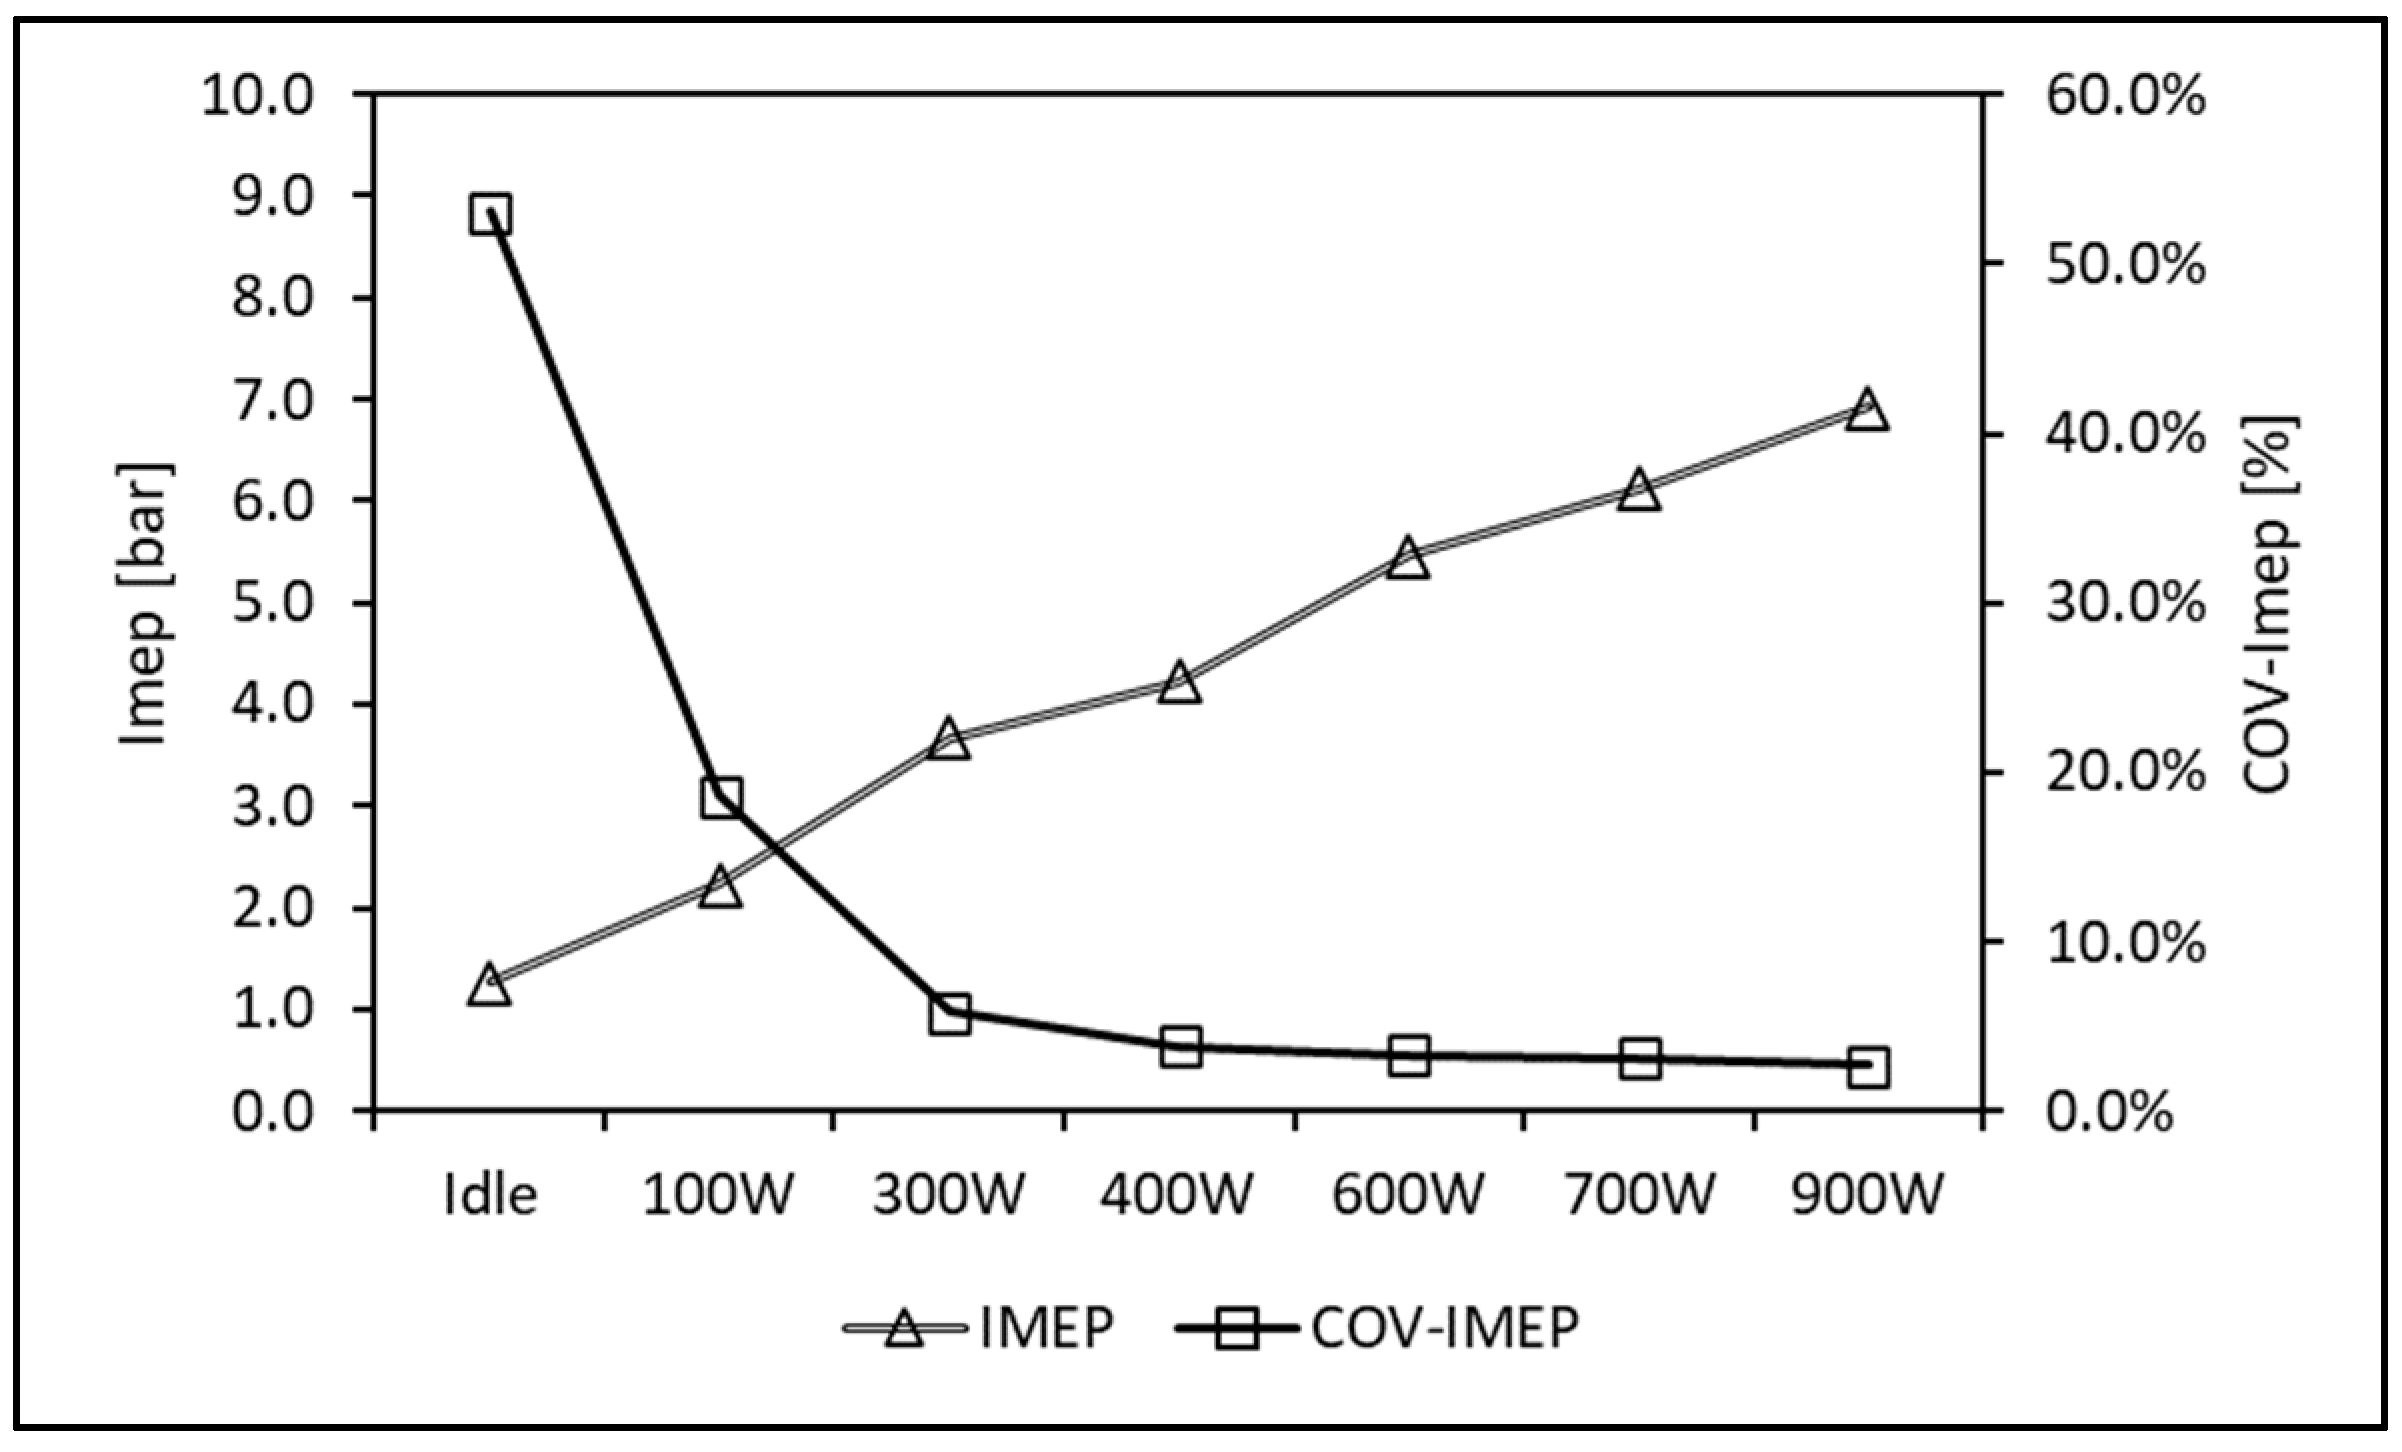
Figure 13 illustrates the indicated mean effective pressure and related COV trends as the electric load applied to the generator increases. IMEP augments from 1.27 bar for the idling condition up to almost 7 bar at 900 W. As expected, the corresponding COV was very high for the minimum operating point, with a value above 50%, which rapidly fell below the conventional threshold of 5% (the value adopted to determine the achievement of stable firing operations) between 300 and 400 W.
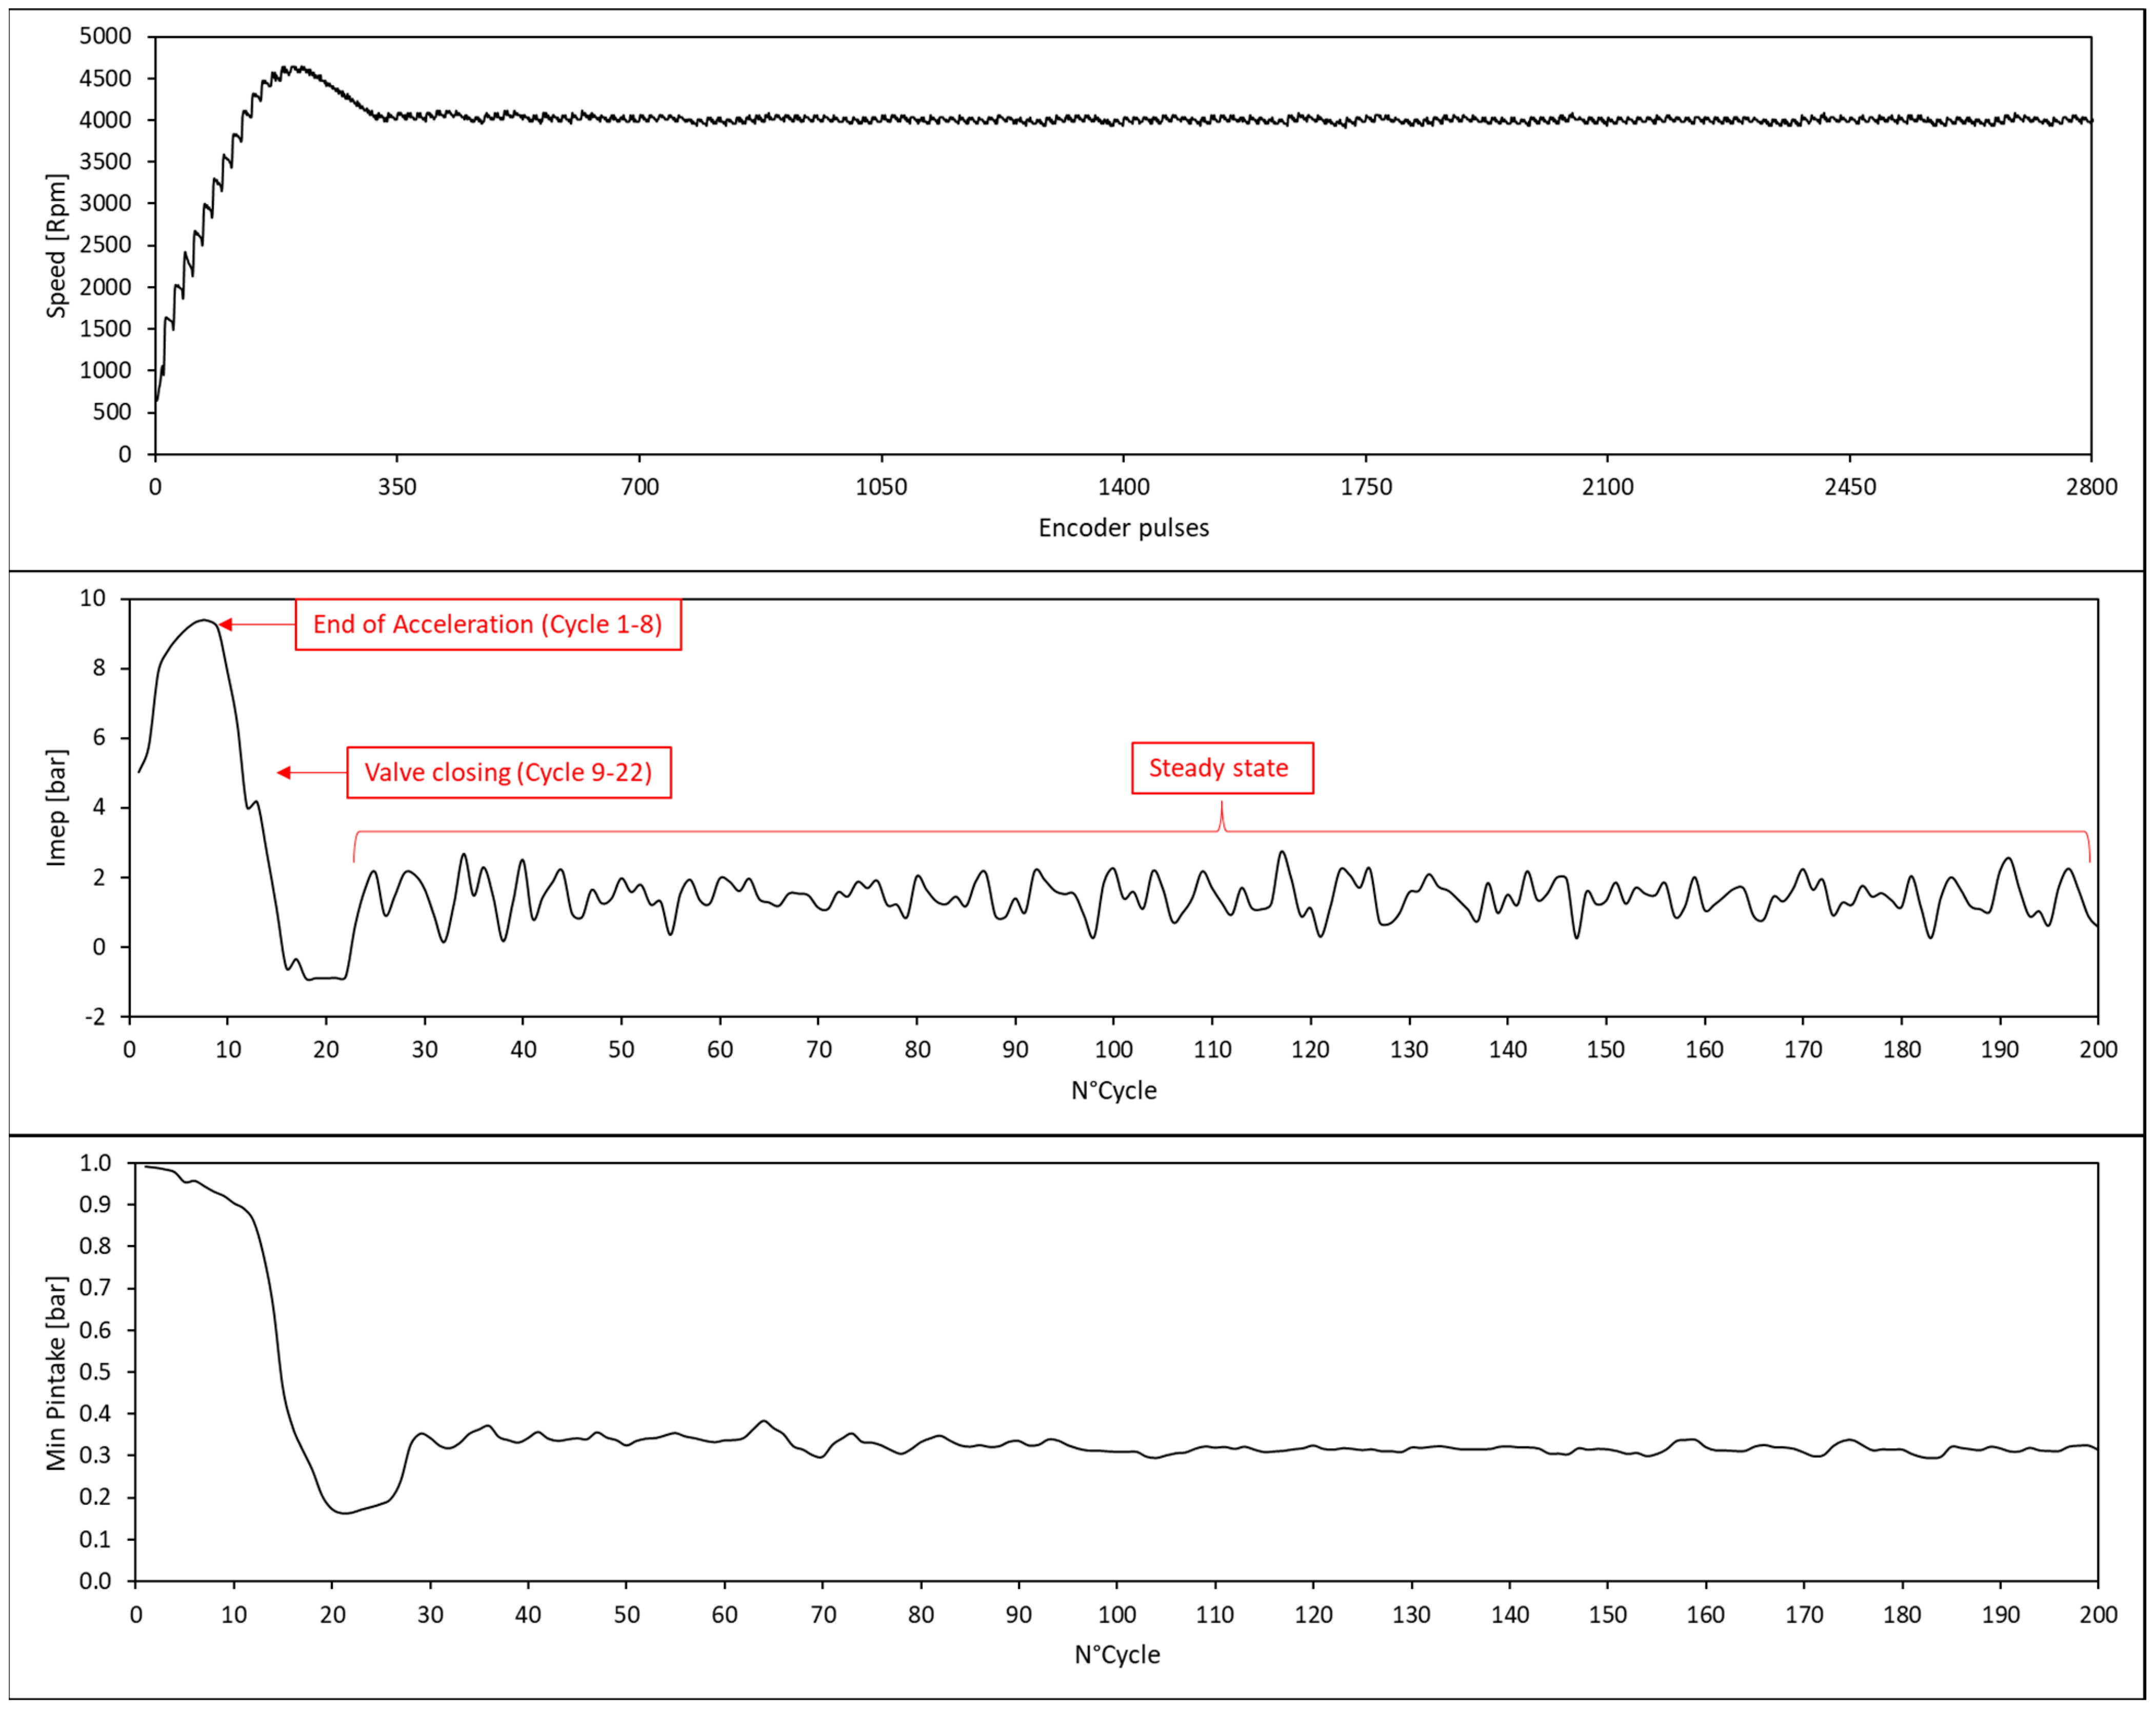
Another interesting investigation that can be implemented by using the clutch assembly is to record data during the transient phase subsequent to the first ignition pulses without any external load to influence the behavior of the OEM ECU. It should be noted that due to the mode used for acquiring rpm signals, it was not possible to record the true first firing engine cycles, because below a certain speed, the sine waveform was too close to zero. 
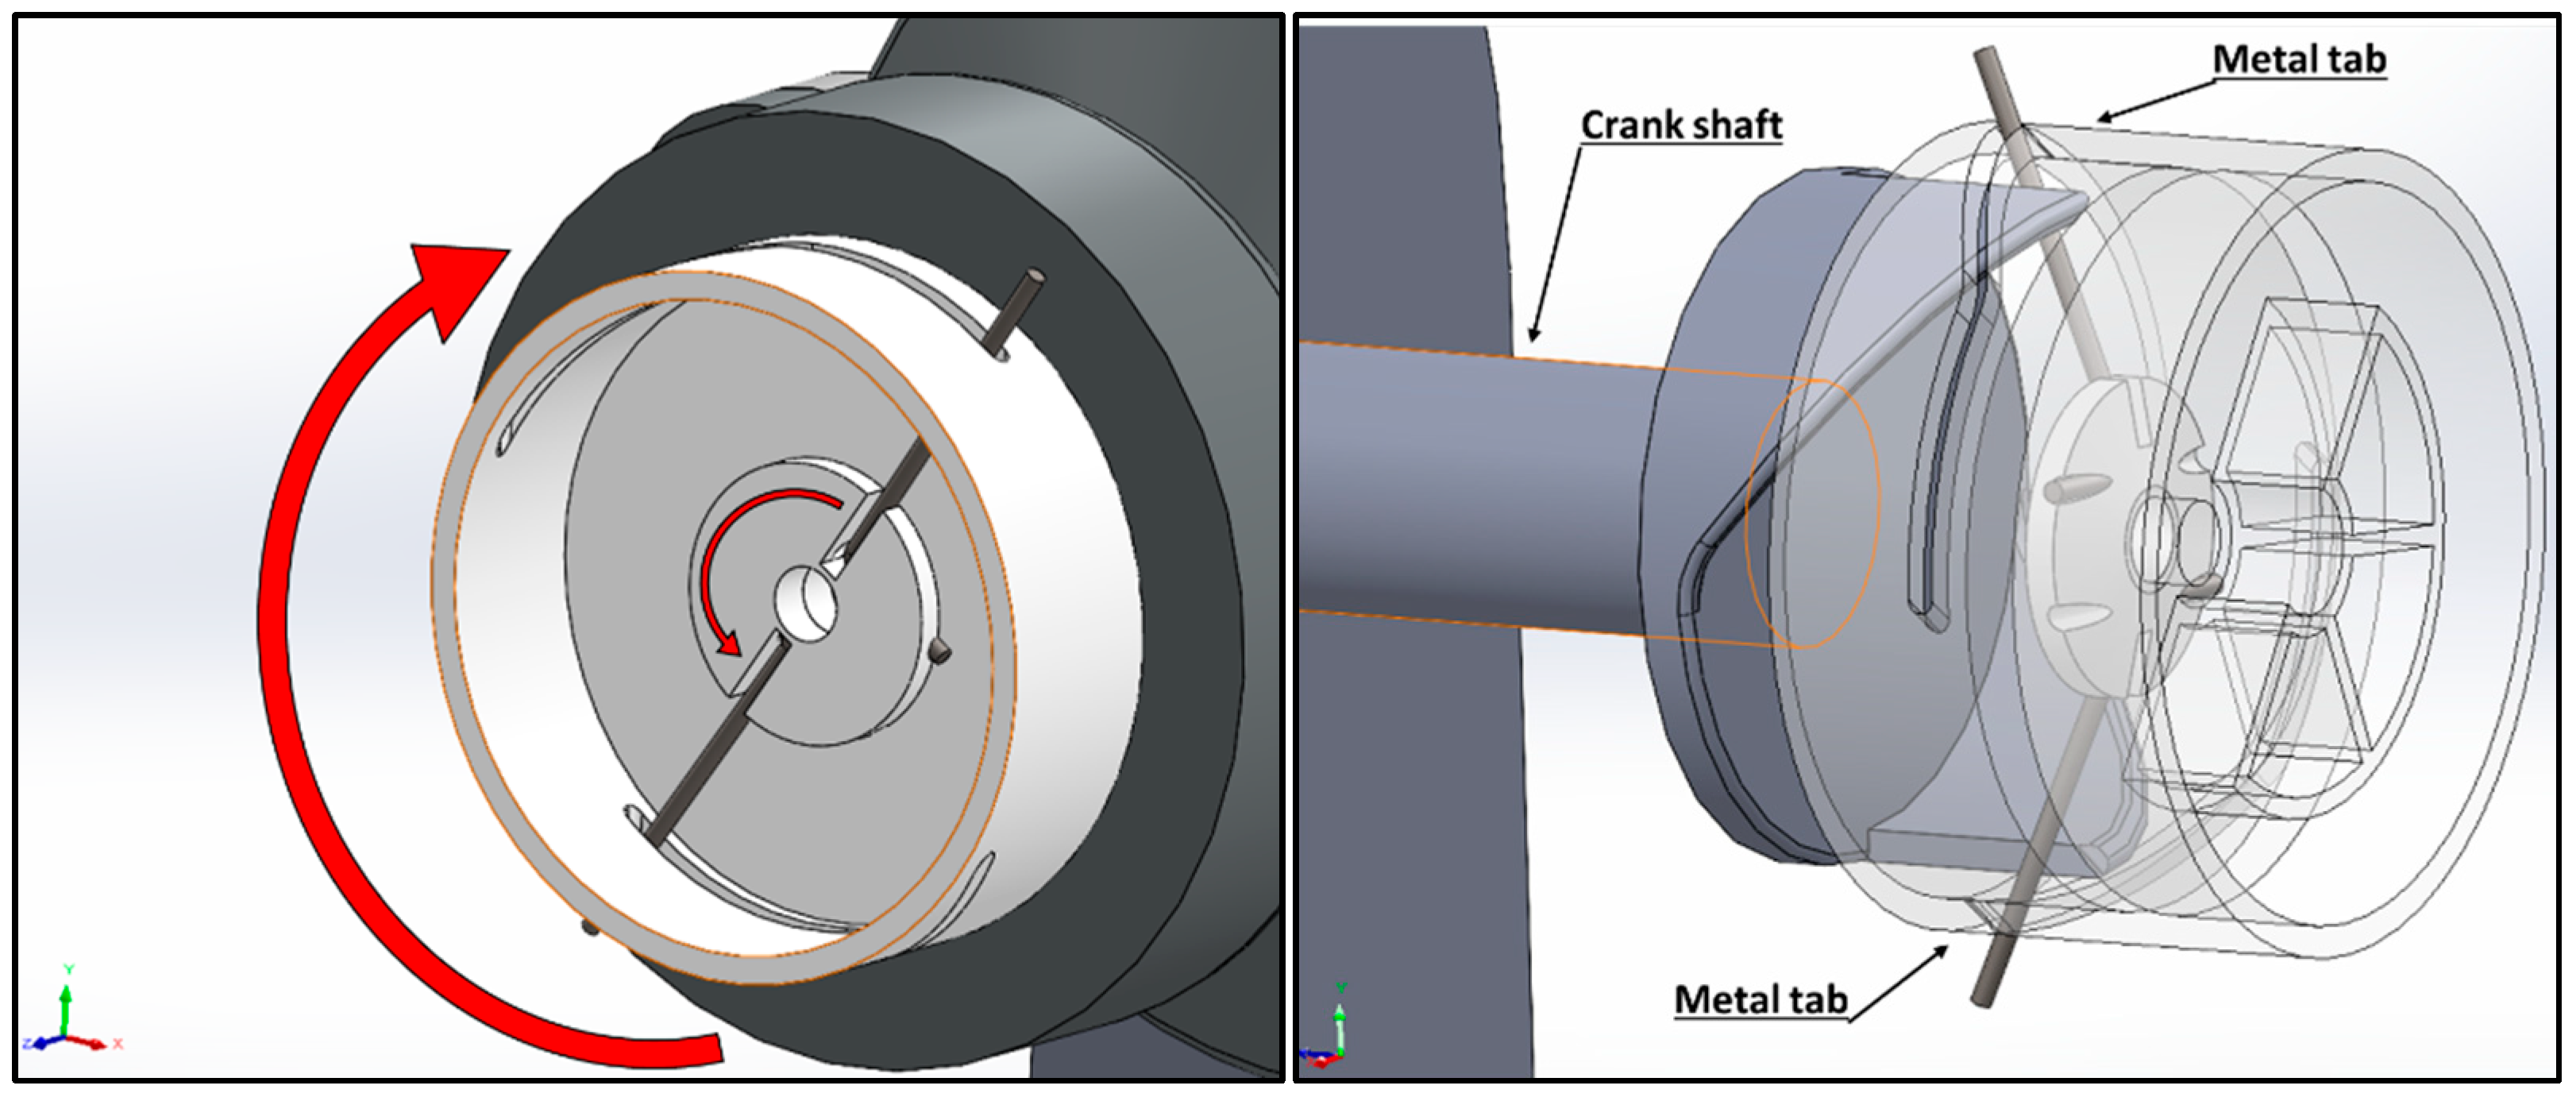
Figure 14 shows the rpm, IMEP, and minimum intake pressure value (taken as representative air flow) during the first 200 cycles that were recorded during engine start. The seemingly noisy rpm trace is due to the way in which it was determined, i.e., with turn-to-turn resolution resulting in higher rpm during the expansion-exhaust strokes and lower values during intake-compression strokes. It can be noted that in a first phase, the OEM ECU detects a low speed and responds by opening the throttle completely (the idling speed target is 4000 rpm), thus resulting in a peak IMEP of around 9.2 bar. At this stage, the engine delivers a torque of almost 4 Nm, that is well beyond the rated value that can be achieved in steady state conditions, but well below the one used to set up the FEM analysis. Naturally, at this stage, the two shafts are decoupled (i.e., the higher engine speed with respect to that of the EM moved the metal tabs in their uncoupled position). Afterwards, the ECU closes the throttle valve in an attempt to reach the target engine speed, with a subsequent decrease in IMEP and intake pressure. Before reaching the steady state idling condition, the engine needed a few more than 20 cycles, but more relevant are the data on the performance that further confirm the structural assessment previously performed.

6. Conclusions

The current work proposes the development of two mechanical connection layouts for coupling a small-size SI engine with an EM. The two designs, structural strength, and operative range are analyzed and discussed in detail. The need for a complete characterization of a small-size spark ignition engine led to the definition of a clutch assembly and a belt-coupling solution. The design and validation phase implemented through the finite element analysis confirmed the reliability of the new components and their capacity to ensure safe running conditions over a wide range of engine speeds and torques.
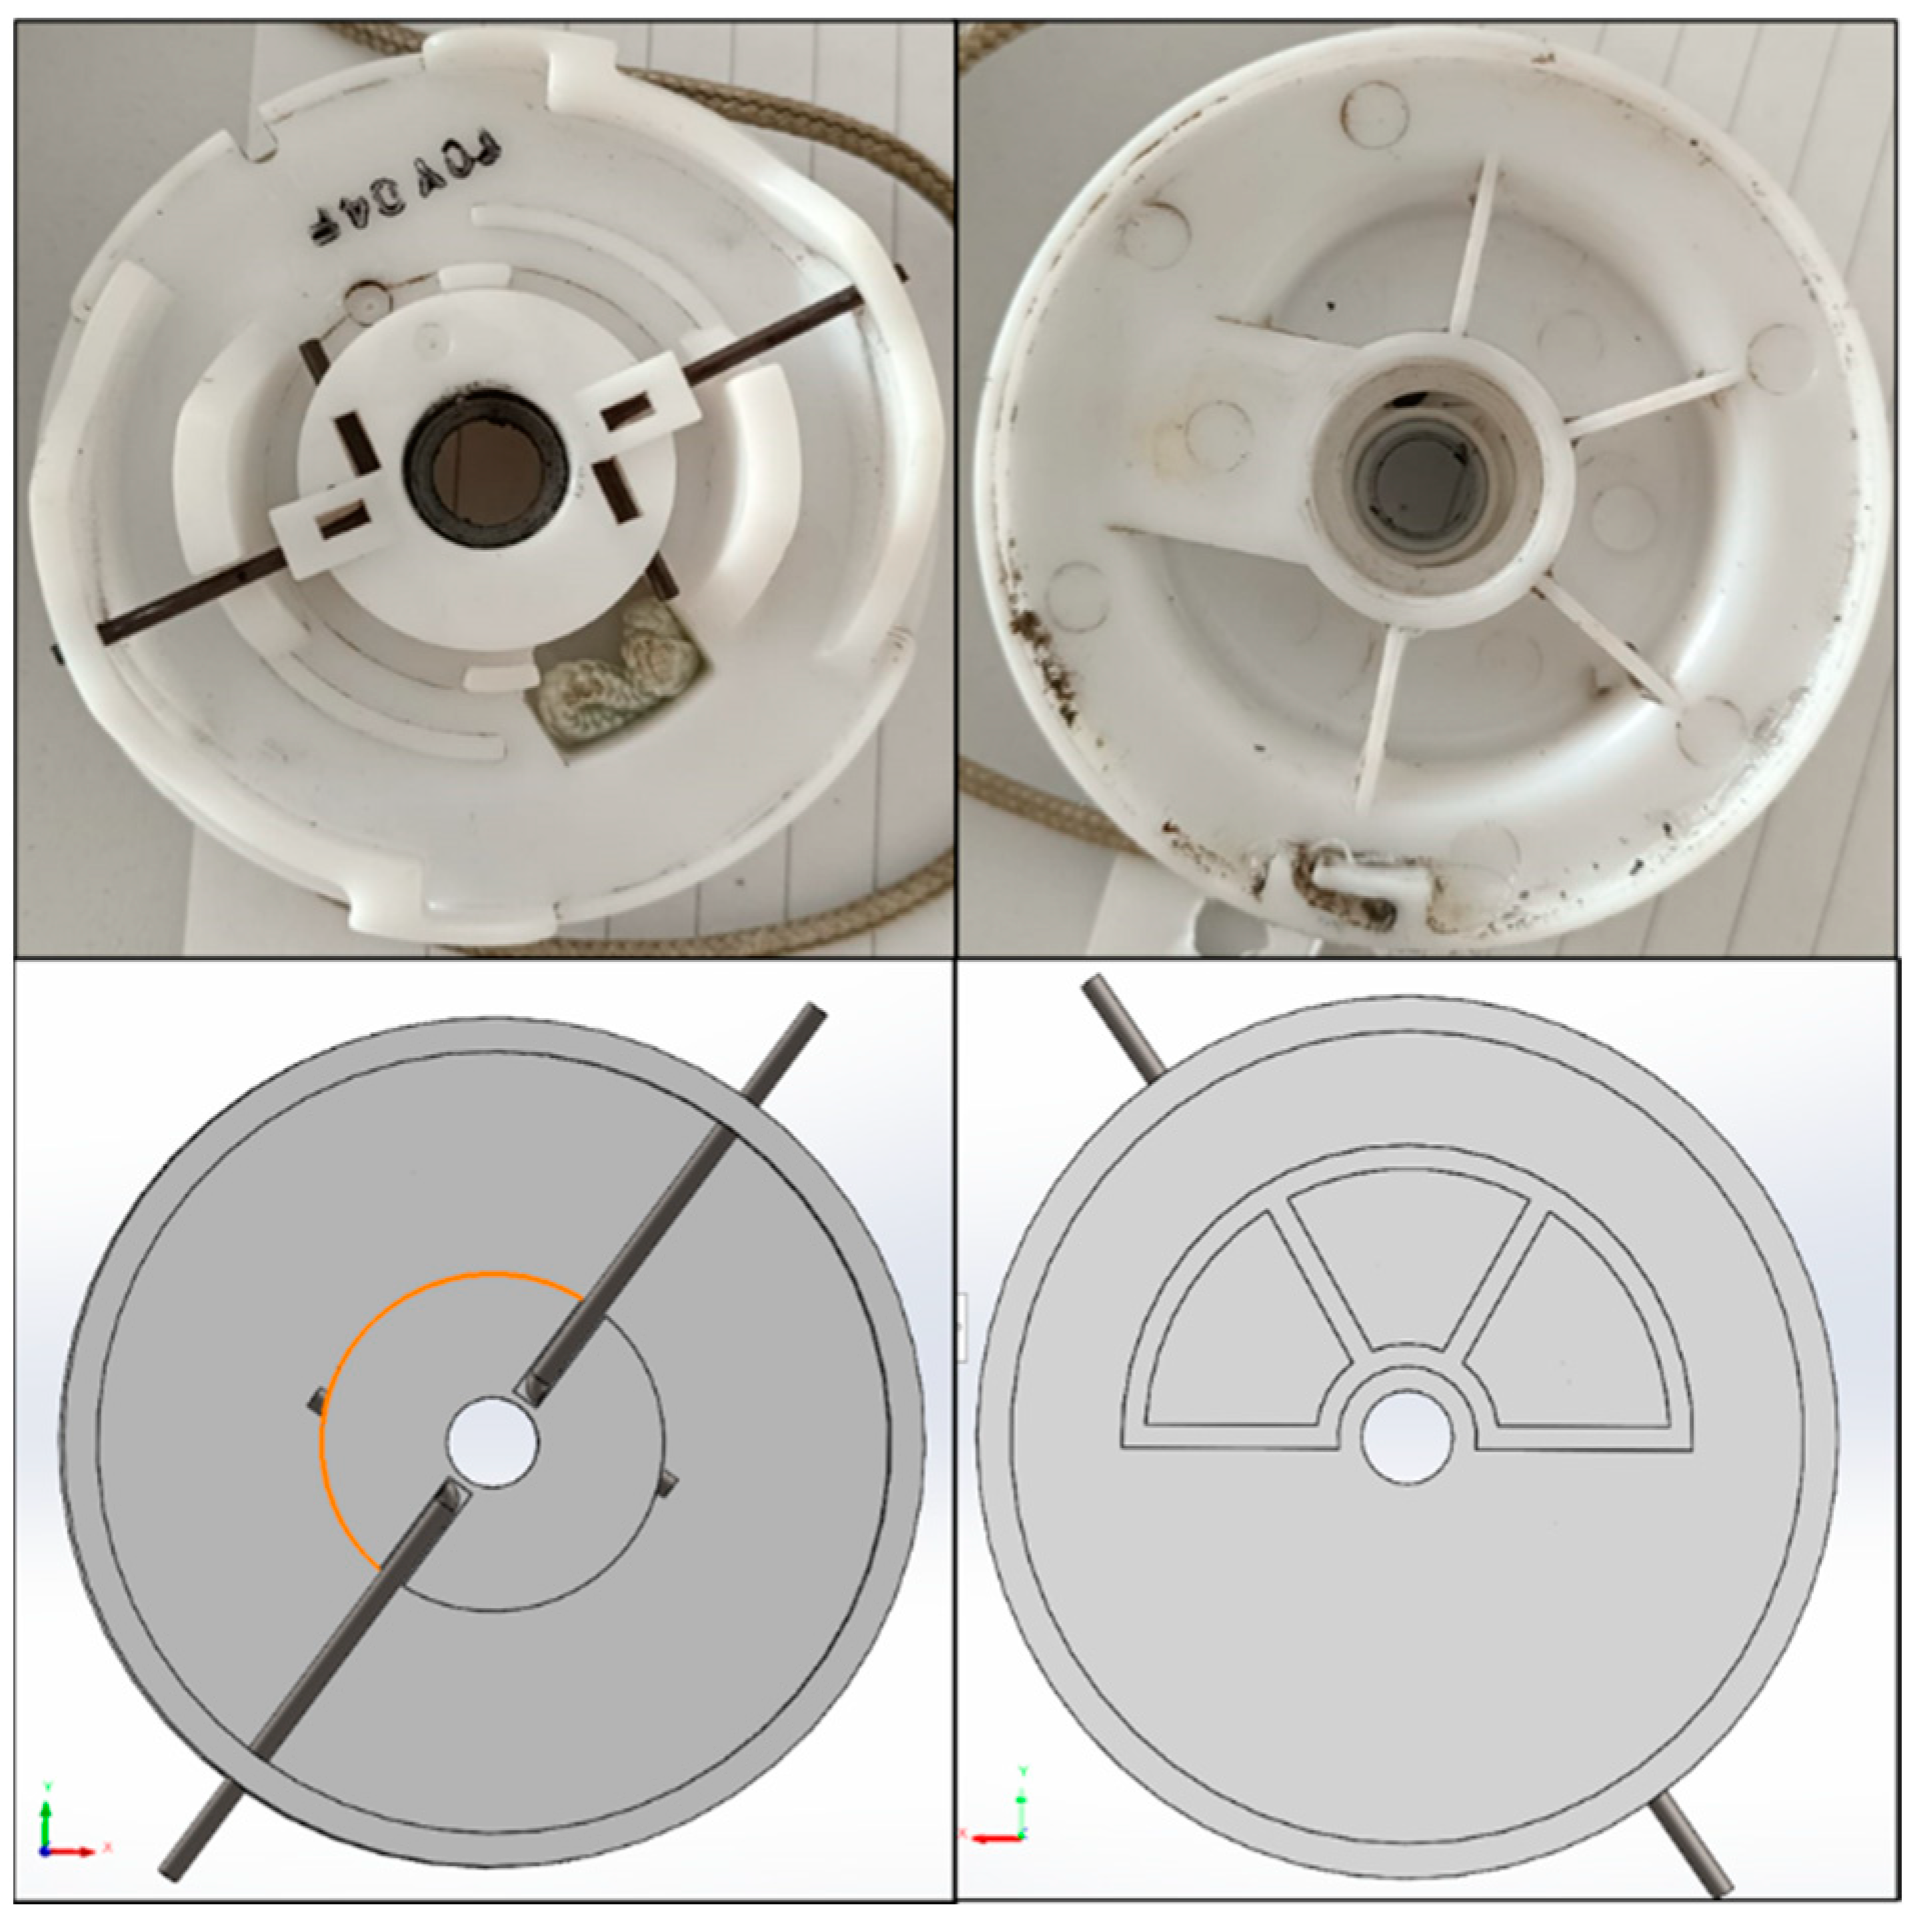
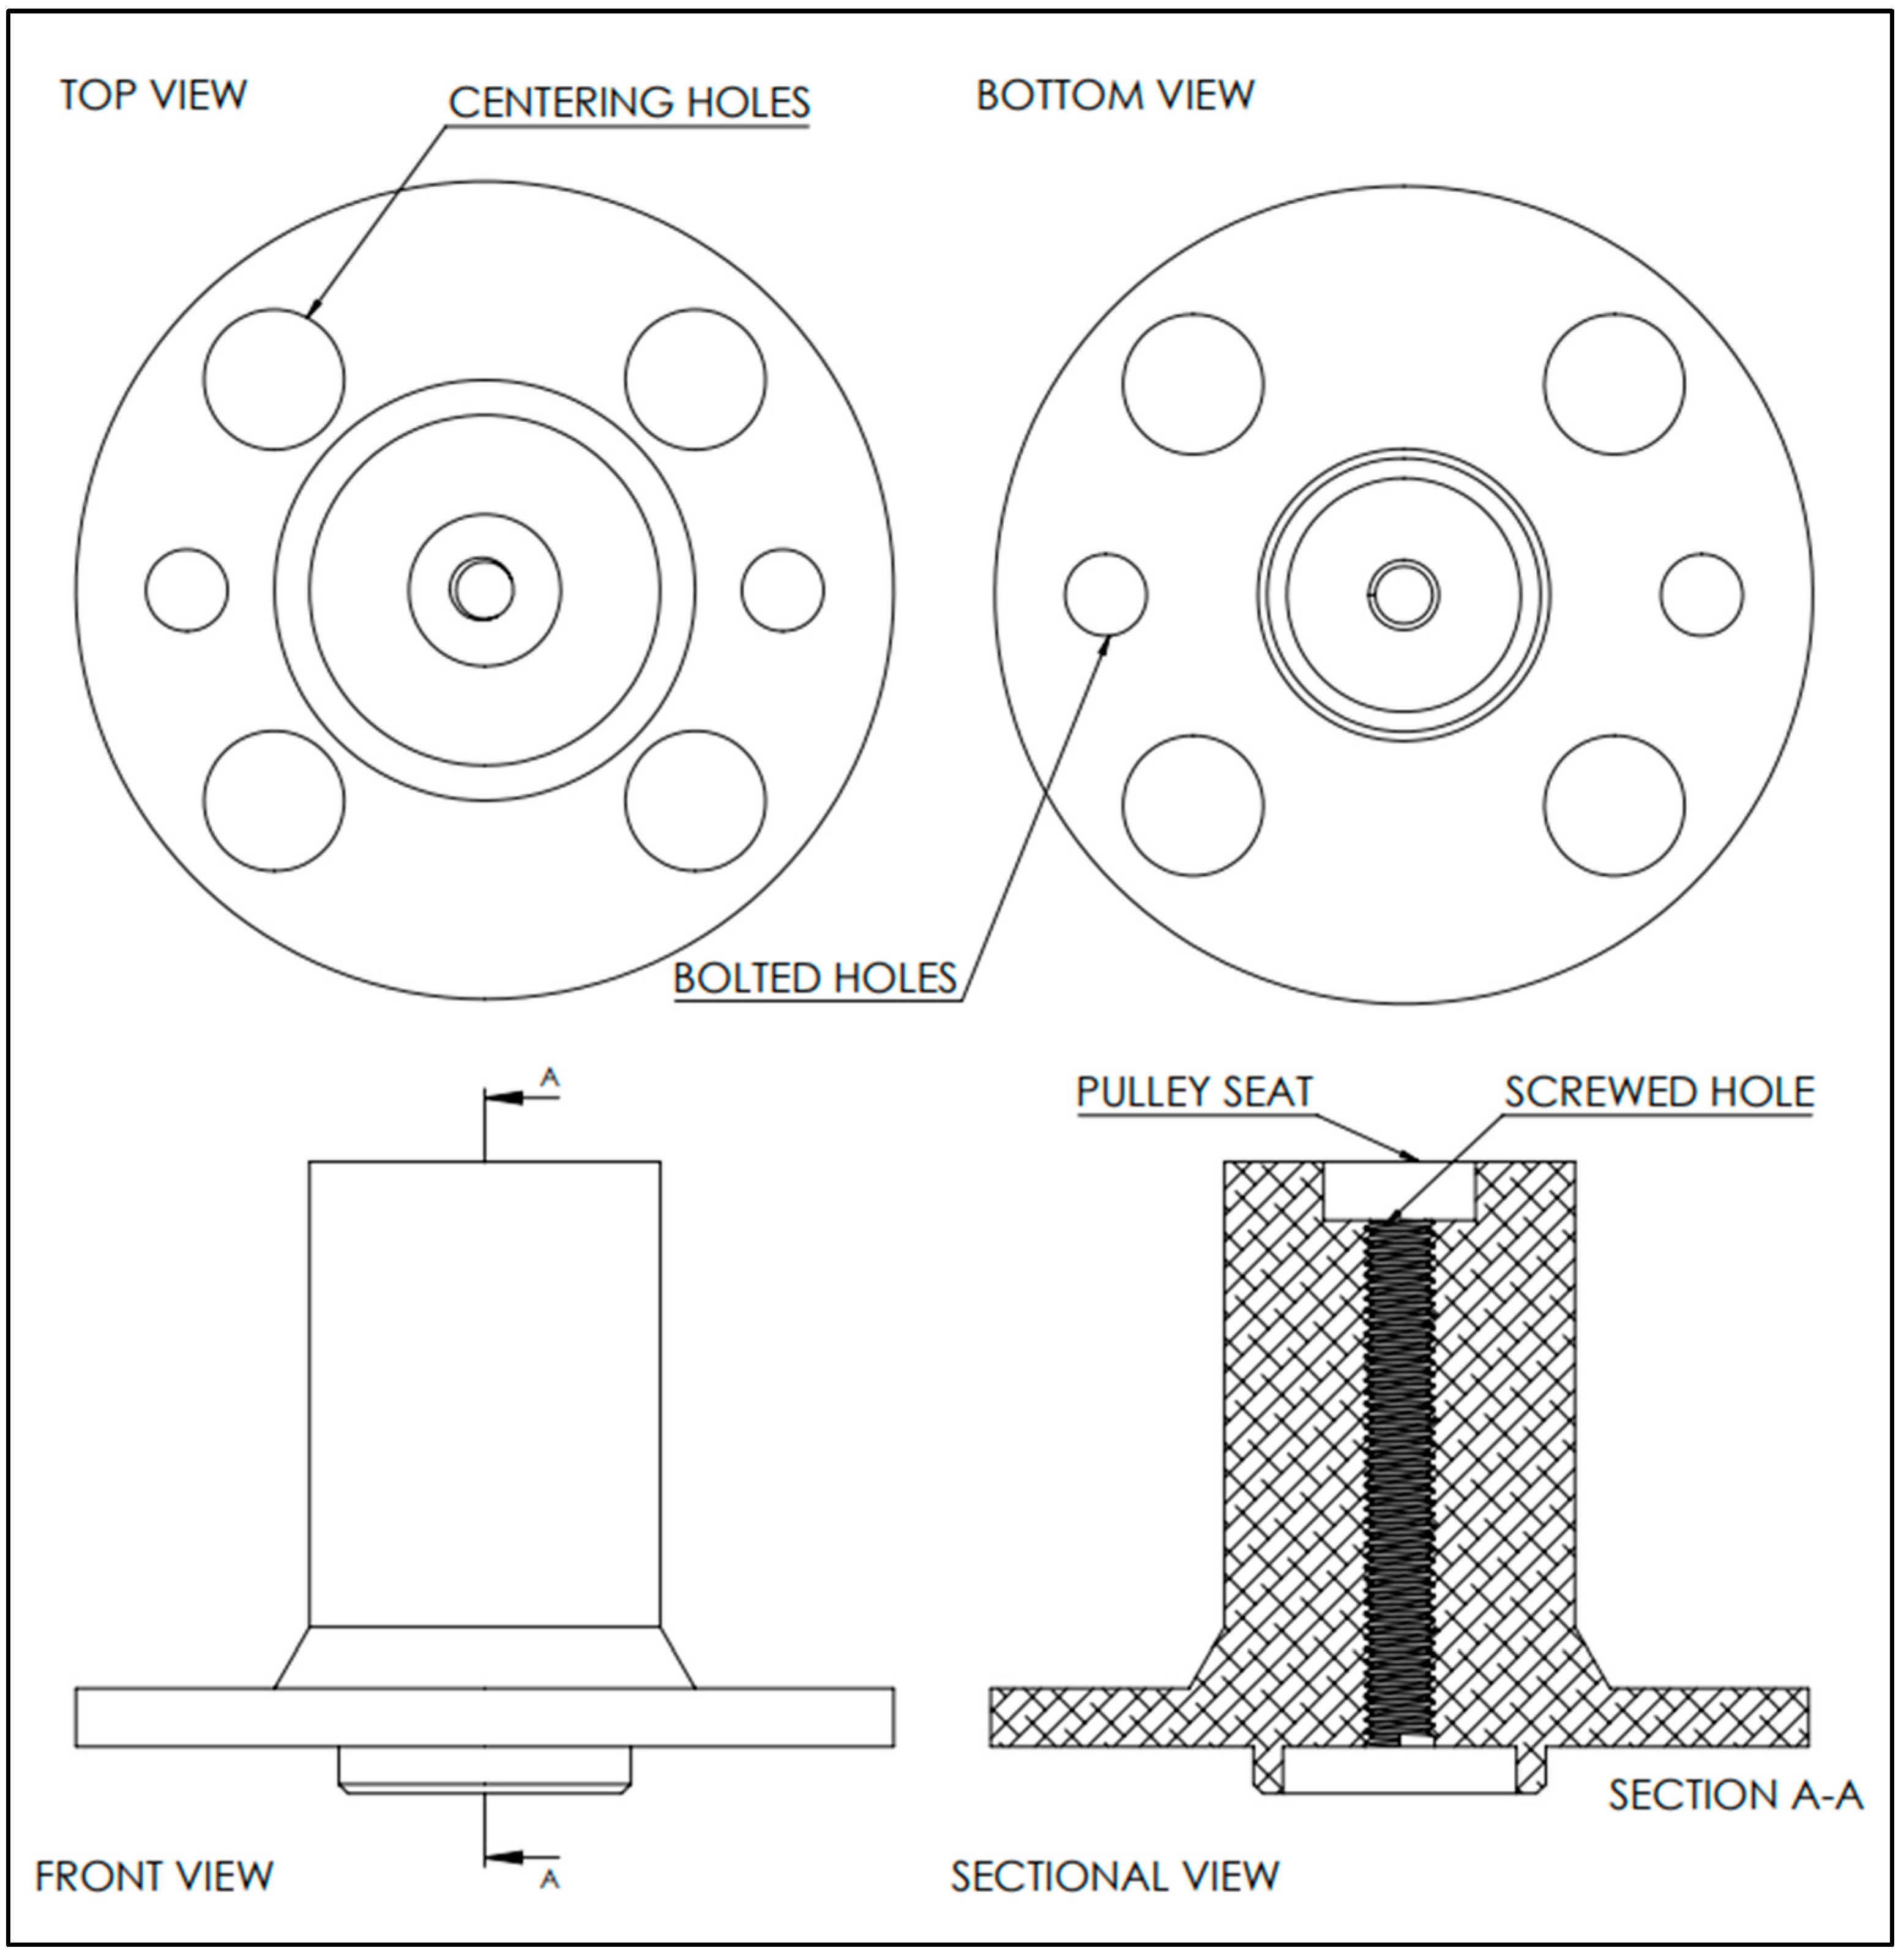
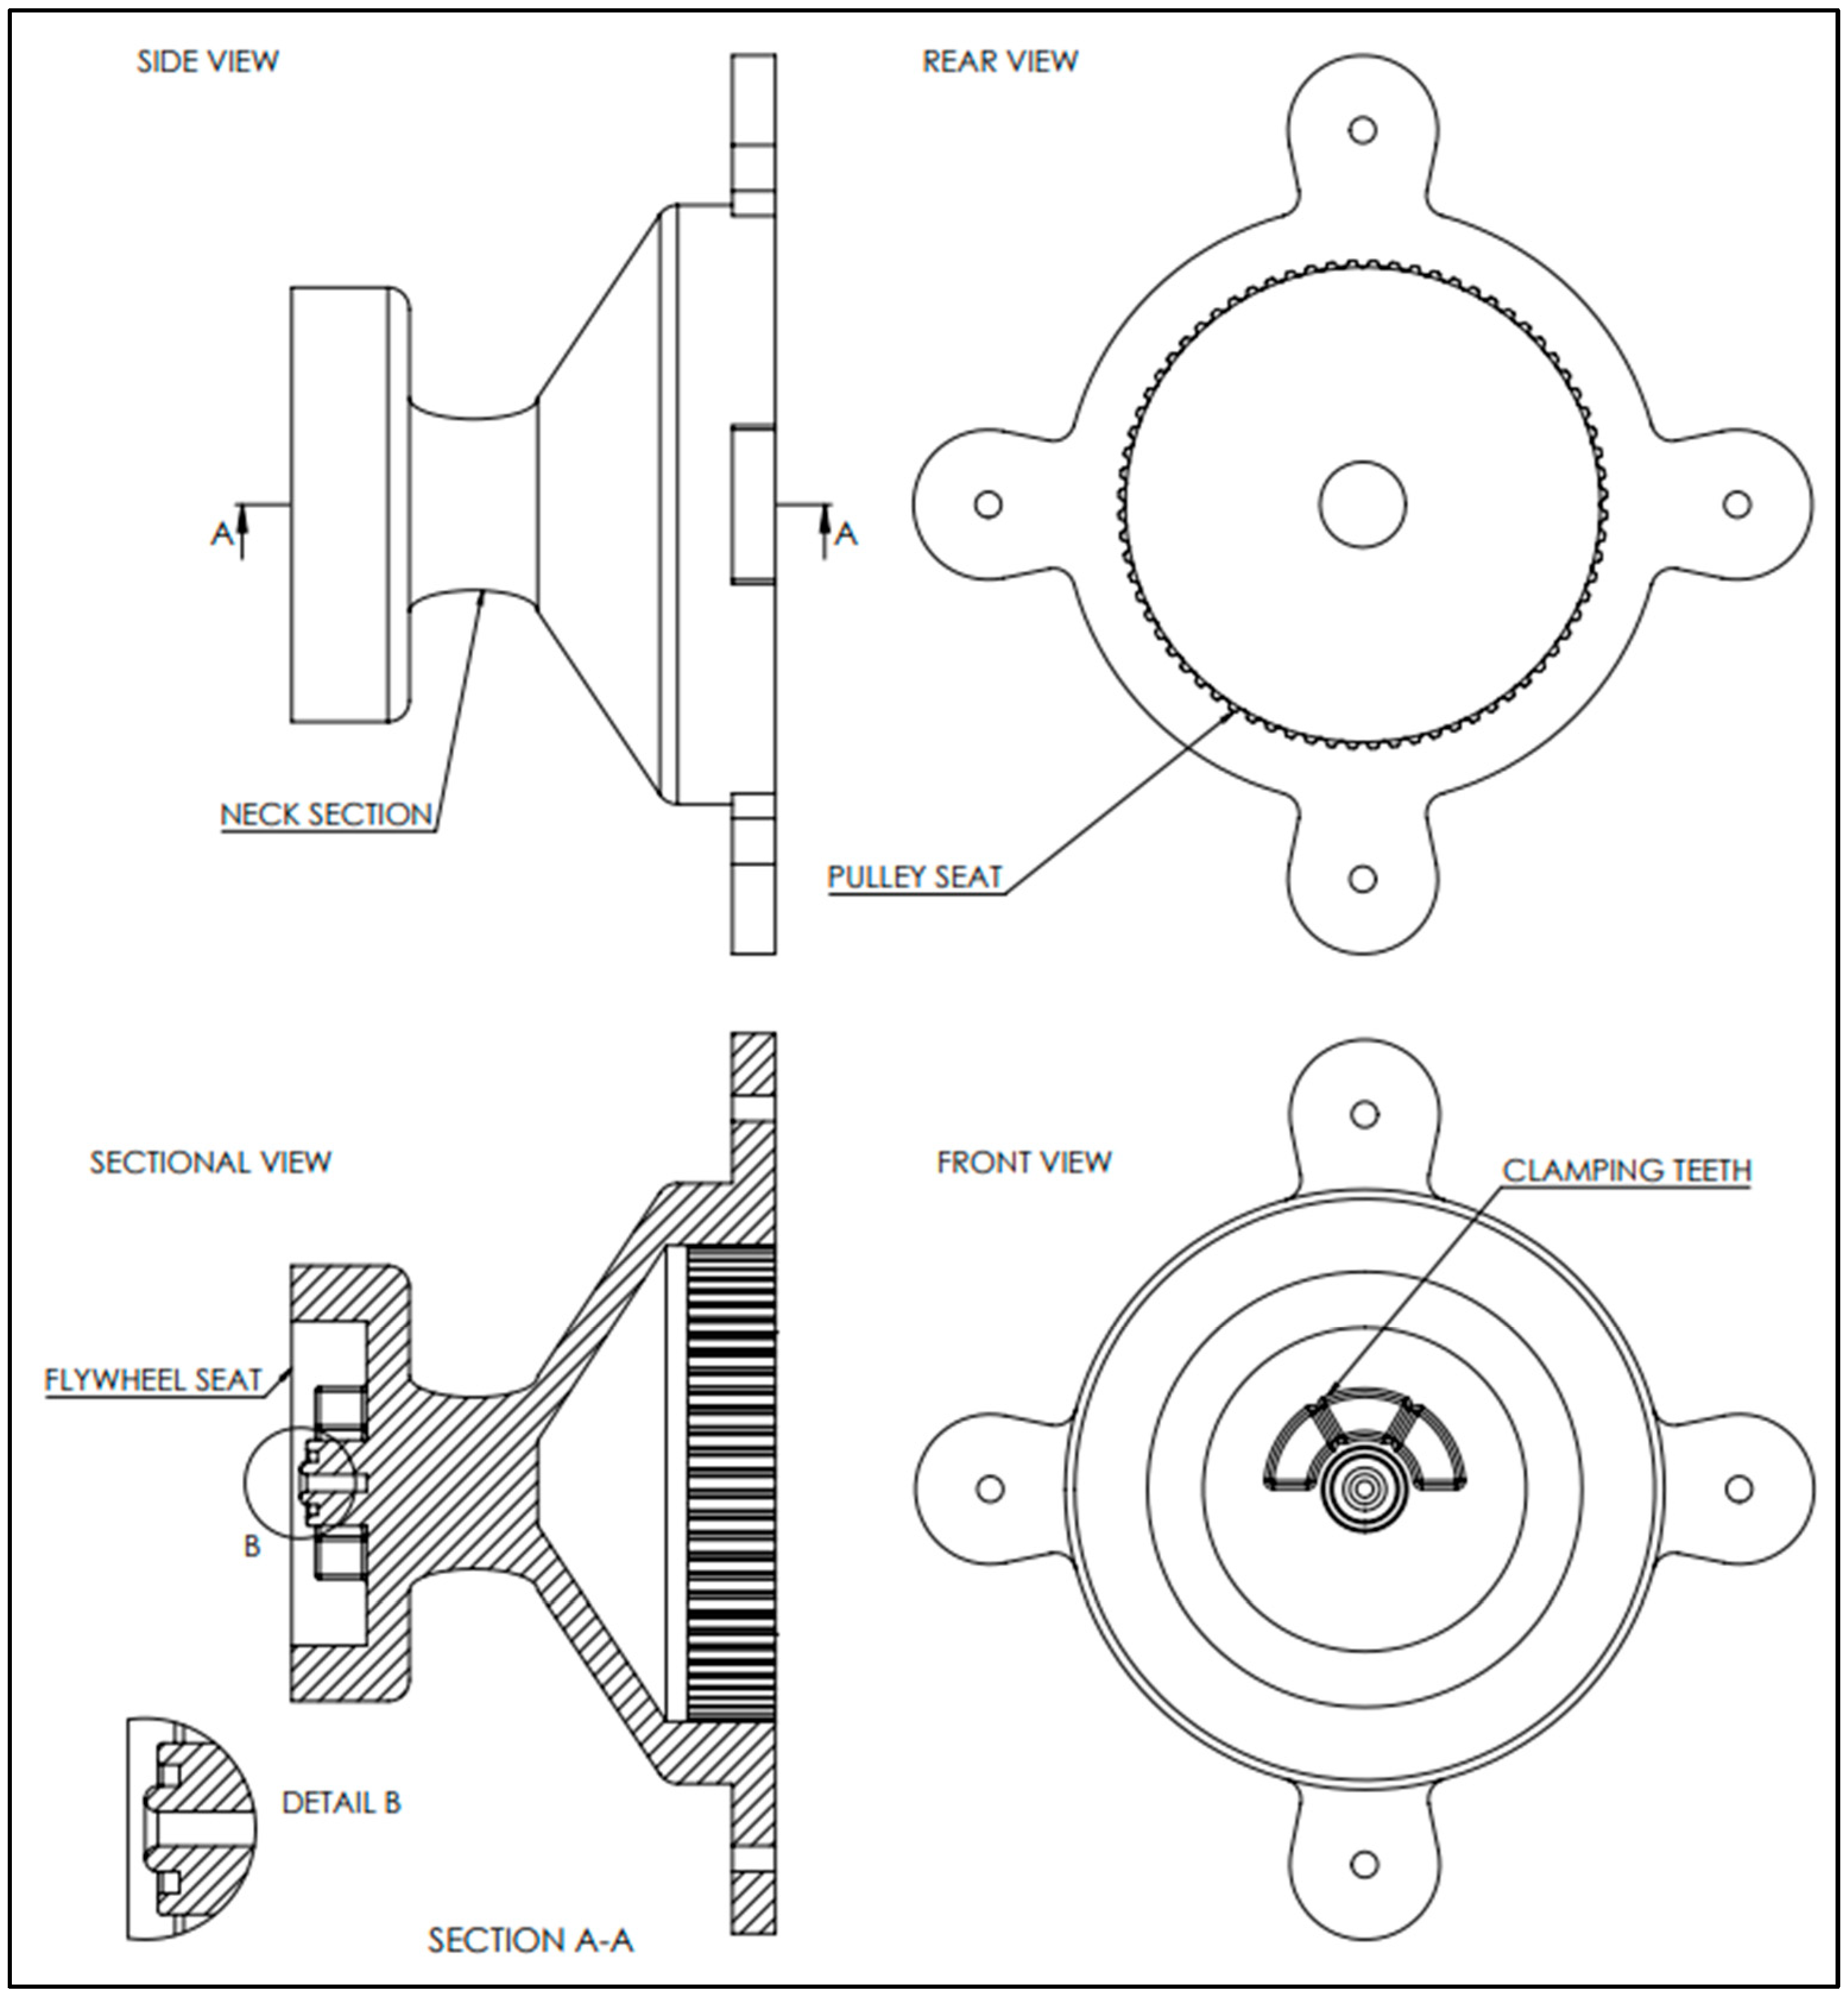
The clutch configuration involved the manufacturing of a plastic component through the use of 3D printer technology, thus assessing its capability to ensure safe and reliable operative conditions also for mechanical applications (paving the way for innovative geometries that would not be possible to produce by conventional mechanical processes). Given the uncertainties about the plastic material properties, it was not possible to perform a fatigue analysis. Nevertheless, taking into account how the load is applied to the shell, it is credible to assume that the whole neck section of the component is more than oversized to withstand the torsion involved in the starting phase of the engine. For the belt-driven layout, the flange was made of aluminum alloy (2014-T6), and it fully accomplished the target purpose for which it was intended. Both layouts showed safety factor values well beyond the critical threshold, respectively around 2.9 for the clutch assembly and 4.0 for the belt-driven layout. Then, several experimental data in motored conditions were used for model calibration with respect to throttle valve behavior and other parameters such as the compression ratio, by performing 0D/1D simulations. This analysis allowed a thorough analysis of the control unit action on the intake line over a wide range of engine speeds and even during the transient phases after engine cranking. As an overall conclusion, it can be stated that the new designs fully accomplish the goal of allowing a complete characterization of the thermal unit, matching all functionality and safety requirements.

Author Contributions

Conceptualization, G.C. and A.I.; methodology, G.C. and A.I.; formal analysis, G.C.; investigation, G.C. and A.I.; data curation, S.S.M.; writing—original draft preparation, G.C. and S.S.M.; writing—review and editing, A.I.; supervision, S.S.M. All authors have read and agreed to the published version of the manuscript.

Funding

This research was partially supported by the European Union—NextGenerationEU (National Sustainable Mobility Center CN00000023, Italian Ministry of University and Research Decree n. 1033— 17/06/2022, Spoke 12).

Data Availability Statement

Data are contained within the article.

Acknowledgments

The support of Antonio Rossi in setting up the experimental rig and that of Dario Barone’s with the 3D printing of new components is gratefully acknowledged by the authors.

Conflicts of Interest

The authors declare no conflicts of interest.

References

  1. Sicard, P.; Agathokleous, E.; Anenberg, S.C.; De Marco, A.; Paoletti, E.; Calatayud, V. Trends in urban air pollution over the last two decades: A global perspective. Sci. Total Environ. 2023, 858, 160064. [Google Scholar] [CrossRef] [PubMed]
  2. Reitz, R.D.; Ogawa, H.; Payri, R.; Fansler, T.; Kokjohn, S.; Moriyoshi, Y.; Agarwal, A.; Arcoumanis, D.; Assanis, D.; Bae, C.; et al. IJER editorial: The future of the internal combustion engine. Int. J. Engine Res. 2020, 21, 3–10. [Google Scholar] [CrossRef]
  3. Omanovic, A.; Zsiga, N.; Soltic, P.; Onder, C. Optimal Degree of Hybridization for Spark-Ignited Engines with Optional Variable Valve Timings. Energies 2021, 14, 8151. [Google Scholar] [CrossRef]
  4. Nazari, S.; Prakash, N.; Siegel, J.; Stefanopoulou, A. On the Effectiveness of Hybridization Paired with Eco-Driving. In Proceedings of the 2019 American Control Conference (ACC), Philadelphia, PA, USA, 10–12 July 2019; pp. 4635–4640. [Google Scholar] [CrossRef]
  5. Dalla Chiara, B.; Deflorio, F.; Pellicelli, M.; Castello, L.; Eid, M. Perspectives on Electrification for the Automotive Sector: A Critical Review of Average Daily Distances by Light-Duty Vehicles, Required Range, and Economic Outcomes. Sustainability 2019, 11, 5784. [Google Scholar] [CrossRef]
  6. Heywood, J.B. Internal Combustion Engine Fundamentals; McGraw-Hill Education: New York, NY, USA, 2018. [Google Scholar]
  7. Martyr, A.J.; Plint, M.A. Engine Testing: Theory and Practice; Elsevier: Amsterdam, The Netherlands, 2011. [Google Scholar]
  8. Ausserer, J.K.; Litke, P.J.; Groenewegen, J.-R.; Rowton, A.; Polanka, M.; Grinstead, K. Development of Test Bench and Characterization of Performance in Small Internal Combustion Engines; SAE Technical Paper 2013-32-9036; SAE International: Warrendale, PA, USA, 2013. [Google Scholar] [CrossRef]
  9. Fachao, J.; Entuo, L.; Molin, W.; Lin, L. Design of an Engine Test Bench Based on Virtual Instrument Technology. In Proceedings of the 2011 Fourth International Conference on Intelligent Computation Technology and Automation, Shenzhen, China, 28–29 March 2011; pp. 624–626. [Google Scholar] [CrossRef]
  10. Guzzella, L.; Onder, C. Introduction to Modeling and Control of Internal Combustion Engine Systems; Springer Science & Business Media: Berlin/Heidelberg, Germany, 2009. [Google Scholar]
  11. Zhang, M.; Hong, W.; Xie, F.; Su, Y.; Liu, H.; Zhou, S. Combustion, performance and particulate matter emissions analysis of operating parameters on a GDI engine by traditional experimental investigation and Taguchi method. Energ. Convers. Manag. 2018, 164, 344–352. [Google Scholar] [CrossRef]
  12. Oh, S.; Park, C.; Oh, J.; Kim, S.; Kim, Y.; Choi, Y.; Kim, C. Combustion, emissions, and performance of natural gas–ammonia dual-fuel spark-ignited engine at full-load condition. Energy 2022, 258, 124837. [Google Scholar] [CrossRef]
  13. Sarvi, A.; Lyyränen, J.; Jokiniemi, J.; Zevenhoven, R. Particulate emissions from large-scale medium-speed diesel engines: 1. Particle size distribution. Fuel Process. Technol. 2011, 92, 1855–1861. [Google Scholar] [CrossRef]
  14. Noorman, M.T.; Assanis, D.N.; Patterson, D.J.; Tung, S.C.; Tseregounis, S.I. Overview of Techniques for Measuring Friction Using Bench Tests and Fired Engines; SAE Technical Paper 2000-01-1780; SAE International: Warrendale, PA, USA, 2000. [Google Scholar] [CrossRef]
  15. Zhao, Y.; Li, W.; Yu, W. Design of a test bench to characterize mechanical phenomena involved in a bolted joint. In Proceedings of the 5th International Conference on Frontiers of Manufacturing Science and Measuring Technology (FMSMT 2017), Taiyuan, China, 24–25 June 2017; Atlantis Press: Amsterdam, The Netherlands, 2017. [Google Scholar] [CrossRef]
  16. Klein, S.; Savelsberg, R.; Xia, F.; Guse, D.; Andert, J.; Blochwitz, T.; Bellanger, C.; Walter, S.; Beringer, S.; Jochheim, J.; et al. Engine in the Loop: Closed Loop Test Bench Control with Real-Time Simulation. SAE Int. J. Commer. Veh. 2017, 10, 95–105. [Google Scholar] [CrossRef]
  17. Song, Y.; Hartwigsen, C.J.; McFarland, D.M.; Vakakis, A.F.; Bergman, L.A. Simulation of dynamics of beam structures with bolted joints using adjusted Iwan beam elements. J. Sound Vib. 2004, 273, 249–276. [Google Scholar] [CrossRef]
  18. Zhao, H.; Li, C.; Zhang, G. Design of a versatile test bench for hybrid electric vehicles. In Proceedings of the 2008 IEEE Vehicle Power and Propulsion Conference, Harbin, China, 3–5 September 2008; pp. 1–4. [Google Scholar] [CrossRef]
  19. Cardone, M.; Gargiulo, B.; Fornaro, E. Development of a flexible test bench for a Hybrid Electric Propulsion System. In Proceedings of the 2021 IEEE International Workshop on Metrology for Automotive (MetroAutomotive), Bologna, Italy, 1–2 July 2021; pp. 221–225. [Google Scholar] [CrossRef]
  20. Ott, S.; Gürbüz, H.; Nickel, F.; Genesius, A. Innovative and Highly Efficient Clutch System for Multispeed BEV with Highspeed Powertrains. In CTI SYMPOSIUM 2019; Proceedings; Springer: Berlin/Heidelberg, Germany, 2021. [Google Scholar] [CrossRef]
  21. Jacoby, C.L.; Jo, Y.S.; Jurewicz, J.; Pamanes, G.; Siegel, J.E.; Yen, P.X.T.; Dorsch, D.S.; Winter, A.G. Design of a Clutchless Hybrid Transmission for a High-Performance Vehicle. In Proceedings of the ASME 2015 International Design Engineering Technical Conferences and Computers and Information in Engineering Conference, Boston, MA, USA, 2–5 August 2015; ASME: New York, NY, USA, 2015; Volume 10. [Google Scholar] [CrossRef]
  22. Liao, Z.C.; Bai, X.X.; Li, Y.; Deng, X.C.; Sun, J. Design, modeling, and verification of a test bench for braking simulation of 1/4 vehicle. Proc. Inst. Mech. Eng. Part D J. Automob. Eng. 2020, 234, 1425–1441. [Google Scholar] [CrossRef]
  23. Horn, K.P.; Rowton, A.K.; Polanka, M.D.; Ausserer, J.; Litke, P.J.; Grinstead, K.D. Dynamic Friction Measurements on a Small Engine Test Bench. In Proceedings of the 53rd AIAA Aerospace Sciences Meeting, Kissimmee, FL, USA, 5–9 January 2015. [Google Scholar] [CrossRef]
  24. Michelotti, A.C.; Silva, J.C.d. Design innovation in dynamic coupling of starting system for internal combustion engines. J. Braz. Soc. Mech. Sci. Eng. 2016, 38, 177–188. [Google Scholar] [CrossRef]
  25. Jin, Z.; Sun, X.; Chen, L.; Yang, Z. Robust Multi-Objective Optimization of a 3-Pole Active Magnetic Bearing Based on Combined Curves with Climbing Algorithm. IEEE Trans. Ind. Electron. 2022, 69, 5491–5501. [Google Scholar] [CrossRef]
  26. Sun, X.; Xu, N.; Yao, M. Sequential Subspace Optimization Design of a Dual Three-Phase Permanent Magnet Synchronous Hub Motor Based on NSGA III. IEEE Trans. Transp. Electrif. 2023, 9, 622–630. [Google Scholar] [CrossRef]
  27. Ahmad, M.N.; Yahya, A. Effects of 3D Printing Parameters on Mechanical Properties of ABS Samples. Designs 2023, 7, 136. [Google Scholar] [CrossRef]
  28. MatWeb Material Property Data. Available online: https://www.matweb.com/search/DataSheet.aspx?MatGUID=3a8afcddac864d4b8f58d40570d2e5aa (accessed on 5 December 2023).
  29. MakeItFrom. Available online: https://www.makeitfrom.com/material-properties/Acrylonitrile-Butadiene-Styrene-ABS (accessed on 5 December 2023).
  30. Honda Products Engines. Available online: https://www.honda-engines-eu.com/en/products/engines/gxh50 (accessed on 5 December 2023).
  31. ProTorque HTD Timing Belts. Available online: https://www.protorque.net/_assets/documents/belts/ProTorque-HTD-Timing-Belts.pdf (accessed on 5 December 2023).
  32. Gamma Technologies. GT-SUITE Flow Theory Manual Version 2019; Gamma Technologies: Westmont, IL, USA, 2019. [Google Scholar]
  33. Irimescu, A.; Merola, S.S.; Vaglieco, B.M. Algorithm for Cycle-To-Cycle Firing TDC Identification Based on Wasted Spark Duration Measurements in Small Engines. Appl. Sci. 2023, 13, 1362. [Google Scholar] [CrossRef]
Figure 1. Starter flywheel (top) and CAD model (bottom).
Designs 08 00014 g001
Figure 2. Drawing of the shell component in different views.
Designs 08 00014 g002
Figure 3. Expanded view of the clutch assembly.
Designs 08 00014 g003
Figure 4. Opposite movement of the shell in relation to the metal tabs during start-up phase (red arrows, left) and metal tabs in lock position (right).
Designs 08 00014 g004
Figure 5. Drawing of the metallic flange in different views.
Designs 08 00014 g005
Figure 6. Expanded view of the pulley-belt assembly layout.
Designs 08 00014 g006
Figure 7. Force applied to the inner teeth (A); rear side of the pulley locked to simulate the braking action of the EM (B); stress analysis result (C); and safety factor evaluation (D).
Designs 08 00014 g007
Figure 8. Force applied inside the pulley seat (A); dummy wall and bolts to lock the component (B); stress analysis result (C); and safety factor evaluation (D).
Designs 08 00014 g008
Figure 9. The 0D/1D model of the small-size spark ignition engine.
Designs 08 00014 g009
Figure 10. Experimental and simulated pressure in the intake port (left column) and in-cylinder (right column).
Designs 08 00014 g010
Figure 11. Intake pressure traces in motored conditions from 750 to 6000 rpm, with valve opening from 0 to 100% (engine running with the belt-coupling assembly).
Designs 08 00014 g011
Figure 12. In-cylinder pressure lines in firing conditions (top) and comparison among intake pressure traces in motored and firing points (bottom).
Designs 08 00014 g012
Figure 13. IMEP (triangular symbols) and COVimep (squared symbols) data throughout the investigated electric load range.
Designs 08 00014 g013
Figure 14. GXH50 transient phase after cranking; rpm (top), IMEP (middle), and minimum intake pressure value (bottom) during 200 firing cycles.
Designs 08 00014 g014
Table 1. Engine specifications.
Engine Specifications
Number of cylinders1
Compression ratio8:1
Bore41.8 mm
Stroke36.0 mm
Number of valves2
Fuel systemcarburetor
Intake valves open/Closed *386° bTDC/77° bTDC
Exhaust valves open/Closed *116° aTDC/295° bTDC
* The engine features one cam that drives both valves; measurements were performed with the power unit cold and turning the crankshaft by hand, with an estimated accuracy of around ±2°.
Table 2. Engine operating conditions.
Mechanical ConnectionEngine ConditionSpeed [rpm]Throttle Opening Valve [%]/Load [W]
Belt-drivenMotored5000
7500-100
10000-100
150010-20-40-100
20000-100
30000-100
40000-10-20-25-30-35-40-45-50-60-100
50000-20-30-40-50-70-100
60000-20-40-60-100
ClutchFiring4000idle-100-300-400
4500600-700
5000900
Disclaimer/Publisher’s Note: The statements, opinions and data contained in all publications are solely those of the individual author(s) and contributor(s) and not of MDPI and/or the editor(s). MDPI and/or the editor(s) disclaim responsibility for any injury to people or property resulting from any ideas, methods, instructions or products referred to in the content.

