Article

Increasing Usability of Homecare Applications for Older Adults: A Case Study

1
BioAssist SA, 26504 Patras, Greece
2
School of Electrical and Computer Engineering, National Technical University of Athens, 15773 Athens, Greece
3
Department of Digital Systems, University of Piraeus, 18536 Piraeus, Greece
*
Author to whom correspondence should be addressed.
Designs 2019, 3(2), 23; https://doi.org/10.3390/designs3020023
Submission received: 26 March 2019 / Revised: 3 May 2019 / Accepted: 7 May 2019 / Published: 9 May 2019
(This article belongs to the Special Issue Artificial Intelligence Supported Design and Innovation)

Abstract

:
As the world’s population is ageing, the field dealing with technology adoption by seniors has made headway in the scientific community. Recent technological advances have enabled the development of intelligent homecare systems that support seniors’ independent living and allow monitoring of their health status. However, despite the amount of research to understand the requirements of systems designed for the elderly, there are still unresolved usability issues that often prevent seniors from enjoying the benefits that modern ICT technologies may offer. This work presents a usability assessment of “HeartAround”, an integrated homecare solution incorporating communication functionalities, as well as health monitoring and emergency response features. An assessment with the system usability scale (SUS) method, along with in-depth interviews and qualitative analysis, has provided valuable insights for designing homecare systems for seniors, and validated some effective practical guidelines.

1. Introduction

In this day and age, technology adoption is becoming imperative, as it is a dominant and integral part of our society, pervasive across all domains of life. As the world’s population is ageing and seniors make up a growing share of the population of industrialized societies, research work on the benefits senior citizens can enjoy from adopting modern technologies is gaining importance [1,2,3,4,5,6].
Furthermore, technology can support older adults to remain independent for longer, by facilitating everyday tasks. Many older adults prefer to live independently, remaining in their own homes for as long as possible, and modern technology can be the key factor to ageing in place, ensuring seniors’ well-being and enhancing their quality of life. State-of-the-art communication technologies provide not only the means to deal with social isolation and loneliness, but also alert and emergency contact systems that may prove to be lifesaving for seniors living alone [2,3,4,5,6]. Moreover, the availability of low-cost medical devices and wearable sensors, along with advances in cloud computing and electronic health records, have enabled the development of remote patient monitoring systems, that can be utilized to manage chronic health conditions. Considering that the likelihood of facing a chronic health condition increases with age, seniors stand to benefit from such technologies [1].
Besides enabling people to live more independent lives, telecare and telehealth services are poised to reduce the immense costs of elderly and chronic disease care on national healthcare systems [1]. Therefore, such technologies are becoming increasingly popular, leading to significant research for the development of innovative applications. Indeed, many older adults acknowledge the potential benefits and report a willingness to adopt such technologies [1,7]. However, older adults do not tend to use technology just for the sake of using it. In order for them to accept and adopt new applications, the technology must not only fulfill a need, but also be perceived as usable [8]. Therefore, while certain usability issues remain unresolved, uptake remains low.
Considerable research has been conducted to identify and understand the various constraints faced by older users when presented with modern ICT technologies, with the most prominent being inaccessibility and physical limitations (e.g., visual impairments). Specific guidelines have been proposed by several researchers to address these limitations. However, there are additional psychological barriers to be considered (e.g., lack of self-confidence, hesitance and anxiety) whenever seniors are introduced to ICT applications. Furthermore, certain environmental factors (e.g., lack of support from family members) also play a significant role [2,3,9,10,11]. With respect to the latter two, there is still progress to be made [12,13,14,15].
A case study of a typical homecare solution may allow us to explore innovative solutions to such issues and provide useful insights for improved elderly design practices. In this work, we present a usability evaluation of the “HeartAround” homecare platform, which is an integrated solution for assisted independent living, incorporating both communication and remote health monitoring features, as well as emergency support. The study consisted of two phases. During the first phase, an initial version of the solution was assessed with the participation of potential end-users, using the system usability scale (SUS) method [16]. The results from the SUS assessment were explored in more depth with a series of interviews, which provided validation of the effectiveness of certain design choices and applied good practices, as well as valuable insights on a few open issues. Based on the feedback acquired during the first phase, the system’s user interface was redesigned, so as to incorporate important findings. A second SUS evaluation has provided evidence of the effectiveness of the newly applied guidelines on the system’s usability.

2. Background

2.1. State-of-the-Art in Homecare

Homecare, which is the application of telecare in the home environment, has evolved greatly as a field, due to both financial and medical, as well as personal factors [4]. With regard to the financial aspect, the fast ageing of the population in developed countries has led to a dramatic increase in elderly care costs [5]. Continuous health monitoring allows for more effective supervision and assessment of the patient’s status and therefore facilitates early diagnosis, which in turn can reduce the cost of medical care. Similarly, remote health monitoring of seniors who live alone enables healthcare professionals to timely detect relapses or acute episodes, by continuously recording critical information, such as falls, poor adherence to medication, changes in physiological parameters or cognitive decline, and has the potential to improve treatment results [4,5].
Initially, homecare services targeted chronic patients requiring support at home, but eventually expanded to aid more vulnerable groups and facilitate more purposes, including bolstering seniors’ quality of life and assisting their independent living [4]. Modern systems used in homecare usually include features that support one or more of the following services:
  • Communication and social contact: A number of platforms include communication functionalities, such as videoconferencing, email or chat, allowing seniors to remain in contact with their families and peers. Social networking features, such as newsfeeds and multimedia galleries, enable them to keep up with community events and stay connected with their loved ones by sharing content, such as photos and videos. This type of services promotes social engagement, which can help seniors who live in isolation and may be struggling with loneliness, boredom and depression. Also, such features facilitate the creation of a supportive network of caregivers. Examples of commercial systems offering this type of service are “Claris Companion” [17], “EnGage Pad” [18] and “Gociety” [19].
  • Health monitoring: Several homecare solutions incorporate medical devices, such as pulse oximeters or blood pressure monitors, as well as other devices that measure various parameters within the home environment (e.g., cameras or physical activity trackers), to capture real-time information about the user’s physical and physiological status. The data can be stored in cloud infrastructure so that it is available to healthcare professionals, who can evaluate the information and create customized care plans, while anomalies or deviations from normal user-adjusted patterns can be automatically detected. Some well-known commercial platforms that provide health monitoring features are “BePatient” [20] and “SilverVue” [21].
  • Emergency management: Other systems focus primarily on emergency response, with features such as “red button” service, smart home sensors (e.g., smoke detectors), activity tracking through wearables and cameras, location tracking and geofencing, to identify various types of potentially dangerous situations and automatically route the required support. Examples of such systems are “BeClose” [22] and “Care@Home” [23].
This work focuses on the “HeartAround” homecare platform, which incorporates a wide selection of features that cover all of the aforementioned services and providing the widest range of use cases for the study. The system was designed and developed with an emphasis on usability, following specific established guidelines, while also incorporating a few innovative ideas. Validation of the effectiveness of these ideas on usability can provide us with new useful design guidelines. The system is described in detail in Section 2.3.

2.2. Usability Assessment Methodologies

The goal of a usability evaluation is to identify how easily potential users of a system may learn to use it and estimate their level of satisfaction with that process. Various methods for system usability assessment have been proposed, depending on the type of feedback required and the stage in the design and development of the system. Another aspect is who is involved in the process, with some methods relying on feedback from potential users and others requiring input from usability experts. There are three main approaches [24]:
  • Inspection methods: This type of method involves observation of users by an expert. Popular methods of this type are ethnography, heuristic evaluation and pluralistic inspection. Users are usually not involved directly.
  • Inquiry methods: In this approach, qualitative data is collected from users of the system. Examples of this category are focus groups, surveys and interviews.
  • Testing methods: This approach refers to the collection of quantitative data from potential users in a realistic environment. Some examples are benchmark testing, remote usability testing and the Think Aloud protocol.
For the purposes of this study, two distinct methods were used. A testing method was applied first. Quantitative data from potential users were collected through a questionnaire, in order to gain a rough initial assessment, along with some indications of unresolved issues. This information was explored in more depth through a series of interview with users, which was followed by qualitative analysis, in order to examine the feedback and extract more comprehensive insights.
Based on the insights acquired from these interviews, the system’s user interface was redesigned to incorporate specific amendments, customization capabilities and features, aiming for the amelioration of the system’s usability and its overall appeal to potential users. To attest the value of these amendments, the quantitative evaluation was repeated, in order to compare the results with the initial score.
In order to select the appropriate tool for the study, a number of popular and questionnaires with proven reliability were considered, including the SUS [16,25,26], the Website Analysis and Measurement Inventory (WAMMI) [27] and the Questionnaire for User Interaction Satisfaction (QUIS) [28]. In the end, the SUS questionnaire was selected. SUS provides a high-level subjective view on usability [25]. It is also technology-agnostic, meaning that it is suitable for use with a variety of products, ranging from hardware to mobile apps, which are both aspects of the system examined in this study. Furthermore, SUS has been previously used with telehealth systems [29,30,31]. The method is also non-proprietary, as well as easy and low-cost to implement. Most importantly, the SUS method has been proven to be robust and highly reliable [25].

2.3. The “HeartAround” Platform

2.3.1. General Description

“HeartAround” is an integrated platform for assisted independent living, incorporating communication, health monitoring and emergency response features [32]. The system connects end-users with healthcare professionals, relatives, friends and other caregivers, creating a social and support network. It is also capable of communicating with a wide range of medical and wearable devices, which allow for continuous monitoring of the user’s biosignals and physical activity.
The user is provided with a tablet or other smart device (e.g., set-top box) and a set of Bluetooth-enabled medical devices according to their needs (e.g., blood pressure monitor, blood glucose meter, oximeter, etc.), as well as a smartwatch. The user’s doctor is able to access their patient’s personal health records (PHRs), which may include medical history, laboratory test results, medication and allergies, and utilize the available analysis and visualization tools to assess their health condition. The doctor may also define a monitoring schedule, comprising of a timeline for specific measurements with respective thresholds for each type of measurement, as well as a treatment schedule, which includes prescribed medication and the timeline of its reception. Patient compliance is encouraged with smart reminders.
The system processes the data related to the schedule on the cloud and whenever a measurement exceeds the respective threshold, the doctor is automatically notified via a preselected communication channel (push notification, email or SMS). The platform also facilitates a helpdesk service, which can provide emergency support when anomalies or potential situations are detected, or at the user’s request.

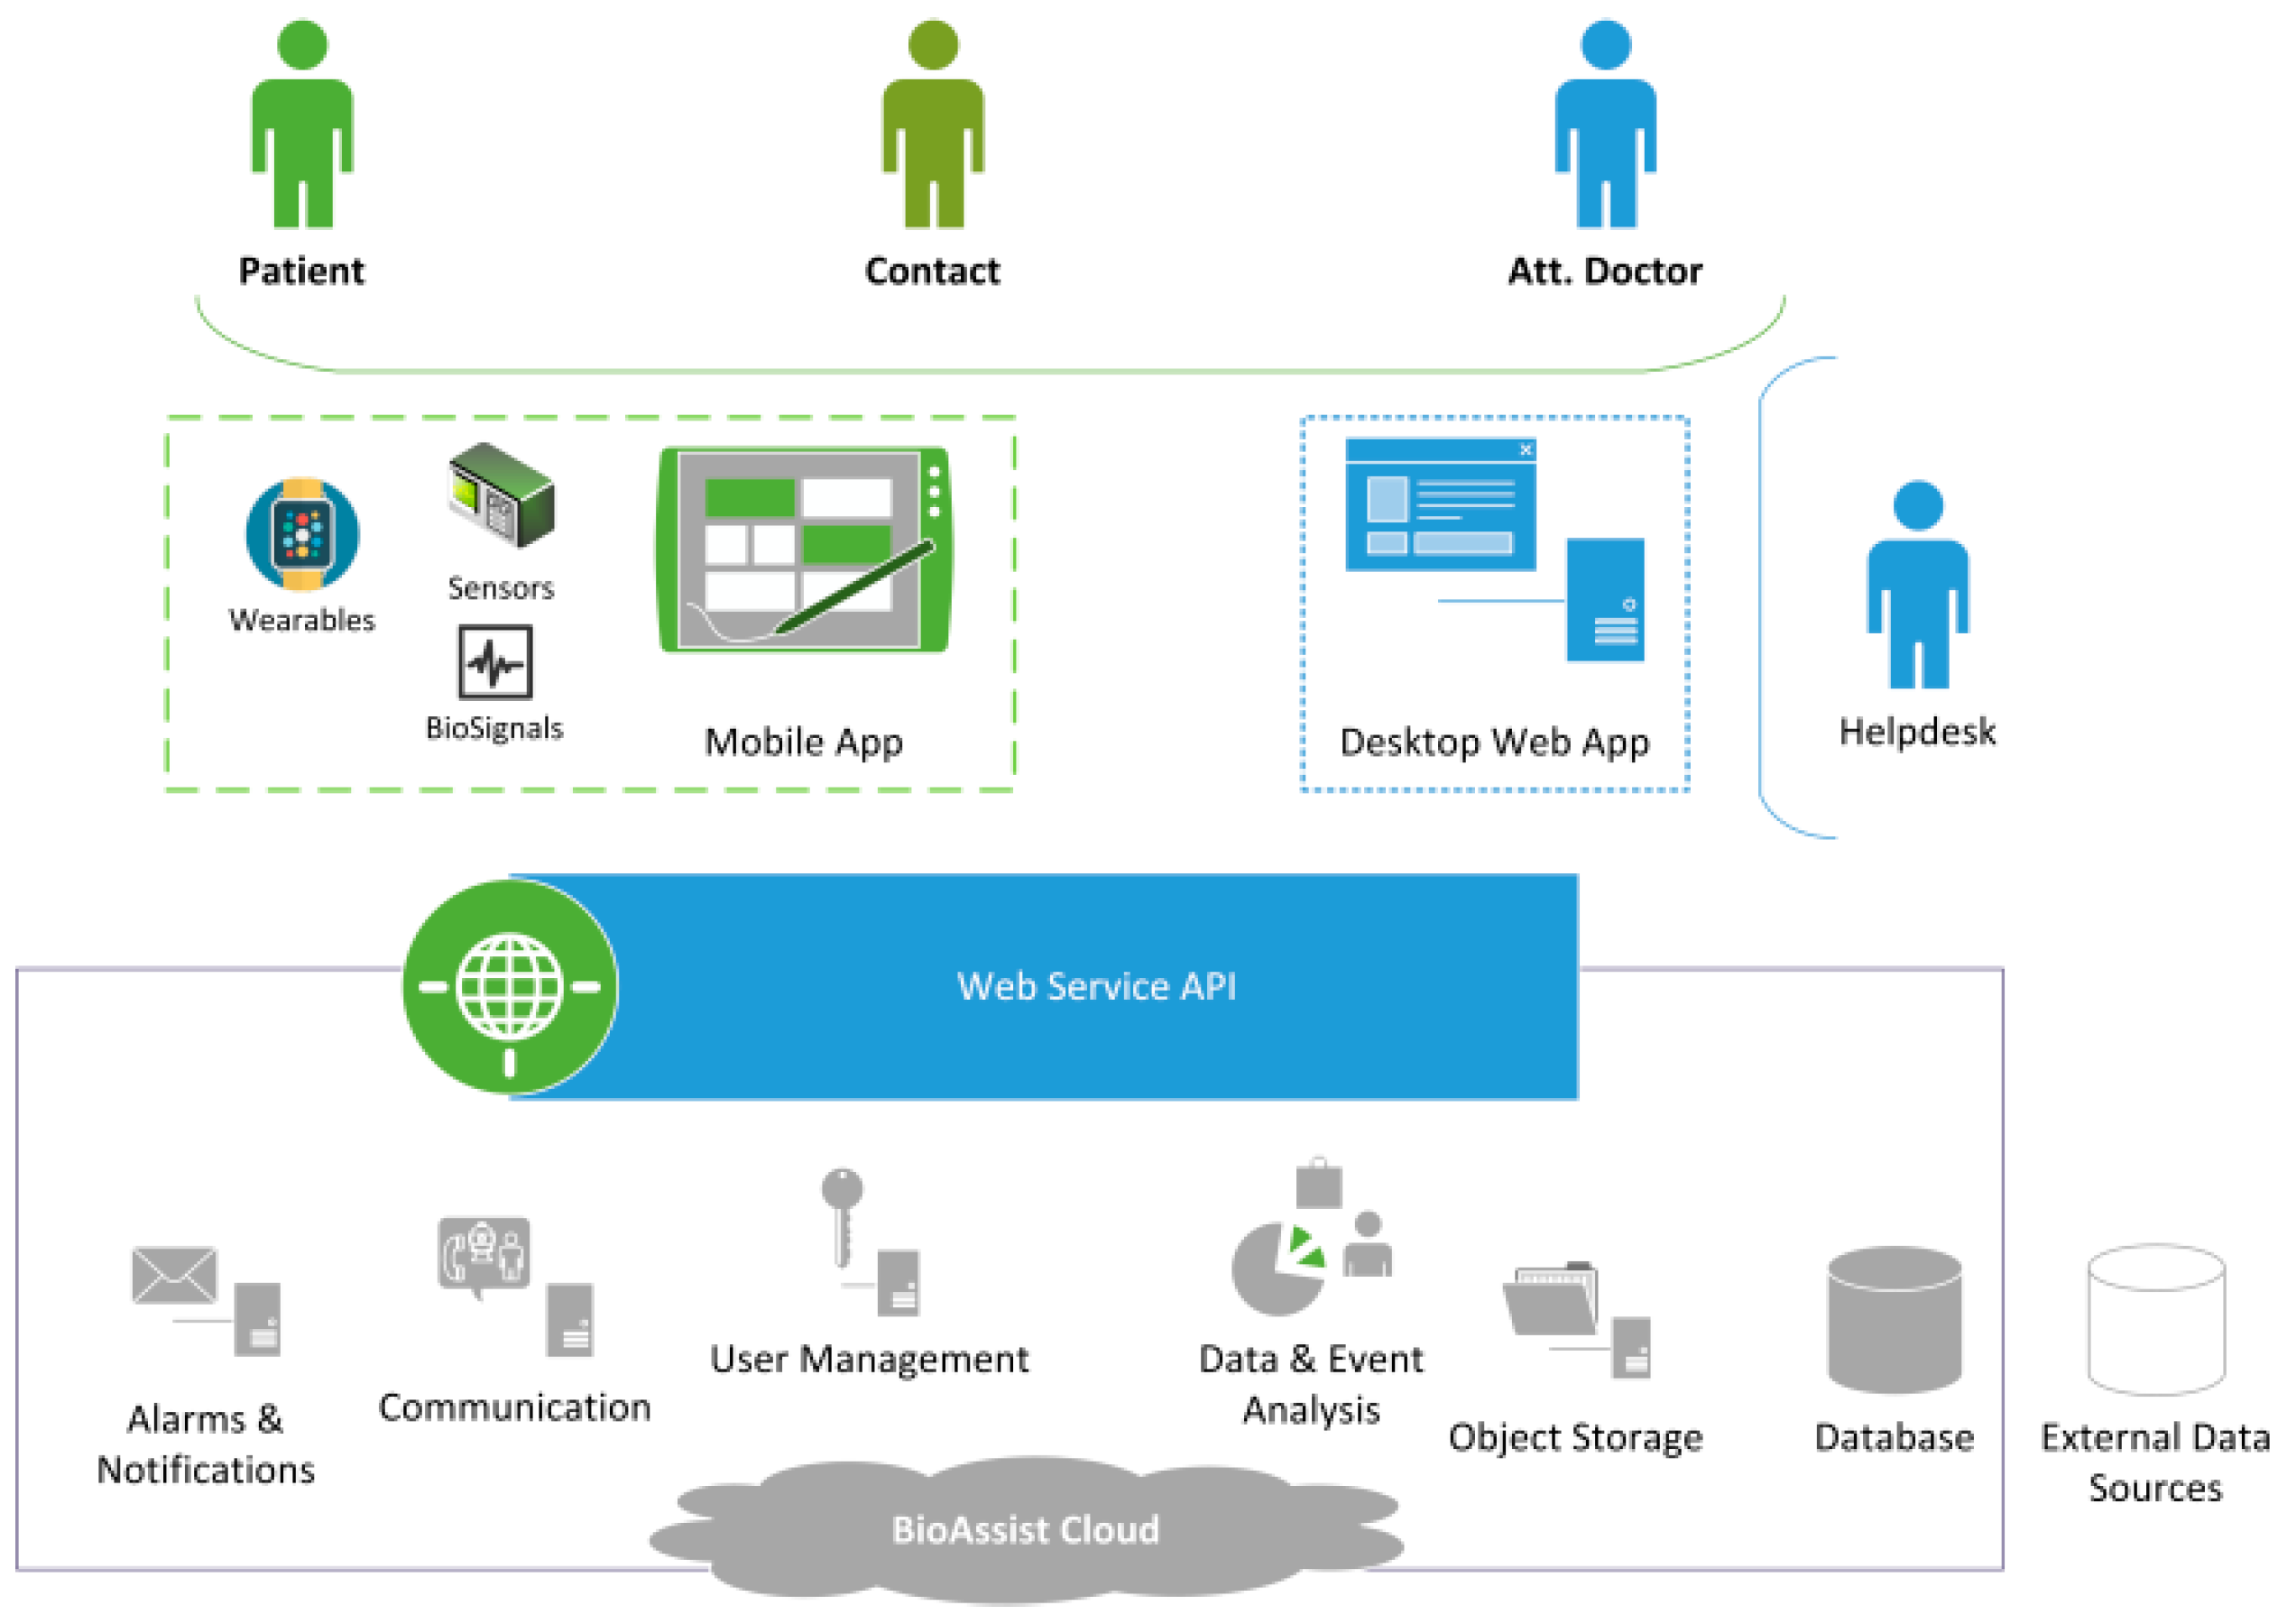
2.3.2. System Overview

There are four sub-systems comprising the “HeartAround” environment (Figure 1): A mobile application, a web-based application, a helpdesk application and the back-end, which is a set of cloud-based services and components. Appropriate interfaces for all types of users are provided. A combination of Java and JavaScript technologies and frameworks have been used for the development of the various platform components, while the WebRTC protocol has been utilized to add videoconferencing capabilities [33].
The mobile application provides the end-user interface with the system, incorporating the required functionality for communication with the platform services and acting as a gateway to the various wireless medical devices and wearables. The user interface (Figure 2), which is the focus of this study, is designed to be adaptable to various screen sizes, allowing flexibility and compatibility across devices.
The web-based application includes the core functionality for interacting with all user types. While the mobile application is simplified and designed to facilitate usage by elderly users, the web application boasts a rich interface, including configuration of user and application settings and additional visualization features. The helpdesk application provides a suitable interface for healthcare operators, who are able to monitor and receive emergency requests from patients and initiate the appropriate response.

2.3.3. Functionalities

The mobile application provides the following functionalities to end-users:
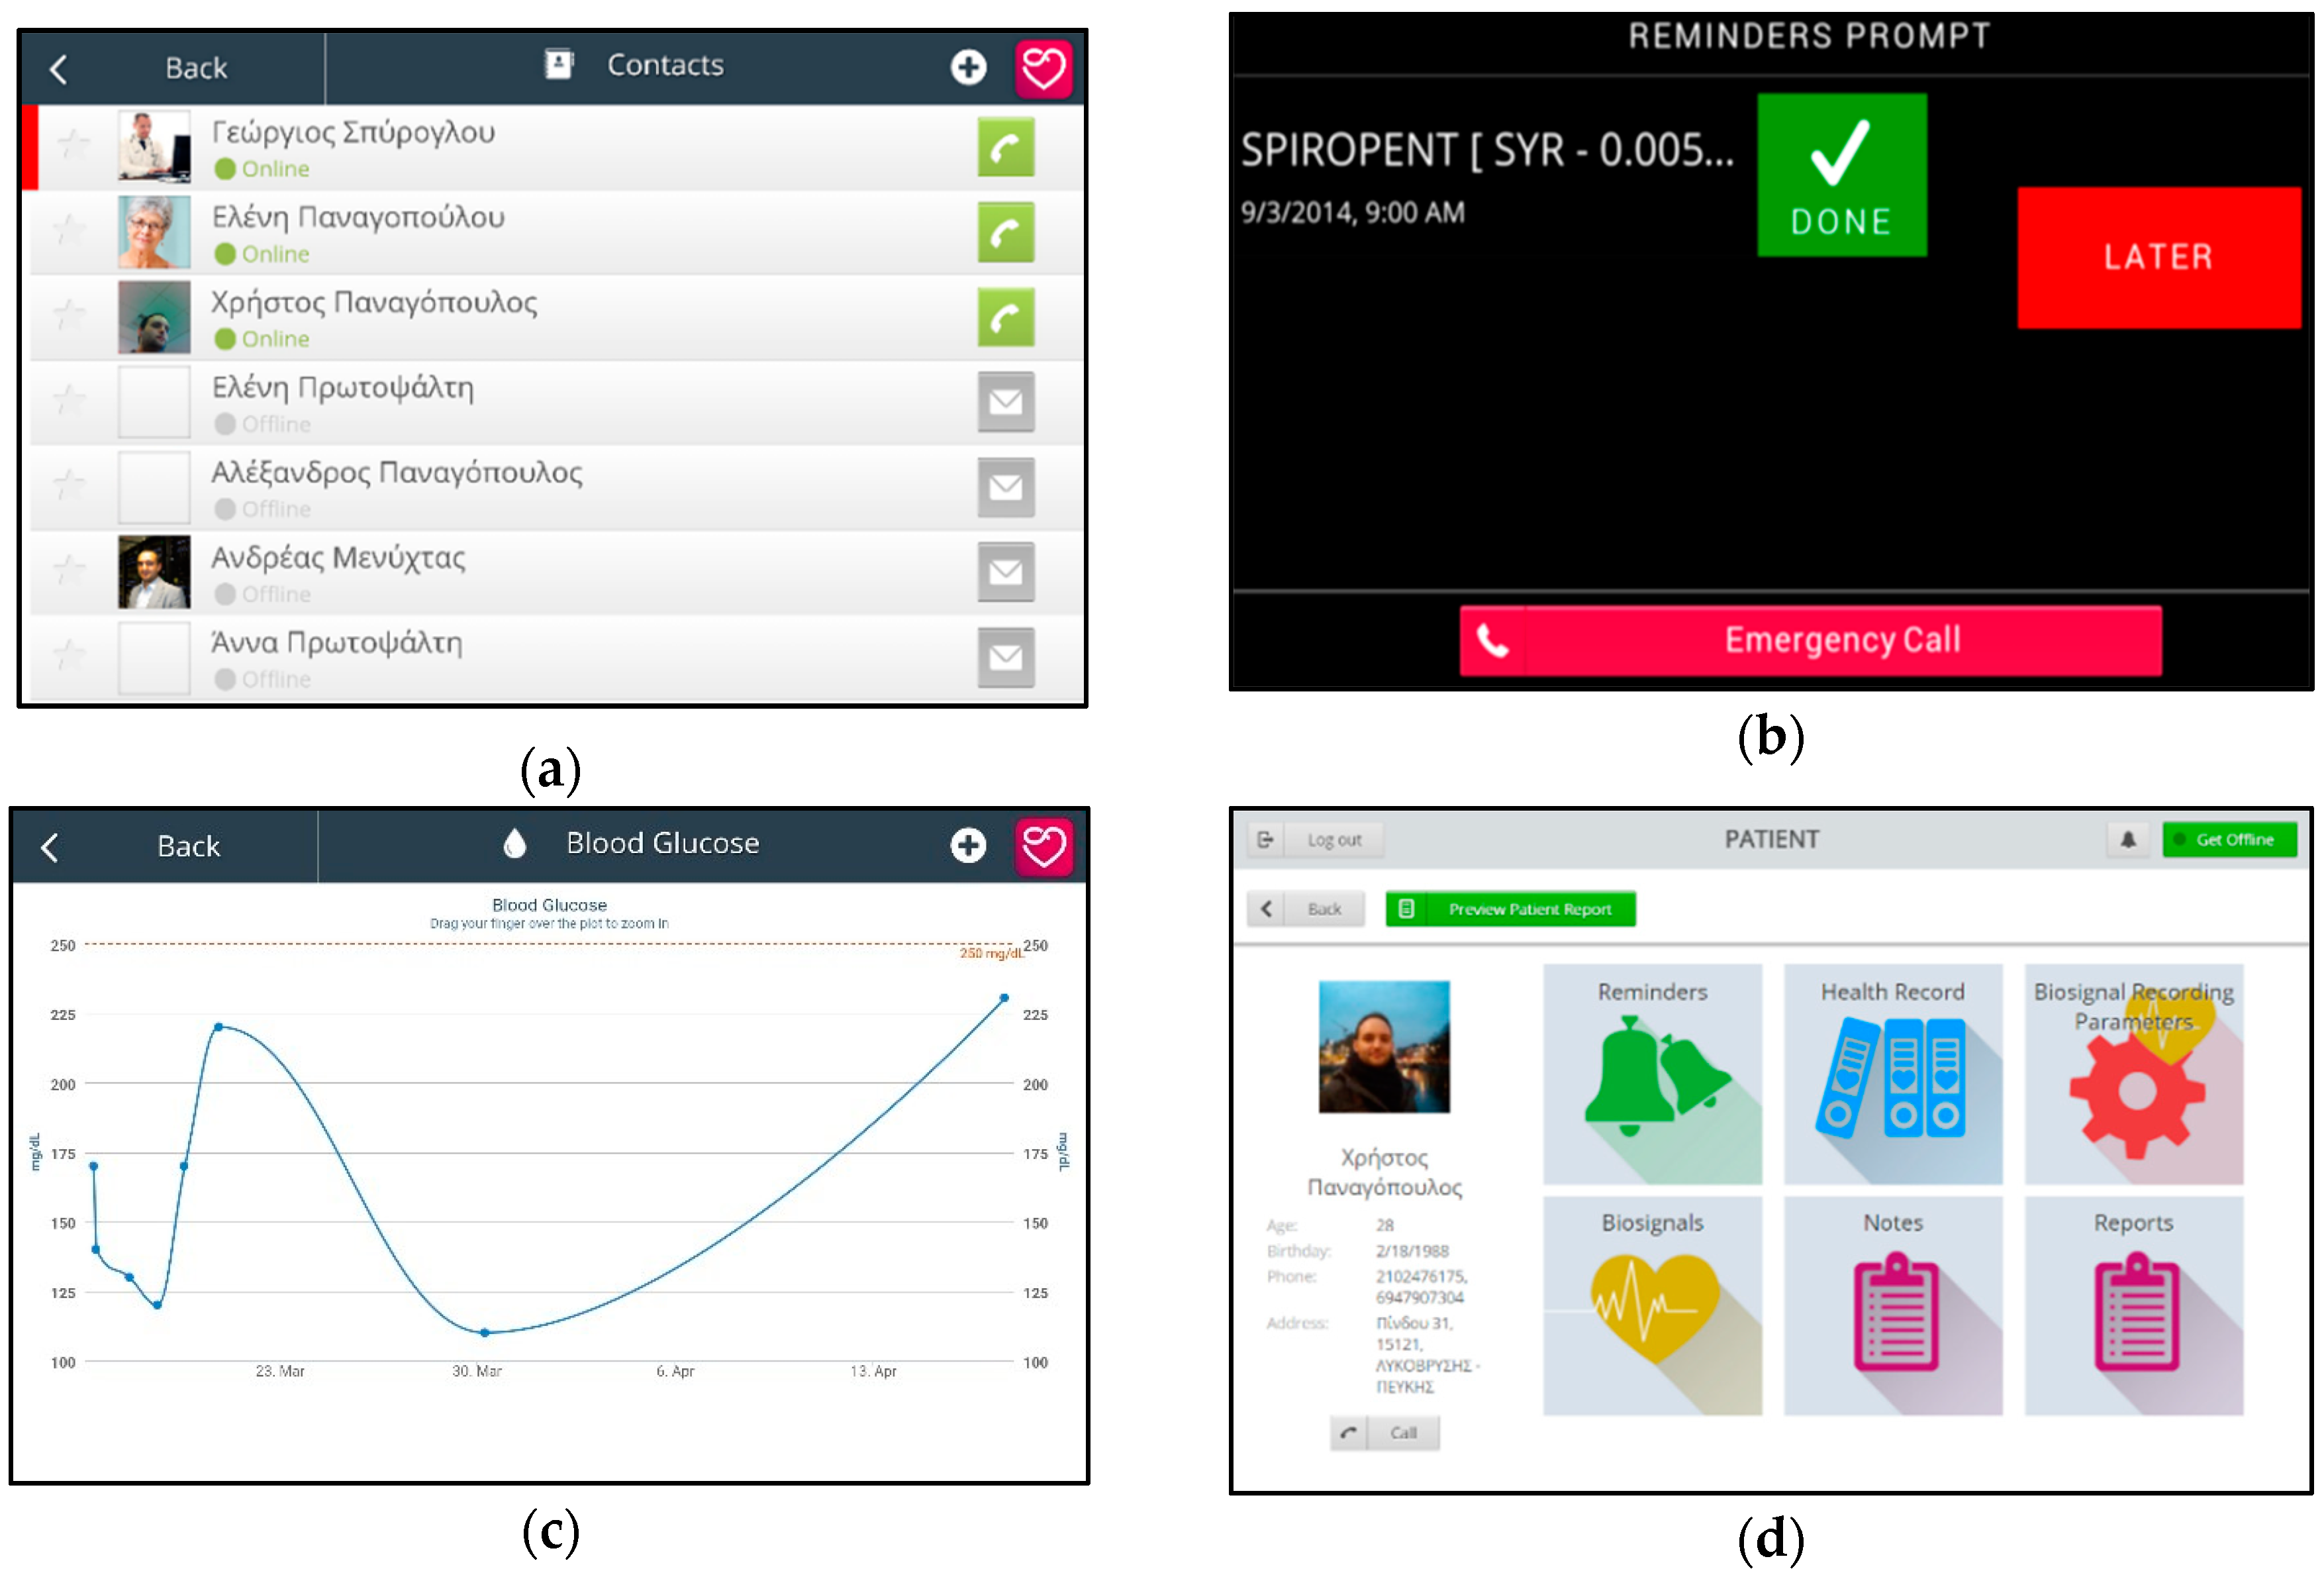
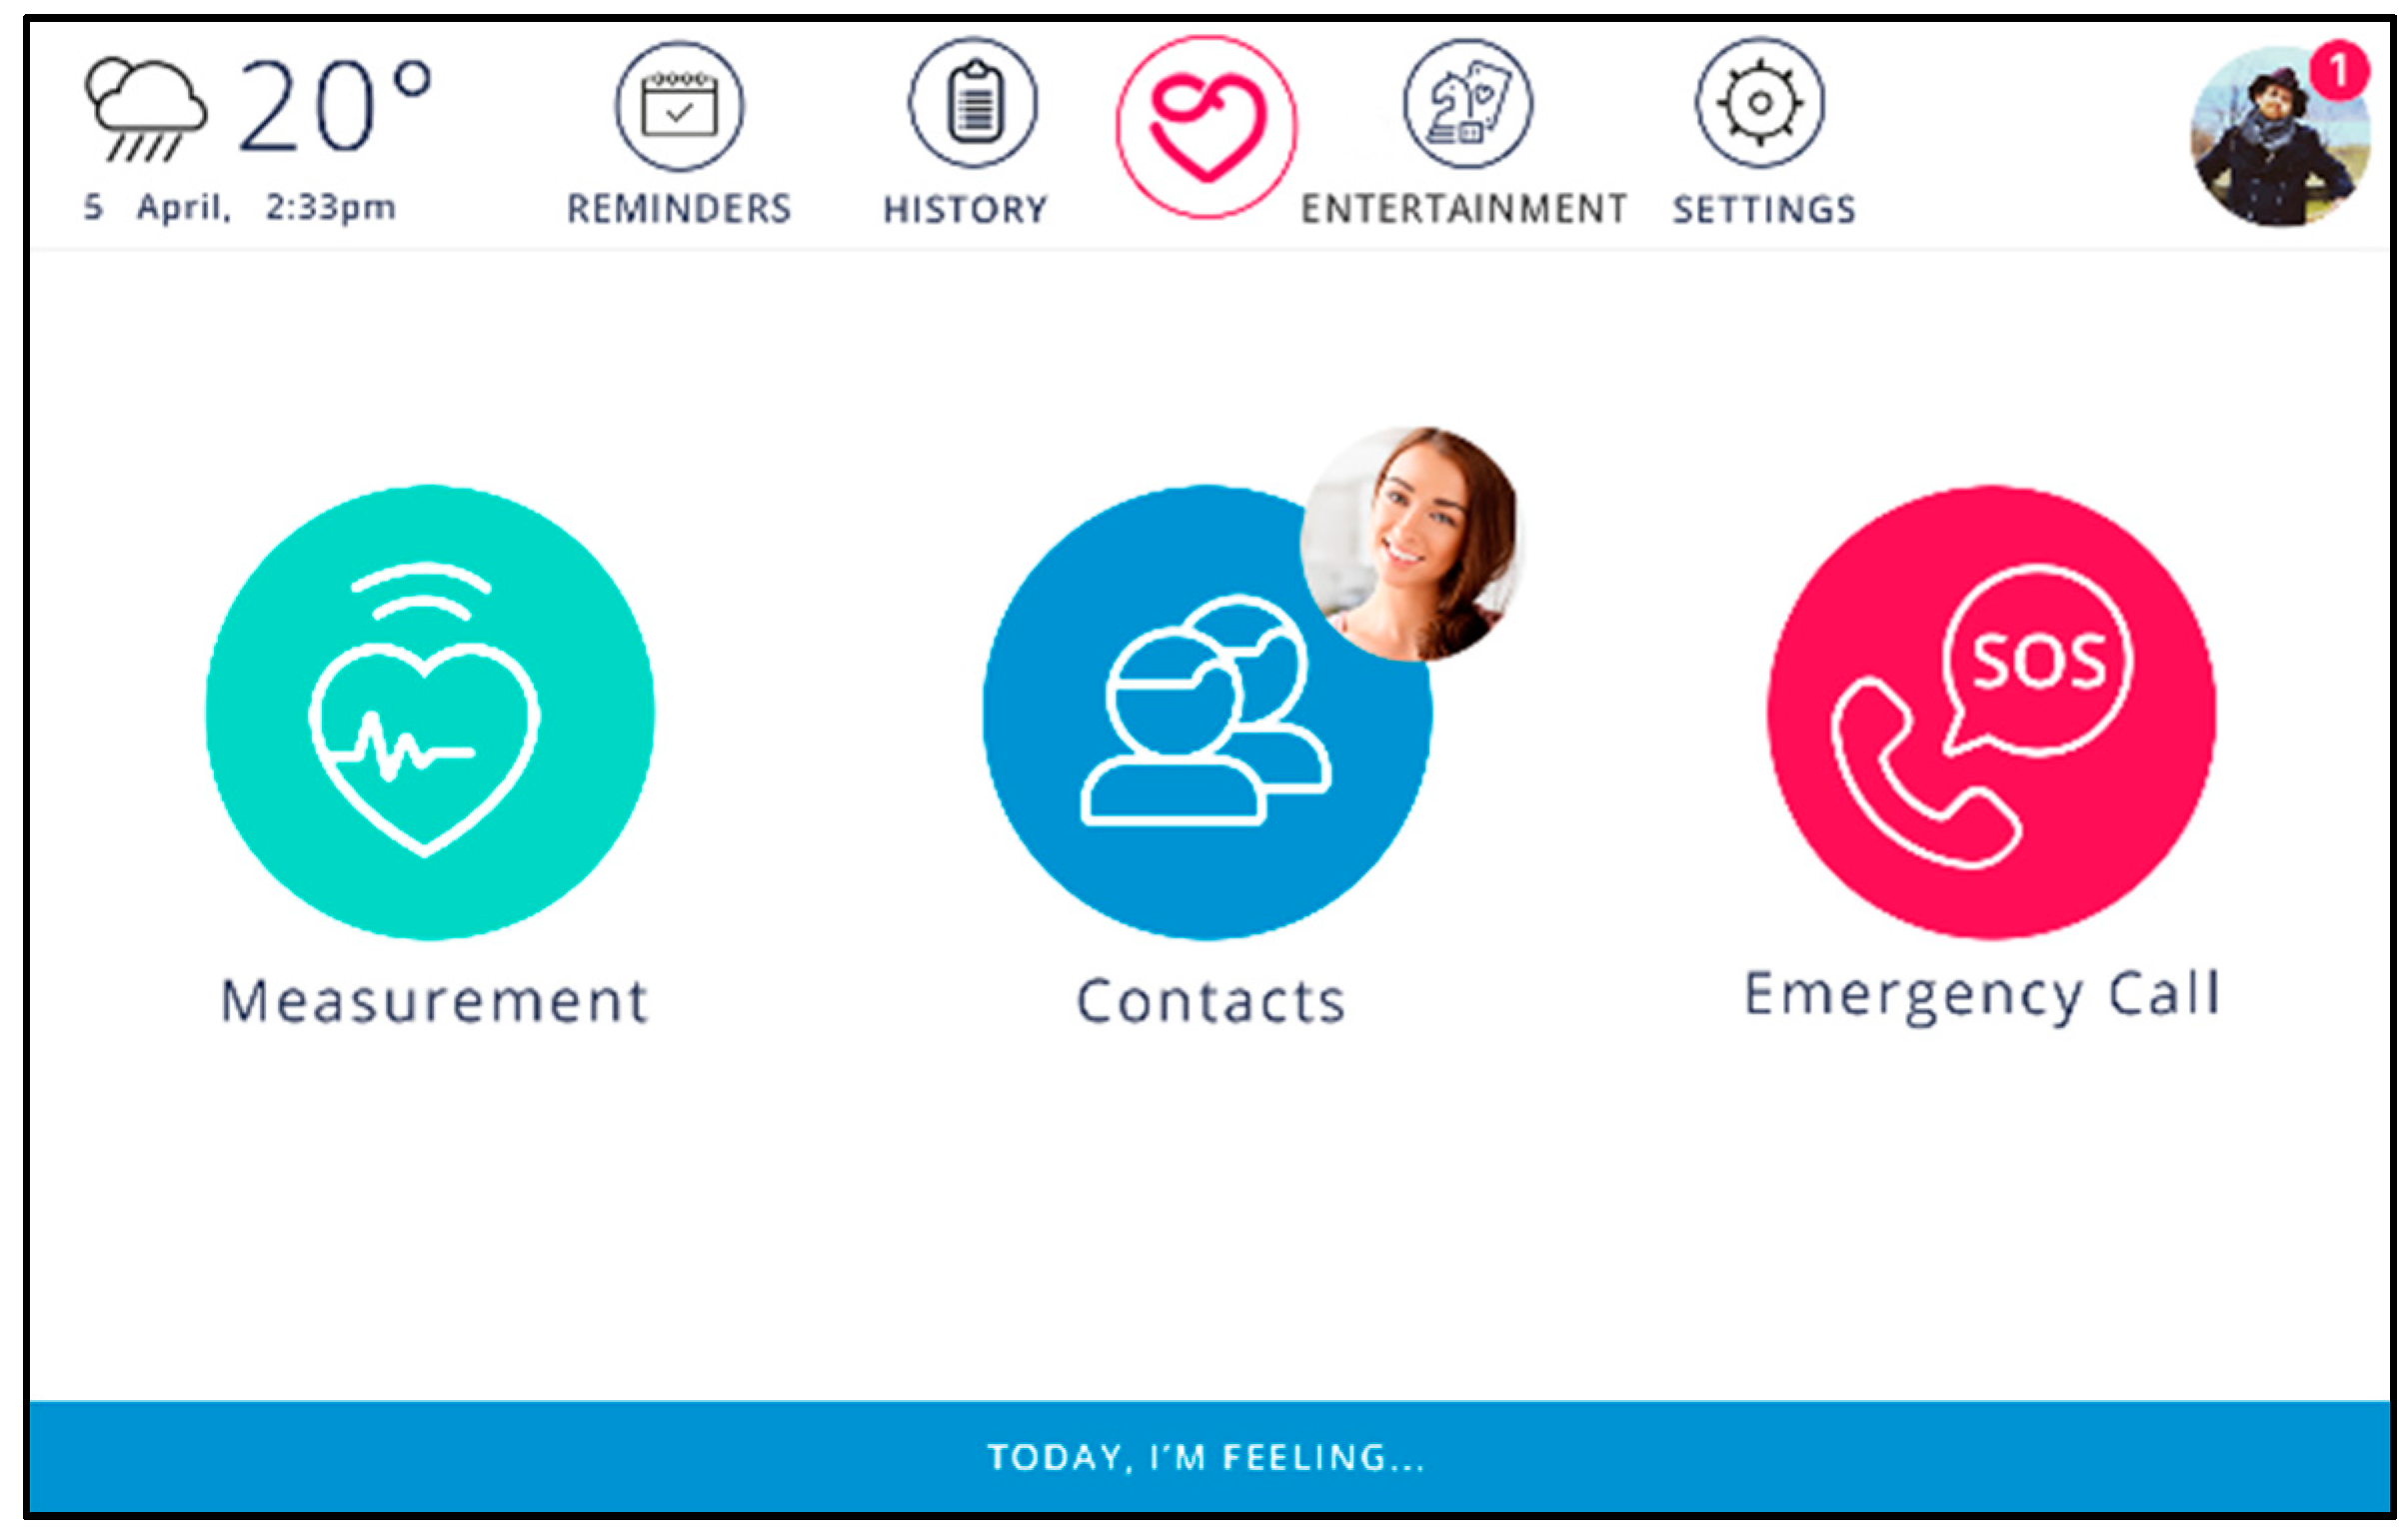
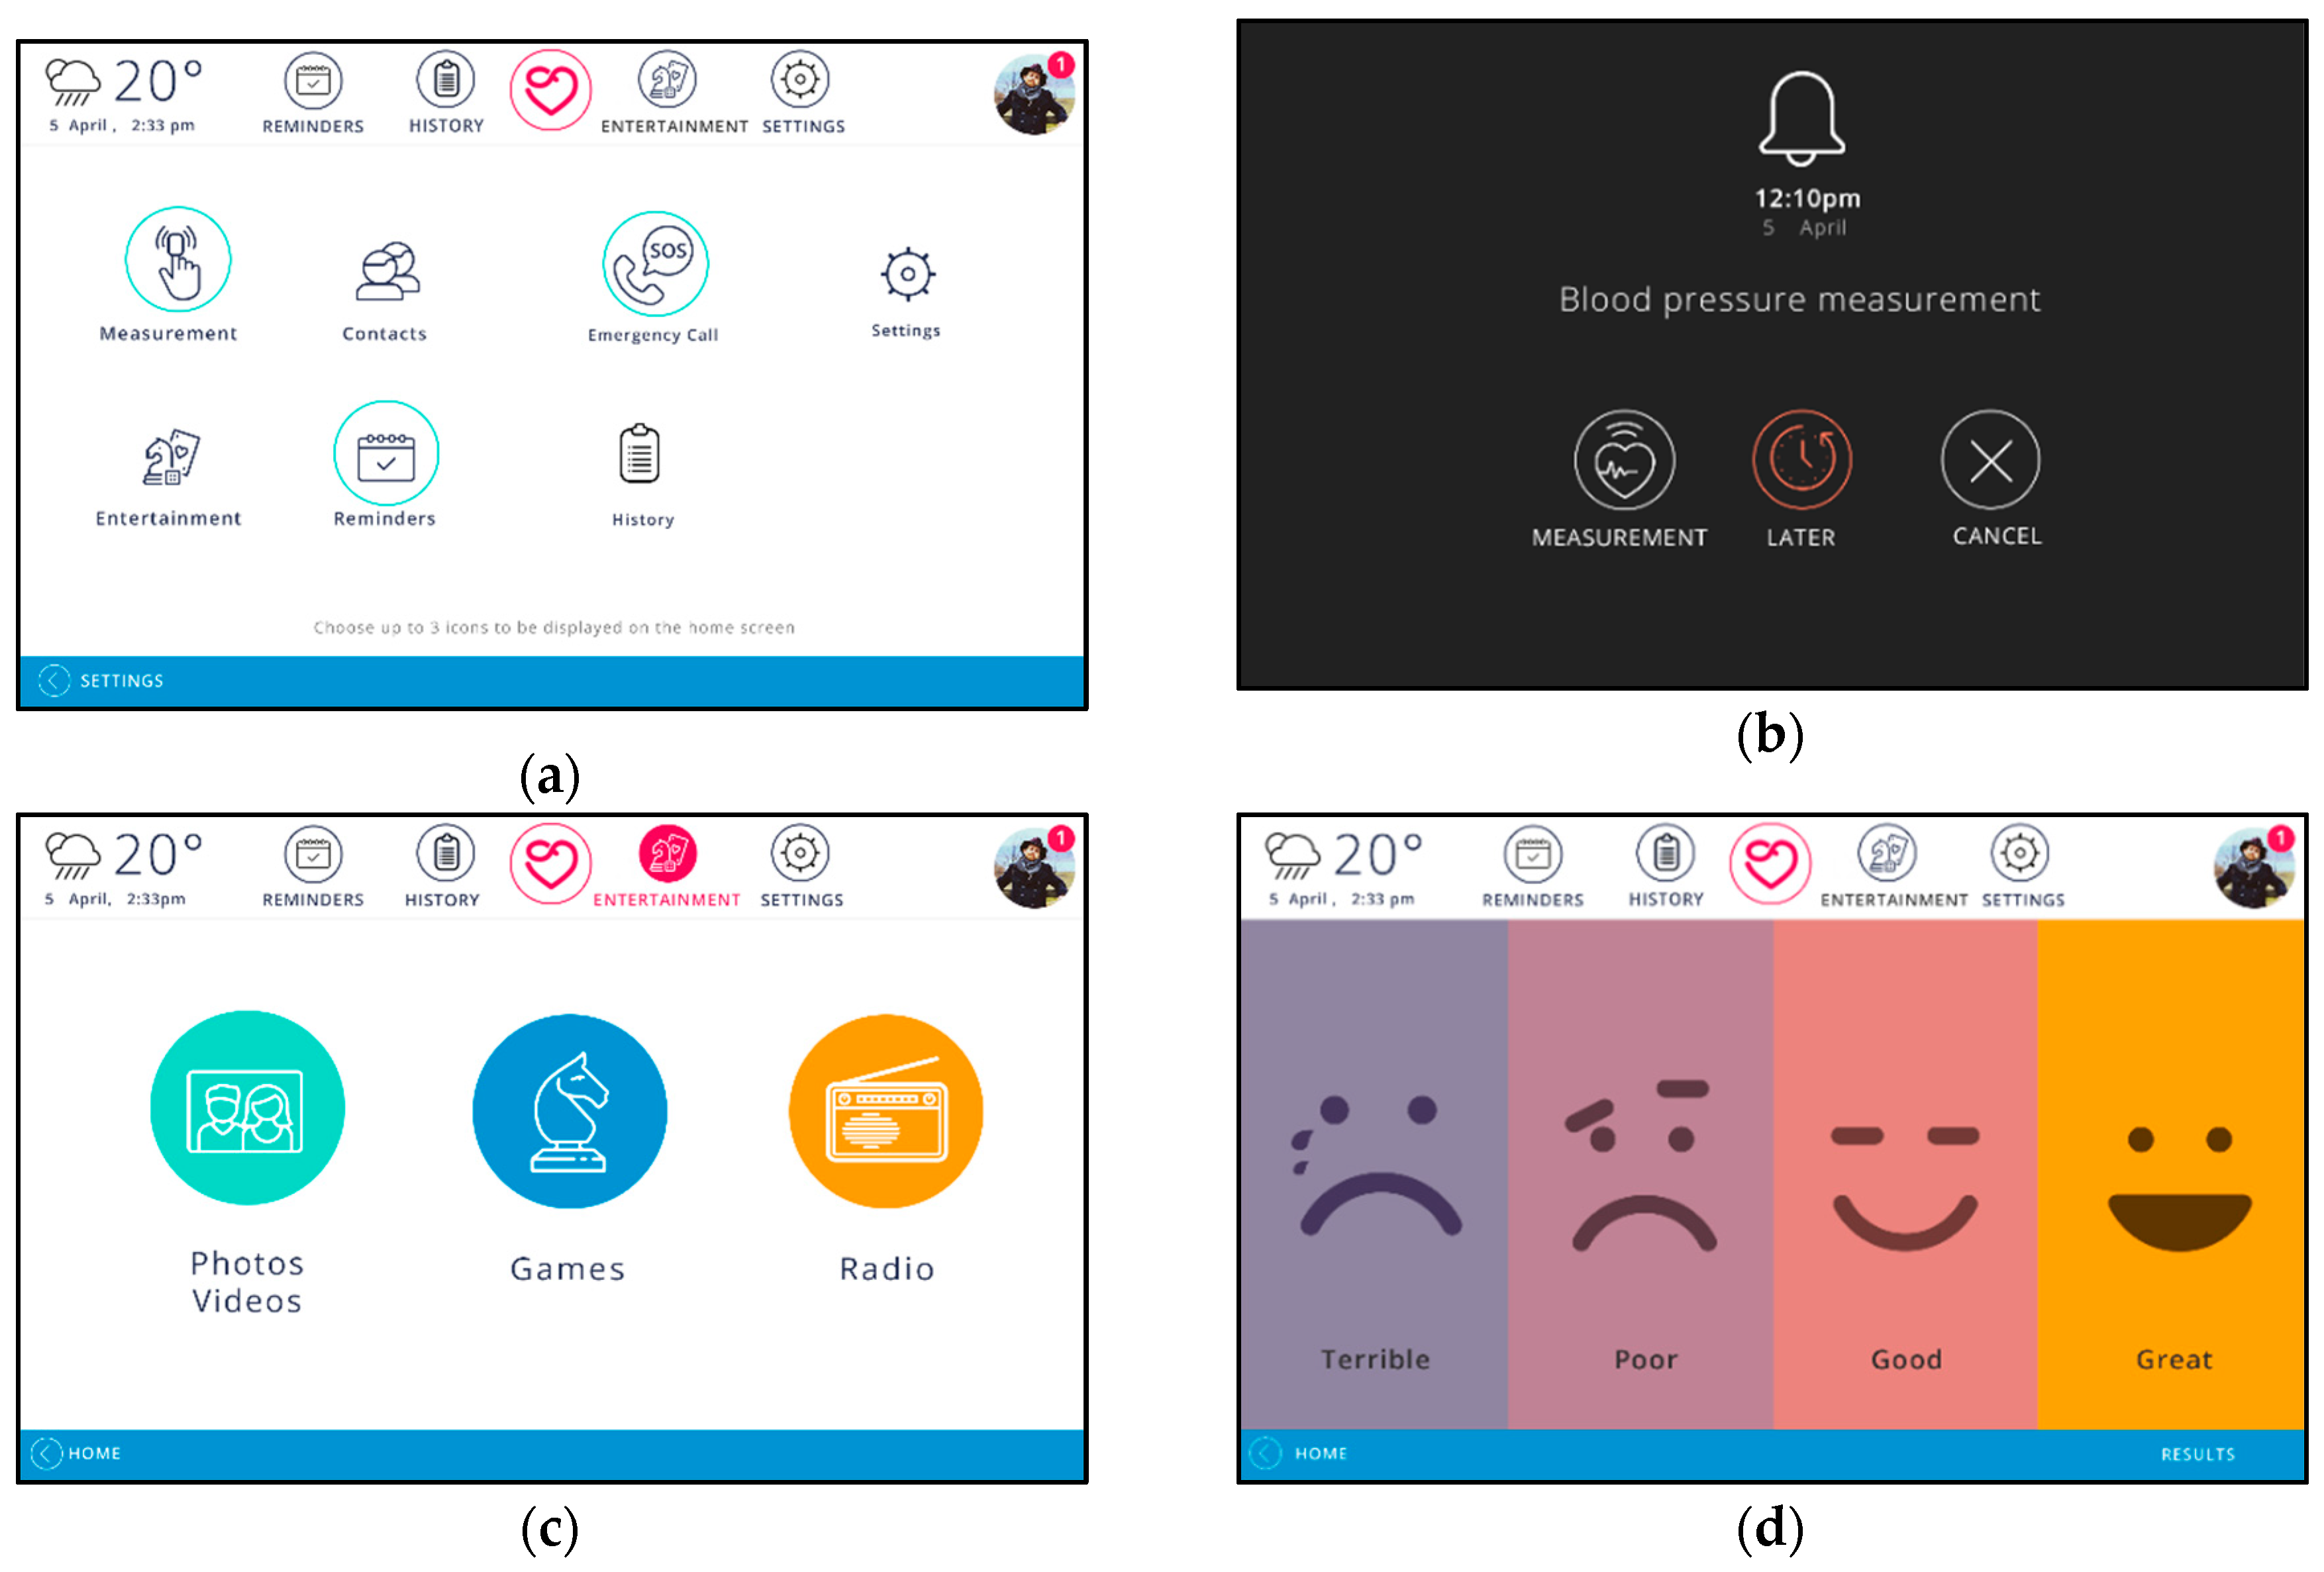
  • Contact Management and Videoconferencing: Each user is able to manage a list of contacts, which may include friends and family members, as well as their doctors. These contacts form a circle of caregivers, who can access the system from their own devices and communicate with the senior, as well as receive valuable information about the senior’s well-being and notification in case of need. The contact list can also be managed remotely by a caregiver or the helpdesk. Contacts are displayed in the “Contacts” screen with their name and profile photo. The user may initiate a video call to a contact with a single touch. Contacts that are available for videoconferencing are grouped at the top of the list, as can be seen in Figure 3a.
  • Reminders: Reminders can be set, either by a caregiver or by the user, for health-related tasks, such as doctor appointments, or daily activities and social engagements. Reminders for medications and measurements are created automatically. The user receives a reminder notification on the tablet (Figure 3b). In case the user skips a medication reminder, a caregiver is automatically notified, in order to ensure adherence to the treatment.
  • PHR and Biosignals: The platform incorporates an integrated, cloud-based personal health record, which includes demographics, medical history, medication, allergies, laboratory test results and personal statistics, such as age and weight. Patients are able to view and add content to their personal record via the mobile application. Users can also utilize compatible wireless sensors to monitor and record their biosignals and physical activity. New measurements are stored automatically in their personal record. The user can view past measurements at any time on their tablet, in the form of a graph. An example is shown in Figure 3c. Users can grant their doctors access to their personal health record. Doctors can view and update their patients’ records through the doctor’s web inter-face (Figure 3d), manage prescribed medications, set the daily schedule of biosignal measurements and patient-specific thresholds for each type of measurement, create reminders and receive reports on their patient’s status.
  • Gallery: End-users are able to view photos and videos uploaded by their contacts. They may also upload content of their own. Whenever one of the user’s contacts uploads a new photo or video, the user receives a notification. While the application remains idle, the device acts as a digital frame, displaying all of the user’s and their contacts’ photos in a slideshow. The user can also manage which photos are displayed in the slideshow.
  • Emergency Call: In case of emergency, the end-user can receive assistance and medical advice from the service’s helpdesk, with the touch of a single button.
The following figures illustrate the corresponding views on the mobile and web application.

2.3.4. Applied Guidelines for Usability

Targeting seniors’ needs and considering their limitations, the system was designed based on the following guidelines, leveraging on related literature [6,12,13,14,15,34], while also implementing a few innovative ideas.
  • User Interface: The mobile application user interface was designed in alignment with well-established usability requirements for elderly people and people with sensory impairments. Large buttons, icons and fonts have been used to maximize readability. The colors that were used were chosen so as not to distract users’ interaction with the system, taking into consideration seniors’ poor color and contrast sensitivity. More than ensuring visual accessibility, colors were used in an appropriate way according to their common interpretations (e.g., green is usually interpreted as positive).
  • Devices: Seniors must be able to interact with the system as naturally as possible, so the choice of device is crucial. Different people express different preferences, which can greatly affect a user’s level of comfort with a system, with seniors usually opting for devices they are already familiar with. The mobile application is capable of adapting to the user’s preference, with a responsive design that can run on various devices, including smartphones and tablets, but also on TVs. Considering that many seniors experience difficulties in using the keyboard or the mouse, especially those suffering from tremors of Parkinson’s, the system focuses mainly on touch screen devices.
  • Multimodality: The use of multiple modalities is required to address the needs of people with sensory impairments, as the acuity of sensory modalities declines with age [13,14], especially in the case of chronic patients. For example, diabetes may lead to impaired vision, while the number of people with both vision and hearing impairment is increasing. This highlights the importance of alerts based on touch. For this reason, the system presents notifications and reminders with sound and visual alerts on the tablet, as well as vibration alerts on the smartwatch. Concurrent use of multiple modalities ensures maximum effectiveness.
  • Understandability: The majority of seniors perceive mobile applications as computer-based systems, which can cause them anxiety or fear. The user interface contains few buttons, to address this problem. For simplified navigation, nested menus were avoided, ensuring that the application is easy to understand. Moreover, important information is always presented with icons, rather than text alone, to aid users to understand quickly what they need to do next.
  • Automation: In order to minimize the level of action required from the end-user, several tasks can be executed automatically (e.g., creation of reminders, auto-answer for video calls). In addition, tasks may be assigned to caregivers (e.g., creation of measurement schedule, contact list management). This ensures simplicity of use and decreases the potential of fatigue or boredom when using the application. In addition, the application incorporates mechanisms for automatic connection with devices, which greatly simplifies data entry, as well as mechanisms for automated recovery in case of faults, including automatic reconnection with the service and automatic relaunch of the application.
  • Motivation: In order to motivate end-users to engage with the system, enjoyable features, such as the gallery functionality, are a key addition. Content sharing between end-users and their families is also important for promoting social engagement. Furthermore, the application’s visualization capabilities allow users to view a day-to-day graphical representation of their health status, providing an important communication tool between patients and doctors and a sense of empowerment to the users.

3. Usability Evaluation

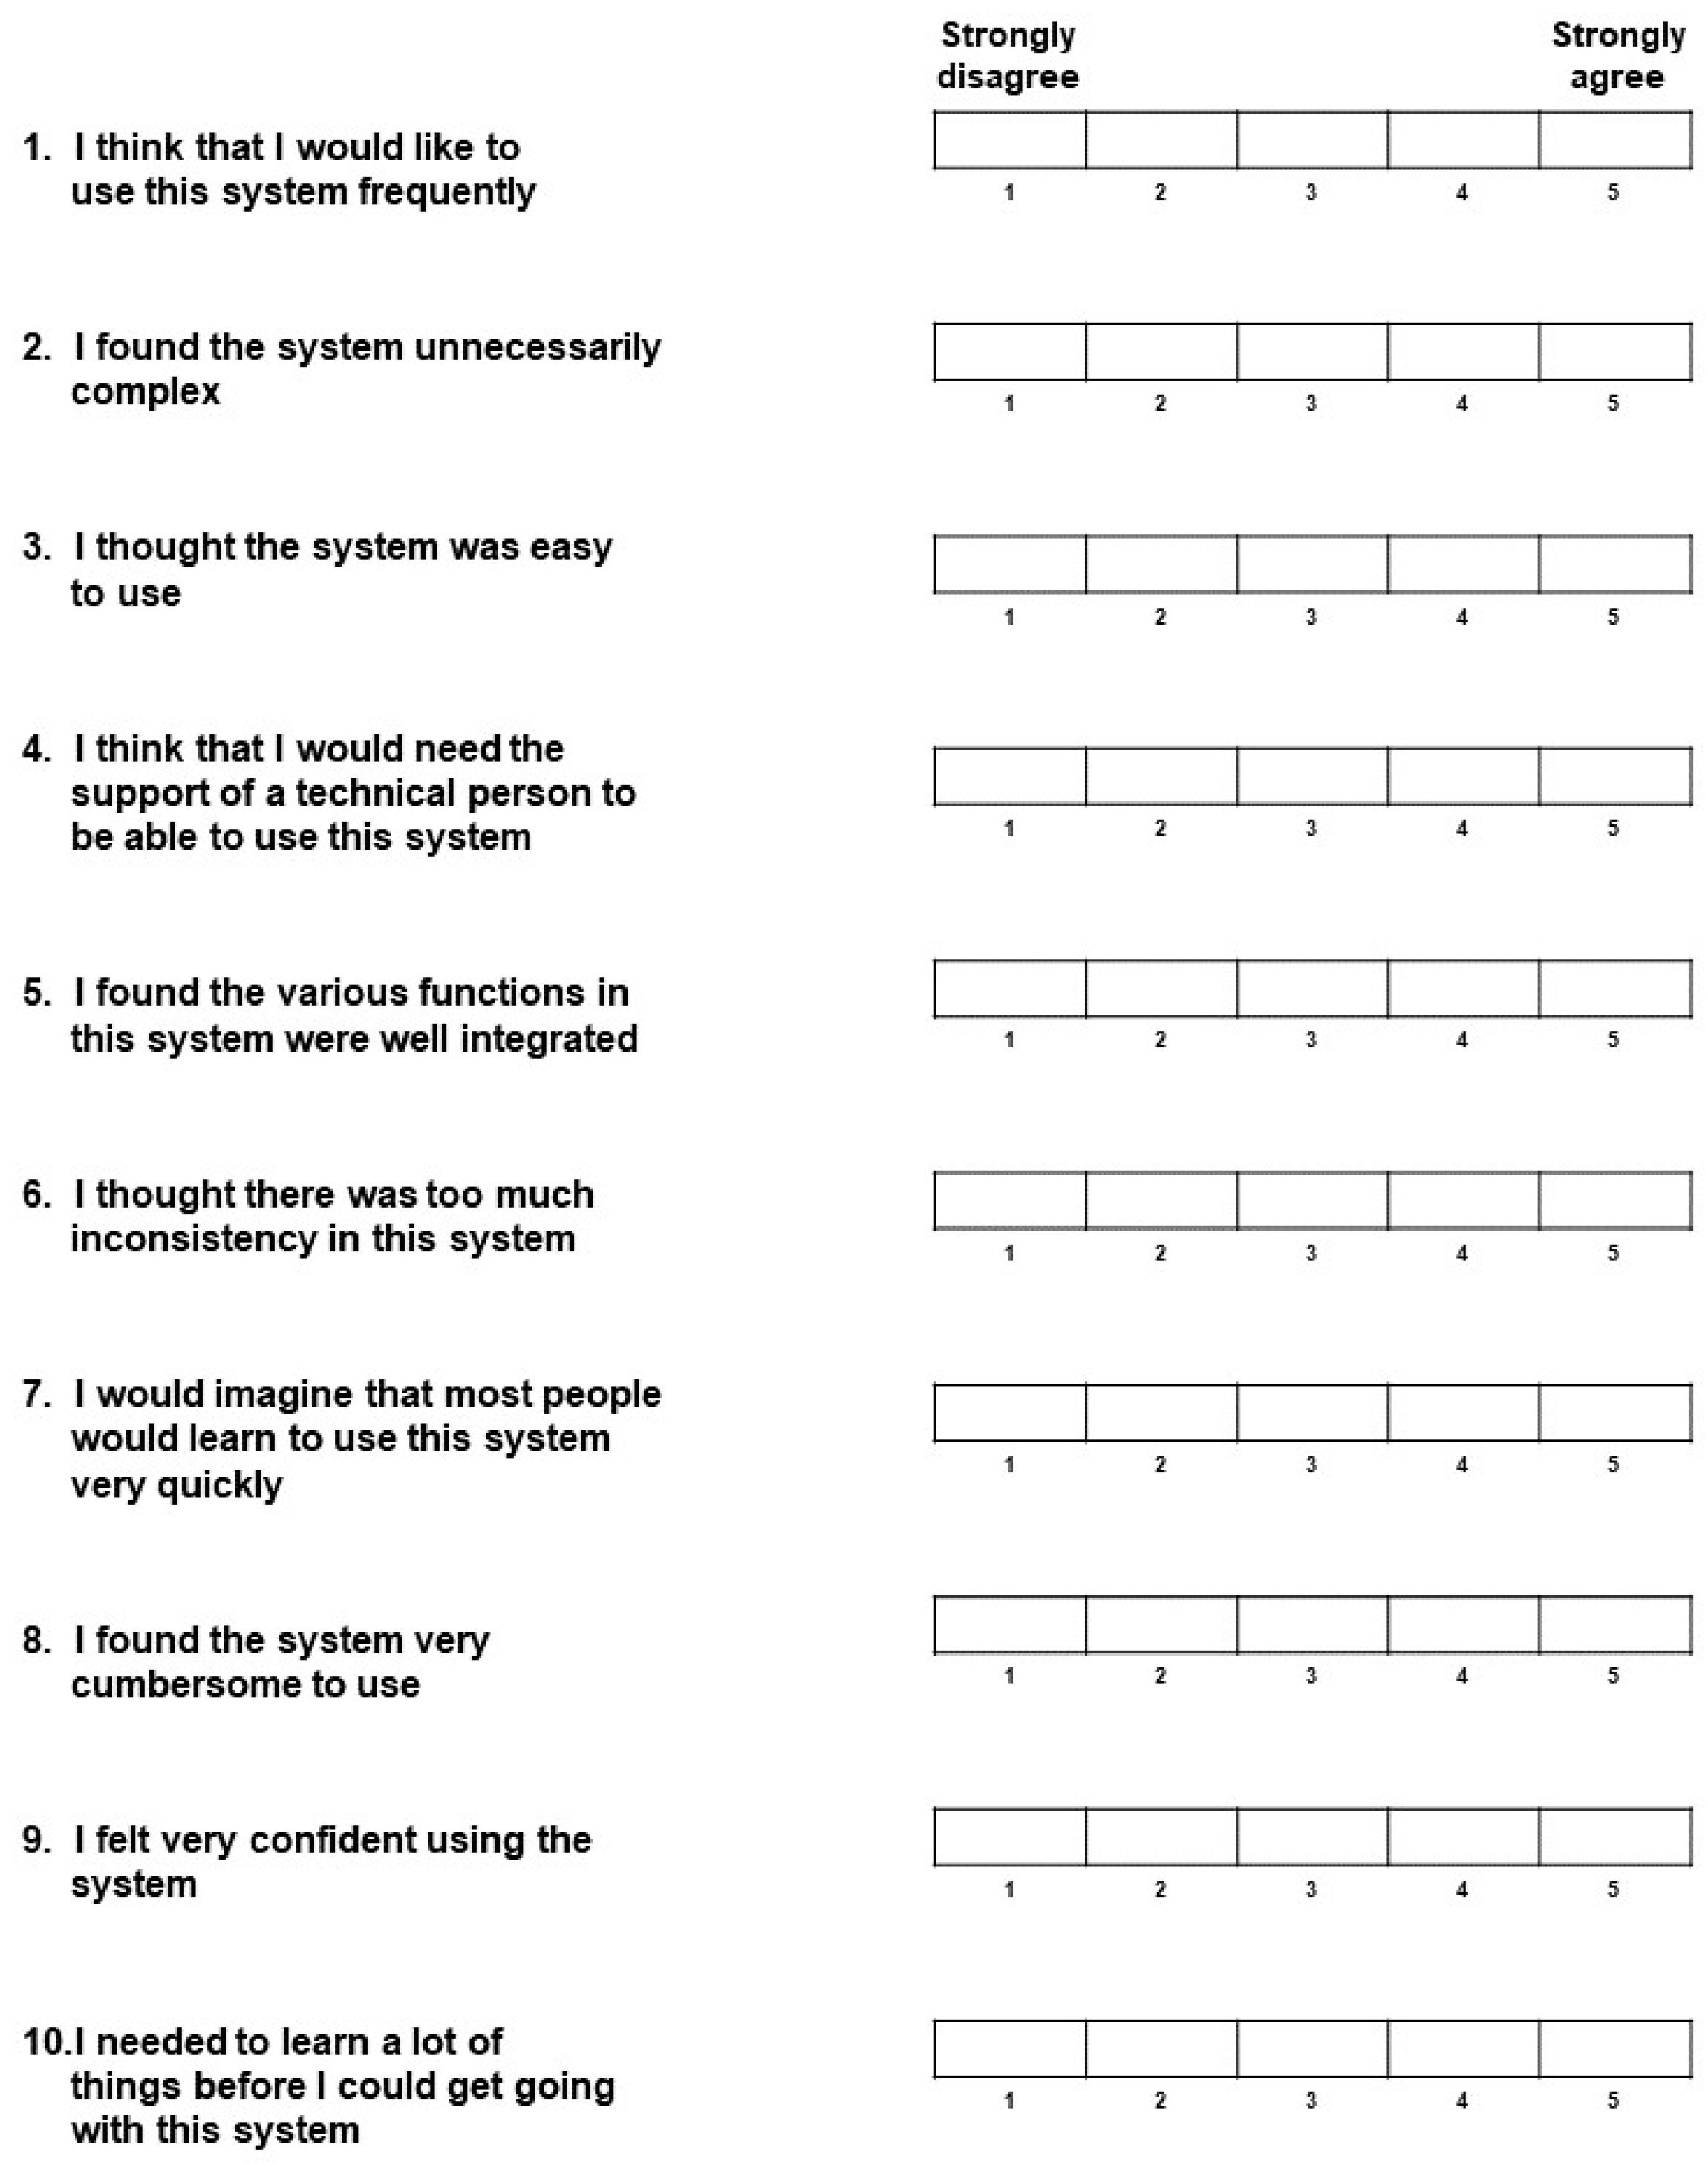
3.1. Initial Evaluation with SUS

3.1.1. Setup and Methodology

Participants recruited for the study were potential end users of the system. Individuals younger than 60 or facing cognitive disorders were excluded. A random sample was recruited, which included 30 seniors, aged between 60 and 83, with equal representation of men and women. All participants had completed at least secondary education. The sample also included individuals suffering from chronic conditions, such as cardiovascular problems. From this original sample approached, 11 men and 13 women eventually accepted to participate and respond to the questionnaire, while the rest were unwilling to complete the evaluation, for reasons such as ignorance or lack of interest.
The process started with the presentation of the system and its features to the respondent. Before the evaluation, the respondents were given enough time (approximately 30 min) to use the system. Within that time frame, they were asked to perform a series of simple tasks with minimum assistance, in order to explore the platform’s various features. These tasks covered the most important use cases for each of the services provided by the system and included initiating video calls, receiving reminder alerts and performing the appropriate action, use of a wireless blood pressure monitor to record measurements, viewing photos and starting an emergency call. Afterwards, each participant was interviewed using the SUS questionnaire (Figure 4). As the study participants were Greek, a validated Greek version of the questionnaire was utilized [35].
The SUS evaluation gave a score that ranged from 0 to 100. The score was calculated following the process defined by Brooke [16]. Figure 5a gives the corresponding percentile rank of usability for each score, as well as a grade between A and F. In order to be considered “Good” in terms of usability, a system must achieve a SUS score of at least 74 (Figure 5b).

3.1.2. Results

The overall score was 62.2, which was marginally within the acceptable range, corresponding to the grade D. The evaluation scores obtained ranged between 42.5 and 72.5 (mean = 59.5, median = 62.5) for male respondents and between 55 and 75 (mean = 64.4, median = 65) for female respondents. As can be seen in Figure 6a, 75% of the participant gave a score higher than 60. The highest scores, however, corresponded to the grade C, which indicates that even those respondents that had some experience with technology or had a more positive attitude towards the system still faced some issues. Despite the slight difference between score ranges of male and female respondents, no significant difference in the responses could be attributed to gender.
The frequencies participants’ answers to each question is presented in Figure 6b. Considering the answers to questions 2, 3, 6 and 8, it was evident that the majority of the respondents found the system consistent and fairly simple and straightforward. In addition, most of the participants reported feeling confident in using the system. On the other hand, the scores for questions 4 and 10 indicate that most of them felt the need for training or perhaps assistance, despite the fact that they think others would be able to learn to use the system in a very short time.

3.2. Qualitative Assessment

3.2.1. Setup and Methodology

For the second step of the study, 12 interviews with older adults were conducted (summary in Table 1). The same sample was used for this part of the evaluation, as in the previous step. Respondents were selected based on the scores given during the first part, in order to further investigate the highest and lowest scoring assessments. However, most people aged over 75 were unwilling to participate in this step. In the end, our sample consisted of people between the ages of 63 and 82.
Half of the interviewees suffered from a chronic condition and thus could benefit from the application’s monitoring features more than others. An important inclusion factor was also the living condition of each participant. Half of them live alone and independently, without any or with minimum support from family members. A few of them have some experience in using computers, either from work or from personal interest.
The interviews were semi-structured and open-ended, following a discussion guide, which could be adjusted depending on the respondent’s answers, focusing on specific issues that were important to them, but also examining issues that were revealed from the SUS assessment. The discussion consisted of nine parts, a brief description of which follows.
  • The discussions started with personal questions, to gain some information about the participant’s background, daily life and needs and build a personal and health profile based on their answers.
  • The next section of the interview contained some general questions to examine the participants’ attitude and experiences with regard to technology, and to identify potential physical and psychological issues that may hinder them when using computers and ICT systems, focusing on subjects such as thoughts and emotions when interacting with technology and the availability of support from their environment.
  • The interview continued with an introduction to the concept of homecare and telecare systems, which was new to most of the participants, and a brief description of the platform. They were then asked to express their thoughts on the idea and try to imagine and describe how they visualize the system.
  • A detailed presentation of the system followed, explaining the various devices, the platform’s capabilities and features, and communication between the various stakeholders. The respondents were given the opportunity to interact with the mobile application if they wanted and where asked to provide general feedback, ask questions and compare the actual system with their expectations.
  • An important part of the discussion was dedicated to the application’s graphical user interface (GUI). The participants were asked to provide feedback on the visual accessibility, understandability and aesthetic appeal and express thoughts and emotions. They were also asked to provide suggestions for improvements.
  • A much more detailed explanation of the various functionalities of the application followed. Participants were asked to comment on the usefulness and usability of each feature, how well integrated they found the various components to be and how easy it was for them to understand each feature. They were also asked how often they thought they would use each feature and how important each feature is to them, as well as to give suggestions of new features that would be of value or appeal to them or to other potential users of the platform. Finally, they were asked to compare certain functionalities of the application to other solutions they may be using the same purpose, with respect to effectiveness, usability and reliability and indicate which solution they found more pleasant. For example, the videoconferencing feature was compared to other means of communication, such as the telephone, email and Skype.
  • Devices and interaction with the system were also an important topic of discussion, in an attempt to explore physical limitations, but most importantly psychological barriers and ways to overcome them. Participants were asked to comment on the choice of the tablet as the main device of the system, describe their attitude and feelings towards mobile devices and touch screens and compare their preference between various devices (e.g., PCs, smartphones, TVs, etc.) and means of interaction with the system (e.g., keyboard, remote control, etc.). They were also encouraged to think outside of the box and suggest other devices that they could think of as noteworthy options.
  • In this part of the discussion, the moderator informed the participants of the various mechanisms for automation that are incorporated in the system. The participants were asked to express their views on the subject and explain how this information affects their attitude towards the system.
  • At the end of the discussion, the participants were given the opportunity to add any comments that they may have skipped and provide general feedback, ideas and suggestions.
All interviews were recorded and then transcribed. Respondent validation was performed during the interviews, in order to ensure validity. The framework approach was utilized for qualitative analysis [36].

3.2.2. Findings and Insights

Feedback gained from the qualitative part of the evaluation pointed out specific good practices that were implemented, successfully fulfilling corresponding ageing usability requirements, while also providing some ideas for improvements.
  • User Interface Design: Participants described the user interface as “simple”, “not confusing” or “less complicated than they expected”, especially in comparison to other systems, with all of them giving positive general feedback, and commending the limited number of options featured on the home screen. Positive responses were also given on the size of home screen elements, which contains large buttons that can be viewed comfortably, as well as the icons used, which almost eliminate the need to read text on the screen, while also helping them make associations with the respective functionalities and therefore navigate the application more easily. Some also commented positively on the use of color. One participant expressed the need for brighter and highly contrasting colors. However, this was mostly a recommendation for aesthetic appeal, as they mentioned that the current color scheme was also easy to view. Another participant mentioned that they noticed and appreciated the meaningful use of color (i.e., green colored confirmation buttons, red colored emergency and delete buttons, etc.), explaining that knowing right away which buttons they should be careful before pressing reduces their fear of making a mistake when using the system. Finally, some respondents mentioned that they would like to be able to change the font size.
  • Devices: Most participants agreed that tablets are an appropriate device for running the end-user application, due to their size, portability and mobility, despite the fact that some of them reported that they have been hesitant to use or purchase one. Although all participants are much more familiar with TVs, some of them found the idea of running the application on a TV confusing, having a hard time imagining how they would operate the system. Furthermore, some mentioned that they associate TVs with a different purpose, and they would prefer to use this system on a separate, dedicated device. None of the respondents faced any difficulty using the sensors, even those who do not use them in their daily lives, mainly because of the automated communication of the sensors with the application. In fact, all participants suffering from chronic conditions thought that this manner of electronic recording of measurements is far more convenient than writing down measurements on paper every day. An important unresolved issue, however, is device control and manual input. Most participants expressed aversion to touch screens, because they fear an increased chance of making mistakes, mainly due to reduced sense of touch. This can also lead to frustration and loss of patience, especially when handling touch screen keyboards. Some further characterized them as intimidating, while others mentioned that they perceive touch screens as too advanced for their generation. Those who had some previous experience with computers would opt for a regular keyboard for typing and were therefore in favor of adding to the system a dock with a small keyboard. Many also responded well to the idea of a remote control initially, but later expressed concerns of confusing it with remote controls of other devices or losing it. All participants either suggested or would agree that the addition of a few simple voice commands would be of great value.
  • Functionality: The respondents considered the various system functionalities useful and well integrated. In addition, they appreciated the limited number of steps required to perform even the most complicated tasks they were presented with, such as recording biosignal measurements or creating reminders. Almost all participants expressed their appreciation of the reminders feature. One participant was particularly enthusiastic about the automated functionality of reminders, providing remarks such as “leaves no room for error”, “someone else can do it for me” and “it would be someone else’s responsibility” and explained how manual input of important data can be stressful for him, for fear of making mistakes. The gallery feature was described by many respondents as “enticing” and agreed it would encourage them to engage with the system more. Overall, the features mostly appreciated by the respondents were video calls, reminders and the gallery. Participants believed that these were the functionalities they would use more regularly. A couple mentioned that they found the personal health record functionality very useful, but would probably not use it as frequently as other features and thus would prefer if it was not visible on the home screen. Some respondents expressed desire for a home screen that could be customized to their preference, removing those buttons that they would use less.
  • Understandability: Participants found the platform and the various functionalities fairly easy to understand, provided they were given a presentation of the system. However, most of them felt that they would require some training or assistance to use it. A number of participants compared performing tasks on the system to performing tasks on a computer. They felt that the sequences of steps to perform tasks on the system were short enough to remember, although more time would be required for them to gain confidence in using the system. They all agreed that short and simple audio or animated instructions could be a helpful feature, although some of them expressed preference for printed material, such as a user’s manual or a cheat sheet. A significant finding that emerged was that senior users’ need to feel in control of the system. One of the respondents mentioned that it was important for him to know how every feature that was displayed on the screen operates and that since no visible feature was too complicated for him to understand, he felt more confident and appreciated the design. Other respondents commented that they felt calmer and more confident and relaxed when using this system, in comparison to using a computer, because it appeared simple, regardless of how complicated it actually was.
  • Motivation to Adopt: Discussion of parameters that affected the respondents’ motivation to adopt homecare technologies was one of the most important parts of the interviews. A number of participants underlined the importance of technology fulfilling a need as motivation for adoption and explained that they would use a homecare system if they felt they needed it, or if they were instructed to do so by a doctor. One respondent further commented that only a major health incident would make her feel the need for health monitoring. However, all of the respondents found very appealing the fact that their doctor would be able to monitor their health status, as well as being able to easily communicate with their caregivers. As one participant commented, “it makes you feel more secure, that someone cares and is in charge”. This indicates the importance of communication features connecting the various stakeholders, in order to increase perceived value. Finally, many of the respondents mentioned that they would be motivated to use technology for entertainment and thus would appreciate features such as multimedia players or games. Besides functionality, it was evident throughout the interviews that ease of use is essential to motivate older adults to adopt new technologies. When the participants were informed of the various mechanisms for automation and remote management incorporated in the system, they all responded with very positive remarks. For most of them, this information greatly changed their attitude towards the system and increased the likelihood that they would adopt it in their daily lives, regardless of the number of features that they would actually feel comfortable using on their own.

3.3. Redesign

Leveraging on the most important findings of the qualitative assessment, the system’s interface was redesigned to include the following amendments and additions, with respect to graphics, understandability and functionality, aiming to enhance those elements that contribute to increased usability, higher user-experience and overall greater appeal of the system to potential users.

3.3.1. Redesigning the GUI

The new mobile application GUI was designed using bright, distinctive colors, surrounded by white space, in order to enhance the contrast, improve visibility of graphical elements and diminish distracting context, which may be a source of confusion for seniors. Font sizes have increased slightly, but the greatest emphasis was put on icons, which were friendlier than text. The number of buttons on the main screen (Figure 7) decreased to three, corresponding to the three most frequently used features, in order to enhance simplicity and reduce the possibility of confusion. This rule was followed throughout the GUI, as can be seen in Figure 8c. The rest of the buttons were placed on a banner at the top of the screen, which is always visible.
Besides enhancing simplicity, this design choice is also compatible with one of the findings from the interviews, which is that users may not use all of the available features and usually pay more attention to a small number of functionalities that they consider more useful or important. Thus, a greater number of buttons on the home screen would be unnecessary. Since different users have different opinions and needs, following the suggestions of the interviewees, the home screen of the application has become customizable. Users can choose the main icons of the home screen through the settings menu (Figure 8a).
Other changes aiming to increase usability were limiting the depth of nested menus to a maximum of three screens and locking the screen orientation to landscape, as the rotation of the screen seemed challenging for participants who were not tablet users. To ensure a clear transition between screens, the “back” button is now labelled according to the screen that it leads to.
Pop-up notifications (e.g., for missed calls) were disfavored by some of the participants, for being reminiscent of error messages on a PC, and so were replaced with a notifications screen. The number of unread notifications is displayed on the user’s profile picture, at the top of the screen.
The new interface allows the user to select a person from their contact list as their primary contact. The primary contact is the person that the main user communicates with most frequently. The primary contact’s photo is displayed on the home screen, so that the user can call them directly, with a single touch (Figure 7). Additionally, the primary contact can manage some of the senior’s application settings remotely.
To further improve the reminders feature, a new button has been added to notifications regarding the measurement of biosignals, allowing the user to directly store the new measurement (Figure 8b). Moreover, the system automatically checks if a specific measurement has been received within a reasonable time frame before the notification and, if so, automatically marks the reminder as “completed”.
Finally, in order to maximize understandability, a short video guide has been added at the first time use screen. The video provides a brief description of the application and its features, to let the user understand what is expected. The video can also be accessed at later times, through the “Photos/Videos” screen, which also contains video guides for using the various biosignal recording devices.

3.3.2. New Features

Based on the feedback from the interviews, seniors were more likely to be motivated to use a system that either provides useful functionalities for their daily lives and activities or offers entertainment features. They also valued the social aspect of the application. To that end, a set of new features was added, which will be gradually expanded.
A serious games module was added to the system (Figure 8c). The games that will be available through this module include problem-solving games, such as puzzles, designed to measure aspects of cognitive performance, such as memory. Scores are recorded and can be monitored by a caregiver. At first, users will have access to only one simple game, but they will be able to unlock more games over time. Users are also able to share game scores with their contacts. Another entertainment feature that was suggested by some of the participants in the study was the radio (Figure 8c), a functionality that is expected to encourage users to interact with the system more regularly and thus gain confidence in using it more quickly. Users can choose to listen from a selection of local internet radio stations. The radio feature will be complemented in the future with more similar features, such as a web browser and a YouTube video player.
To expand the social capabilities of the system, a daily wellness survey feature was added (Figure 8d). The user can choose how well they feel each day. This action provides their doctor with valuable data and lets their loved ones know how the senior is feeling at any time. Finally, a weather forecast widget has been added, as was suggested by some of the participants.

3.4. Re-Evaluation with SUS

For the second part of the study, all respondents from our initial sample were asked to perform an evaluation of the redesigned system. Four of them were unable to participate in this phase. These respondents had given scores very close to the average in the first SUS evaluation, and considering their number, no significant impact on the study was identified. In the end, our sample comprised of 20 senior adults, 10 male and 10 female.
The evaluation process was identical to the first phase. Each participant was presented with the platform and watched a brief presentation of all of the features. They were then asked to perform the same use cases as in the initial evaluation and finally complete the SUS questionnaire.
The overall score was 78.8, which was within the acceptable range, corresponding to the grade C and the adjective rating “Good”. The scores obtained from this evaluation ranged between 65 and 90 (mean = 78, median = 78.8) for male respondents and between 70 and 92.5 (mean = 79.5, median = 77.5) for female respondents. As can be seen in Figure 9a, all respondents gave the system an acceptable score this time, which is indicative of effectiveness of the changes.
The highest scores, corresponding to grade A, were mostly given by respondents who had some experience using tablets. This indicates that familiarity with the device is still a key factor. However, just as in the initial assessment, the lowest scores were not all given by participants who had no computer experience, even though most of them answered that they would need training and assistance to use the system. Thus, it appears that previous experience is not more important than other factors, such as the participants’ predisposition and confidence in learning. It is also worth mentioning that scores did not always decline as the age of the respondents increased.
The frequencies of the respondents’ answers to each question is presented in Figure 9b. Comparing the responses to questions 1, 2, 3, 8 and 9 with the initial assessment, it is evident that the modifications to the user interface have successfully simplified the use of the application and have made potential users more eager to interact with the system and more confident when they do so.
Answers to question 10 indicated another positive effect of the redesign, which was that more of the respondents felt that they could naturally interact with the system, without having to learn much beforehand. Also, more of them agreed that most people would quickly learn to use the system with the new interface. It should be noted, however, that the respondents’ attitude towards question 4 had not changed, meaning that many of them still felt they would need support to use the system. This highlights the importance of the remote management features available to caregivers and the helpdesk.

4. Conclusions

In this work, we have performed a usability evaluation of “HeartAround”, an integrated homecare platform providing communication, health monitoring and emergency response services. Common requirements for ageing usability were considered during the design of the system, while a few novel ideas were also incorporated, mainly in the form of automation. The SUS method was applied, in order to gain an initial high-level assessment of the system’s usability. This was followed by qualitative research, in the form of in-depth interviews, providing more insights on the needs and preferences of older adults with respect to homecare technologies. Good practices regarding user interface design were also highlighted, along with functionalities that increase the appeal of such systems for potential users, as well as some ways to make interaction with the system more convenient for seniors. These insights were the basis for a redesign of the system’s interface and the addition of a few new features. A second SUS assessment, on the new interface, provided evidence of the effectiveness of the changes that were made, both in enhancing the system’s usability and overall appeal to potential users, as well as increasing the user confidence and reducing the need for user training.
The following Table 2 provides a list of practical guidelines for improving usability and user-acceptance of homecare applications for seniors, based on the results of the study.
Our findings indicate the importance of incorporating communication and general social networking features in homecare systems, as well as the significance of the user’s connection to their personal doctor and caregivers. The study has also illustrated that adoption of a homecare system and the regular interaction with it, can be encouraged by incorporating enhanced features that are either enjoyable or useful on a daily basis. Moreover, reducing the level of interaction required from the user in managing system settings or handling system faults improves a potential user’s attitude toward the system.

Author Contributions

Conceptualization, C.P., A.M., I.M. and P.T.; methodology, C.P. and I.M.; software, A.M.; validation, C.P. and A.M.; formal analysis, C.P. and I.M..; investigation, C.P.; writing—original draft preparation, C.P.; writing—review and editing, I.M., A.M. and P.T..; visualization, C.P..; supervision, I.M. and P.T.; project administration, I.M.

Funding

This research received no external funding.

Conflicts of Interest

The authors declare no conflict of interest.

References

  1. Mitzner, T.L.; Boron, J.B.; Fausset, C.B.; Adams, A.E.; Charness, N.; Czaja, S.J.; Dijkstra, K.; Fisk, A.D.; Rogers, W.A.; Sharit, J. Older Adults Talk Technology: Technology Usage and Attitudes. Comput. Hum. Behav. 2010, 26, 1710–1721. [Google Scholar] [CrossRef]
  2. Selwyn, N. The Information Aged: A Qualitative Study of Older Adults’ Use of Information and Communications Technology. J. Aging Stud. 2004, 18, 369–384. [Google Scholar] [CrossRef]
  3. Lee, B.; Chen, Y.; Hewitt, L. Age Differences in Constraints Encountered by Seniors in Their Use of Computers and the Internet. Comput. Hum. Behav. 2011, 27, 1231–1237. [Google Scholar] [CrossRef]
  4. Botsis, T.; Demiris, G.; Pedersen, S.; Hartvigsen, G. Home Telecare Technologies for the Elderly. J. Telemed. Telecare 2008, 14, 333–337. [Google Scholar] [CrossRef] [PubMed]
  5. PACITA Project. EU stakeholder involvement on ageing society. Telecare Technology for An Ageing Society in Europe. Current State and Future Developments. Available online: http://wp6.pacitaproject.eu/wp-content/uploads/2014/02/Telecare-description-web.pdf (accessed on 20 February 2019).
  6. Ojel-Jaramillo, J.M.; Canas, J.J. Enhancing the Usability of Telecare Devices. Hum. Technol. Interdiscip. J. Hum. ICT Environ. 2006, 2, 103–118. [Google Scholar] [CrossRef]
  7. Sorri, L.; Leinonen, E. Technology That Persuades the Elderly. In Persuasive Technology; Oinas-Kukkonen, H., Hasle, P., Harjumaa, M., Segerståhl, K., Øhrstrøm, P., Eds.; Springer: Berlin/Heidelberg, Germany, 2008; Volume 5033, pp. 270–273. [Google Scholar] [CrossRef]
  8. Hanson, V.L. Influencing Technology Adoption by Older Adults. Interact. Comput. 2010, 22, 502–509. [Google Scholar] [CrossRef]
  9. Renaud, K.; van Biljon, J. Predicting Technology Acceptance and Adoption by the Elderly: A Qualitative Study. In Proceedings of the 2008 Annual Research Conference of the South African Institute of Computer Scientists and Information Technologists on IT Research in Developing Countries Riding the Wave of Technology-SAICSIT 08, Wilderness, South Africa, 6–8 October 2008; ACM Press: New York, NY, USA, 2008; pp. 210–219. [Google Scholar] [CrossRef]
  10. Wagner, N.; Hassanein, K.; Head, M. Computer Use by Older Adults: A Multi-Disciplinary Review. Comput. Hum. Behav. 2010, 26, 870–882. [Google Scholar] [CrossRef]
  11. Gatto, S.L.; Tak, S.H. Computer, Internet, and E-Mail Use Among Older Adults: Benefits and Barriers. Educ. Gerontol. 2008, 34, 800–811. [Google Scholar] [CrossRef]
  12. Patsoule, E.; Koutsabasis, P. Redesigning Websites for Older Adults: A Case Study. Behav. Inf. Technol. 2014, 33, 561–573. [Google Scholar] [CrossRef]
  13. Salama, M.; Shawish, A. Taxonomy of Usability Requirements for Ageing. In Proceedings of the 13th International Conference on Software Engineering, Parallel and Distributed Systems-SEPADS ’14, Gdansk, Poland, 15–17 May 2014; pp. 80–88, ISBN 978-960-474-381-0. [Google Scholar]
  14. McGee-Lennon, M.R.; Wolters, M.K.; Brewster, S. User-Centred Multimodal Reminders for Assistive Living. In Proceedings of the 2011 Annual Conference on Human Factors in Computing Systems-CHI ’11, Vancouver, BC, Canada, 7–12 May 2011; ACM Press: Vancouver, BC, Canada, 2011; p. 2105. [Google Scholar] [CrossRef]
  15. Karahasanović, A.; Brandtzæg, P.B.; Heim, J.; Lüders, M.; Vermeir, L.; Pierson, J.; Lievens, B.; Vanattenhoven, J.; Jans, G. Co-Creation and User-Generated Content–Elderly People’s User Requirements. Comput. Hum. Behav. 2009, 25, 655–678. [Google Scholar] [CrossRef]
  16. Brooke, J. SUS—A Quick and Dirty Usability Scale. Available online: http://cui.unige.ch/isi/icle-wiki/_media/ipm:test-suschapt.pdf (accessed on 20 February 2019).
  17. Claris Companion Official Website. Available online: http://www.clariscompanion.com (accessed on 20 February 2019).
  18. Engage-Pad Official Website. Available online: http://www.onetouchtelecare.com/index.html (accessed on 20 February 2019).
  19. Gociety Official Website. Available online: http://www.gocietysolutions.com/ (accessed on 20 February 2019).
  20. BePatient Official Website. Available online: http://www.bepatient.com/ (accessed on 20 February 2019).
  21. Silvervue Official Website. Available online: http://www.silvervue.com/ (accessed on 20 February 2019).
  22. BeClose Official Website. Available online: http://beclose.com/ (accessed on 20 February 2019).
  23. Care@Home Official Website. Available online: http://www.essence-grp.com/smart-care/ (accessed on 20 February 2019).
  24. Genise, P. Usability Evaluation: Methods and Techniques; Version 2.0; University of Texas: Austin, TX, USA, 2002. [Google Scholar]
  25. Brooke, J. SUS: A Retrospective. J. Usability Stud. 2013, 8, 29–40. [Google Scholar]
  26. Bangor, A.; Kortum, P.; Miller, J. Determining What Individual SUS Scores Mean: Adding an Adjective Rating Scale. J. Usability Stud. 2009, 4, 114–123. [Google Scholar]
  27. WAMMI Official Website. Available online: http://www.wammi.com/ (accessed on 20 February 2019).
  28. QUIS Official Website. Available online: http://www.lap.umd.edu/quis/ (accessed on 20 February 2019).
  29. Dhillon, J.S.; Wünsche, B.C.; Lutteroth, C. An Online Social-Networking Enabled Telehealth System for Seniors: A Case Study. In Proceedings of the Fourteenth Australasian User Interface Conference, Melbourne, Australia, 29 January–1 February 2013; Australian Computer Society, Inc.: Darlinghurst, Australia, 2013; Volume 139, pp. 53–62. [Google Scholar]
  30. Stojmenova, E.; Imperl, B.; Žohar, T.; Dinevski, D. Adapted User-Centered Design: A Strategy for the Higher User Acceptance of Innovative e-Health Services. Future Internet 2012, 4, 776–787. [Google Scholar] [CrossRef] [Green Version]
  31. Bozkurt, S.; Zayim, N.; Gulkesen, K.H.; Samur, M.K.; Karaağaoglu, N.; Saka, O. Usability of a Web-Based Personal Nutrition Management Tool. Inform. Health Soc. Care 2011, 36, 190–205. [Google Scholar] [CrossRef] [PubMed]
  32. Heartaround Official Website. Available online: https://heartaround.com/ (accessed on 20 February 2019).
  33. WebRTC Official Website. Available online: https://webrtc.org/ (accessed on 20 February 2019).
  34. Lindberg, T.; Näsänen, R.; Müller, K. How Age Affects the Speed of Perception of Computer Icons. Displays 2006, 27, 170–177. [Google Scholar] [CrossRef]
  35. Katsanos, C.; Tselios, N.; Xenos, M. Perceived Usability Evaluation of Learning Management Systems: A First Step towards Standardization of the System Usability Scale in Greek. In Proceedings of the 2012 16th Panhellenic Conference on Informatics, Piraeus, Greece, 5–7 October 2012; IEEE: Piraeus, Greece, 2012; pp. 302–307. [Google Scholar] [CrossRef]
  36. Smith, J.; Firth, J. Qualitative Data Analysis: The Framework Approach. Nurse Res. 2011, 18, 52–62. [Google Scholar] [CrossRef] [PubMed]
Figure 1. “HeartAround” Environment.
Designs 03 00023 g001
Figure 2. “HeartAround” Mobile Application—Home Screen.
Designs 03 00023 g002
Figure 3. Application views: (a) Contact list; (b) reminder notification; (c) blood glucose levels history and (d) doctor’s patient management dashboard.
Designs 03 00023 g003
Figure 4. System usability scale (SUS) Questionnaire.
Designs 03 00023 g004
Figure 5. (a) Percentile rankings of SUS scores; (b) grade rankings of SUS scores.
Designs 03 00023 g005
Figure 6. Results of the initial evaluation with SUS: (a) SUS scores; (b) SUS questionnaire responses.
Designs 03 00023 g006
Figure 7. New graphical user interface (GUI)—home screen.
Designs 03 00023 g007
Figure 8. New GUI Views: (a) Home screen customization; (b) reminder notification; (c) entertainment menu and (d) daily wellness survey.
Designs 03 00023 g008
Figure 9. Results of the second evaluation with SUS: (a) SUS scores; (b) SUS questionnaire responses.
Designs 03 00023 g009
Table 1. List of interviews.
A/AParticipantHealth ConditionComputer Experience
1Female, 63, lives aloneDiabetes type 2, visual impairmentSome experience from work
2Male, 67, lives aloneDiabetes type 2, hypertensionNone
3Male, 72, marriedHypertensionSome experience from work
4Male, 71, married-Uses computer for simple tasks
5Female, 73, married-None
6Female, 82, lives aloneArthritis, hearing impairmentNone
7Female, 68, married-Uses computer for recreational purposes
8Female, 65, married-Has attended a computer seminar
9Female, 71, lives aloneAsthma, hypertensionNone
10Female, 68, married-Tablet user
11Male, 75, lives aloneDiabetes type 2None
12Male, 78, lives aloneCOPD, hypertensionNone
Table 2. Practical guidelines for increasing usability of elderly homecare solutions.
AspectLessons Learned
User Interface Design
-
Icons should be used to replace text, whenever possible.
-
Meaningful use of color enhances users’ confidence.
-
Screens should be customizable to allow hiding unnecessary features/options.
Hardware
-
Portability is appreciated by most users.
-
The system should be based on a dedicated device.
-
Remote controls should be avoided.
Functionality
-
The required level of action by the user should be minimized, by connecting caregivers on the system.
-
Automation should be applied both in the system’s functionalities, as well as for system recovery.
Understandability
-
Short animated instructions should be available to the user.
-
Advanced features and features that do not concern the user must be hidden.
Motivation to adopt
-
Connection with doctors and caregivers in a strong incentive for seniors.
-
Communication and entertainment features can effectively integrate a homecare system into a senior’s daily life.

