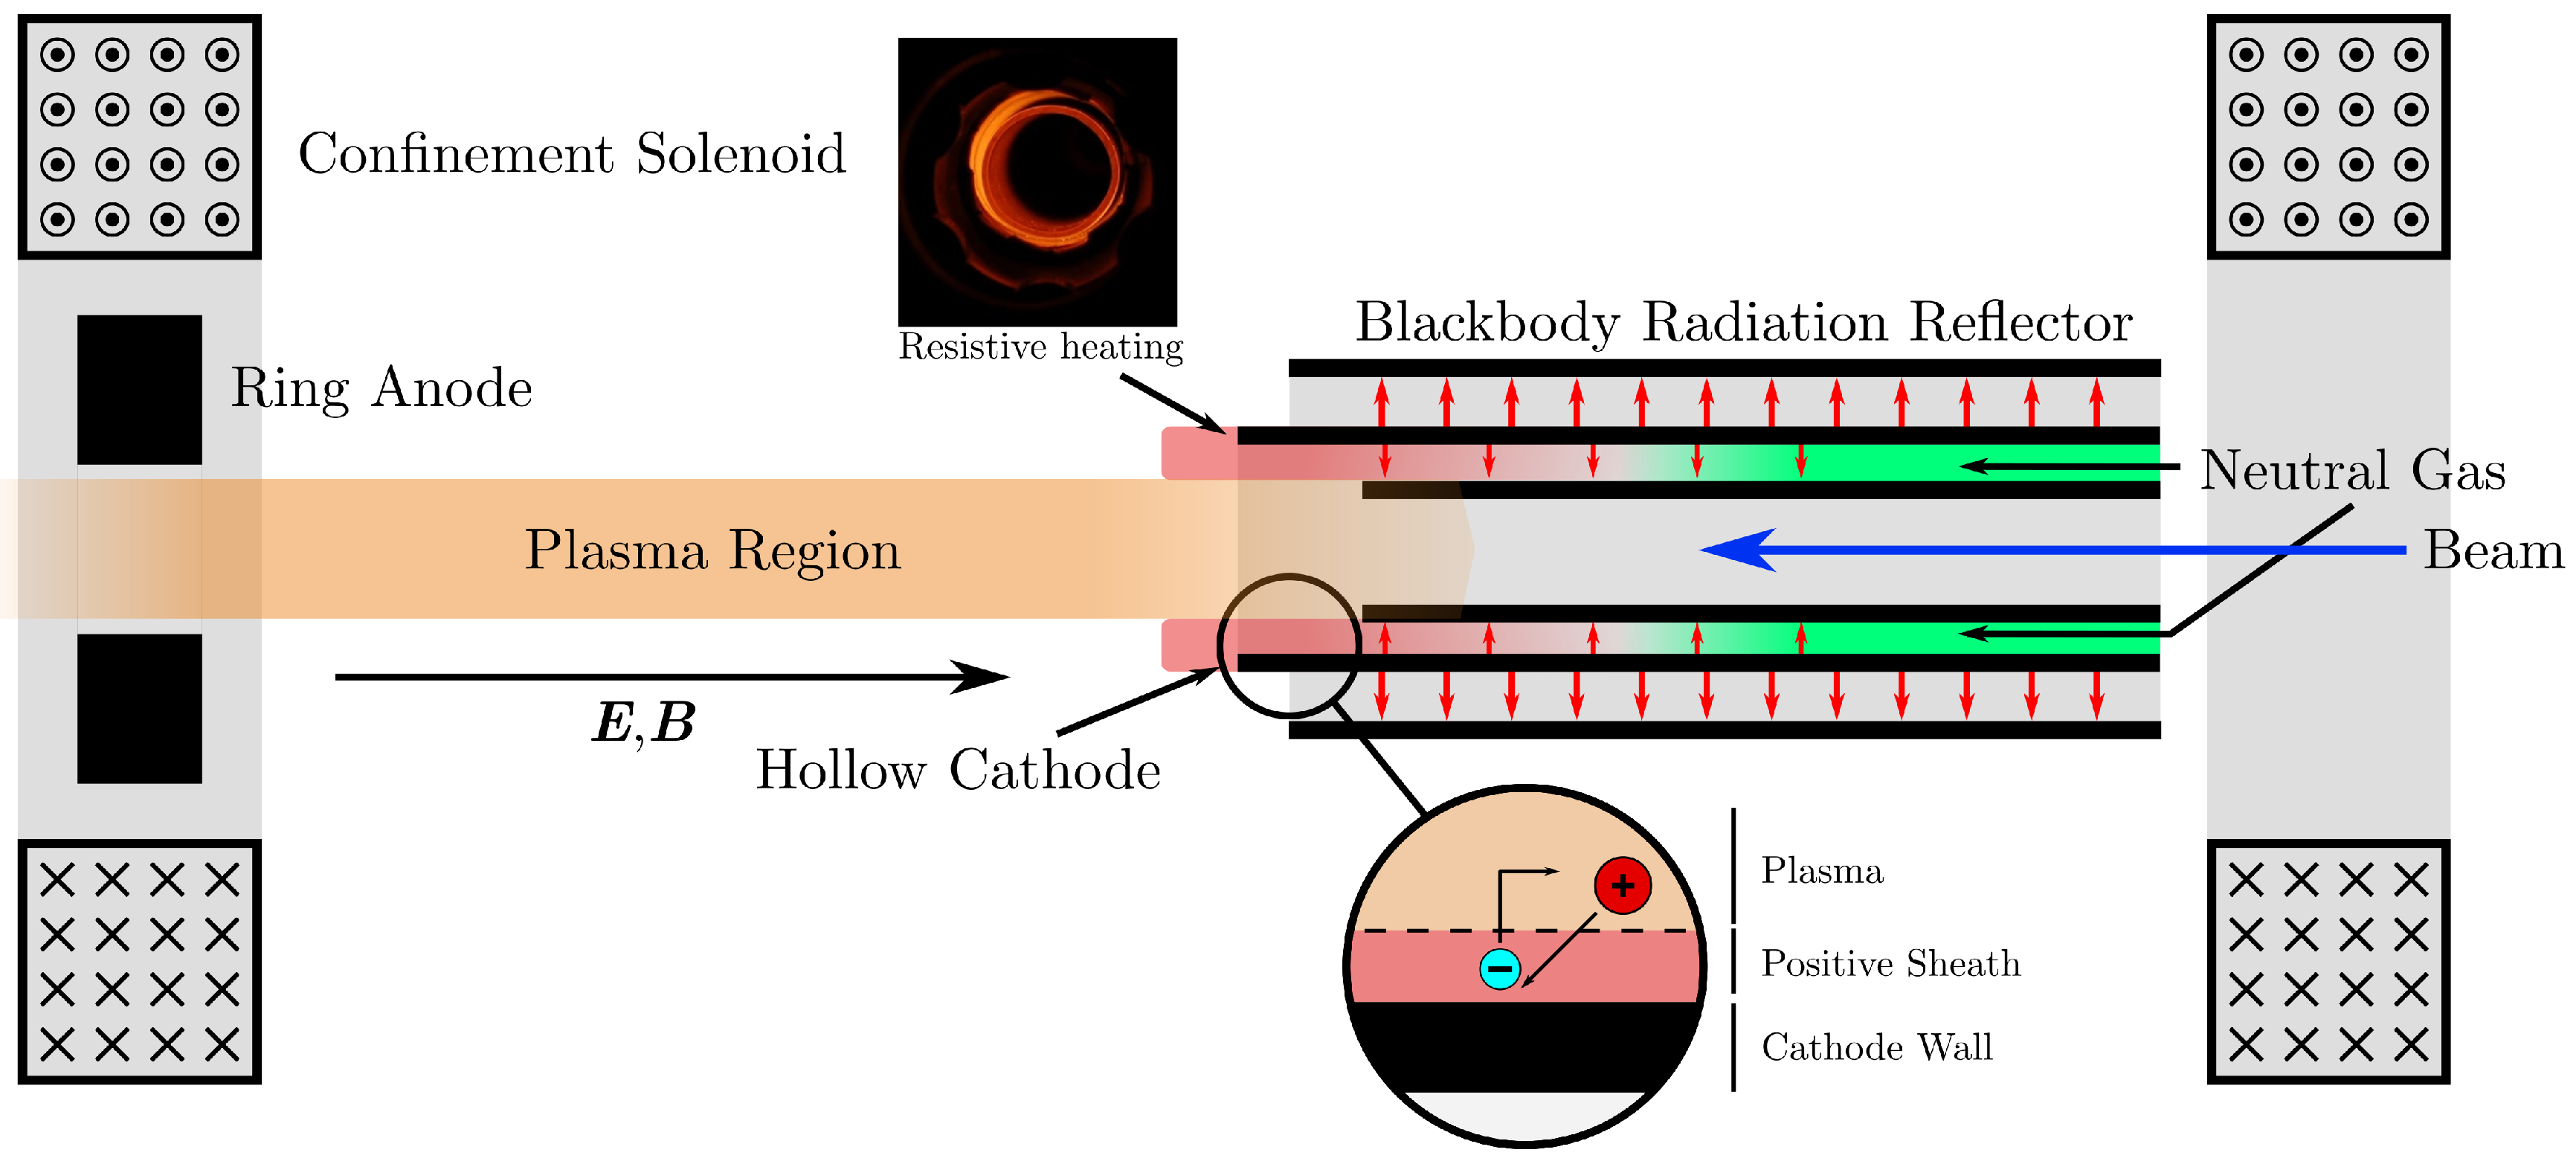
2. Hollow Cathode Arc Plasma Source and Characterization
Hollow cathode arc plasma sources have been theoretically and experimentally investigated as a robust method of argon plasma production in the
–
cm
range [
5]. In contrast to planar electrode plasma sources, the HCA cathode is made of a hollow tube as seen in
Figure 1. The UCLA plasma source uses a set of concentric tantalum tubes with diameters of 8 and 10 mm to form the hollow cathode. This feature allows the plasma to extend inside the cathode, significantly increasing the active cathode surface area. Furthermore, emitted electrons from the inner tube surface and liberated electrons from ionization events inside the cathode have an increased probability of colliding with neutral gas particles due to this geometry. Combining a hollow cathode with a ring anode also allows for collinear propagation of a beam with the plasma column axis while also reducing beam exposure to neutral particles. The ring anode has a similar inner diameter and was placed between 6–8 cm from the cathode edge to optimize plasma density profile.
A unique aspect of the UCLA plasma source is external heating of the cathode walls, which allows access to the arc discharge regime at extremely low voltages. Without external heating, the plasma arc regime is reached only after thermionic electron emission, due to localized heating by plasma ion bombardment [
6]. In the UCLA plasma source, the cathode tube is resistively heated using a high current (∼1000 A) to roughly 2000 K before discharges are triggered. A tantalum shield outside the heated cathode reflects blackbody radiation to maintain the extremely high temperature. At this temperature, thermionic electron emission is significant source of primary electrons ∼3 mA [
7], which when accelerated by a discharge voltage, trigger Townsend avalanches in the inter-electrode space. This circumvents voltage requirements for establishing self-sustaining plasmas, allowing the discharge to reach arc level currents (>1 A) in low pressure plasmas at low breakdown voltages, as seen in
Figure 2a.
Figure 2a shows a measurement of the modified Paschen curve [
8] due to external cathode heating. Minimum distance between the ring anode face and the cathode face was set to be 8 cm. For each chamber pressure
p, the voltage increased from 0 V until a discharge with current of at least 1 A developed for 10 consecutive shots. This voltage was then considered to be the upper limit for breakdown voltage
for a given chamber pressure. It is reasonable to assume that small errors in the breakdown voltage measurement of up to a few volts, due to the rapid transition from glow to arc regimes. The measured dependence of breakdown on pd shows differences in structure when compared to theoretical predictions [
8]. The extremely low minimum discharge voltage and a lack of asymptotic behavior at low gas pressures is particularly significant, due to constant thermionic electron emission.
Figure 2b shows temporal evolution of the plasma discharge current as a function of applied voltage. Each curve represents a close approximation to the average current profile at a given voltage as shot to shot variations of the current varied by less than 5%. We observe that at low voltages the discharge current reaches a peak significantly after the voltage is applied (orange line). This delay is often referred to as the primary formative time lag
of the plasma discharge, and is influenced by the “overvoltage” applied
. If the voltage applied is precisely equal to the breakdown,
and the formative time
. As overvoltage increases, the time lag decreases in an exponential manner, consistent with similar experiments [
6].
A secondary peak in the discharge current is observed once a voltage of ≈80 V is applied. This secondary electron emission mechanism is attributed to cathode emission from positive-ion impact. Plasma ions are accelerated towards the cathode by the applied field. Once ion kinetic energy is sufficient, impact from these particles onto the cathode surface triggers secondary electron emission. Formative time lag for this secondary process is longer due to relatively low ion drift velocity.
The longitudinal plasma density was characterized using a triple Langmuir probe [
9]. This diagnostic uses three tungsten probes (seen in
Figure 3) to simultaneously measure three locations on the plasma I-V curve to determine the density. As seen in
Figure 3b,d two of the probes are biased to one another to sample the ion and electron saturation currents respectively. Net current is measured using a
shunt resistor (
mA). The third probe is isolated from the others and is used to measure the plasma floating voltage
Figure 3c. If
is selected such that
where
is the electron temperature, the
probe is guaranteed to be in the ion saturation regime and
. The plasma electron density can then be calculated via a simultaneous measurement of
and saturation current. The plasma density is given by [
9]
where
M is the effective atomic or molecular weight of the ions,
S is the surface area of the exposed probe in mm
,
I is the measured current in
A and the plasma density is given in cm
. Systematic errors in this measurement technique result from nonuniform ion saturation current as a function of voltage. It has been estimated that the error in plasma density measurements for most systems using this method ranges from 10–25% [
9].
The triple Langmuir probe was mounted on a linear stage to map out the on-axis plasma density inside and outside the inter-electrode region. The plasma profile was measured using a bias voltage of
= 67 V for three different solenoid settings relevant for beam-plasma experiments and at a chamber pressure of 50 mTorr (
Figure 4). It was observed that shot to shot differences in the measured plasma density was lower than predicted systematic errors. Our measurement shows that plasma density increases with increasing solenoid current which is consistent with a decrease in the electron gyroradius as a function of magnetic field strength
, and matches results from previous experiments [
5]. If the solenoid current increases further, discharges eventually become suppressed at a given cathode tube temperature. Constriction of the external (inter-electrode region) and internal (inside the hollow cathode) plasma columns increases the required voltage for discharge [
5]. Once the tubes are heated further, discharges resume with a higher density, due to the increase in thermionic current causing an increase in ionization fraction (from < 3% to ∼10%). Further increases in temperature will continue to increase the ionization fraction; however it is limited by cathode damage concerns, as it was found that above roughly 2000 K the cathode tube can deform and interrupt the heating circuit.
Due to engineering constraints, the triple Langmuir probe transverse size was comparable to the radius of the outer hollow cathode tube. Once the probe traveled far into the inter-electrode space it started to disrupt the plasma discharges. This is demonstrated by an unexpected drop in density for the last few points in
Figure 4 after which the source stopped discharging. We hypothesize that inserting the probe beyond a certain limit disrupts gas flow or discharge path between the two electrodes, resulting in a measured drop in density and eventually the complete suppression of discharges.
To characterize this region, we used direct imaging of the optical plasma afterglow using a CCD camera. Since light emission from heating the cathode prevents detailed imaging inside of the plasma source, the CCD was electronically gated to a pulse length of 20
s and was triggered simultaneously with the plasma discharge. This technique allows capture of the instantaneous light from arc discharge, which is considerably brighter than the background blackbody radiation during the gated period. Assuming the light emission intensity is proportional to the plasma density [
10] a projection of the CCD image intensity onto the longitudinal axis is used to extrapolate the absolute plasma density from the last points before the probe starts to suppress the discharge. This extrapolation is denoted by the dashed lines in
Figure 4 and uses points before the fall off in plasma density due to probe interference. Furthermore, the technique corroborates that the transverse extent of the plasma is roughly equal to the hollow cathode diameter. Imaging the plasma profile at the exit or inside of the hollow cathode is not accessible. Based on the estimates of the gas density is in this region, the plasma density is at its highest just inside the cathode, then drops quickly to zero at the smaller tube end, where gas density drops to zero.
We can characterize these plasma profiles by calculating their effective length
and the mean plasma density
as
For a zero-order calculation we assume a linear plasma ramp from the end of the extrapolation (at
mm) region to the end of the inner cathode tube (at
mm). Based on this assumption, the calculated effective length and average plasma density for the three profiles in
Figure 4 are shown in
Table 1.
Taking into account our assumptions about the plasma profile and the measurement systematics we predict variations in the effective plasma column length and average plasma density up to ∼25%.
From these metrics we recover that an increase in solenoid field increases the plasma density as predicted [
5]. Furthermore, our data suggests that an increase in tube temperature due to increased heater power also gives rise to an increase in plasma density. It is likely that an increase in thermal electron current from the heated cathode leads to a higher ionization fraction, as the plasma density increases without an increase in gas pressure or flow rate. Finally, the maximum average plasma density matches well with the AWA drive beam parameters.

 ,
, 


