Article

Glucose Oxidase Micropumps: Multi-Faceted Effects of Chemical Activity on Tracer Particles Near the Solid–Liquid Interface

by
Raluca-Elena Munteanu
1,
Mihail N. Popescu
2,* and
Szilveszter Gáspár
1,*
1
Electrochemistry Laboratory, International Centre of Biodynamics, 1B Intrarea Portocalelor, 060101 Bucharest, Romania
2
Max Planck Institute for Intelligent Systems, Heisenbergstr. 3, D-70569 Stuttgart, Germany
*
Authors to whom correspondence should be addressed.
Condens. Matter 2019, 4(3), 73; https://doi.org/10.3390/condmat4030073
Submission received: 27 June 2019 / Revised: 17 July 2019 / Accepted: 24 July 2019 / Published: 25 July 2019
(This article belongs to the Special Issue Dynamics of Active Matter)

Abstract

:
We report the development of glucose oxidase pumps characterized by small lateral dimensions (≈200 μ m). We studied the effects of the activity of the enzyme pump on silica particles (“tracers”) sedimented around the enzyme pump/patch. Once the activity of the pump was turned on (i.e., the glucose substrate was added to the solution), in-plane motion of the tracers away from the enzyme patch, as well as the emergence of an in-plane region around the patch which was depleted by tracers, was observed. The lateral extent of this depletion zone increased in time at a rate dependent both on the glucose concentration and on the areal density of the enzyme in the patch. We argue that, when the tracers were very near the wall, their motion and the emergence of the depletion zone were most likely the result of diffusiophoresis and drag by osmotic flows induced at the wall, rather than that of drag by a solutal buoyancy driven convective flow. We infer that, for the glucose oxidase enzymatic pumps, bulk (solutal buoyancy), as previously reported, as well as surface (osmotic) driven flows coexist and have to be explicitly accounted for. It seems plausible to assume that this is the case in general for enzyme pumps, and these complementary effects should be considered in the design of applications, e.g., stirring or sensing inside microfluidic systems, based on such pumps.

1. Introduction

Although immobilized enzymes have already found numerous applications (including industrial ones) [1], only recently it was reported that patches of surface anchored enzymes can also stir/pump the surrounding solution, when this contains species that the anchored enzyme is catalytically converting [2]. The spatially localized, non-equilibrium chemical reaction gives rise to gradients in the chemical potential of the solution, and thus thermodynamic forces, leading to flows in the solution in the absence of external power sources and mechanical pumps. As intuitively expected, the magnitude of these flows increases with increasing substrate concentrations (see, e.g., [2,3,4]), given that this is below the saturation regime of the Michaelis–Menten kinetics of the reaction catalyzed by the enzyme. This dependence, in combination with the geometry of the experimental cell containing the enzyme patch, provides means for tuning, to a certain extent, the pattern of flow within the cell (see, e.g., [5]). Such enzyme patches are currently investigated for their potential role as “micropumps” in autonomous, miniaturized lab-on-a-chip systems, and several proof of concept experiments have been reported. For example, it was shown that enzyme pumps can facilitate the detection of, e.g., heavy metals that act as enzyme inhibitors [6], while Das et al. [3] reported enzyme pumps producing flows sufficiently strong to transport microspheres to specified regions within the experimental cell. A recent review of the developments in this area was provided by Zhao et al. [7].
Besides their capacity to induce flows within the solution without requiring moving components or external mechanical pumps, an additional attractive feature of enzyme pumps is that a variety of enzymes (converting a variety of substrates) can be employed: e.g., catalase [2,8], lipase [2], urease [2,3,4], glucose oxidase (GOX) [2,8], DNA polymerase [9], and acid phosphatase [8,10]. A concise summary of the enzyme micropumps developed and investigated so far is provided in Table 1.
As can be noted from the last columns of Table 1, it is by now well documented that one mechanism involved in the dynamics of the enzyme pumps is that of flows driven by local mass density variations. These can be induced either by temperature variations due to strongly exothermic enzymatic reactions [2], or by the dependence of the mass density of solution on the spatially varying chemical composition (the so-called solutal buoyancy effect) [2,10,11]. In many cases, the direction and magnitude of such flows at a small number of observation locations within the cell are inferred from the motion of “tracers”. Micrometer-sized polystyrene spherical particles, which are (quasi)neutrally buoyant, have usually been employed as tracers. The density-driven nature of the flow is then elegantly and convincingly evidenced by a change in the direction of the flow at a given location (relative to the enzyme patch) upon a vertical “flipping” of the cell (i.e., by comparing a set-up with the enzyme patch located at the bottom of the solution to one in which it is located at the top of the solution) [2,10] (considering the case of an enzyme patch at the bottom of the solution, the arguments on bulk flow driven by variations in the local mass density imply that along the wall the flow should be “inward/outward” (towards/away from the patch) if the reaction leads to a locally decreased/increased density of the solution, respectively [2,10,11]).
While, as noted above, it is well established that the functioning of enzyme pumps involves density driven bulk flows, the structure of such flows is a complicated problem due to their significant qualitative dependence on the details of the system, e.g., the geometry of the confining cell, as noted by the authors of [5,11]. This is particularly the case if the size of the active patch is of the same order, or even larger, than the lateral size and the height of the cell (see the changes in the topology of the pattern of flow reported by Zhang et al. [5] upon decreasing the vertical confinement from a Hele–Shaw-like geometry to a three-dimensional one), as actually happens in all the studies summarized in Table 1. When, additionally, the time scales over which the system reaches a steady state are comparable with the time span of the experiment, the problem becomes much more involved. As shown by Ortiz-Rivera et al. [11], in such cases, a complex time dependence of the topology of the hydrodynamic flow occurs; for example, observations of the flow at a fixed spatial location can report opposite directions of the flow (i.e., flow reversal), depending on the time —from the start of the experiment—at which the observation is made. A systematic exploration of these aspects, with both experiment and theory, remains an open issue.
On the other hand, the role played by osmotic (surface driven) flows in the functioning of the enzyme pumps has been largely overlooked. Given that in conceptually similar chemically active pumps, such as bi-metallic (e.g., Pt patch on Au surface) [12,13,14], metal–semiconductor [14], or ion-exchange-resin [15,16] pumps, significant electro- or diffusio-osmotic flows have been evidenced, it would be rather surprising if for the case of enzyme pumps osmotic flows would not occur. The strength of the osmotic flows is expected to decrease with the distance from the surface; thus, in the bulk of the solution the density driven flows discussed above are expected to dominate. Accordingly, observations of the motion of tracer particles located at distances of 50–150 μ m (or more) above the wall on which the patch is located (see Table 1) would presumably be less sensitive to surface driven (osmotic) flows. However, as discussed by, e.g., Niu et al. [16], the argument is much less clear when the spatial confinement is strong, and in particular in Hele–Shaw-like cell geometries. Such constricted geometry facilitates the formation of spatially extended vortices, which are spanning the whole height of the cell, even for the osmotic driven flows. Accordingly, in such cases, the contributions from the osmotic flows are not necessarily negligible even at locations in the “bulk solution”.
We report here the fabrication of GOX micropumps which have diameters as small as ≈200 μ m, which is close to the range suitable for microfluidic applications. We investigated the behavior of silica tracer particles, which were distributed around the enzyme patch and located, due to being relatively heavy, very near the solid–liquid interface. The experiments revealed a systematic in-plane motion of the tracers away from the enzyme patch, as well as the formation around the active enzyme patch of an in-plane region, which was depleted of tracers. The extent of this depletion region increased in time with a rate that depends on the concentration of substrate as well as on the areal density of enzyme in the patch, indicative of an activity-induced effect. By using a simple model of a chemically-active pump, we show that accounting solely for motion of tracers via diffusiophoresis and drag by osmotic flows leads to predictions for the velocity of traces and for the dynamics of the depletion-zone compatible with the experimentally observed ones. Consequently, we infer that, for the GOX enzymatic pumps, bulk (solutal buoyancy) flows (which have been reported to be oriented “inwards” [2,8]) as well as surface (osmotic) flows and diffusiophoresis (which drive the formation of the depletion zone), coexist and have to be accounted for.

2. Results

2.1. GOX Micropumps

GOX is an enzyme that converts glucose (as reducing substrate) and oxygen (as oxidizing co-substrate) into gluconolactone and hydrogen peroxide, respectively. The conversion of glucose into gluconolactone is followed by the spontaneous and relatively rapid hydrolysis of the gluconolactone to gluconic acid (half-life of gluconolactone is about 10 min at pH 8 [17]).
GOX patches were imprinted onto glass microscope slides using a procedure described succinctly in Section 4.1. With a radius R 110 μ m (see Figure 1), these patches were some of the smallest enzyme micropumps investigated to date (the previously reported enzyme pumps involved patches of diameters ranging from ≈1 mm [4] to 6 mm [2], see Table 1).

2.2. Behavior of Tracer Particles Dispersed around GOX Micropumps

Silica microspheres of radius R p = 1 . 5 μ m were used as tracer particles for the investigation of the microenvironment of the active GOX micropumps. These particles were significantly heavier than the polystyrene micropheres used in the previous studies; thus, they quickly sedimented to the solid–liquid interface of the experimental cell and remained located (yet mobile) very close to the bottom wall, which allowed investigation of the activity effects in the region very near the wall (the sedimentation velocity of the silica spheres in the aqueous solution of glucose was estimated as V s e d ( 4 π / 3 ) R p 3 ( ρ p ρ w ) g / ( 6 π η R p ) 8 μ m / s , where ρ p , w denotes the mass density of the silica and water, respectively, while η is the viscosity of water; thus, for a cell in which the height of solution is 2 mm, as used in the experiments, it was expected that all the tracers were sedimented within ca. 4–5 min. We note here that it was not possible to use polystyrene tracers for this purpose because it turned out that they have a significantly increased tendency to stick to the bottom wall of the experimental cell; thus, most of such tracers would become immobile during the experiment and no reliable observations could be made).
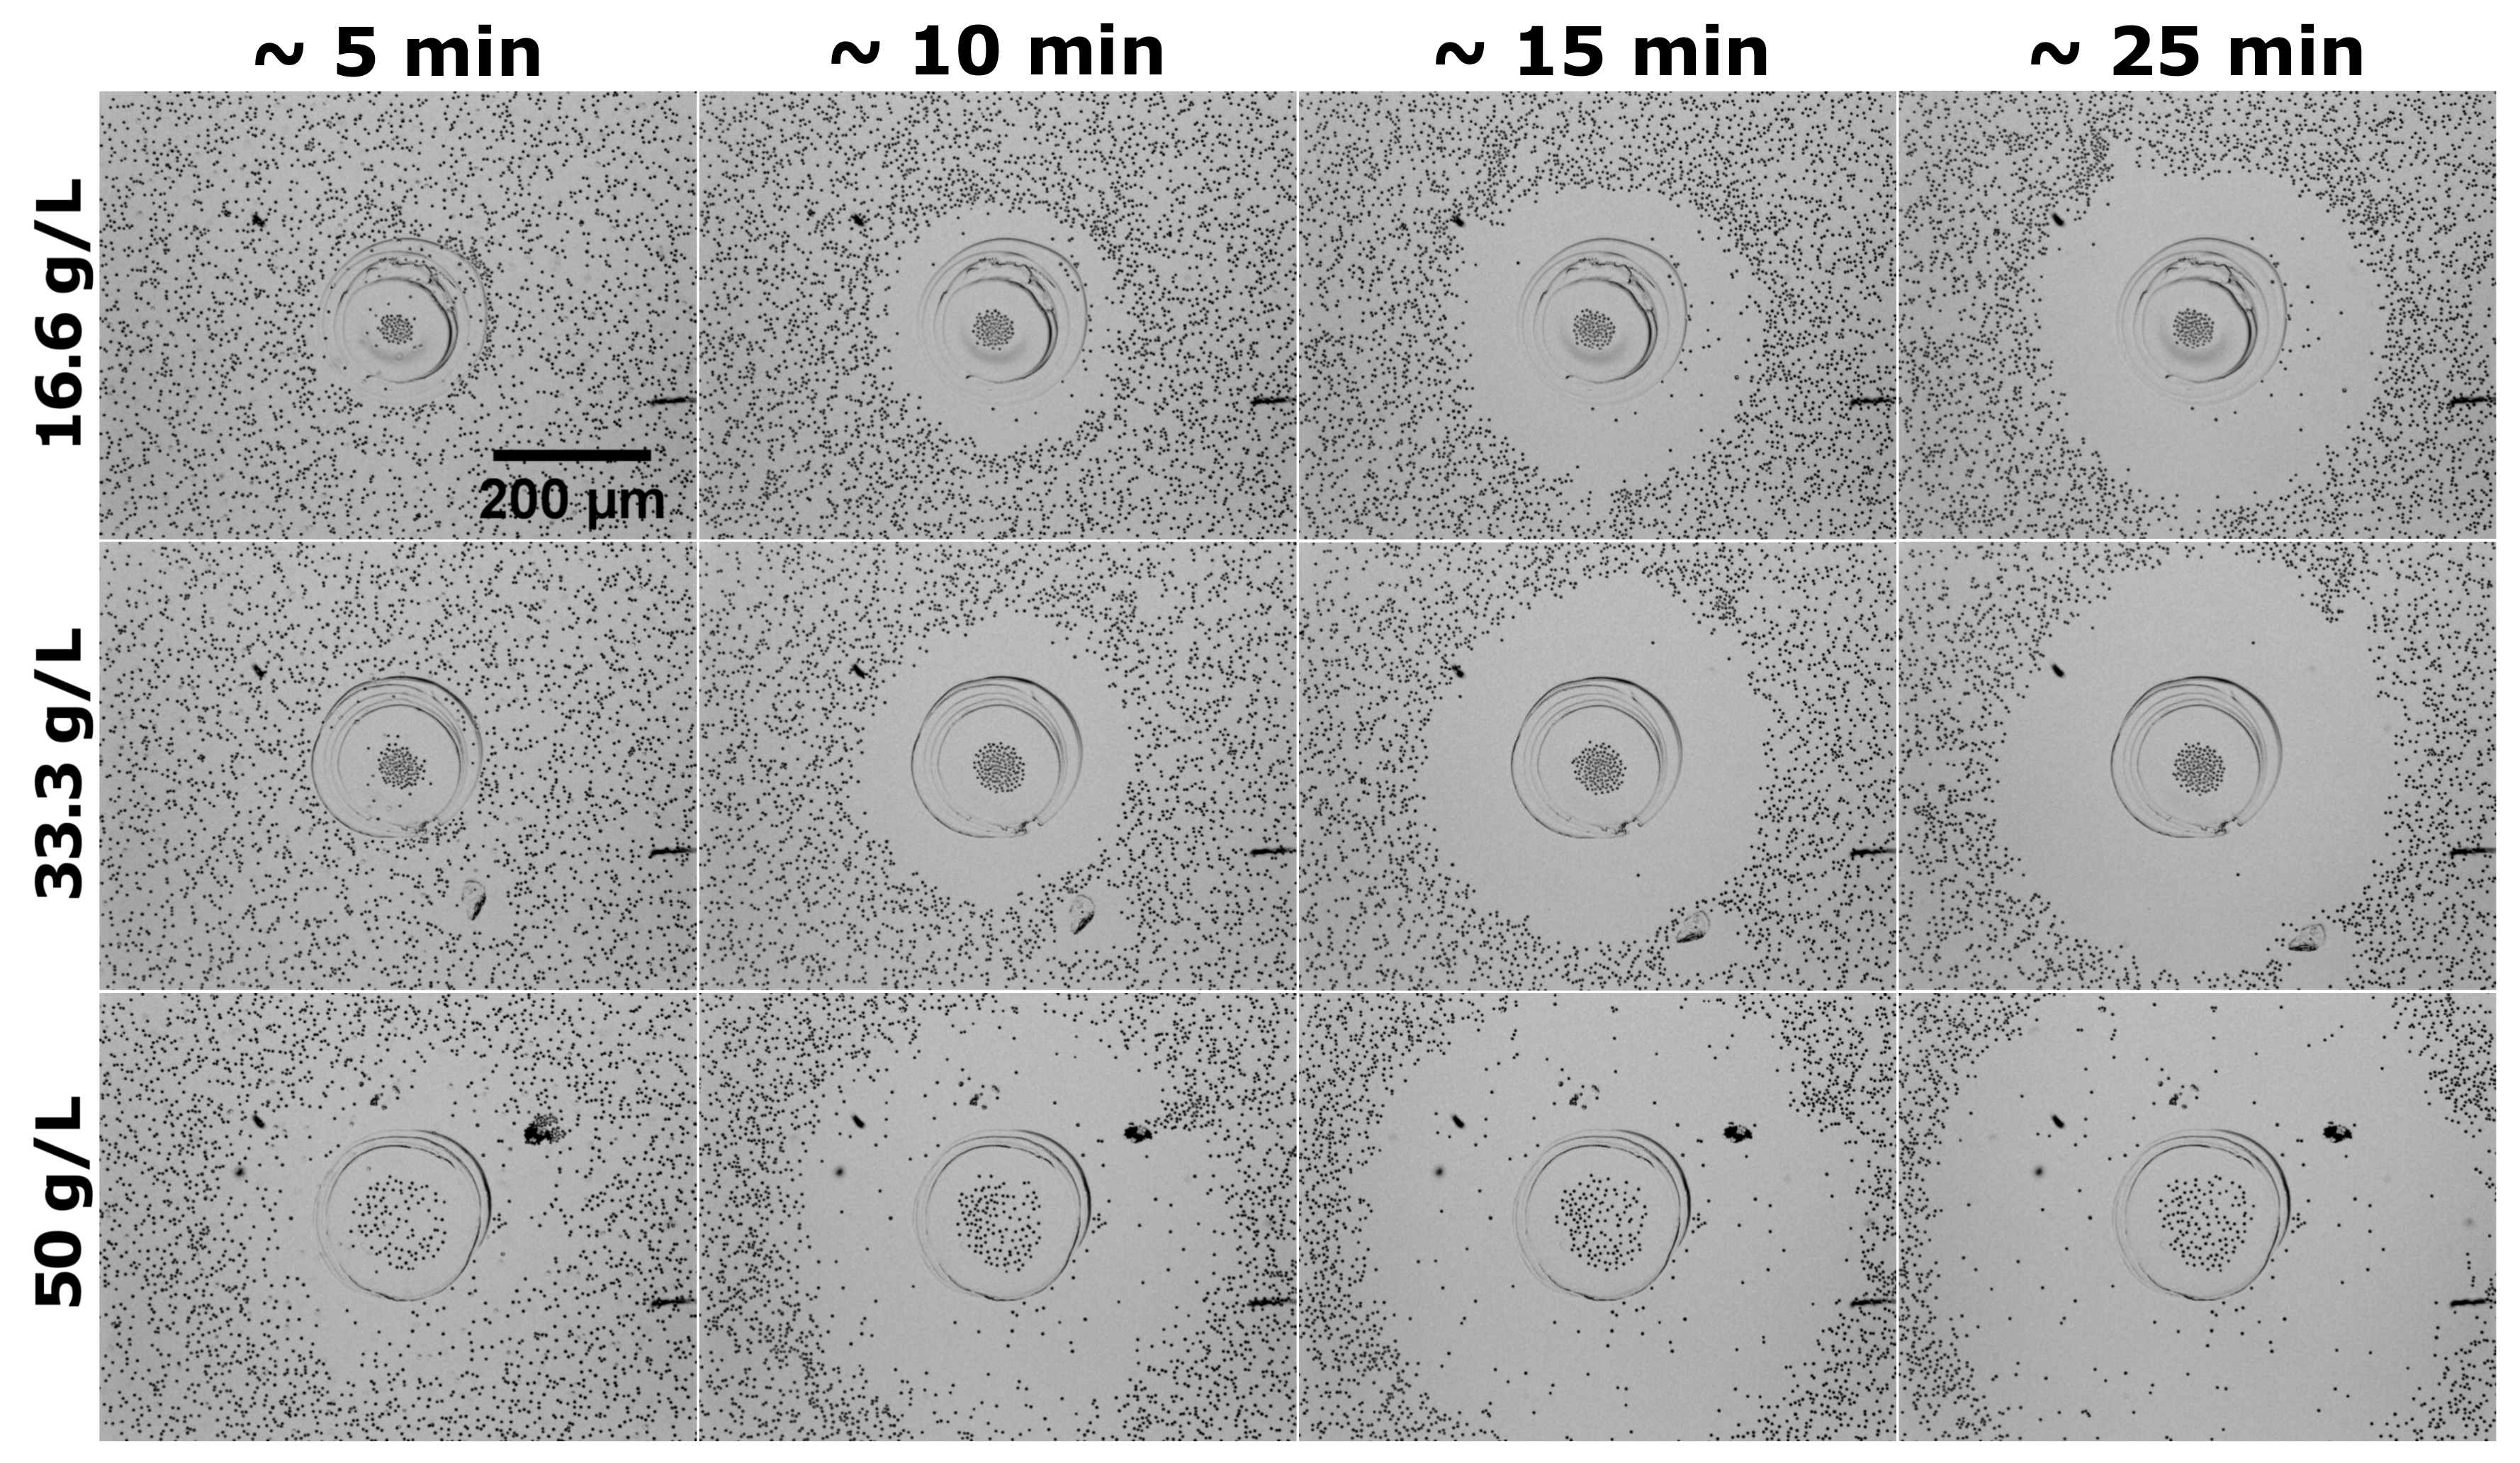
In the absence of glucose (i.e., when the enzyme pump is inactive), the sedimented silica particles were uniformly distributed around the enzyme patch and exhibit only Brownian motion (see the top row in Figure 1). Upon addition of glucose, which is the substrate for the GOX enzyme (and thus the activity of the enzyme pump is turned on), the tracers set in motion and exhibited a biased (though slow) outward motion (see Video S1 in the Supplementary Materials). This led to the emergence of a region depleted of tracers (see Figure 1, second to fourth rows), the extent of which increased in time with a rate that was increasing upon increasing the glucose concentration (compare the snapshots in the t > 0 columns in Figure 1). These qualitative observations can be turned quantitative in two complementary ways.
(i)
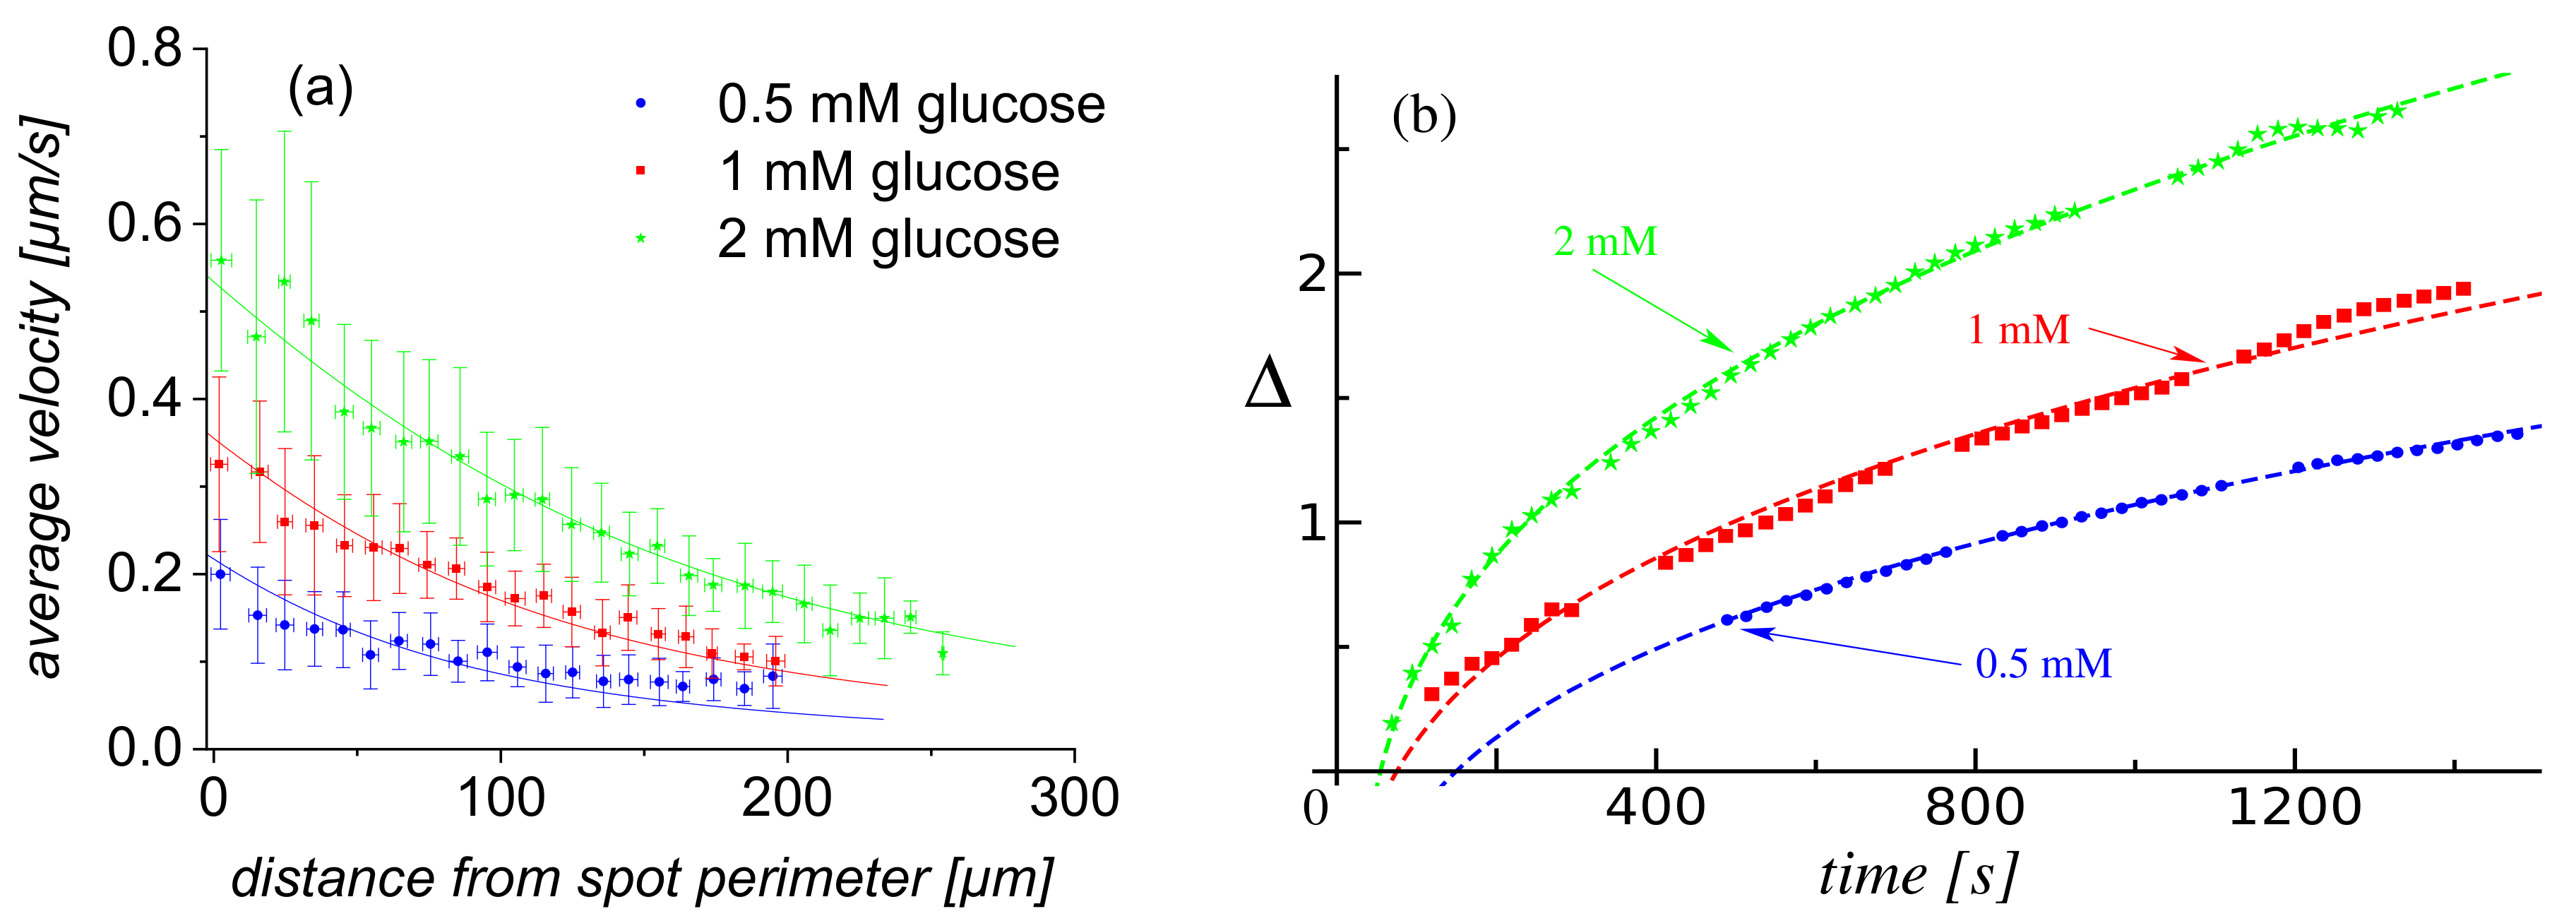
First, by tracking individual particles (see Video S2 in the Supplementary Materials), one can extract from the video recordings a set of in-plane trajectories. While it was not possible to extract well defined instantaneous speeds along the trajectory, because of their small magnitude (see Figure 2a), the average radial velocity of motion over a distance significantly larger than the size of the tracer turned out to be less susceptible to thermal fluctuations and image resolution effects. Accordingly, we evaluated such average velocities V over trajectories starting at t 0 = 5 min (to ensure that a stable steady-state regime of the enzyme pump was established; see also the results and discussion in Figure 2b) and followed up to t f = 10 min , as a function of the initial position of the tracer, i.e., its distance d from the edge of the patch (or, equivalently, the distance D : = R + d from the center of the patch). In Figure 2a, we show the result of such analysis combining more than 1900 independent trajectories, starting from various locations around the patch, from nine independent experiments (three pumps, each exposed to three glucose concentrations). It is seen that the radial motion of the tracers was associated with an average velocity V, as defined above, which monotonously decreased with the distance d from the edge of the active enzyme patch from where the tracer started. These variations were noticeable for initial locations d of the order of 2–3 times the radius of the enzyme patch (i.e., up to around 300 μ m ). The dependence V ( d ) at different concentrations of substrate seemed to be similar, up to an overall magnitude factor dependent on (and increasing with) the substrate concentration. By visual inspection (particularly the tails region), one can infer that this factor is somewhat different from just a proportionality with the glucose concentration.
(ii)
Second, the extent of the depletion zone, the outer edge of which was defined via the in-plane radial distribution of particles as the radius R d at the transition between the low and high density regions, could be determined from the video recordings via image analysis (for details, see Section 4.4). We note that the rate of change of R d is given by the radial velocity of a tracer located at R d (under the assumption of a dilute monolayer). Therefore, the time-dependent behavior of the depletion zone, as well as its dependence on the concentration of substrate in solution, are correlated with the dependencies of the average velocity V of the tracers on the initial location d of the tracer and on the glucose concentration. A set of results of this analysis, in terms of the time dependence of the extent of the depletion zone for three distinct glucose concentrations, is shown in Figure 2b, and the comprehensive list of these results (i.e., from all the three experiments) in Section 4.4. (Note that only the results where the image analysis led to robust fitting (see Section 4.4) are shown, thus the depletion zone data start from non-vanishing values.) As expected, the extent of the depletion zone grows faster when the glucose concentration is larger. As in the case of the V ( d ) dependence of the average velocity (defined above) of the tracers, the increase in the rate of growth of the depletion zone was somewhat different from just a proportionality with the glucose concentration. There was a certain time-lag, which depended on the glucose concentration, between the start of the experiment and the emergence of the depletion zone. The value of the lag-time was, in general, less than the time needed for the complete sedimentation of the tracers (we remind that here t = 0 corresponds to the start of the recording, which was 2–3 min after the addition of the solution containing glucose and the particles), and it decreased upon increasing the glucose concentration (i.e., the activity of the pump). These observations suggest that the lag relates to a transient regime of the enzyme pump, before the steady-state operation is fully developed.
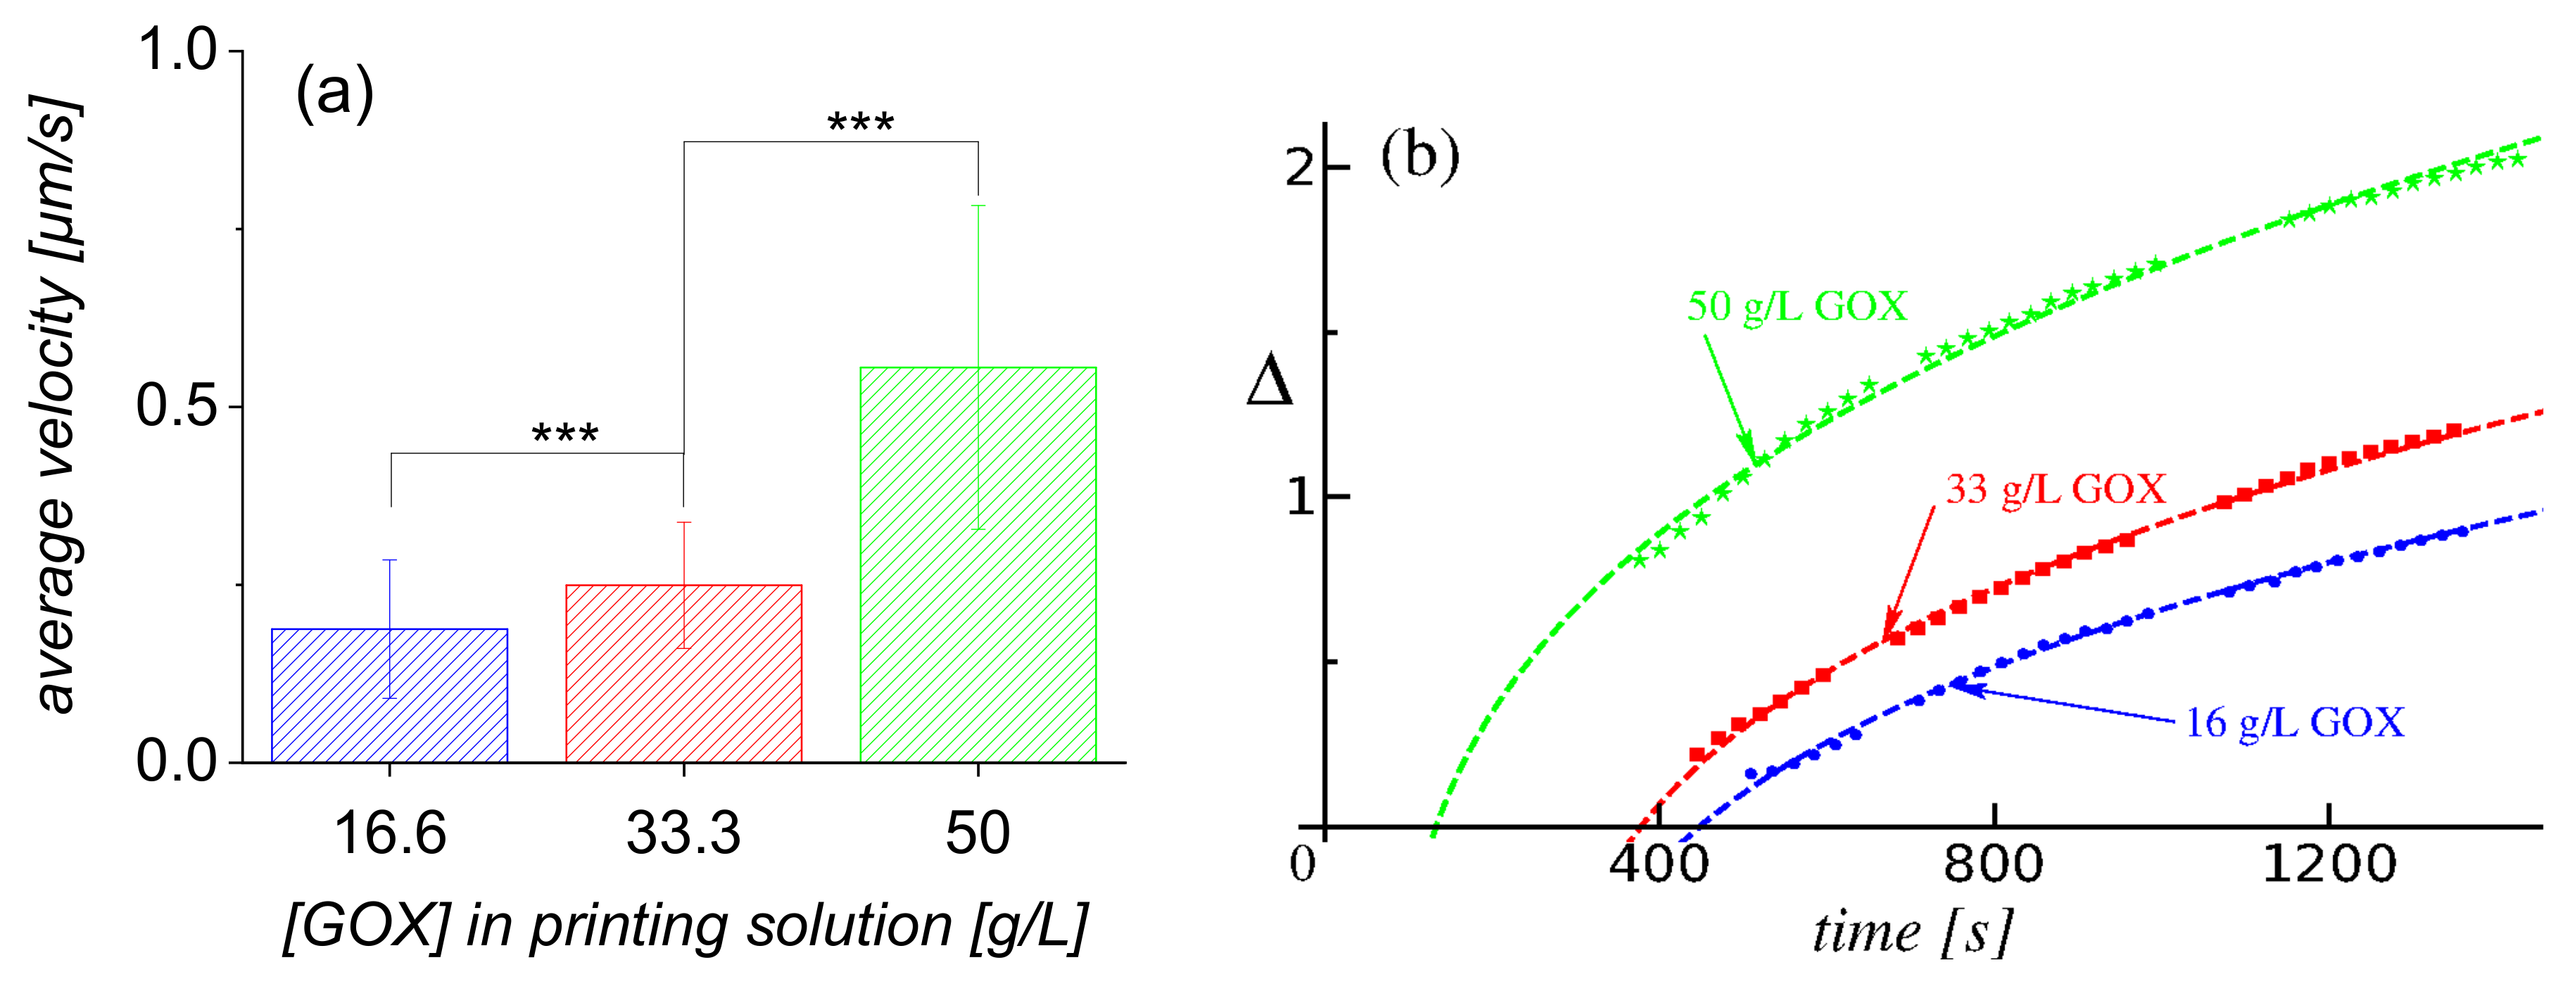
Finally, it was intuitively expected that the areal density of GOX in the enzyme patch would also significantly impact the functioning of such micropumps. Therefore, we fabricated enzyme patches of similar dimensions using solutions with three different concentrations of GOX: 16.6 g/L, 33.3 g/L (employed in the experiments discussed above, Figure 1 and Figure 2), and 50 g/L, respectively, and repeated the studies of the behavior of silica tracers for each of these pumps at a single, fixed glucose concentration of 0.5 mM. As shown in Figure 3, the qualitative behavior was similar at all three concentrations of GOX and, as intuitively expected, the magnitude of the effects increased with increasing concentration of GOX.
The behavior of the tracers for the pumps with varying GOX areal densities seems qualitatively similar to the behavior observed in the studies above, in which the glucose concentration was varied. Therefore, we analyzed in more detail only the time development of the depletion zone; the average velocity of tracers was determined only for trajectories, followed up to time t f , which started at t 0 from a distance d within 20 μ m from the edge of the enzyme patch. The results of the latter analysis, for a set of approximately 500 tracer particles dispersed around patches with different areal density of GOX, are shown in Figure 4a. As expected, this average velocity increased with the GOX areal density (more precisely, with the GOX-concentration of the solution from which the enzyme patch was fabricated), and the differences between the values at different densities were statistically “’highly significant” (the meaning of the *** symbols). It can be inferred, however, that the dependence of this average velocity of the tracers on the GOX-concentration was not linear. This can be understood by noting that, in the gels obtained by cross-linking GOX and BSA (see the details in Section 4.2), the amount of GOX was controlled rather than the activity of GOX. The latter is strongly dependent on the physicochemical properties of the microenvironment of the immobilized enzyme (thus, it does not necessarily change proportionally with the amount of enzyme) [1]. Accordingly, the measured changes in the average velocity V ( d ) were expected to be a combination of effects arising from both the different areal density and the different catalytic activity. In what concerns the time dependence of the extent of the depletion zone, similar to the observations related to Figure 2b, a certain time-lag was noted, which depended on the density of enzyme in the patch, between the start of the experiment and the emergence of the depletion zone. As discussed above, we infer that this reflects a transient regime of the enzyme pump, before the steady-state operation was fully developed.

3. Discussion

The experimental results discussed in the previous section reveal a radial outward motion of the tracers with a position-dependent velocity. This is correlated with the emergence of a region depleted of tracers around the enzyme patch; the linear size of this region increases slowly, but systematically, as a function of time. If this is to be attributed to a buoyancy-driven convective flow, as usually done in the literature on enzyme pumps [2,4,5,8,10,11], then the convective flow must be “outward” (away from the enzyme patch) at the bottom wall of the cell, on which the enzyme patch is located. This direction would be in agreement with that of Zhang et al. [5], who argued that the gluconolactone/gluconic acid products of the catalytic reaction promoted by GOX increase the density of the solution compared to that of the bulk glucose solution [18,19] (and thus would lead to outward convective flows near the bottom wall), but it would contradict the reports in [2,8] of “inwards” flows (toward the enzyme patch), for seemingly the same enzyme–substrate type of pump as the one studied here.
However, the current experiments differ from the previously reported studies of enzymatic pumps, which are summarized in Table 1, in a number of aspects. First, the sedimented silica tracers employed in our study were located very close to the bottom wall (the center of the spherical tracer was at a height of the order of its radius R p ). Accordingly, they probed the flow and the inhomogeneities in the solution composition very near the wall; in contrast, in all the previous reports. (quasi)neutrally buoyant polystyrene tracers have been studied at distances of at least 50 μ m (i.e., 15–20 R p ) from the wall, where their motion probes much less of any eventual wall-driven osmotic flow. Second, the geometry of our experimental cell, with respect to the dimension of the enzyme patch, is that of a half-space rather than the quasi-Hele–Shaw geometry with a very large enzyme patch used in the previous experiments. Finally, in our experiments, no buffer was used in the solution surrounding the pumps, and thus any electrostatic double layer interactions were significantly less screened than in the previous studies.
These aspects motivate an analysis of the factors potentially contributing to the motion of the sedimented silica particles in the presence of the chemically active enzyme patch. We consider only the in-plane motion of the particles; this is motivated by the fact that, in the experiments, we did not observe any tendency of the silica particles to lift-off (and by the fact that the sedimentation velocity of the silica particle (≈8 μ m / s ) is an order of magnitude larger than the observed velocities of the tracers, see Figure 2). Furthermore, for reasons of simplicity we consider only dilute monolayer (single-particle) limit, i.e., in the first approximation, we neglect the interactions between the particles in the monolayer. Finally, we note that for velocities of the order of μ m / s of micrometer-sized particles in Newtonian liquids of viscosity η similar to that of water, which is the case of our experiments, the effects of inertia can be neglected, i.e., the motion of the particle is in the overdamped regime and the hydrodynamic flow is in the very low Reynolds number regime, i.e., it is described by the incompressible Stokes equations (see, e.g., [20,21]).
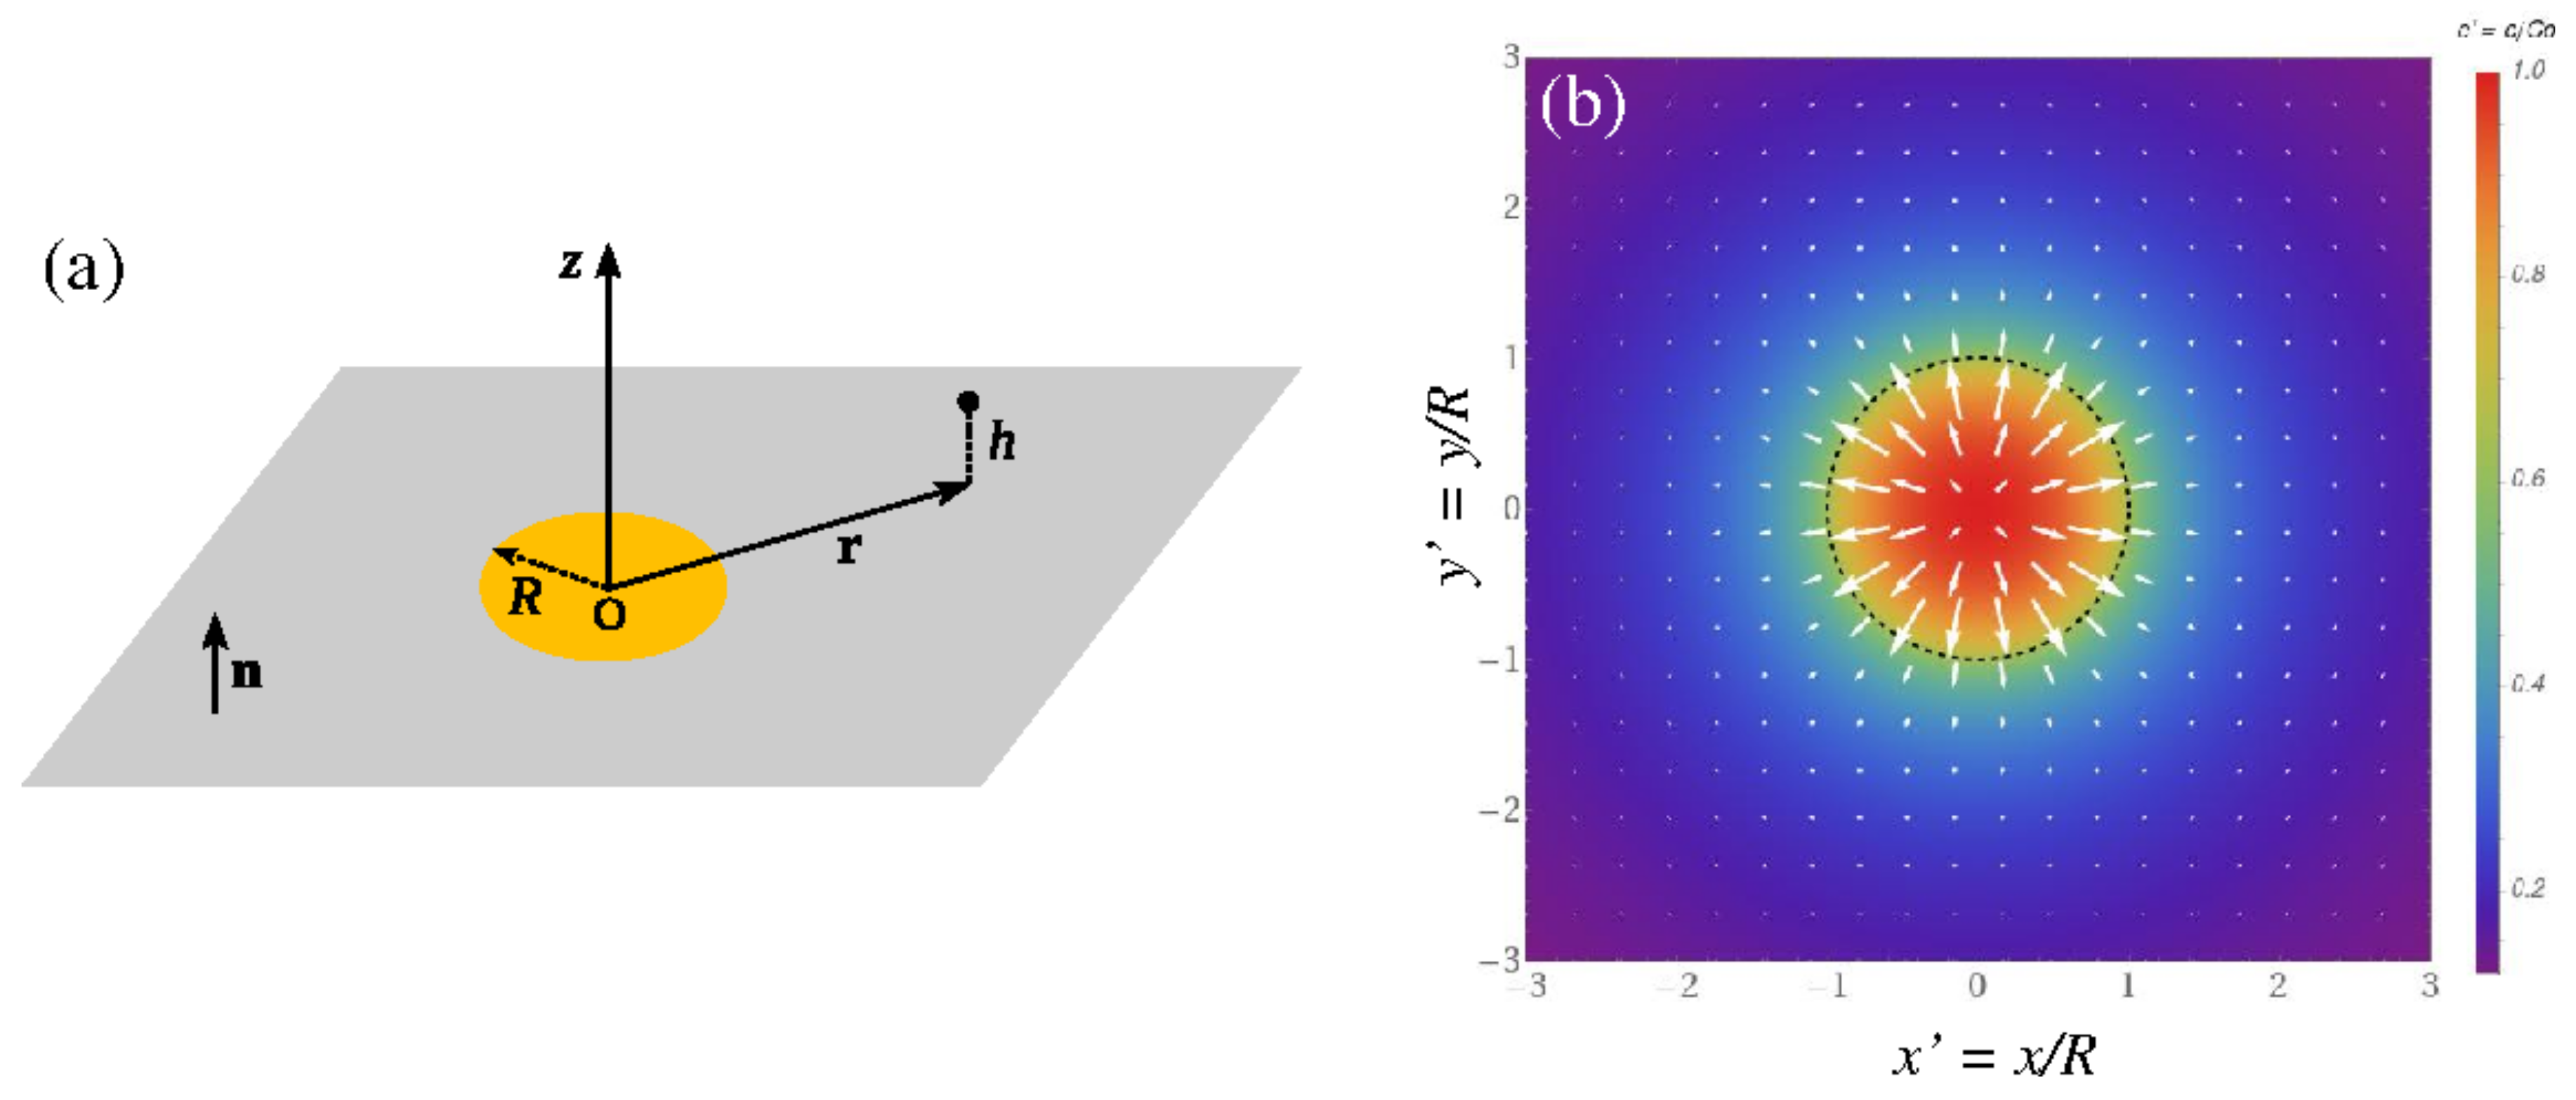
Accordingly, the in-plane motion of a particle at an in-plane distance r from the center of the active patch (see Figure 5a) obeys the equation
d r d t = U c h e m ( r ) + U h y d ( r ) = U c h e m ( r ) + U b ( r ) + U o s ( r ) .
The first equality identifies two contributions to the motion of the particle: the response to the spatial gradients in chemical composition of the solution (due to the catalytic enzymatic reaction at the patch location), i.e., phoresis, and the drag by the ambient hydrodynamic flow u (which is also caused by the spatial inhomogeneities in chemical composition of the solution), respectively. The second line exploits the linearity of the Stokes equations to decompose the total ambient flow u into the superposition of two distinct ones (and, accordingly, the drag on the particle by the sum of the drags by each of the two). The first one, u b , is the flow due to a distribution of body forces in the volume of the solution, accounting for local deviations in the density of the solution from its value in the bulk due to the changes in the chemical composition, i.e., the so-called solutal buoyancy effect [2,11]. This flow obeys a no-slip boundary condition on the wall (and suitable boundary conditions on all the other confining surfaces). The second one, u o s , is the flow in the absence of body forces but due to an imposed wall-actuation, in the form of an osmotic slip boundary condition at the wall. The osmotic slip is due to the distinct interactions of the various molecular species in the solution with the wall; it reflects the coupling of the gradients in chemical composition along the wall to osmotic pressure gradients, which leads to hydrodynamic flow of the solution [22,23] (Obviously, the mechanism of the osmotic flow is similar to the one giving rise to the phoresis of the particle [22]). The flow u o s obeys the same suitable boundary conditions on all the other confining surfaces (including no-slip on that of the particle).
Due to the no-slip boundary condition at the surface of the wall, the magnitude of the flow u b at the location of the particle is very small, as it is proportional to ( R p / R ) 10 2 . On the other hand, the osmotic flow is maximal at the wall, where it takes the value of the osmotic slip, and has a magnitude of order 1 in ( R p / R ) . Accordingly, in Equation (1), we disregard the contribution from u b and simply investigate if the resulting dynamics is compatible with the experimental observations. A rigorous analysis of this approximation requires explicit calculations of the osmotic- and buoyancy-driven flows. However, even under the approximation (as allowed by the particular geometry of our enzyme pump and cell) of the fluid occupying half-space, this remains a technically involved problem which is left for future work.
We are thus left with only the phoretic and osmotic terms, which corresponds to a classical problem of phoresis of a spherical particle in externally imposed gradients in chemical composition and under geometrical confinement [23]. Due to the particular geometry of the cell (height and lateral extent much larger than the radius of the patch, which sets the characteristic length scale of the variations of the chemical field (see Appendix A) and, consequently, also of the hydrodynamic flow), the problem is further reduced to that of motion near a wall in a solution occupying the half-space above the wall. This problem has been previously studied (see, e.g., [23,24,25]), and it was shown that the sum of the two terms in which we are interested here can be expressed in terms of the gradients of the unperturbed (i.e., which would be established if the particle would not be present) chemical field evaluated at the location of the center of the particle.
To apply these existing results it is thus necessary to determine the chemical field induced by the catalytic reaction at the enzyme. In our case, this involves two reactant molecular species (glucose and oxygen) and two product species (gluconic acid and hydrogen peroxide); the latter are denoted as species A and B. The spatially-dependent chemical composition can be determined (see Appendix A for the details) by assuming that: (a) the number densities of the product species remain sufficiently small (over time scales relevant to the experimental ones) such that the mixture, composed of solvent, reactants, and products, behaves as a dilute, ideal solution (i.e., the product species can be treated as an ideal gas); (b) the reactants are present in abundance and well mixed in the volume of the solution (i.e., to a good approximations they have spatially uniform densities); (c) the catalytic reaction operates in the reaction-limited kinetics regime; and (d) the transport of products by diffusion dominates the one by advection. One arrives at the result that, at the steady state, the number density distribution of a product species, e.g., species A, is given by
c A ( r , z ) = C 0 0 d ξ ξ 1 J 1 ( ξ ) e ξ z J 0 ( ξ r ) ,
where J 0 , 1 denote Bessel functions of the first kind,
r = r / R , z = z / R ,
and C 0 is a characteristic number density (see Appendix A), which sets a number density scale. The number density of the second species, B, is then given by a similar expression (see Appendix A),
c B ( r , z ) = D A D B c A ( r , z ) ,
where D A , B are the diffusion constants of species A and B, respectively.
In terms of these densities, the velocity of the tracer is expressed as [23]
V t r ( r ) = ( μ A χ A ) r c A ( r , h ) + ( μ B χ B ) r c B ( r , h ) μ A χ A + D A D B ( μ B χ B ) r c A ( r , 0 + )
where the subscript r denotes the in-plane gradient; μ A , B are the phoretic mobility coefficients of the tracer to gradients in the species A or B, respectively; and χ A , B are the similarly defined osmotic mobility coefficients of the wall (a prefactor accounting for the finite size of the tracer has been left out; this factor (which is of the order unity, or larger, in ( R p / h ) [23]) is qualitatively irrelevant for the in-plane motion in our system, where h can be assumed to be constant. In passing from the first equality to the second line, the approximation is that of evaluating the gradient in the density of product A at the wall rather than at the location of the particle; this is well justified because c A varies over length scales of order R, while the particle is at location h = h / R 1 , see also Figure A1b). The in-plane density c ( r ) : = c A ( r , 0 + ) / C 0 and the tracer velocity vector field V t r / V 0 = r c A ( r , 0 + ) are illustrated, for V 0 < 0 , in Figure 5b. Introducing the notations
μ : = μ A χ A + D A D B ( μ B χ B ) , and V 0 : = μ C 0 2 R ,
and using the monopolar approximation (see Equation (A7)) for the density c A ( r , 0 + ) renders the very simple final result
V t r ( r ) = V 0 R r 2 e r .
The phenomenological coefficient μ , and, accordingly, the parameter V 0 , can be either positive or negative; since its sign is not known a priori, Equation (7) cannot be used to predict the direction of motion of the tracers. Rather, from the observed direction of motion, one infers that, for the model to be compatible with the experimental observations, the coefficient μ must be negative (accordingly, V 0 < 0 , too). The dependence on r, on the other hand, provides the means for testing the validity of the model.
The average radial velocity over a trajectory starting at t 0 from r = D (i.e., d from the edge of the patch) and extending up to r f at t f = t 0 + T , is obtained by integrating Equation (7):
V ( d ) : = r f D T = V 1 + d R 3 + T τ 1 / 3 1 + d R ,
where τ : = R / | V 0 | (we remind that V 0 < 0 , see above) is a characteristic time scale and V : = R / T a suitable velocity scale. As shown in Figure 2a, with R = 110 μ m and T = 5 min , the expression above provides a good fitting for the experimentally measured average velocity data. For the three datasets (ordered from low to high concentration of glucose), the values of the characteristic time τ 0 (which is inverse proportional to | V 0 | , and thus with the glucose concentration) obtained from the fitting are in ratio 1:0.46:0.22, which is reasonably close to the expected 1:0.5:0.25 one. These imply that the dependence in Equation (8), and, implicitly, the r 2 dependence of the tracer velocity in Equation (7), is compatible with the experimental observations.
Similarly, by integrating the rate of change of the edge R d of the depletion zone, given by d R d / d t = V t r · e r , from the time t 0 at which this emerges (i.e., when R d = R ) up to the time t, with V 0 < 0 , one obtains the following expression for the time dependence of the extent Δ : = ( R d R ) / R of the exclusion zone:
Δ ( t ) = 1 + 3 t t 0 τ 1 / 3 1 .
As shown in Figure 2b and Figure 4b, by fitting the time dependent depletion zone data with the expression above, one obtains in the first case values of the characteristic time τ 0 in a ratio 1:0.56:0.24, which is reasonably close to the expected 1:0.5:0.25. Accordingly, one similarly concludes that the time dependence predicted by the model is compatible with the experimental observations at different concentrations of substrate (glucose). In what concerns the results in Figure 4b, in which the areal density of enzyme in the patch varies (ideally, in a proportional way with the concentration of enzyme in the solution from which the spot is printed), the characteristic times τ 0 obtained from the fit are in ratio 1:0.66:0.3, which is to be compared with the expected (if the proportionality mentioned above would hold) 1:0.48:0.32. While the low and high enzyme concentration data are in the expected ratio, the dataset at average enzyme concentration deviates significantly. As discussed in Section 2.1, this most likely reflects the dependence of the activity of the patch on the environment-dependent activity of an enzyme molecule.
Several aspects of these results deserve further discussion. (a) We have arrived at the conclusion that, by employing a simple model of an active pump, accounting solely for the motion of tracers by diffusiophoresis and accounting for drag by the osmotic flow, leads to prediction compatible with the experimental results. Accordingly, a mechanism invoking only these two factors, but no bulk-driven flow, cannot be a priori disregarded. On the other hand, the power law fitting covers a limited range of data (e.g., less than an order of magnitude in what concerns the tracers velocity data), and therefore one cannot make stronger claims than that of a plausible mechanism. (b) The expression of the mobility factor μ allows for the following intriguing scenario. For tracer particles, which are made out of the same material as (have identical surface properties with) the wall, i.e., μ A = χ A and μ B = χ B , one has μ = 0 ; accordingly, in such system, the mechanism discussed above would not give rise to motion of the tracers. (c) Finally, one notes that, within the model assumptions, the mobility factor μ involves only differences μ k χ k (with k denoting any of the product species), but not those coefficients individually. Therefore, they cannot be estimated individually from experiments with a single combination of wall and tracers. While the APTES and BSA modification of the glass support cannot be changed easily, varying the material from which the tracers are made, or applying various coatings over a given type of tracer, seems feasible. Accordingly, experiments involving the same wall but tracers of different types would allow variations of μ (which can be extracted from the experimental measurements of the average velocities of tracers) due solely to variations of { μ k } at fixed χ k .

4. Materials and Methods

4.1. Materials

Glucose oxidase (GOX, Cat. No. G7141), glucose (Cat. No. G7021), bovine serum albumin (BSA, cat. no. G4287), 3-aminopropyltriethoxysilane (APTES, Cat. No. A3648), glutaraldehyde (25 %, Cat. No. G400-4), toluene (Cat. No. 244511), silica microparticles (3 μ m in diameter, Cat. No. 66373) and glycerol (Cat. No. G7893) were purchased from Sigma Aldrich Inc. Acetone (min. 99.92 %) and ethanol (min 99.5 %) were purchased from a local distributor (Chimreactiv SRL, Bucharest, Romania). High precision microscope cover glasses (24 mm × 60 mm × 0.17 mm, Cat. No. 277684063, and 22 mm × 22 mm × 0.17 mm, Cat. No. 41022012) were purchased from Carl Roth GmbH. Borosilicate glass capillaries (100 mm × 1.5 mm × 0.86 mm, Cat. No. GC150F-10) were purchased from Harvard Apparatus. All (bio)chemicals were used as received. All necessary solutions were prepared with ultrapure water from a Millipore Direct-Q water purification system.

4.2. Fabrication of Enzyme Micropumps

The fabrication of an enzyme micropump involved several steps: (1) the modification of the surface of a microscope cover glass with APTES molecules (which carry amino groups and thus facilitate the covalent binding of enzymes to the glass surface); (2) the preparation of a GOX-based ink; (3) the fabrication of a glass micropipette with the appropriate diameter (i.e., ≈200 μ m); (4) printing of a GOX patch onto the APTES-modified microscope cover glass; (5) cross-linking the just printed GOX patch with glutaraldehyde (which reacts with amino groups found both on the surface of the cover glass and on the surface of the enzyme); and (6) removing the residual (unreacted) glutaraldehyde, as well as the adsorption hotspots left on the APTES-modified glass, with BSA.
To be modified with APTES molecules, the microscope cover glass was first washed with acetone and ethanol and then immersed into an APTES solution (2%, made in toluene) for 10 min.
The GOX-based ink was obtained by mixing 2 parts of a GOX solution (50 g/L, prepared in an aqueous solution with 1% glycerol) with 1 part of a BSA solution (50 g/L, prepared in an aqueous solution with 1% glycerol). For investigating the impact of the amount of enzyme contained in the micropump (see Section 2.2 and Figure 3 and Figure 4), we prepared two additional inks. One of them was obtained by mixing 1 part of the above-mentioned GOX solution with 2 parts of the above-mentioned BSA solution, while the other consisted of 3 parts of the above-mentioned GOX solution.
The glass micropipette used for contact printing was obtained by pulling a borosilicate glass capillary in a P-97 Flaming/Brown type micropipette puller from Sutter Instrument. The micropipette was subsequently polished using an EG-401 microgrinder from Narishige Group until an outer diameter of 190 μ m and an inner diameter of 120 μ m were achieved. The dimensions of the micropipette determined the dimensions of the enzyme patch that could be printed. In addition to exploring a range of lateral dimensions suitable for microfluidic applications, the enzyme micropumps with a diameter around 200 μ m also suited well the field of view of a small-magnification objective (10×), which allowed investigating the tracer dynamics at macroscopic scales. We note that the fabrication of smaller (down to 50 μ m) or larger (up to 500 μ m) micropipettes, and thus of micropumps of similar lateral extents, is feasible with the methodology detailed here.
For printing, the micropipette was loaded by capillarity (i.e., by immersing it into 30 μ L of ink) with few microliters of ink and subsequently was brought into contact five times with the APTES-modified microscope cover glass (while adjusting the micropipette position, monitored through the horizontal microscope of the EG-401 microgrinder). At each contact, a minute volume of the GOX ink passed from the pipette onto the APTES-modified glass; the deposited GOX ink dried within 1–2 s.
The printed enzyme patch was stabilized via cross-linking through exposure for 10 min to the vapors of a 25% aqueous solution of glutaraldehyde.
In the final step of the fabrication, the cross-linked enzyme patch was incubated for 15 min with an aqueous BSA solution (concentration 3.3 g/L). BSA not only consumed the residual, unreacted glutaraldehyde but turned out to be an important factor in what concerns preventing the attachment of the tracer particles to the glass slide carrying the micropump.
Before the starting of an experiment, the micropump was thoroughly washed with water to remove any components which were not strongly anchored to the (APTES and BSA)-modified glass slide.

4.3. Investigation of the Behavior of the Tracers in the Vicinity of the Active Enzyme Patch

The investigation of the behavior exhibited by the tracers around an active enzyme patch involved the following steps: (1) inserting the micropump into a homemade cell; (2) preparing 300 μ L of aqueous solution containing silica microparticles (i.e., tracer particles) and the selected concentration of glucose (0, 0.5, 1, or 2 mM); (3) pouring 280 μ L of the just prepared solution over the micropump; and (4) video-microscopy recording of the motion of tracer particles sedimented at the (APTES and BSA)-modified glass slide for approximately 25 min.
The in-house built cell consisted of a PDMS O-ring (with inner diameter of 1 cm and height of 3 mm), which was placed over the glass with the enzyme patch such that the patch was located close to the center of the region inside the PDMS O-ring. After partially filling the cell (ca. 2 mm of the 3 mm height available) with the solution containing tracer particles and the selected concentration of glucose, the cell was covered by another microscope glass slide, which, in addition to the use of a LED as light source in our microscope, reduced water evaporation and thus spurious (not related to the activity of the enzyme pump) flows. The use of the PDMS O-ring and the partial filling of the cell ensured that the GOX micropumps were supplied with sufficient oxygen, as required for their stable operation, both through the PDMS walls of the experimental cell (PDMS being a material characterized by very good oxygen permeability [26,27]) and from the air-filled headspace of the measuring cell.
The tracer particles were visualized through the bottom wall of the measuring cell by using an Observer D1 inverted microscope from Carl Zeiss AG equipped with an A-plan, 10×/0.25 Ph1 objective from the same company and with a DFK 31AF03 CCD camera from The Imaging Source Europe GmbH. The video recording at 2 frames per second was done using the Lucam Recorder as image acquisition software, while the subsequent tracking of the tracer particles and analysis of the trajectories was carried out using the Icy software [28].

4.4. Determination of the Extent of the Depletion Zone via Image Analysis

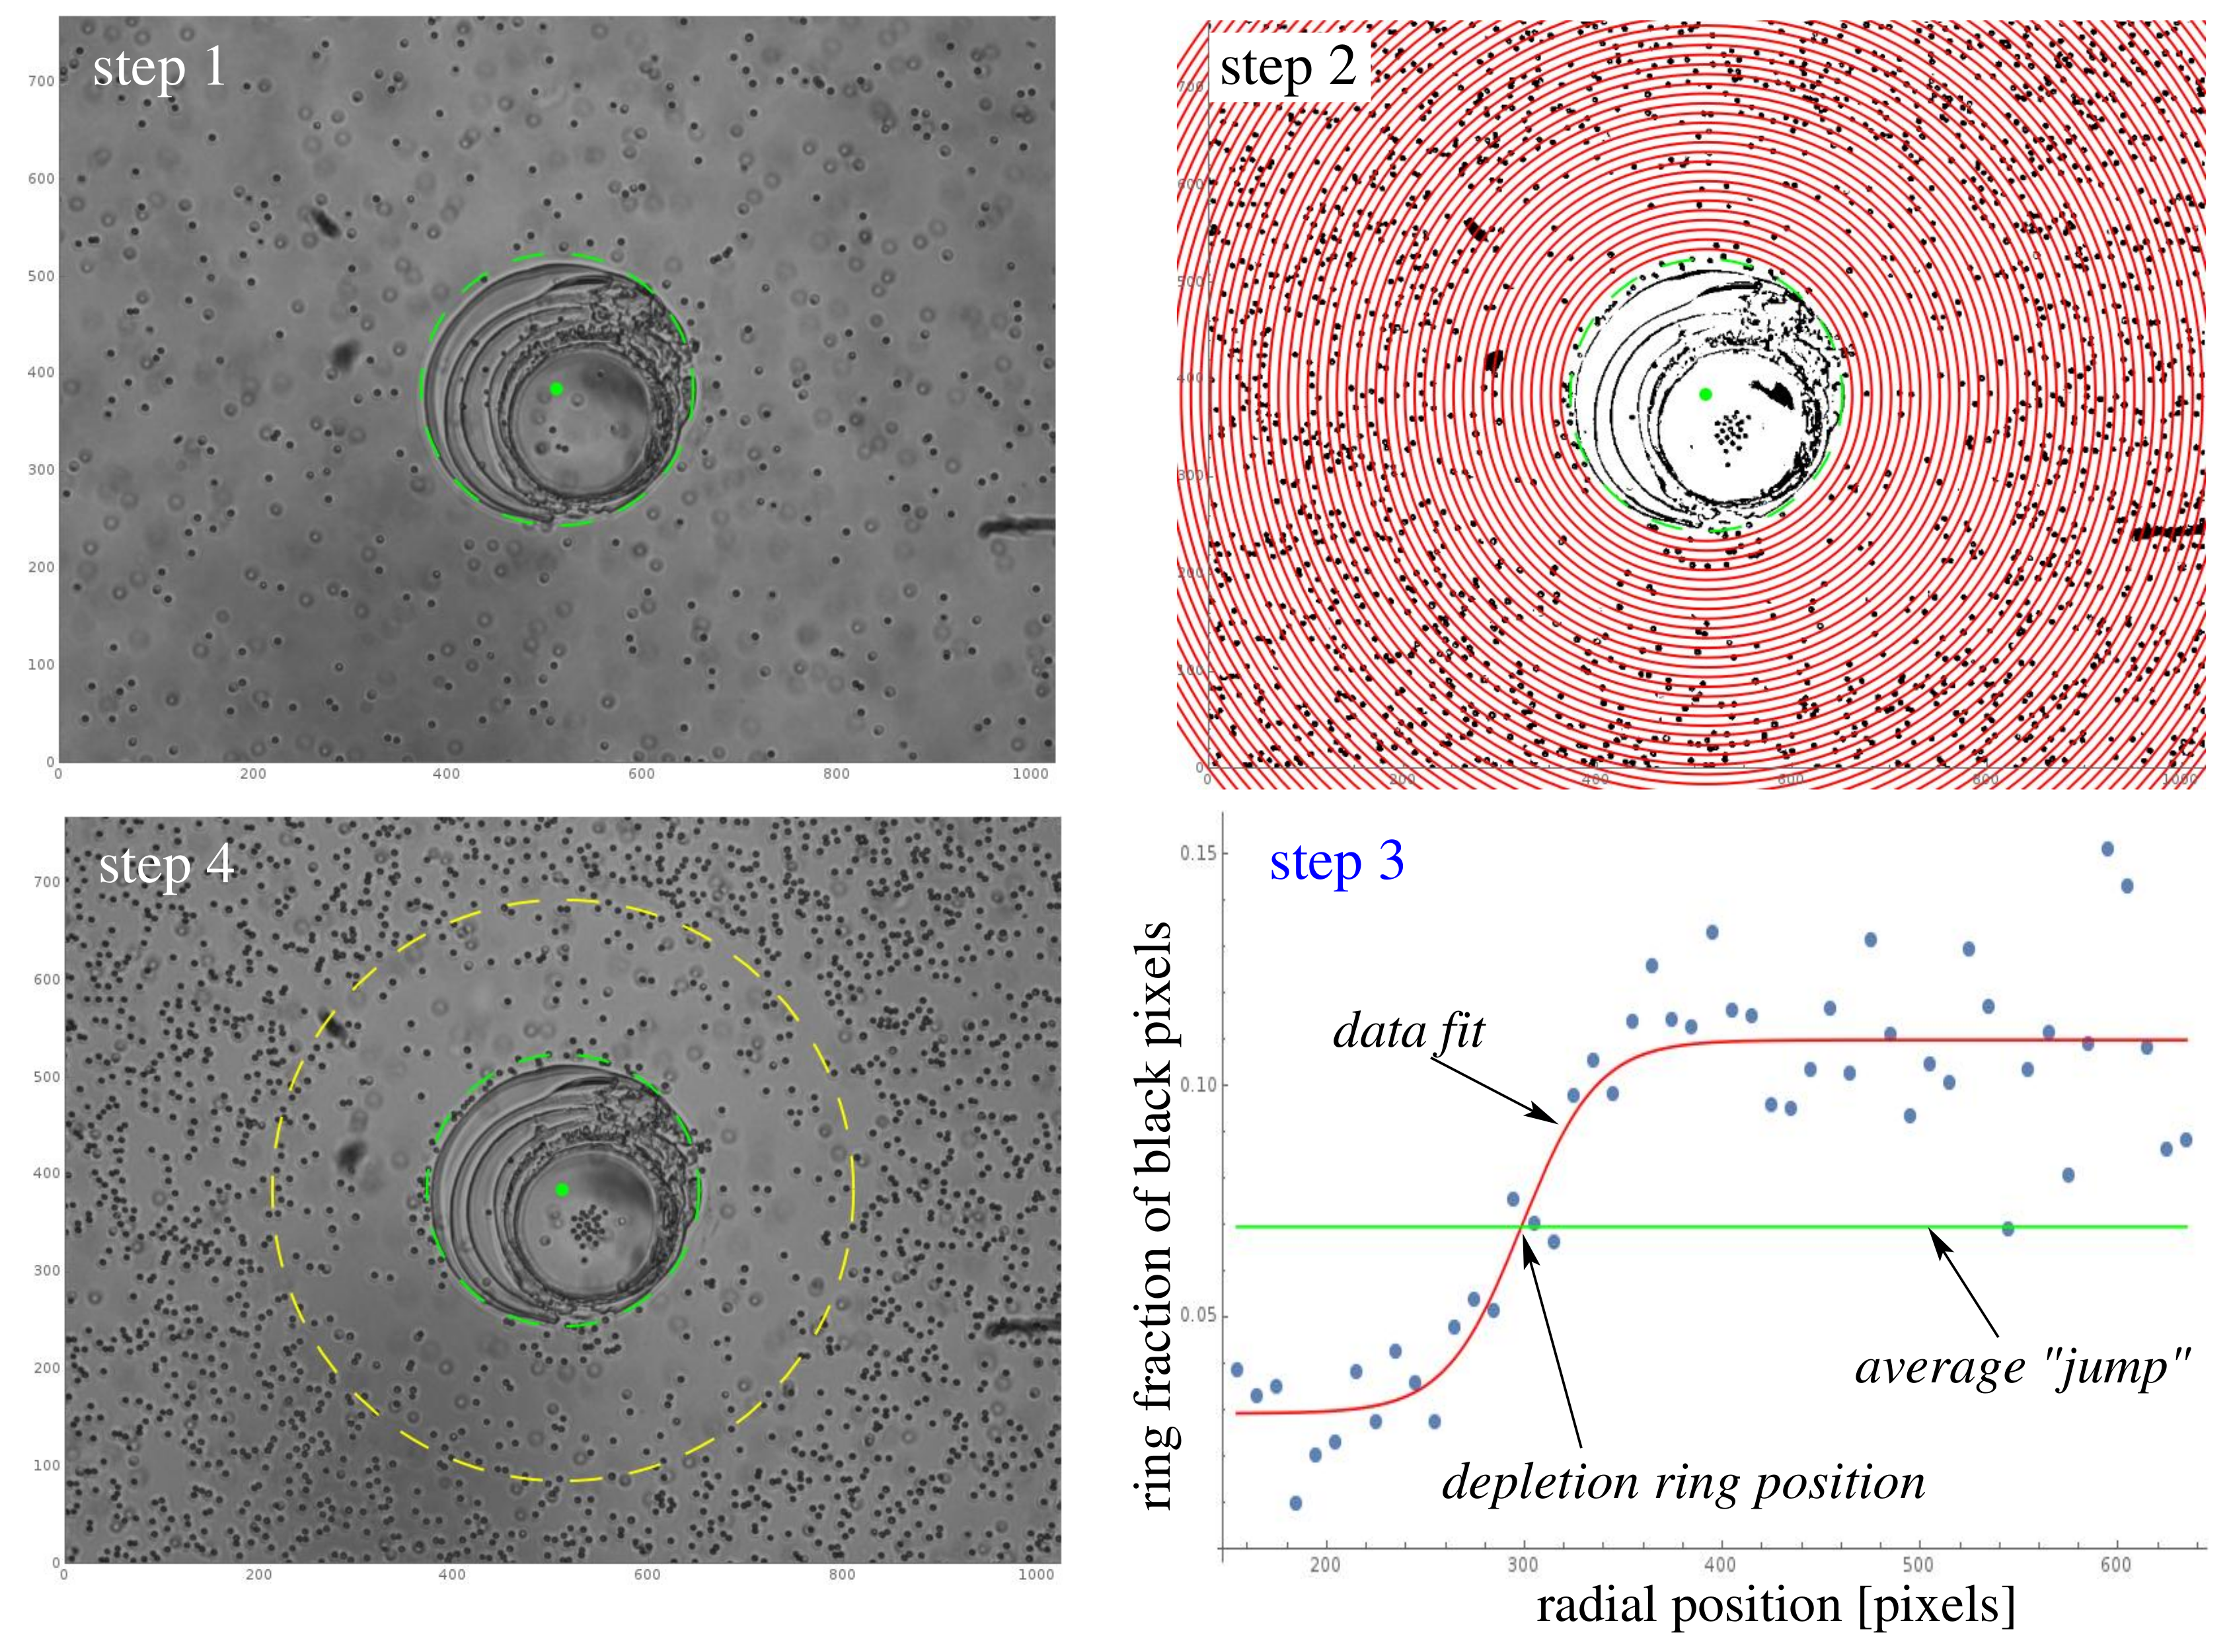
The extent of the depletion zone around the enzyme patch was performed via automated image analysis, using the software Mathematica (version 11.1), of the video recording of the experiments as follows. The first frame of the recording (the origin of time, i.e., t = 0 , is set to this frame) was imported and the location and extent of the patch, approximated by the interior of a circle of radius R, were manually determined (see the green point and the dashed green circle in Figure 6, “step 1”).
The values of these parameters were kept fixed for the rest of the analysis of that video recording (consisting of four movies, 5 min in duration each, subsequent movies being separated by a short time interval as required for the saving of the previous one).
The following sequence of steps was iterated for each frame of the recording. In the second step, the frame number k was read and the image was transformed into a binary format using a threshold value of 0.3–0.6; the value of the threshold was adjusted such that the gray background was set to white while the tracer particles, which were in focus, remained visible as black dots, as shown in Figure 6, “step 2”. The area of the image, outside of the circle defining the edge of the enzyme patch, was divided among N = 50 circular rings of same width (the red circles or parts of circles shown in Figure 6, “step 2”); this number was chosen such that it was sufficiently large to ensure small radial steps and as well as to achieve good statistics (i.e., contain a sufficient number of particles in each annular region). For each annular region n (ring, or part of a ring as in the case of the ones with large radius R n ), the total number of pixels located within the ring, as well as the number of them that were “black” (belonging to tracer particles), was determined. The ratio “black”/“total” then provided a measure of the density of particles at position R n from the center of the patch.
In the third step, the dataset { R n , (“black”/“total”) n } obtained as above (the blue points in Figure 6 “step 3”) was fitted with the sigmoid function (the red curve in Figure 6 “step 3”)
f ( x ; y m i n , y m a x , λ , x 0 ) = y m i n + y m a x tanh [ ( x x 0 ) / λ ] ,
with { y m i n , y m a x , x 0 , λ } fitting parameters. The fitting routine was robust, with the exception of the data corresponding to the transient regime at early times (after addition of the substrate, i.e., the “turning on” of the pump); the duration of this transient regime depended on the concentration of substrate (see the discussion in Section 2.2). This subset of early times data was visually identified and removed from the subsequent analysis. Upon fitting, the value of the parameter x 0 , i.e., the radial location of the inflection point (where the value of the “density” was the average of the low ( y m i n ) and high ( y m a x ) plateaux values; this is shown by the green line in Figure 6 “step 3”), was defined as the location of the outer ring of the depletion zone. This is shown by the yellow dotted circle in the optional step of visualization of the results (see Figure 6 “step 4”).
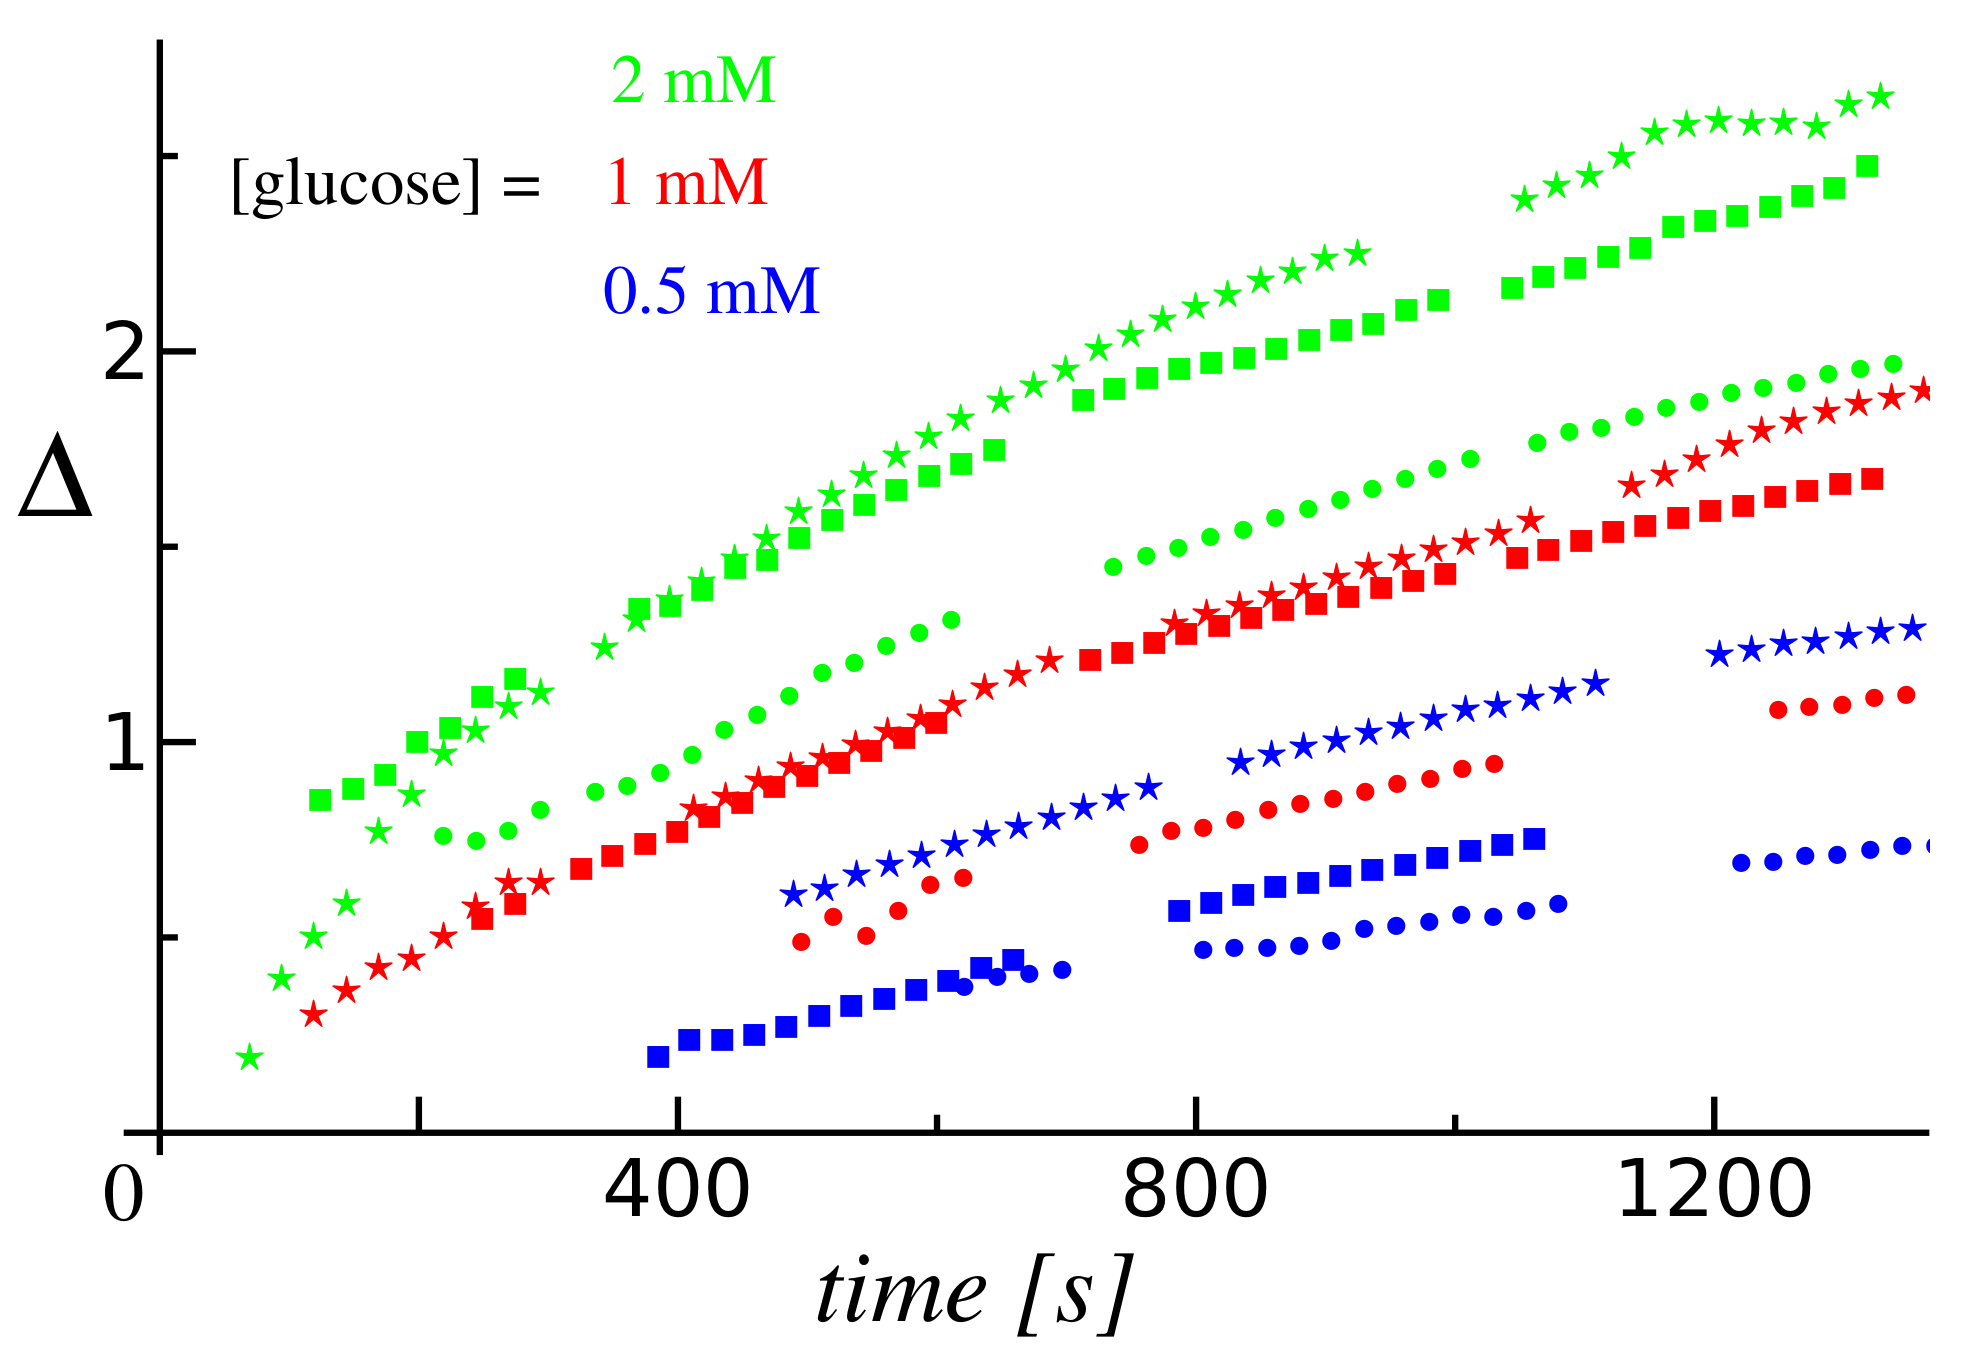
The results obtained by applying this procedure to the data from the available nine independent experiments are summarized in Figure 7. These reveal that, although the glucose-concentration dependence was a robust feature in each set of experiments involving a given pump, there was yet significant variability in the dynamics of the depletion zone at a given concentration from experiment to experiment. This could be due to several factors. The first one is the yet inherent variability in the composition of the enzyme patch (see also the discussion in Section 2.2), in the state of the glass support (i.e., uniformity of the APTES and BSA coverage), and in the average density of tracers in the monolayer. Another potential source of such variations from experiment to experiment is connected to the image analysis, in that the transition defining the location of the depletion zone is not sharp and its extent varies in time as well as with the average density of tracers. Finally, it is also possible that the variability exhibited in the current experiments reflects collective effects (which depend on the average density of tracers), if the assumption that the sedimented tracers form a dilute monolayer does not hold. Elucidating these aspects is left for future work.

5. Conclusions

Disk-like GOX micropumps characterized by a small lateral dimension (≈ 200 μ m) and different enzyme content were successfully fabricated and then turned on using solutions with different glucose concentrations (up to 2 mM). The impact of such active micropumps on tracer particles was then investigated with two important particularities as compared to previous studies: (i) Tracer particles located in the proximity of the GOX micropumps and, additionally, sedimented very near the wall containing the enzyme patch; this liquid–solid interface of the enzyme pumps was to great extent neglected in previous studies. (ii) An experimental cell of large dimensions, relative to that of the enzyme patch, which avoids the complications arising form potentially very complex flow geometries occurring when the geometrical confinement is strong. The tracer particles exhibited an effective repulsion by the patch when the micropump was active and “depletion zones” (i.e., regions lacking tracer particles) formed around the enzyme spots. The velocities of the tracers and the rates of growth of the depletion zones increased with both increasing the concentration of glucose and increasing the areal density of the enzyme within the enzyme spot (for the range of values tested in our experiments), as intuitively expected for a mechanism driven by the activity of the enzyme micropump. By employing a simple model for a chemically active patch, we have shown that, by accounting solely for diffusiophoresis and drag by osmotic flows, one obtains predictions compatible with the experimentally measured dependencies. In brief, the flow within the cell containing a GOX micropump is most likely a superposition of solutal-buoyancy flows and osmotic flows, and rationalizing the motion of colloidal tracers requires in general to account for both of these flows as well as for the direct diffusiophoretic response of the tracer to the chemical field of the enzyme patch.
The results of this study suggest a number of extensions worth exploring in the future, in addition to the points highlighted at the end of Section 3. For example, the special geometry of the cell can be exploited for a systematic experimental investigation, by using particles of various densities (e.g., silica and mesoporous silica), of the motion of tracers both at the solid–liquid interface and in the bulk, combined with detailed calculations of the bulk and surface driven flows (which, as we hinted, seem feasible, although somewhat technically involved, for this half-space geometry of the current cell). Such investigations would provide a solid foundation for subsequent studies of the changes in the phenomenology upon controlled decreasing of the height of the cell (increasing the geometrical confinement) towards a Hele–Shaw set-up. The role of electro-osmotic and electro-phoretic contributions, owing to the possible presence of ionic species, is also an issue that requires further investigations. In principle, it should be possible to pinpoint electro-osmotic (as well as electro-phoretic) contributions by using tracers that have different surface charges, as done in the study by Farniya et al. [13], as long as significant irreversible adhering of the tracers to the wall can be prevented.
Finally, we note that our results identify two distinct ways to use GOX micropumps as glucose sensors. In addition to the classic way of reporting on the glucose concentration through the speed of the tracer particles, our micropumps, combined with relatively heavy silica tracers, can also report on the glucose concentration through the dimension of the depletion zone they create. It is important to note that the latter parameter is much easier to determine and, together with the small dimension of the micropumps, recommends using such micropumps as glucose sensors in autonomous and miniaturized lab-on-a-chip devices.

Supplementary Materials

The following are available online at https://www.mdpi.com/2410-3896/4/3/73/s1, Video S1: Tracer particles (3 μ m in diameter) moving away from a GOX micropump (≈200 μ m in diameter) that was printed using an ink with 33 g/L GOX and activated using a solution with 1 mM glucose. Note that this video was obtained by joining four subsequent videos separated by a short time interval (needed for saving the previous frames). Video S2: Tracer particles (3 μ m in diameter) moving away from a GOX micropump (≈200 μ m in diameter) that was printed using an ink with 33 g/L GOX and activated using a solution with 1 mM glucose. Note that this video also shows typical tracks subsequently used to calculate average tracer velocities (see main text for details).

Author Contributions

All authors contributed to the conception of the experiments, the acquisition of the data, the analysis and interpretation of the data, and to the writing of the manuscript.

Funding

This research was funded by the Executive Agency for Higher Education, Research, Development and Innovation Funding of Romania (UEFISCDI) grant number PN-III-P4-ID-PCE-2016-0619 (contract No. 113 from 2017).

Conflicts of Interest

The authors declare no conflict of interest.

Abbreviations

The following abbreviations are used in this manuscript:
GOXglucose oxidase
BSAbovine serum albumine
APTES3-aminopropyltriethoxysilane

Appendix A. Spatially-Dependent Number Densities of Reaction Product(s)
The “active” character of the enzyme patch consists in the catalytic conversion of a certain substrate molecular species (reactant, sometime also called “fuel” in the literature on chemically-active pumps or colloids) to product(s) molecules (or pairs of—as required by electrical neutrality of the solution—oppositely charged ions). Since the reaction is spatially localized at the disk-like patch on the wall, the chemical composition of the solution, which in the following is also called “chemical field”, becomes spatially inhomogeneous; accordingly, diffusion and advection currents are induced in the volume, and the solution (i.e., the mixture of solvent, reactant, and products species) is driven out of equilibrium.
The model active pump that we consider is defined as follows. The chemical field is determined from the continuity equations obeyed by each reactant and product species by including a “source/sink” term at the patch, which accounts for the enzymatic reaction. When the volume of solution is large and the substrate species is (are) present in abundance, as in the case of the present experiments, the “bulk” of the solution acts effectively as a reservoir of chemical species, which prescribes constant average values for their densities far from the patch (“at infinity”). Furthermore, we assume that the transport by diffusion of the reactants to the enzyme patch is much faster than their depletion by the catalytic chemical reaction, i.e., we assume “reaction-limited” kinetics.
In what concerns the reaction product species, we assume that their number densities are sufficiently small at all times (at the time scales relevant to the experiment) such that the mixture behaves as a dilute, ideal solution; the product species will thus be treated as an ideal gas. (Accordingly, any eventual dependence of the reaction rate on the concentrations of the products, e.g., “poisoning” of the catalyst, is neglected here.) For reasons of simplicity, we further assume that the reaction products are electrically neutral and also disregard any equilibrium dissociation within the volume of the solution (i.e., we neglect the weak dissociation of the gluconic acid). The rationale for this assumption is that, in what concerns the phoretic or osmotic effects, which are the focus of this work, accounting for charged species leads basically only to a redefinition of the corresponding mobility coefficient (which will then include a term proportional with the differences in diffusion constants, accounting for local charge separation) [23].
The experimental observations of small velocities for the tracers (and, implicitly, for the hydrodynamic flow), both in this work and in the previously published studies of enzymatic pumps [2,4,8], while the diffusion of the molecularly-sized reactant and product species is expected to be fast, implies that the transport of the species by diffusion can be expected to dominate over the one by advection (i.e., the Pe number is expected to be very small). Accordingly, as usually done in the context of chemically active particles (see, e.g., [29,30,31,32,33]), we neglect the advection terms in the continuity equations for the product. This is a major simplification because it effectively decouples the equations governing the chemical field from the hydrodynamics of the solution (but not vice versa).
Finally, the “ideal-gas-like” assumption means that the distribution of each species is unaffected by the presence of the others; consequently, it is sufficient to consider the simpler case of just one product species, which we denote as “A”. If it turns out to be necessary to account for multiple species, which would reduce to simply adding similar expressions for each species and redefining, in the end, the phoretic or osmotic mobilities as weighted sums of the corresponding single-species ones (as noted and discussed in, e.g., [23,29,30,31], and as done here in Section 3).
Under the assumptions above, the “chemical field” is represented by the number density c ( s , t ) of a product species A (where s : = r + z e z denotes the three-dimensional position vector, with r its projection in the z = 0 plane, see the inset in Figure A1a). Owing to the fast diffusion, this relaxes quickly towards a quasi-steady state distribution c ( s ) , which is determined as the solution of the Laplace equation
2 c ( s ) = 0 ,
subject to the boundary conditions at infinity (bulk solution)
c ( | s | ) = 0 ,
and on the wall (located at z = 0 ) that contains the chemically active patch of radius R and negligible thickness (see Figure 5)
{ n · [ D c ( s ) ] } z = 0 = Q I ( r ) .
(In writing Equation (A2a) as “at infinity”, we have exploited the particular geometry of our cell, which has very large lateral and vertical dimensions ( L / R 50 , H / R 20 ), in order to approximate the solution as effectively occupying the half-space z > 0 . It is also assumed that no product species were present in the solution before the reaction at the enzyme patch turned on.) In Equation (A2b), D denotes the diffusion constant of the product A species, n = e z is the inner normal (into the fluid) of the wall, while
I ( r ) = 1 , r R , 0 , r > R ,
is the in-plane indicator step function (unity at the patch, vanishing outside the patch). Equation (A2b) accounts for the chemical reaction at the enzyme patch (the domain r R ), which releases A molecules in the solution, by imposing at the patch a diffusion current along the normal direction into the solution (the left hand side of Equation (A2b) which is given by the rate Q of the chemical reaction at the patch (the source of A molecules). Under the assumptions of the model, Q is constant in time; for simplicity, we further assume that it is spatially constant over the area occupied by the patch. In other words, we disregard the eventual inhomogeneous distribution of immobilized enzymes within the patch (such inhomogeneities, in the form of rings, can be inferred from the images of the patch, see Figure 1 and Figure 3). Additionally, the small thickness of the patch is also neglected. While such details are important for a quantitative analysis of the pumping, or for rationalizing the motion of a small number of tracers “trapped” in the central zone of the enzyme patch (see Figure 1, Figure 3, and the videos in the Supplementary Materials), the main qualitative features of the behavior of the tracers outside the enzymatic patch are determined by the fact that the patch is a net source, with in-plane radial symmetry, of product species A. Accordingly, as long as the concentration of the substrate is below the saturation level of the Michaelis–Menten reaction kinetics of the enzyme, we assume Q ( c s u b s t × σ e n z × K ), where c s u b s t denotes the number density of the substrate (assumed to be everywhere constant), σ e n z is the average number of enzymes per unit area within the patch, and K is an intrinsic (per enzyme) reaction rate (i.e., number of molecules of species A released, per unit time, in the solution by the catalytic reaction at a single enzyme molecule).
The solution of the boundary-value problem in Equations (A1) and (A2) can be conveniently written in terms of the Bessel functions of the first kind J 0 ( x ) [34] (Ch. 3.2.3 - 4); for the disk “source” function given by Equation (A3), this renders
c ( r , z ) = C 0 0 d ξ 0 1 d ω ω J 0 ( ω ξ ) e ξ z J 0 ( ξ r ) ,
with r = r / R , z = z / R , and
C 0 : = Q R D
a characteristic number density. Note that, by its definition, C 0 inherits from Q the linear proportionality with c s u b s t and σ e n z . The integral within the square brackets in Equation (A4) can be calculated exactly,
0 1 d ω ω J 0 ( ω ξ ) = 1 ξ J 1 ( ξ ) ,
which, upon plugging back into Equation (A4), renders the expression of the density of product species A, Equation (2), in the main text.
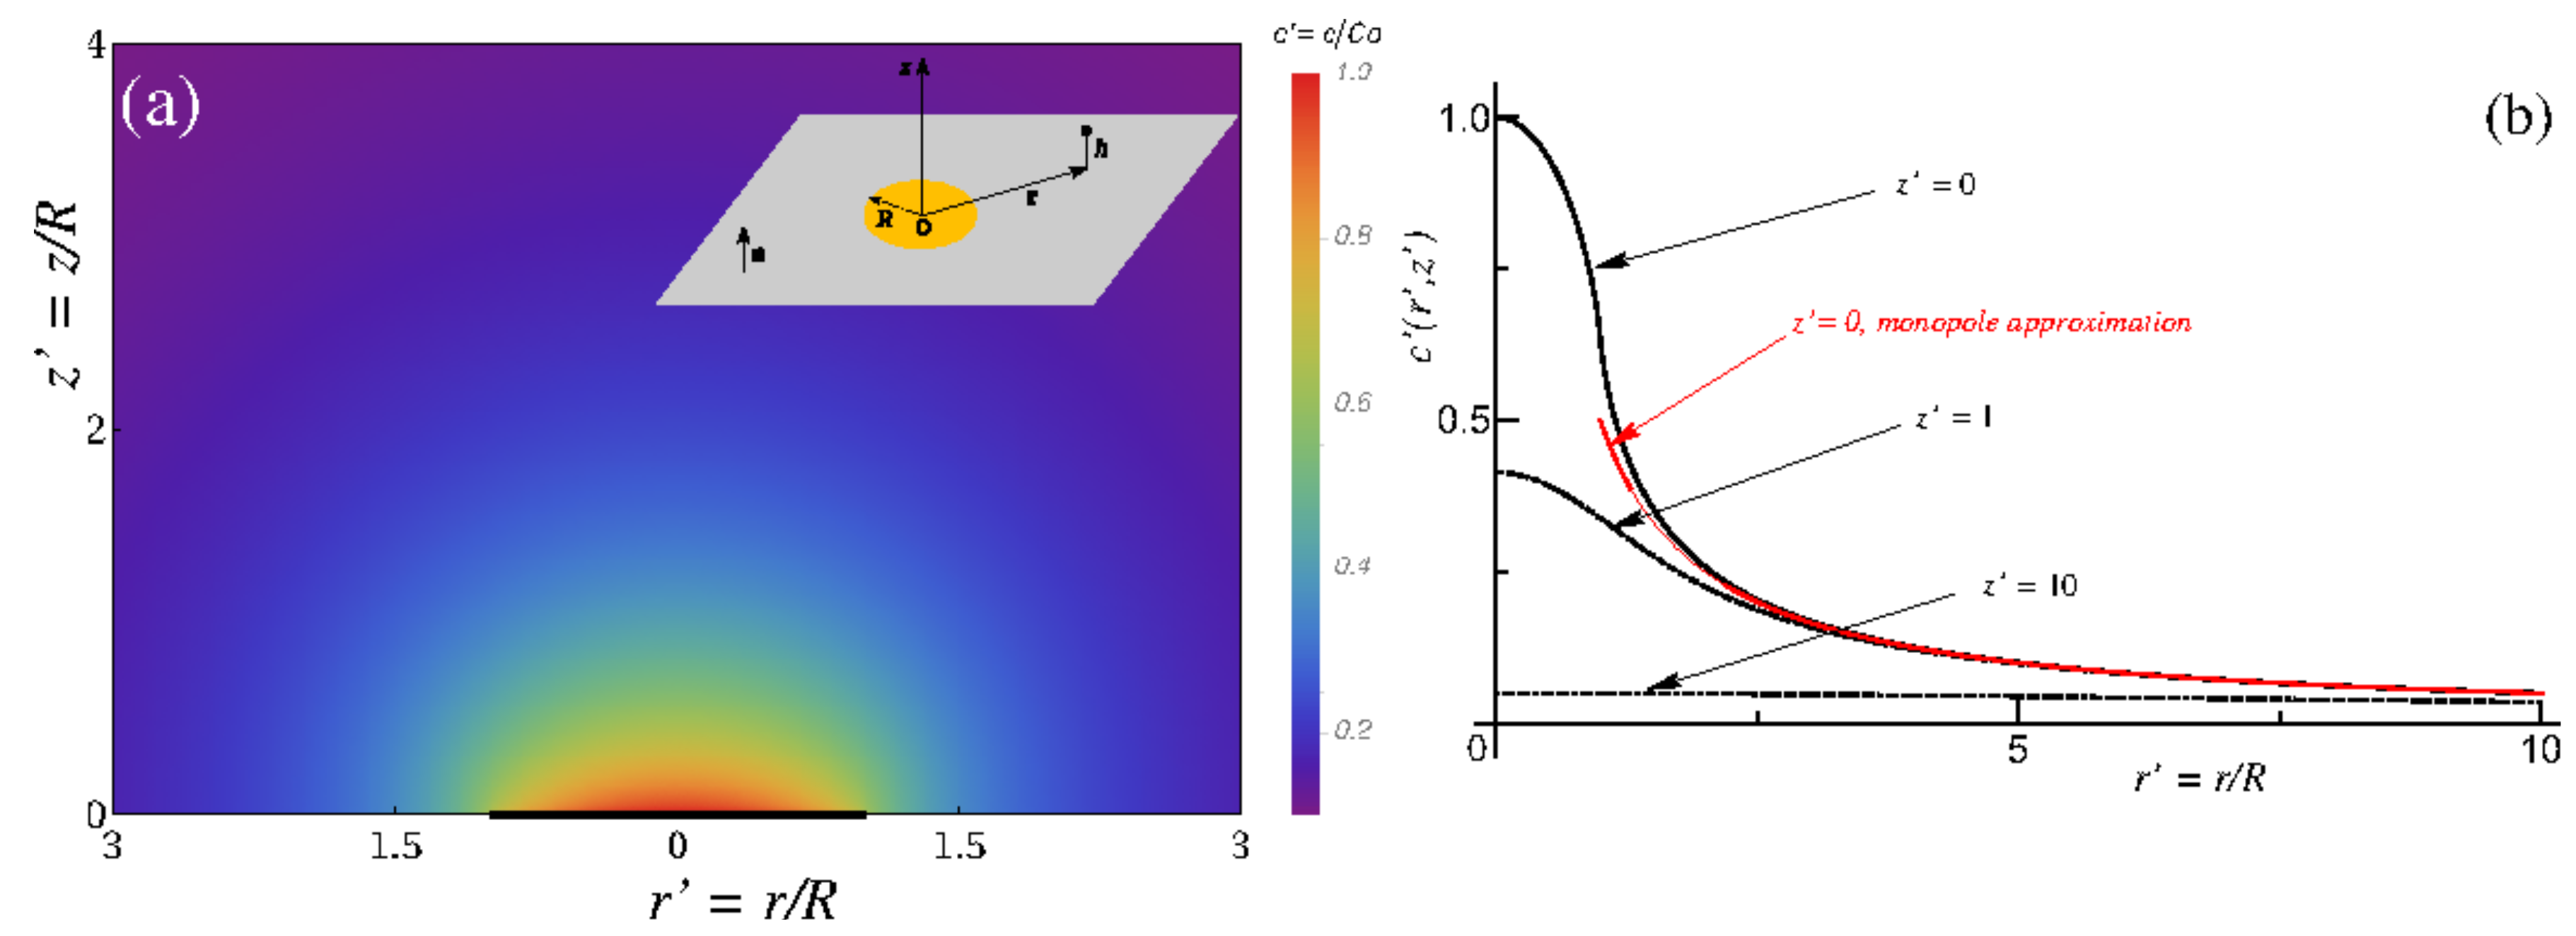
The result above for the number density distribution of product species A is illustrated in Figure A1a, and the in-plane radial number density distributions c ( r ; z 0 ) : = c ( r ; z 0 ) / C 0 at various heights z 0 = z 0 / R above the surface are detailed in Figure A1b. It can be inferred that the variations of the density are significant near the enzyme patch (the black segment at z = 0 in Figure A1a). As shown in Figure A1b, at z = 10 , the radial density is small and basically flat as a function of the radial distance; furthermore, at any height z , the variations in the radial density at distances r 10 become very small, too. These provide the a posteriori justification for the approximation of the geometry of our cell with that of a half-space.
Figure A1. (a) Color coded density of product distribution c ( r , z ) : = c ( r , z ) / C 0 (Equation (A4)) in a vertical half-plane z > 0 passing through a diameter (the black segment at z = 0 ) of the active patch located in the plane z = 0 . The inset shows the schematic depiction (not to scale) of the model system and the system of coordinates. (b) In-plane radial number density distributions c ( r ; z 0 ) : = c ( r ; z 0 ) / C 0 at various heights z 0 = z 0 / R above the surface. The red curve shows the far-field monopole approximation for the radial density (Equation (A7)), evaluated in the plane z = 0 .
Condensedmatter 04 00073 g0a1
At large distances from the active patch, i.e., for | s | R , one can approximate the field c ( r , z ) with that produced by a point source (monopole) of amplitude π R 2 Q located at the origin. This leads to the far-field approximation
c ( s ) 2 π R 2 Q 4 π D s = C 0 2 s ,
where s : = s / R and the factor 2 accounts for the image monopole imposed by the no-flux boundary condition at the wall for r > 1 (Equation (A2b)). In the plane z = 0 + (i.e., very near, and above, the wall), which is the location of interest for the current work, this leads to the expression c ( r 1 , z = 0 + ) C 0 / ( 2 r ) , which is shown in Figure A1b by the red curve. It turns out that, as in other cases reported in the literature (see, e.g., [32]), this expression actually provides an excellent approximation for the exact distribution c ( r , z = 0 + ) not only for r 1 , but also down to small distances (basically down to r = 1 , i.e., the edge of the active patch).
Finally, as noted above, under the assumption of the products behaving as an ideal gas, it is obvious that in the case of a reaction in which several product species A, B, C, etc. emerge the number densities of each of these k species will be given by the same expression in Equation (2) but multiplied by the ratio D / D k of the diffusion constants (and, eventually, by a factor accounting for the stoichiometry of the reaction).

References

  1. Hartmeier, W. Immobilized Biocatalysts: An Introduction; Springer: New York, NY, USA, 1988. [Google Scholar]
  2. Sengupta, S.; Patra, D.; Ortiz-Rivera, I.; Agrawal, A.; Shklyaev, S.; Dey, K.K.; Córdova-Figueroa, U.; Mallouk, T.E.; Sen, A. Self-powered enzyme micropumps. Nat. Chem. 2014, 6, 415. [Google Scholar] [CrossRef] [PubMed]
  3. Das, S.; Shklyaev, O.E.; Altemose, A.; Shum, H.; Ortiz-Rivera, I.; Valdez, L.; Mallouk, T.E.; Balazs, A.C.; Sen, A. Harnessing catalytic pumps for directional delivery of microparticles in microchambers. Nat. Commun. 2017, 8, 14384. [Google Scholar] [CrossRef] [PubMed]
  4. Alarcón-Correa, M.; Günther, J.P.; Troll, J.; Kadiri, V.M.; Bill, J.; Fischer, P.; Rothenstein, D. Self-assembled phage-based colloids for high localized enzymatic activity. ACS Nano 2019, 13, 5810. [Google Scholar] [CrossRef] [PubMed]
  5. Zhang, Y.; Tsitkov, S.; Hess, H. Complex dynamics in a two-enzyme reaction network with substrate competition. Nat. Catal. 2018, 1, 276. [Google Scholar] [CrossRef]
  6. Ortiz-Rivera, I.; Courtney, T.M.; Sen, A. Enzyme micropump-based inhibitor assays. Adv. Funct. Mater. 2016, 26, 2135. [Google Scholar] [CrossRef]
  7. Zhao, X.; Gentile, K.; Mohajerani, F.; Sen, A. Powering motion with enzymes. Acc. Chem. Res. 2018, 51, 2373. [Google Scholar] [CrossRef] [PubMed]
  8. Maiti, S.; Shklyaev, O.E.; Balazs, A.C.; Sen, A. Self-organization of fluids in a multienzymatic pump system. Langmuir 2019, 35, 3724. [Google Scholar] [CrossRef] [PubMed]
  9. Sengupta, S.; Spiering, M.M.; Dey, K.K.; Duan, W.; Patra, D.; Butler, P.J.; Astumian, R.D.; Benkovic, S.J.; Sen, A. DNA polymerase as a molecular motor and pump. ACS Nano 2014, 8, 2410. [Google Scholar] [CrossRef]
  10. Valdez, L.; Shum, H.; Ortiz-Rivera, I.; Balazs, A.C.; Sen, A. Solutal and thermal buoyancy effects in self-powered phosphatase micropumps. Soft Matter 2017, 13, 2800. [Google Scholar] [CrossRef]
  11. Ortiz-Rivera, I.; Shum, H.; Agrawal, A.; Sen, A.; Balazs, A.C. Convective flow reversal in self-powered enzyme micropumps. Proc. Natl. Acad. Sci. USA 2016, 113, 2585. [Google Scholar] [CrossRef]
  12. Kline, T.R.; Paxton, W.F.; Wang, Y.; Velegol, D.; Mallouk, T.E.; Sen, A. Catalytic micropumps: Microscopic convective fluid flow and pattern formation. J. Am. Chem. Soc. 2005, 127, 17150. [Google Scholar] [CrossRef] [PubMed]
  13. Farniya, A.A.; Esplandiu, M.J.; Reguera, D.; Bachtold, A. Imaging the proton concentration and mapping the spatial distribution of the electric field of catalytic micropumps. Phys. Rev. Lett. 2013, 111, 168301. [Google Scholar] [CrossRef] [PubMed]
  14. Esplandiu, M.J.; Zhang, K.; Fraxedas, J.; Sepulveda, B.; Reguera, D. Unraveling the operational mechanisms of chemically propelled motors with micropumps. Acc. Chem. Res. 2018, 51, 1921. [Google Scholar] [CrossRef] [PubMed]
  15. Niu, R.; Kreissl, P.; Brown, A.T.; Rempfer, G.; Botin, D.; Holm, C.; Palberg, T.; de Graaf, J. Microfluidic pumping by micromolar salt concentrations. Soft Matter 2017, 13, 1505. [Google Scholar] [CrossRef] [PubMed]
  16. Niu, R.; Oğuz, E.C.; Müller, H.; Reinmüller, A.; Botin, D.; Löwen, H.; Palberg, T. Controlled assembly of single colloidal crystals using electro-osmotic micro-pumps. Phys. Chem. Chem. Phys. 2017, 19, 3104. [Google Scholar] [CrossRef] [PubMed]
  17. Wilson, R.; Turner, A.P.F. Glucose oxidase: an ideal enzyme. Biosens. Bioelectron. 1992, 7, 165. [Google Scholar] [CrossRef]
  18. Pons, A.J.; Sagués, F.; Bees, M.A.; Sørensen, P.G. Pattern formation in the methylene-blue-glucose system. J. Phys. Chem. B 2000, 104, 2251. [Google Scholar] [CrossRef]
  19. Pons, A.J.; Sagués, F.; Bees, M.A.; Sørensen, P.G. Quantitative analysis of chemoconvection patterns in the methylene-blue-glucose system. J. Phys. Chem. B 2002, 106, 7252. [Google Scholar] [CrossRef]
  20. Purcell, E. Life at low Reynolds number. Am. J. Phys. 1977, 45, 3. [Google Scholar] [CrossRef]
  21. Lauga, E.; Powers, T.R. The hydrodynamics of swimming microorganisms. Rep. Prog. Phys. 2009, 72, 096601. [Google Scholar] [CrossRef]
  22. Derjaguin, B.; Sidorenkov, G.; Zubashchenkov, E.; Kiseleva, E. Kinetic phenomena in boundary films of liquids. Kolloidn. Zh. 1947, 9, 335. [Google Scholar]
  23. Anderson, J. Colloid transport by interfacial forces. Ann. Rev. Fluid Mech. 1989, 21, 61. [Google Scholar] [CrossRef]
  24. Keh, H.J.; Anderson, J.L. Boundary effects on electrophoretic motion of colloidal spheres. J. Fluid Mech. 1985, 153, 417. [Google Scholar] [CrossRef]
  25. Keh, H.J.; Chen, S.B. Electrophoresis of a colloidal sphere parallel to a dielectric plane. J. Fluid Mech. 1988, 194, 377. [Google Scholar] [CrossRef]
  26. Merkel, T.C.; Bondar, V.I.; Nagai, K.; Freeman, B.D.; Pinnau, I. Gas sorption, diffusion, and permeation in poly(dimethylsiloxane). J. Polymer Sci. B 2000, 38, 415. [Google Scholar] [CrossRef]
  27. Markov, D.A.; Lillie, E.M.; Garbett, S.P.; McCawley, L.J. Variation in diffusion of gases through PDMS due to plasma surface treatment and storage conditions. Biomed. Microdev. 2014, 16, 91. [Google Scholar] [CrossRef] [PubMed]
  28. de Chaumont, F.; Dallongeville, S.; Chenouard, N.; Hervé, N.; Pop, S.; Provoost, T.; Meas-Yedid, V.; Pankajakshan, P.; Lecomte, T.; Le Montagner, Y. Icy: An open bioimage informatics platform for extended reproducible research. Nat. Methods 2012, 9, 690. [Google Scholar] [CrossRef]
  29. Golestanian, R.; Liverpool, T.B.; Ajdari, A. Designing phoretic micro- and nano-swimmers. New J. Phys. 2007, 9, 126. [Google Scholar] [CrossRef]
  30. Oshanin, G.; Popescu, M.N.; Dietrich, S. Active colloids in the context of chemical kinetics. J. Phys. A 2017, 50, 134001. [Google Scholar] [CrossRef] [Green Version]
  31. Kapral, R. Nanomotors without moving parts that propel themselves in solution. J. Chem. Phys. 2013, 138, 202901. [Google Scholar] [CrossRef]
  32. Domínguez, A.; Malgaretti, P.; Popescu, M.N.; Dietrich, S. Effective interaction between active colloids and fluid interfaces induced by Marangoni flows. Phys. Rev. Lett. 2016, 116, 078301. [Google Scholar] [CrossRef] [PubMed]
  33. Moran, J.L.; Posner, J.D. Phoretic self-propulsion. Ann. Rev. Fluid Mech. 2016, 49, 511. [Google Scholar] [CrossRef]
  34. Sneddon, I. Mixed Boundary Value Problems in Potential Theory; North-Holland: Amsterdam, The Netherlands, 1966. [Google Scholar]
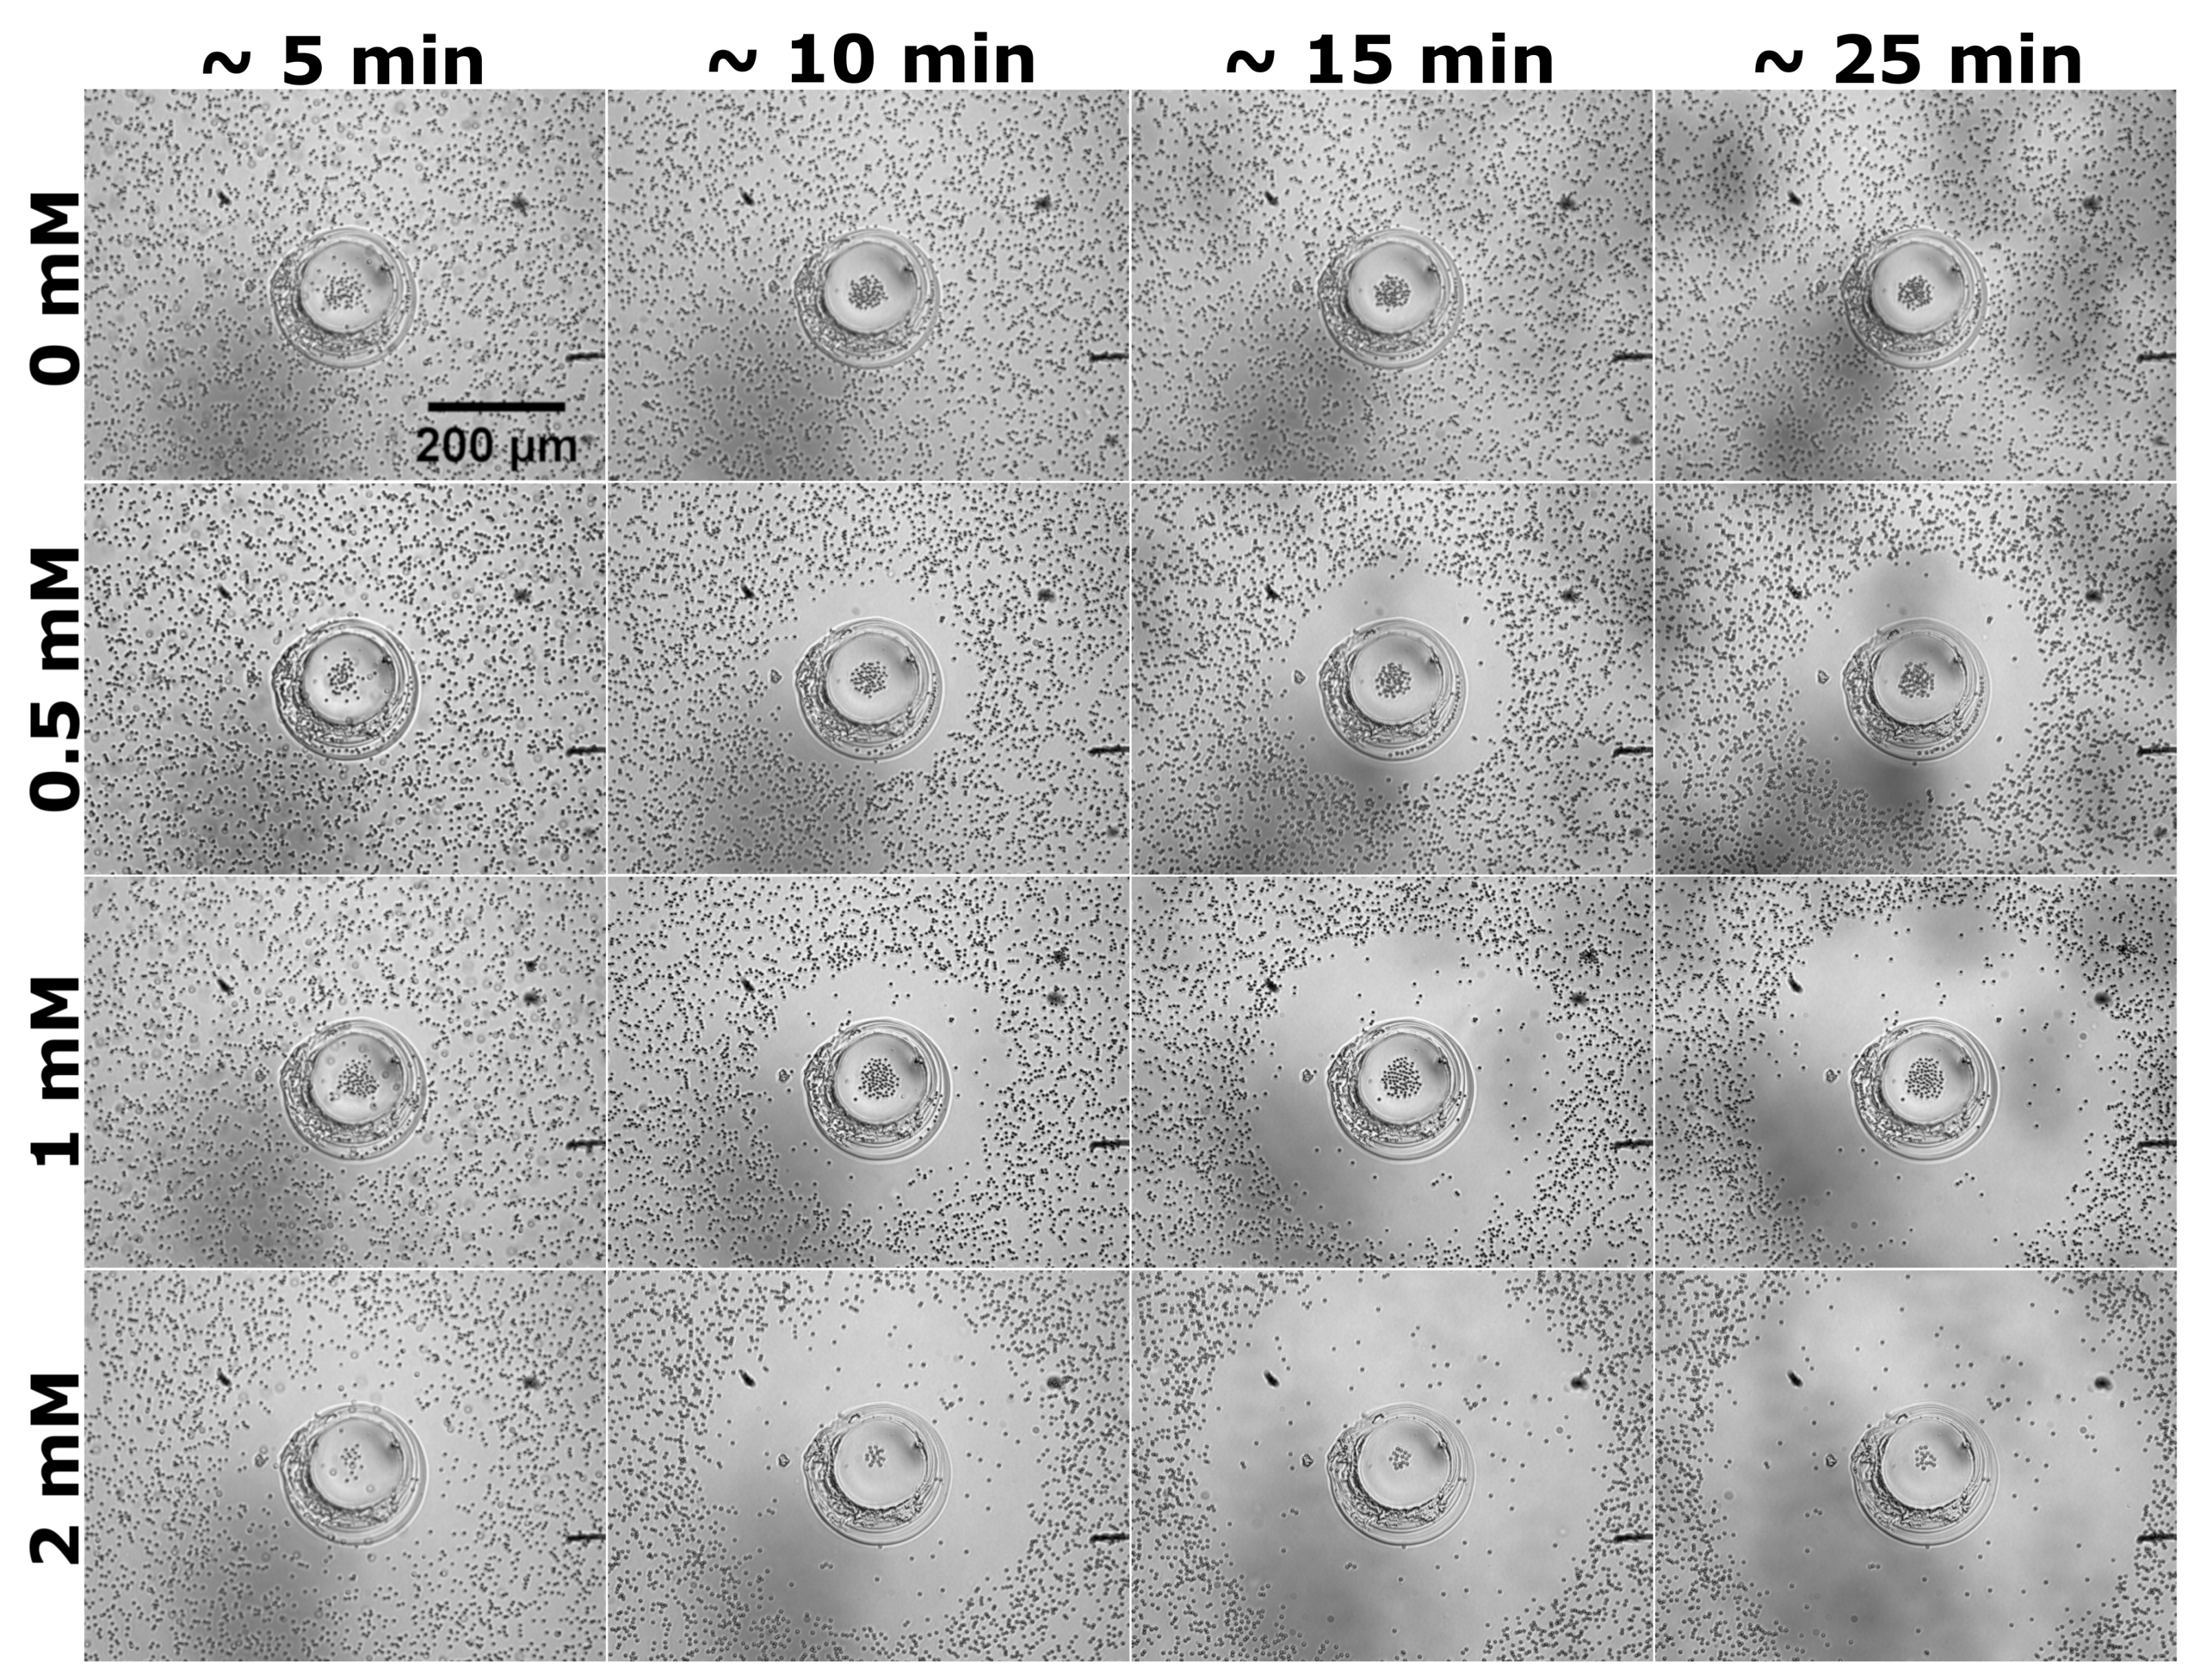
Figure 1. Snapshots showing the emergence and time development of a region depleted of tracers around a GOX patch (located in the center of the panels). In the absence of glucose, i.e., when the pump is inactive, the tracers remain uniformly distributed around the patch (top row). In the presence of glucose, the linear extent of the depletion zone depends on the glucose (substrate) concentration (compare top to bottom rows). The micropump was prepared using a solution with GOX concentration of 33.3 g/L. The time was measured from the beginning of the recording, which started within 2–3 min from the addition of the solution containing glucose and the tracers into the experimental cell.
Condensedmatter 04 00073 g001
Figure 2. (a) Velocity of tracer particles as a function of the distance from the edge of the GOX patch; and (b) dimensionless extent of the depletion zone, Δ : = ( R d R ) / R , as a function of time. Results are shown for glucose concentrations of 0.5 (blue), 1 (red), and 2 mM (green), respectively. The results correspond to experiments employing micropumps prepared by using a solution of GOX concentration of 33.3 g/L. In (a), the symbols and the error bars show the mean and the standard deviation of the corresponding set of measured average velocities (from the distance covered in the time between t 0 = 5 min and t f = 10 min) of particles starting at the distance d from the edge of the GOX patch. The lines in (a,b) correspond to the fit with the theoretically predicted dependence (see Section 3).
Condensedmatter 04 00073 g002
Figure 3. Snapshots showing the emergence and time development (left to right columns) of an in-plane region depleted of tracers around enzyme patches (central region of the panels) made by using solutions with concentrations of GOX of 16.6 g/L, 33.3 g/L, and 50 g/L, respectively.
Condensedmatter 04 00073 g003
Figure 4. (a) Average velocity of tracer particles (see the main text) as a function of the GOX content of the printing solutions; and (b) dimensionless extent of the depletion zone, Δ : = ( R d R ) / R ), as a function of time, for various GOX concentrations of the printing solution. The glucose concentration was 0.5 mM in all three cases. The error bars in (a) show the standard deviations corresponding to the set of velocities of particles located within 20 μ m from the edge of the enzyme patch. The lines in (b) show the corresponding results of fitting with the theoretically predicted time dependence (see Section 3).
Condensedmatter 04 00073 g004
Figure 5. (a) Schematic depiction (not to scale) of the model system. A planar wall (the plane z = 0 ) contains a chemically active patch (the orange disk of radius R) of negligible thickness. The mixture (solvent, reactants, and products species) occupies the half-space z > 0 . The black dot depicts a tracer located at height z = h and in plane position vector r . The inner (into the wall) normal unit vector is denoted by n . (b) Color coded (bar scale at the right) in-plane density c ( r ) : = c A ( r , 0 + ) / C 0 and tracer velocity vector field (white arrows) V t r / V 0 = r c A ( r , 0 + ) (Equations (5) and (6), with V 0 < 0 ).
Condensedmatter 04 00073 g005
Figure 6. The steps of image analysis (clockwise, from top left) for estimating the radial extent of the depletion zone.
Condensedmatter 04 00073 g006
Figure 7. Dimensionless extent of the depletion zone, Δ : = ( R d R ) / R , as a function of time. Results are shown for glucose concentrations of 0.5 (blue), 1 (red), and 2 mM (green), respectively, in three independent experiments (star, circle, and square symbols), each involving a different enzyme pump prepared by using a solution of GOX concentration of 33.3 g/L.
Condensedmatter 04 00073 g007
Table 1. Enzyme micropumps developed and investigated to date (listed in chronological order). In all studies summarized here, the proposed mechanism was that of density-driven bulk flow.
EnzymeDimensionsTracer ParticleFlow (Close to Bottom Wall)Location of ObservationsProposed Mechanism for Mass Density VariationsRef.
Catalase, Lipase, Glucose oxidase6 mm diameter disk (in a 20 mm diameter × 1.3 mm height cell)2 μ m diameter, negatively charged polystyreneInward (towards the enzyme patch)50–100 μ m away from the pump, height: N/AExothermic reaction or solutal buoyancy[2]
Urease6 mm diameter disk (in a 20 mm diameter × 1.3 mm height cell)2 μ m diameter, negatively charged polystyreneOutward (away from the enzyme patch)50–100 μ m away from the pump, height: N/ASolutal buoyancy[2]
DNA polymerase6 mm diameter disk (in a 20 mm diameter × 1.3 mm height cell)2 μ m diameter, negatively charged polystyreneInward (towards the enzyme patch)N/ASolutal buoyancy[9]
Urease, Catalase6 mm diameter disk (in a 20 mm diameter × 1.3 mm height cell)2 μ m diameter, negatively charged polystyreneN/AN/AN/A[6]
Urease6 mm diameter disk (in a 20 mm diameter × 1.3 mm height cell)2 μ m diameter, negatively charged polystyreneTemporal and spatial dependent, flow reversal (outward ↔ inward)50 μ m away from the pump, height: N/ASolutal buoyancy[11]
Urease15 mm × 15 mm (in a 20 mm × 20 mm × 1.3 mm cell)2 μ m diameter, negatively charged, fluorescent polystyreneN/A (external substrate gradient)50 μ m and 500  μ m above the enzyme-modified surfaceSolutal buoyancy[3]
Acid phosphatase6 mm diameter disk (in a 20 mm diameter × 1.3 mm height cell)2 μ m diameter, negatively charged polystyreneInward (towards the enzyme patch)0–5 mm away from the pump, height: N/ASolutal buoyancy[10]
Urease1 mm × 1 mm (in a 10 mm × 10 mm × 0.7 mm cell)1 μ m diameter, plain polystyreneOutward (away from the enzyme patch)near the edge of the patch, heights 150 μ m and 550  μ mSolutal buoyancy[4]
Glucose oxidase, Catalase, Acid phosphatase5 mm diameter disk (in a 20 mm diameter × 0.9 mm height cell); patch located near the lateral wall2 μ m diameter, negatively charged polystyreneInward (towards the enzyme patch)1–6 mm away from the enzyme structure, height: 200 μ mSolutal buoyancy[8]