
Correlation Between Structure, Microstructure, and Magnetic Properties of AlCoCrFeNi High-Entropy Alloy

 , , , and
Abstract
1. Introduction
2. Results and Discussion
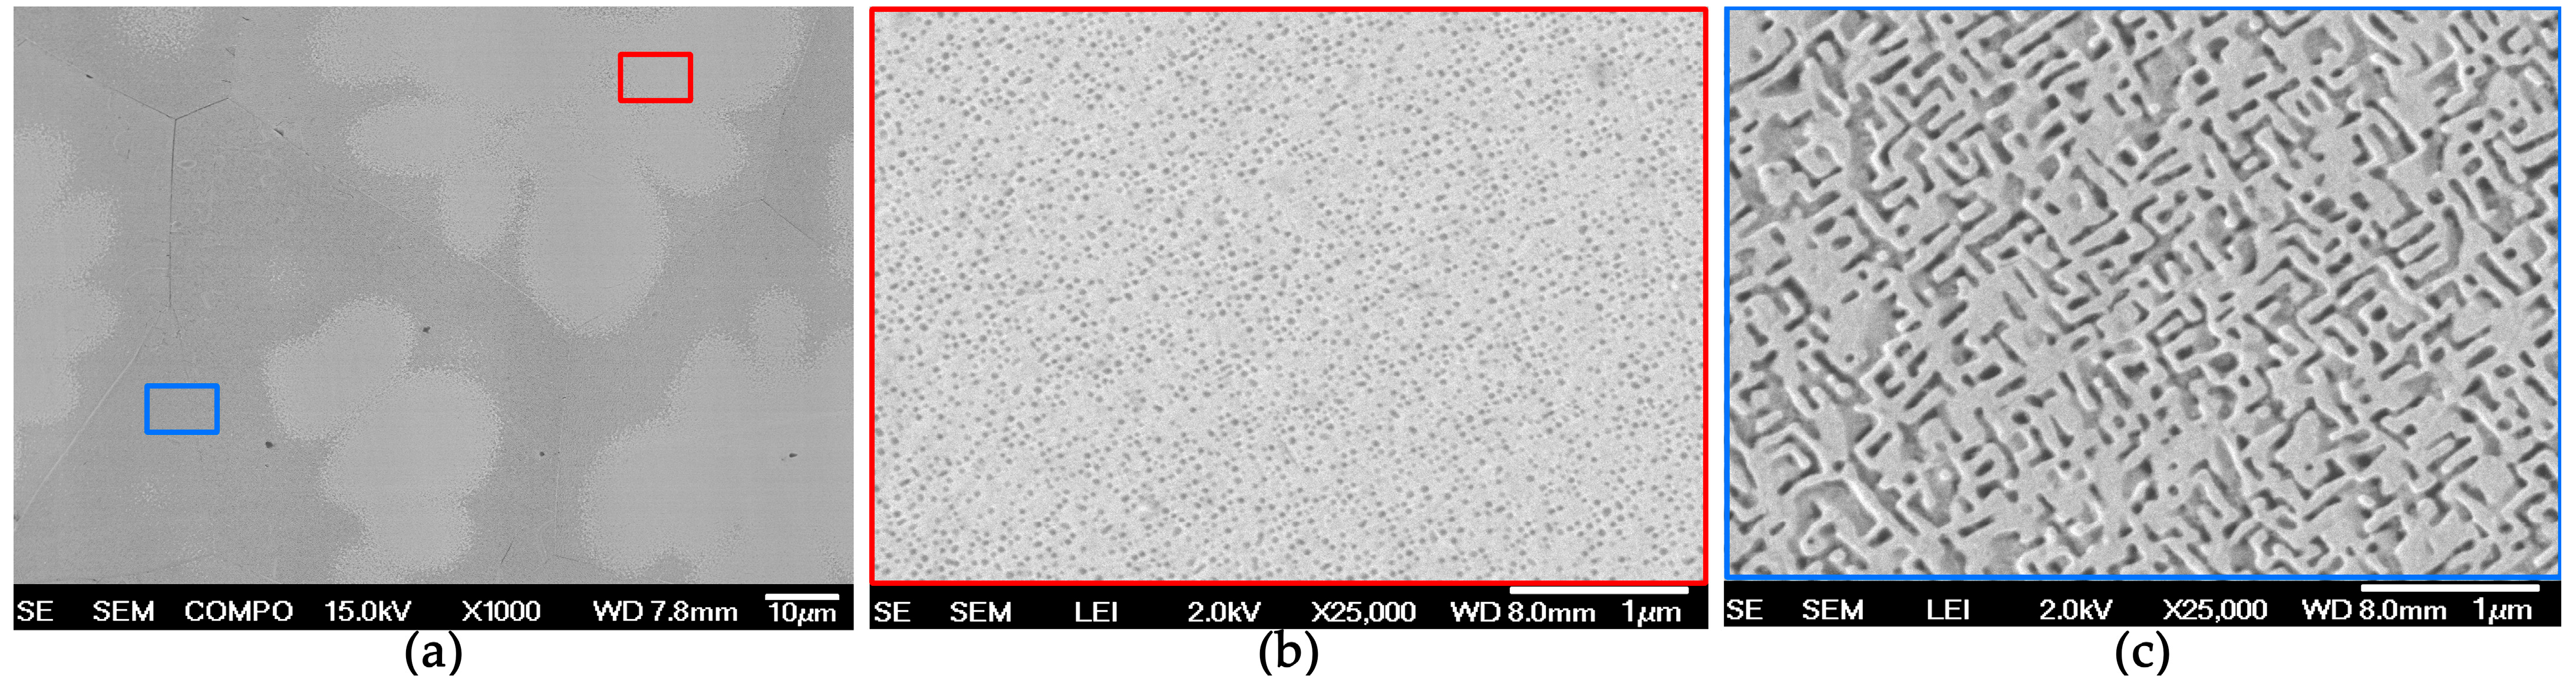
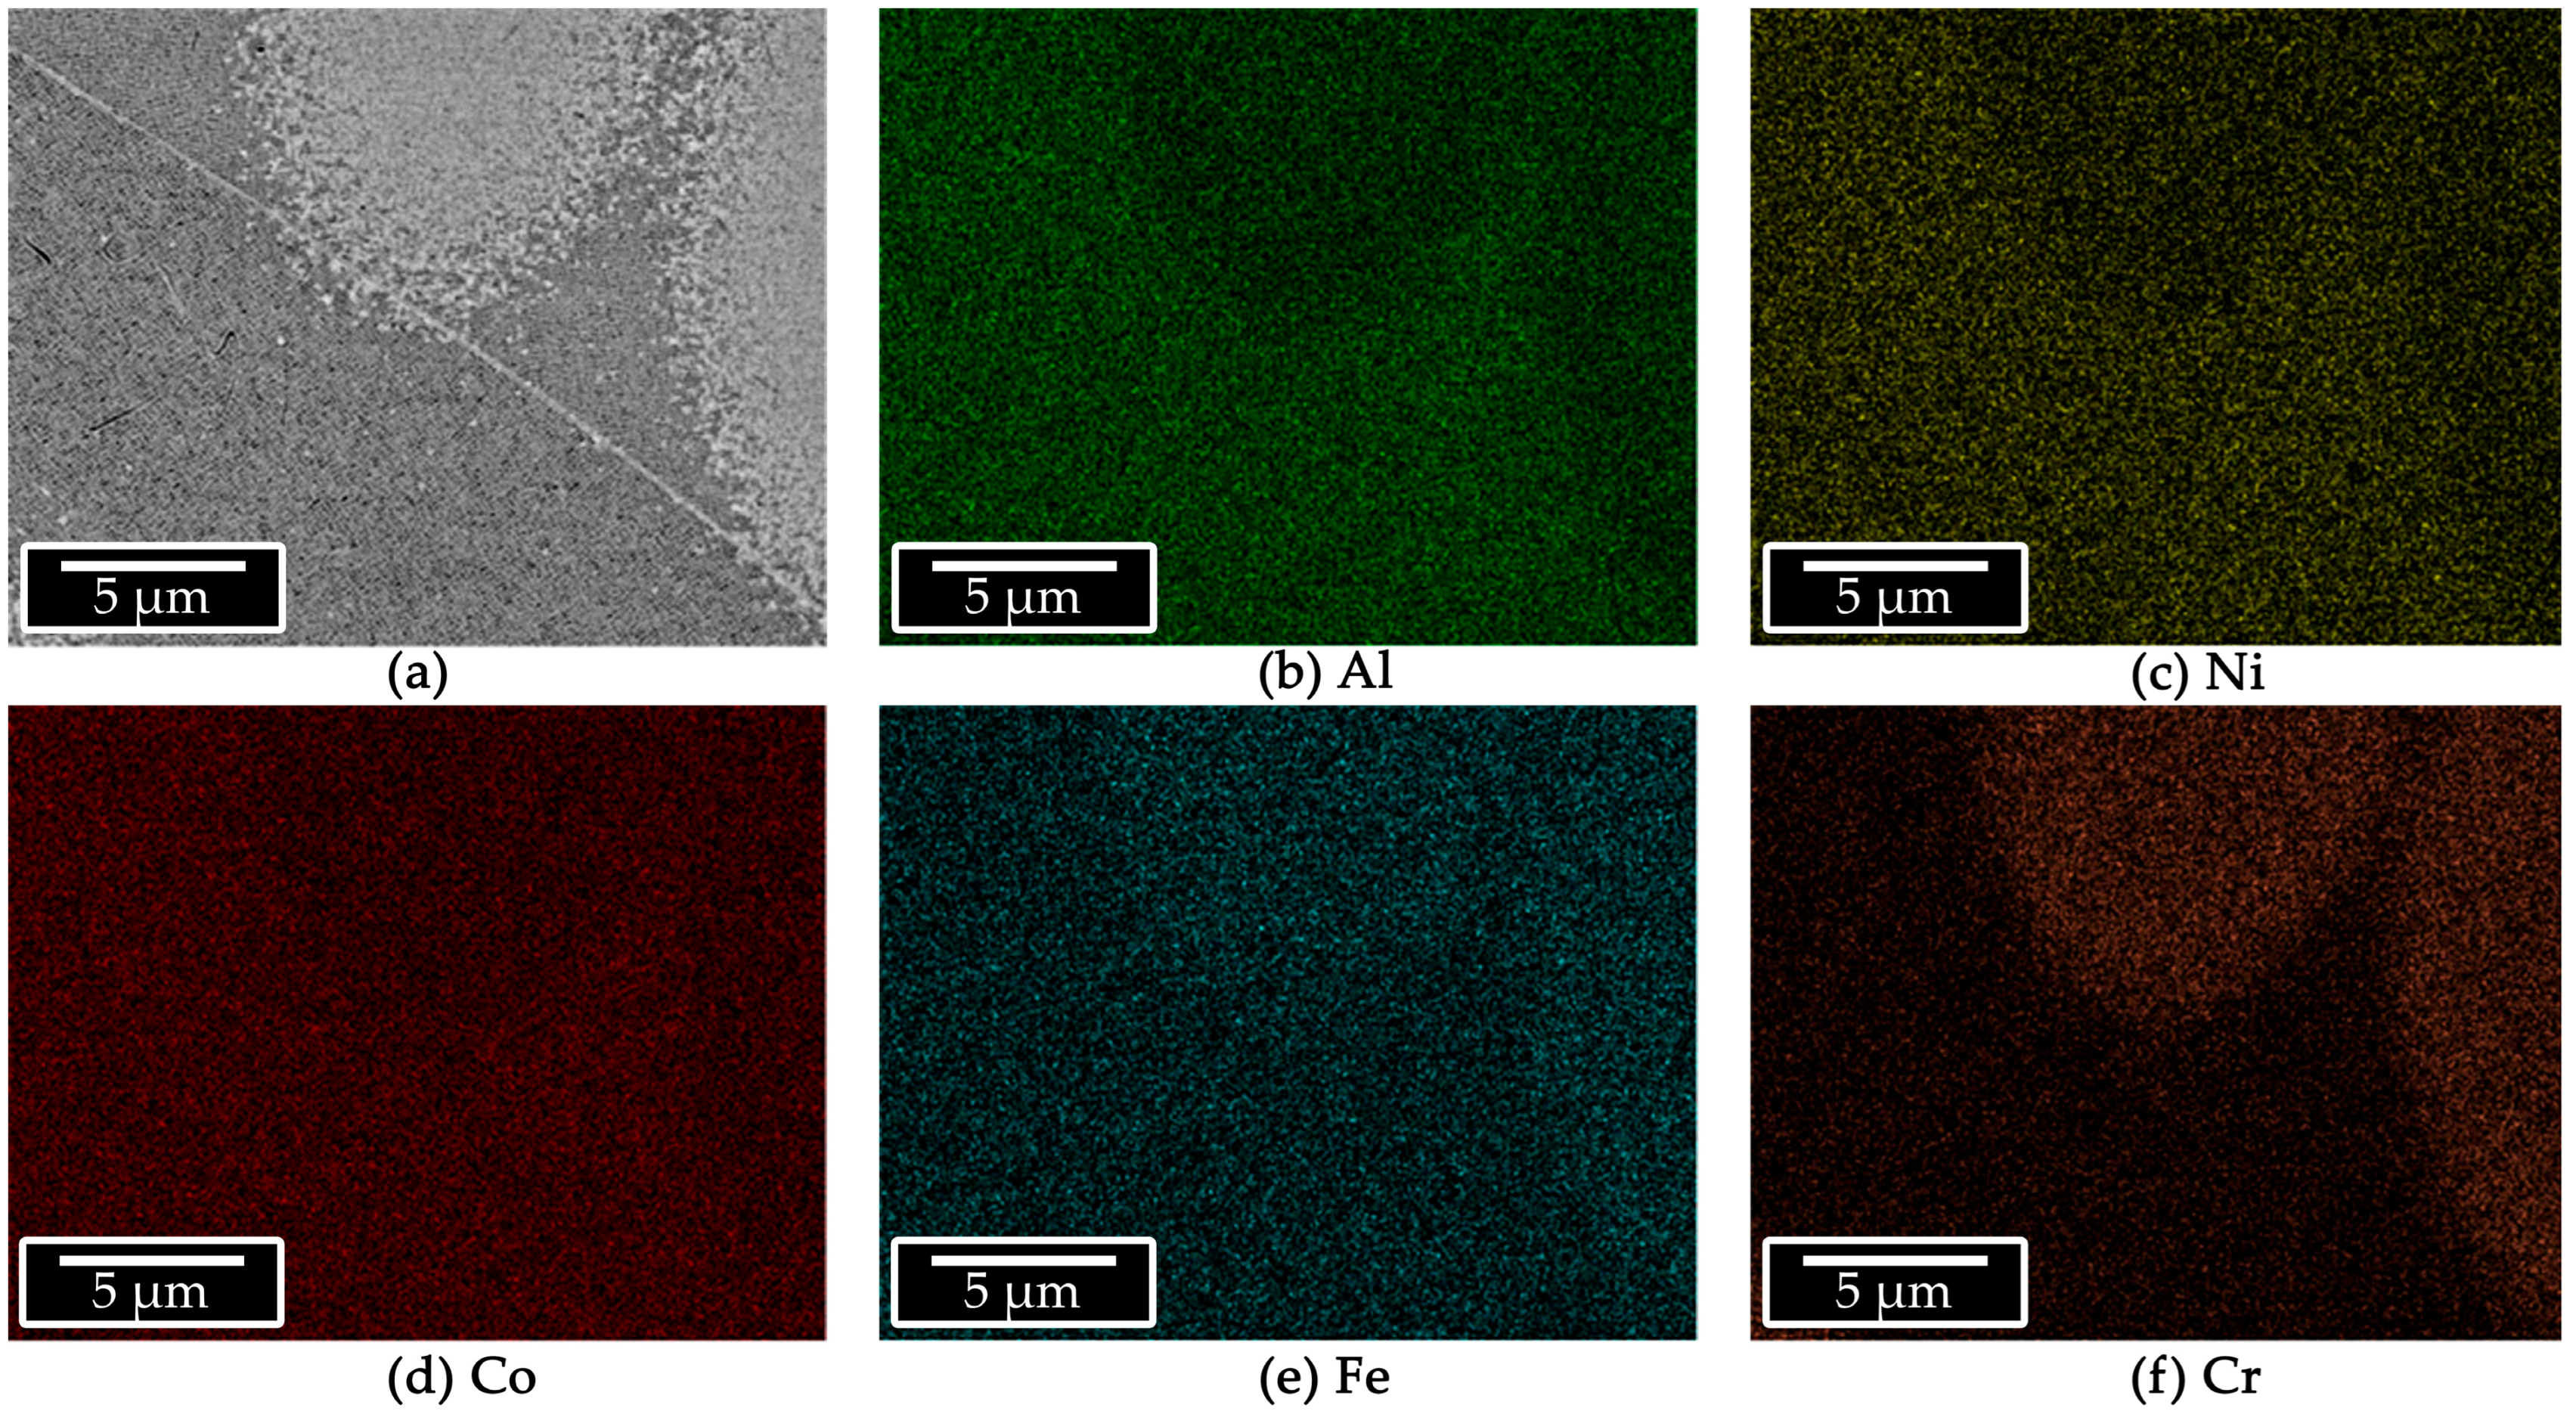
2.1. Microstructure of as Cast Alloy
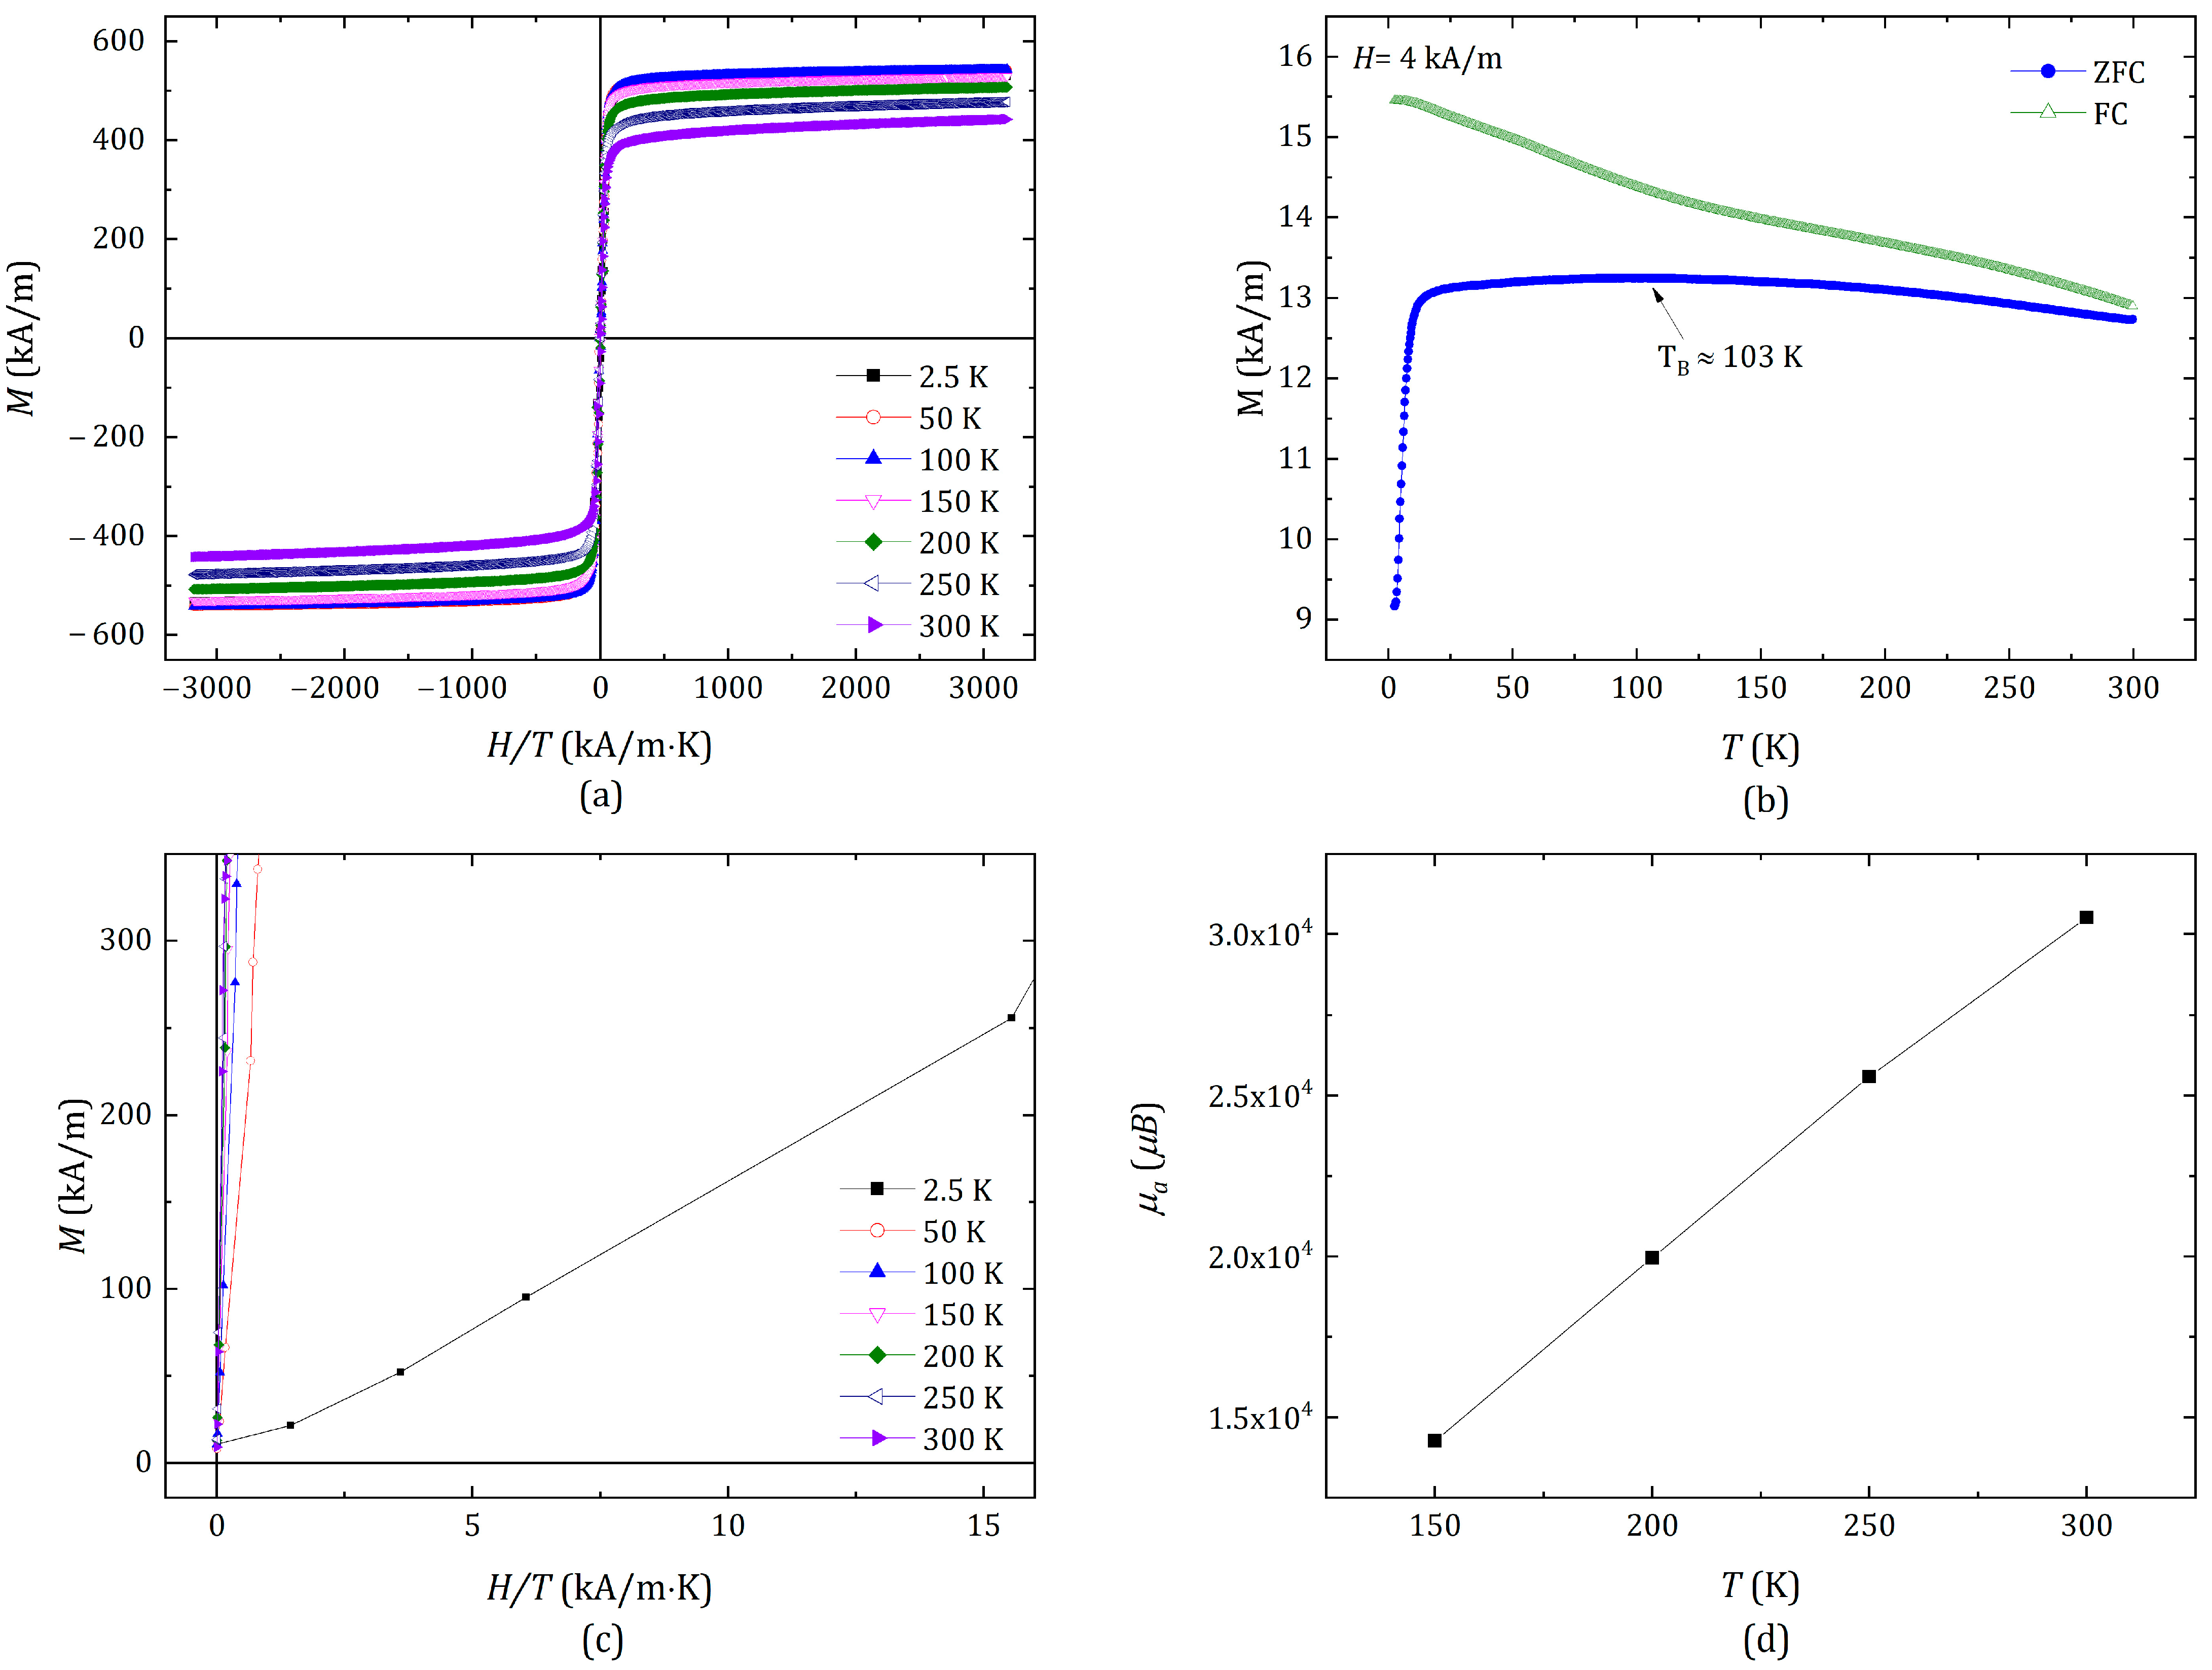
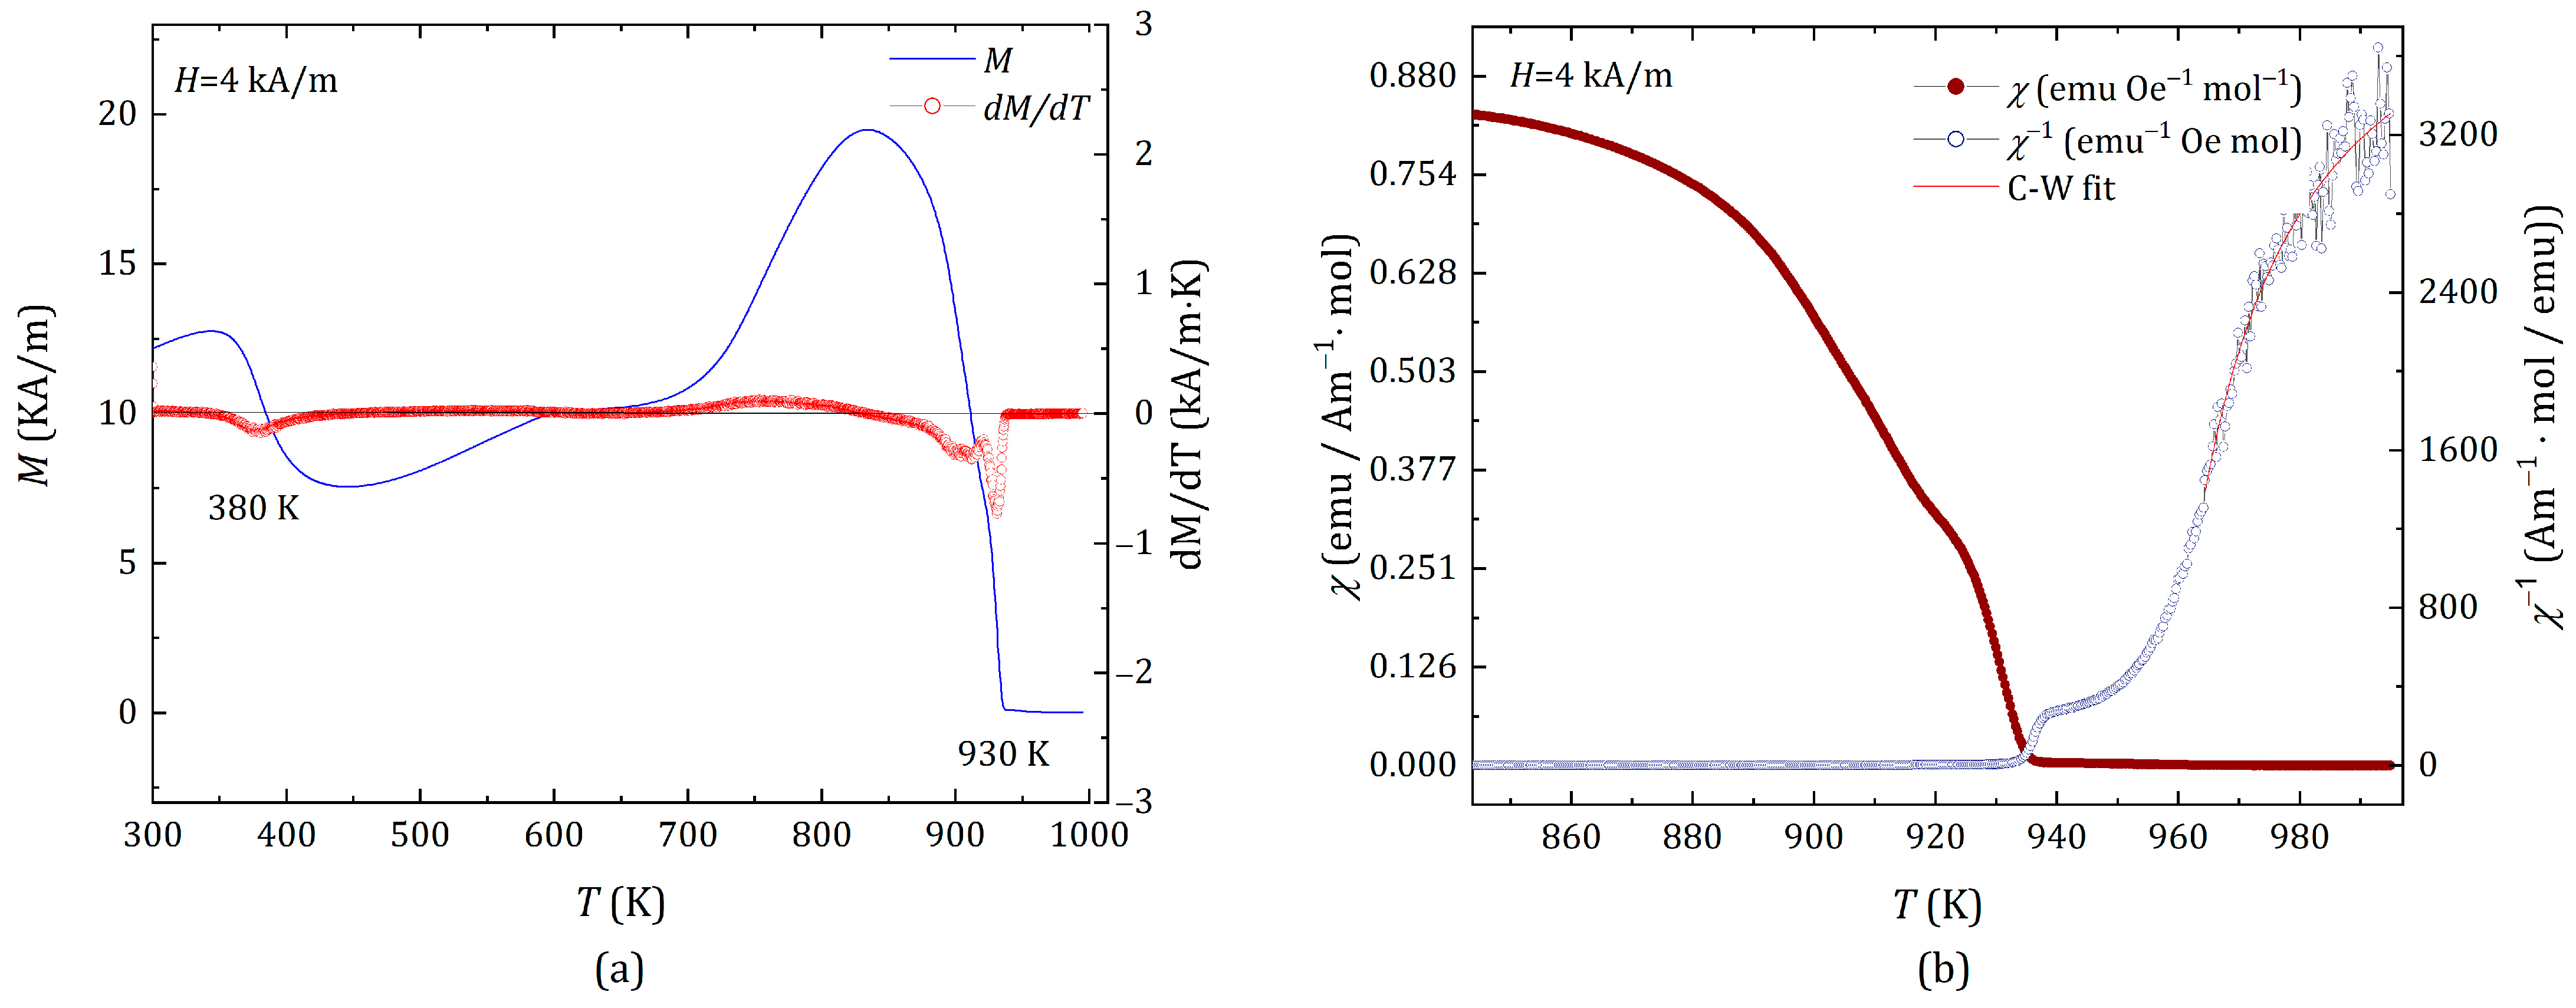
2.2. Magnetic Properties
3. Materials and Methods
4. Conclusions
Author Contributions
Funding
Data Availability Statement
Conflicts of Interest
References
- Zhang, L.; Qian, K.; Schuller, B.W.; Shibuta, Y. Prediction on mechanical properties of non-equiatomic high-entropy alloy by atomistic simulation and machine learning. Metals 2021, 11, 922. [Google Scholar] [CrossRef]
- Tokarewicz, M.; Grądzka-Dahlke, M. Review of recent research on AlCoCrFeNi high-entropy alloy. Metals 2021, 11, 1302. [Google Scholar] [CrossRef]
- Li, W.; Xie, D.; Li, D.; Zhang, Y.; Gao, Y.; Liaw, P.K. Mechanical behavior of high-entropy alloys. Prog. Mater. Sci. 2021, 118, 100777. [Google Scholar] [CrossRef]
- George, E.P.; Curtin, W.A.; Tasan, C.C. High entropy alloys: A focused review of mechanical properties and deformation mechanisms. Acta Mater. 2020, 188, 435–474. [Google Scholar] [CrossRef]
- Liu, L.; Zhang, Y.; Han, J.; Wang, X.; Jiang, W.; Liu, C.T.; Zhang, Z.; Liaw, P.K. Nanoprecipitate-strengthened high-entropy alloys. Adv. Sci. 2021, 8, 2100870. [Google Scholar] [CrossRef]
- Lee, C.-H.; Chin, H.-H.; Zeng, K.-Y.; Chang, Y.-J.; Yeh, A.-C.; Yeh, J.-W.; Lin, S.-J.; Wang, C.-C.; Glatzel, U.; Huang, E.-W. Tailoring Ferrimagnetic Transition Temperatures, Coercivity Fields, and Saturation Magnetization by Modulating Mn Concentration in (CoCrFeNi)1−xMnx High-Entropy Alloys. Front. Mater. 2022, 9, 824285. [Google Scholar] [CrossRef]
- Zhao, C.; Li, J.; Liu, Y.; Wang, W.Y.; Kou, H.; Beaugnon, E.; Wang, J. Tailoring mechanical and magnetic properties of AlCoCrFeNi high-entropy alloy via phase transformation. J. Mater. Sci. Technol. 2021, 73, 83–90. [Google Scholar] [CrossRef]
- Beeson, W.B.; Bista, D.; Zhang, H.; Krylyuk, S.; Davydov, A.V.; Yin, G.; Liu, K. Single-Phase L10-Ordered High Entropy Thin Films with High Magnetic Anisotropy. Adv. Sci. 2024, 11, 2308574. [Google Scholar] [CrossRef]
- Chen, Z.-J.; Zhang, T.; Wu, J.; Yang, X.; Zheng, Y.; Tang, Y.; Yu, H.-B.; Peng, J.; Cheng, H.-M. Optimizing spin arrangement by permeability modulation of high-entropy alloys to promote OO formation for efficient water oxidation. Sci. China Mater. 2024, 67, 598–607. [Google Scholar] [CrossRef]
- Ma, Y.; Kou, Z.; Yang, W.; He, A.; Dong, Y.; Man, Q.; Liu, H.; Li, Z.; Inoue, A.; Li, J. A one-step fabrication of soft-magnetic high entropy alloy fiber with excellent strength and flexibility. Nat. Commun. 2024, 15, 10549. [Google Scholar] [CrossRef]
- Li, X.; Shan, G.; Zhang, J.; Shek, C.-H. Accelerated design for magnetic high entropy alloys using data-driven multi-objective optimization. J. Mater. Chem. C 2022, 10, 17291–17302. [Google Scholar] [CrossRef]
- Huang, S.; Li, W.; Li, X.; Schönecker, S.; Bergqvist, L.; Holmström, E.; Varga, L.K.; Vitos, L. Mechanism of magnetic transition in FeCrCoNi-based high entropy alloys. Mater. Des. 2016, 103, 71–74. [Google Scholar] [CrossRef]
- Chang, X.; Zeng, M.; Liu, K.; Fu, L. Phase engineering of high-entropy alloys. Adv. Mater. 2020, 32, 1907226. [Google Scholar] [CrossRef] [PubMed]
- Tang, S.; Dong, H.; Huang, Z.; Chen, B.; Tang, H. Exploring the Magnetic Behavior of a Magnetic High-Entropy Alloy with Dual-Phase B20 Crystal Structure. J. Supercond. Nov. Magn. 2023, 36, 1673–1682. [Google Scholar] [CrossRef]
- Wang, J.-J.; Kou, Z.-D.; Fu, S.; Wu, S.-S.; Liu, S.-N.; Yan, M.-Y.; Wang, D.; Lan, S.; Hahn, H.; Feng, T. Microstructure and magnetic properties evolution of Al/CoCrFeNi nanocrystalline high-entropy alloy composite. Rare Met. 2022, 41, 2038–2046. [Google Scholar] [CrossRef]
- Wang, W.-R.; Wang, W.-L.; Wang, S.-C.; Tsai, Y.-C.; Lai, C.-H.; Yeh, J.-W. Effects of Al addition on the microstructure and mechanical property of AlxCoCrFeNi high-entropy alloys. Intermetallics 2012, 26, 44–51. [Google Scholar] [CrossRef]
- Butler, T.M.; Weaver, M.L. Oxidation behavior of arc melted AlCoCrFeNi multi-component high-entropy alloys. J. Alloys Compd. 2016, 674, 229–244. [Google Scholar] [CrossRef]
- Porter, D.A.; Easterling, K.E. Phase Transformations in Metals and Alloys (Revised Reprint); CRC Press: Boca Raton, FL, USA, 2009. [Google Scholar]
- Paufler, P. C. S. Barrett, T. B. Massalski. Structure of Metals. 3rd revised edition. Pergamon Press Oxford, New York, Toronto, Sydney, Paris Frankfurt/M 1980 654 Seiten, 113 Abbildungen, 19 Tabellen und über 1400 Literaturhinweise. Preis US $ 20–. Krist. Tech. 1981, 16, 982. [Google Scholar] [CrossRef]
- Seetawan, U.; Jugsujinda, S.; Seetawan, T.; Ratchasin, A.; Euvananont, C.; Junin, C.; Thanachayanont, C.; Chainaronk, P. Effect of calcinations temperature on crystallography and nanoparticles in ZnO disk. Mater. Sci. Appl. 2011, 2, 1302–1306. [Google Scholar] [CrossRef]
- Rodríguez-Carvajal, J. Recent advances in magnetic structure determination by neutron powder diffraction. Phys. B Condens. Matter 1993, 192, 55–69. [Google Scholar] [CrossRef]
- Uribe-Chavira, J.S.; Herrera-Pérez, G.; Santillán-Rodríguez, C.R.; Sáenz-Hernández, R.J.; Matutes-Aquino, J.A.; Grijalva-Castillo, M.C. Electron density distribution and microstructural spherical harmonic calculation of BaTiO3 powders and ceramics. J. Solid State Chem. 2023, 322, 123988. [Google Scholar] [CrossRef]
- Badjuk, T.; Kushma, G.; Rybajlo, O. Temperature and concentration depencence of the unit cell dimensions of Fe-Cr solid solutions. Izv. Vyss. Uchebnykh Zaved. Chernaya Metall. 1974, 17, 126–128. [Google Scholar]
- Hara, Y.; O’handley, R.; Grant, N. Magnetic properties of Mn1−xNixAl. J. Magn. Magn. Mater. 1986, 54, 1077–1078. [Google Scholar] [CrossRef]
- Häglund, J.; Guillermet, A.F.; Grimvall, G.; Körling, M. Theory of bonding in transition-metal carbides and nitrides. Phys. Rev. B 1993, 48, 11685. [Google Scholar] [CrossRef]
- Roisnel, T.; Rodriguez-Carjaval, J. Fullprof Manual; Institut Laue-Langevin: Grenoble, France, 2002. [Google Scholar]
- Popa, N. The (hkl) dependence of diffraction-line broadening caused by strain and size for all Laue groups in Rietveld refinement. Appl. Crystallogr. 1998, 31, 176–180. [Google Scholar] [CrossRef]
- Stephens, P.W. Phenomenological model of anisotropic peak broadening in powder diffraction. Appl. Crystallogr. 1999, 32, 281–289. [Google Scholar] [CrossRef]
- Järvinen, M. Application of symmetrized harmonics expansion to correction of the preferred orientation effect. Appl. Crystallogr. 1993, 26, 525–531. [Google Scholar] [CrossRef]
- Kurki-Suonio, K. IV. Symmetry and its implications. Isr. J. Chem. 1977, 16, 115–123. [Google Scholar] [CrossRef]
- Uribe-Chavira, J.; Herrera-Pérez, G.; Santillán-Rodríguez, C.; Sáenz-Hernández, R.; Matutes-Aquino, J.; Grijalva-Castillo, M. X-ray diffraction analysis by Rietveld refinement of FeAl alloys doped with terbium and its correlation with magnetostriction. J. Rare Earths 2023, 41, 1217–1224. [Google Scholar] [CrossRef]
- Knobel, M.; Nunes, W.; Socolovsky, L.; De Biasi, E.; Vargas, J.; Denardin, J. Superparamagnetism and other magnetic features in granular materials: A review on ideal and real systems. J. Nanosci. Nanotechnol. 2008, 8, 2836–2857. [Google Scholar] [CrossRef]
- Allia, P.; Coisson, M.; Tiberto, P.; Vinai, F.; Knobel, M.; Novak, M.; Nunes, W. Granular Cu-Co alloys as interacting superparamagnets. Phys. Rev. B 2001, 64, 144420. [Google Scholar] [CrossRef]
- Peter, D.; Müller, S.; Wessel, S.; Büchler, H.P. Anomalous behavior of spin systems with dipolar interactions. Phys. Rev. Lett. 2012, 109, 025303. [Google Scholar] [CrossRef]
- Bruce, A.D.; Aharony, A. Critical exponents of ferromagnets with dipolar interactions: Second-order ε expansion. Phys. Rev. B 1974, 10, 2078. [Google Scholar] [CrossRef]
- Koželj, P.; Jelen, A.; Dražić, G.; Vrtnik, S.; Luzar, J.; Wencka, M.; Meden, A.; Feuerbacher, M.; Dolinšek, J. Complex magnetism of single-crystalline AlCoCrFeNi nanostructured high-entropy alloy. Iscience 2023, 26, 106894. [Google Scholar] [CrossRef] [PubMed]
- Li, K.; Fu, C.-C.; Nastar, M.; Soisson, F.; Lavrentiev, M.Y. Magnetochemical effects on phase stability and vacancy formation in fcc Fe-Ni alloys. Phys. Rev. B 2022, 106, 024106. [Google Scholar] [CrossRef]
- Li, K.; Fu, C.-C.; Schneider, A. Effects of magnetic excitations and transitions on vacancy formation: Cases of fcc Fe and Ni compared to bcc Fe. Phys. Rev. B 2021, 104, 104406. [Google Scholar] [CrossRef]
- Karki Chhetri, S.; Acharya, G.; Graf, D.; Basnet, R.; Rahman, S.; Sharma, M.; Upreti, D.; Nabi, M.R.U.; Kryvyi, S.; Sakon, J. Large negative magnetoresistance in antiferromagnetic Gd2Se3. Phys. Rev. B 2025, 111, 014431. [Google Scholar] [CrossRef]
- Mugiraneza, S.; Hallas, A.M. Tutorial: A beginner’s guide to interpreting magnetic susceptibility data with the Curie-Weiss law. Commun. Phys. 2022, 5, 95. [Google Scholar] [CrossRef]
- Rusanov, B.; Sidorov, V.; Petrova, S.; Perevyshin, V.; Rusanova, A.; Sabirzyanov, A.; Shunyaev, K. Electrical resistivity and magnetic susceptibility of Al-Ni-Co-Cu-Zr high-entropy alloys in solid and liquid states. J. Alloys Compd. 2024, 1008, 176792. [Google Scholar] [CrossRef]
- Cullity, B.D.; Graham, C.D. Introduction to Magnetic Materials; John Wiley & Sons: Hoboken, NJ, USA, 2011. [Google Scholar]

| Area | Al (at. %) | Co (at. %) | Cr (at. %) | Fe (at. %) | Ni (at. %) |
|---|---|---|---|---|---|
| Overall | 32 ± 0.7 | 18 ± 1.3 | 10 ± 0.8 | 16 ± 0.6 | 24 ± 2 |
| Dendrites | 31 ± 1 | 18 ± 1.5 | 14 ± 0.6 | 16 ± 0.5 | 21 ± 2.4 |
| Interdendritic area | 35 ± 0.3 | 18 ± 0.5 | 5 ± 0.5 | 14 ± 0.4 | 27 ± 1 |
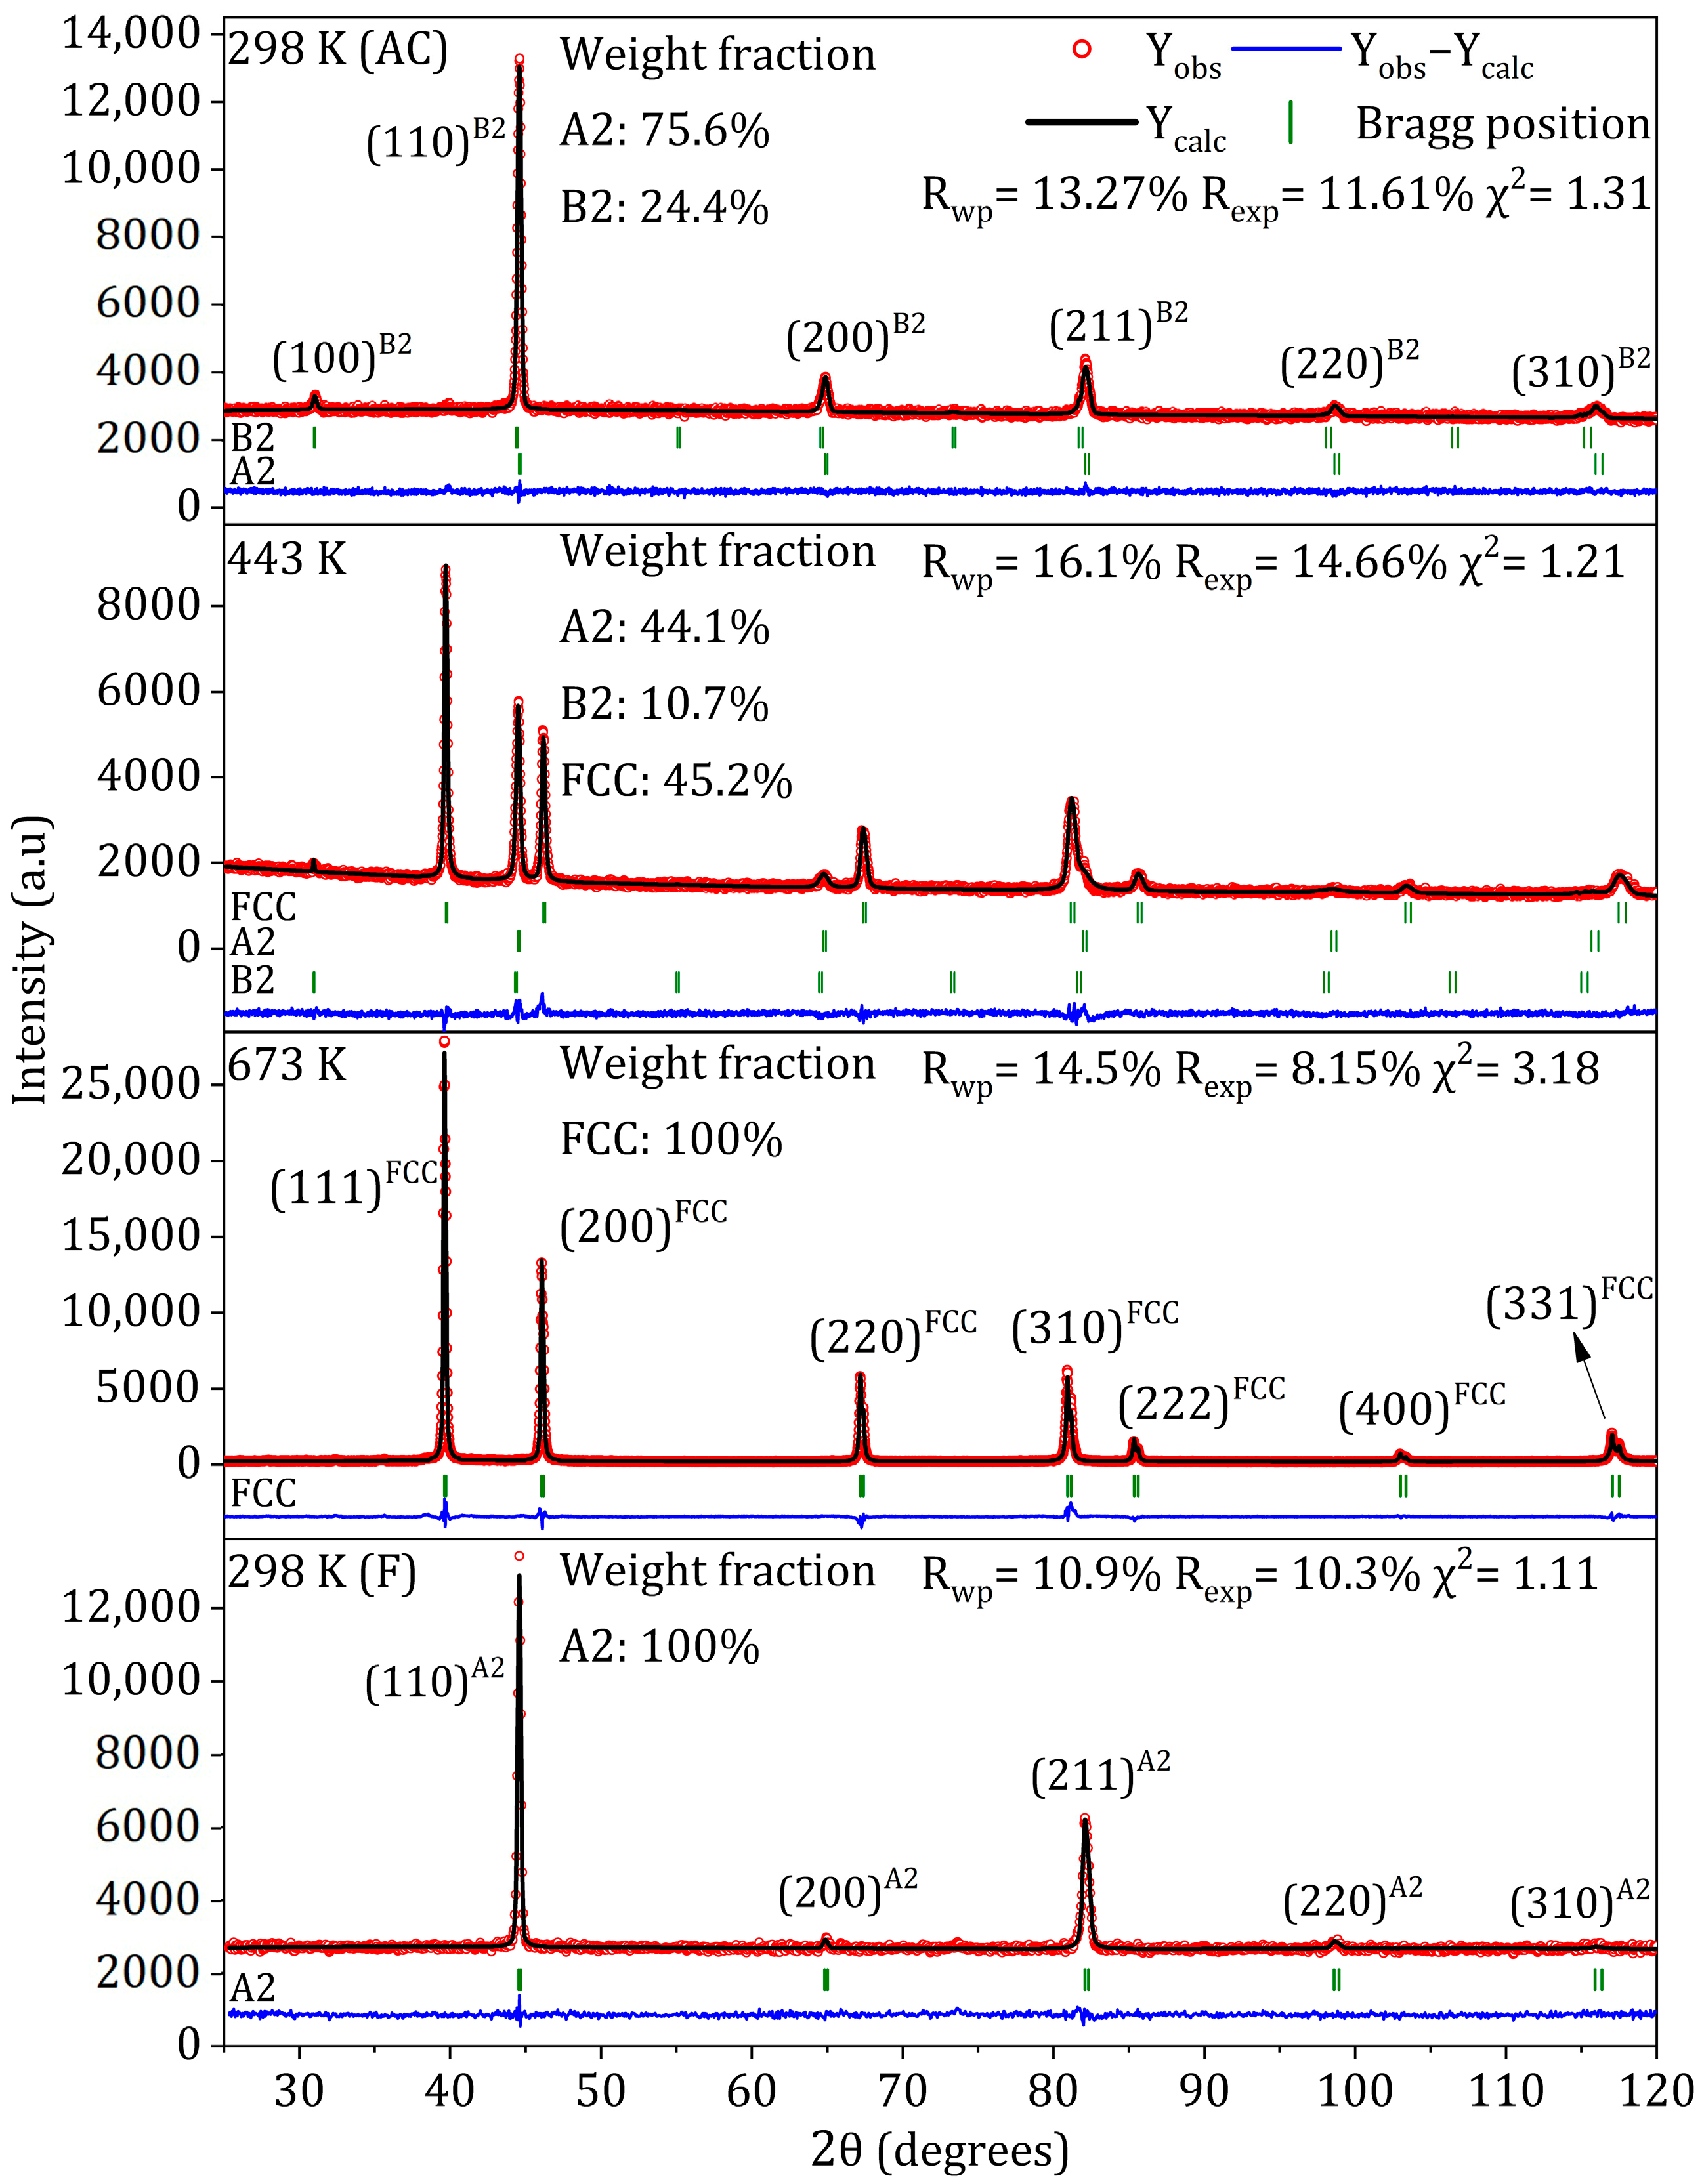
| Temperature | 298 K (AC) * | 443 K | 673 K | 773 K | 873 K | 973 K | 298 K (F) * |
|---|---|---|---|---|---|---|---|
| Structure parameters | |||||||
| (nm) | |||||||
| A2 | 2.8767 (3) | 2.8804 (3) | — | — | — | — | 2.87362 (13) |
| B2 | 2.87310 (19) | 2.8934 (4) | — | — | — | — | — |
| FCC | — | 3.92928 (15) | 3.93671 (10) | 3.94105 (10) | 3.94518 (12) | 3.94939 (12) | — |
| Weight fraction | |||||||
| A2 | 0.756 (3) | 0.441 (7) | — | — | — | — | 1.00 |
| B2 | 0.244 (2) | 0.107 (9) | — | — | — | — | — |
| FCC | — | 0.452 (9) | 1.00 | 1.00 | 1.00 | 1.00 | — |
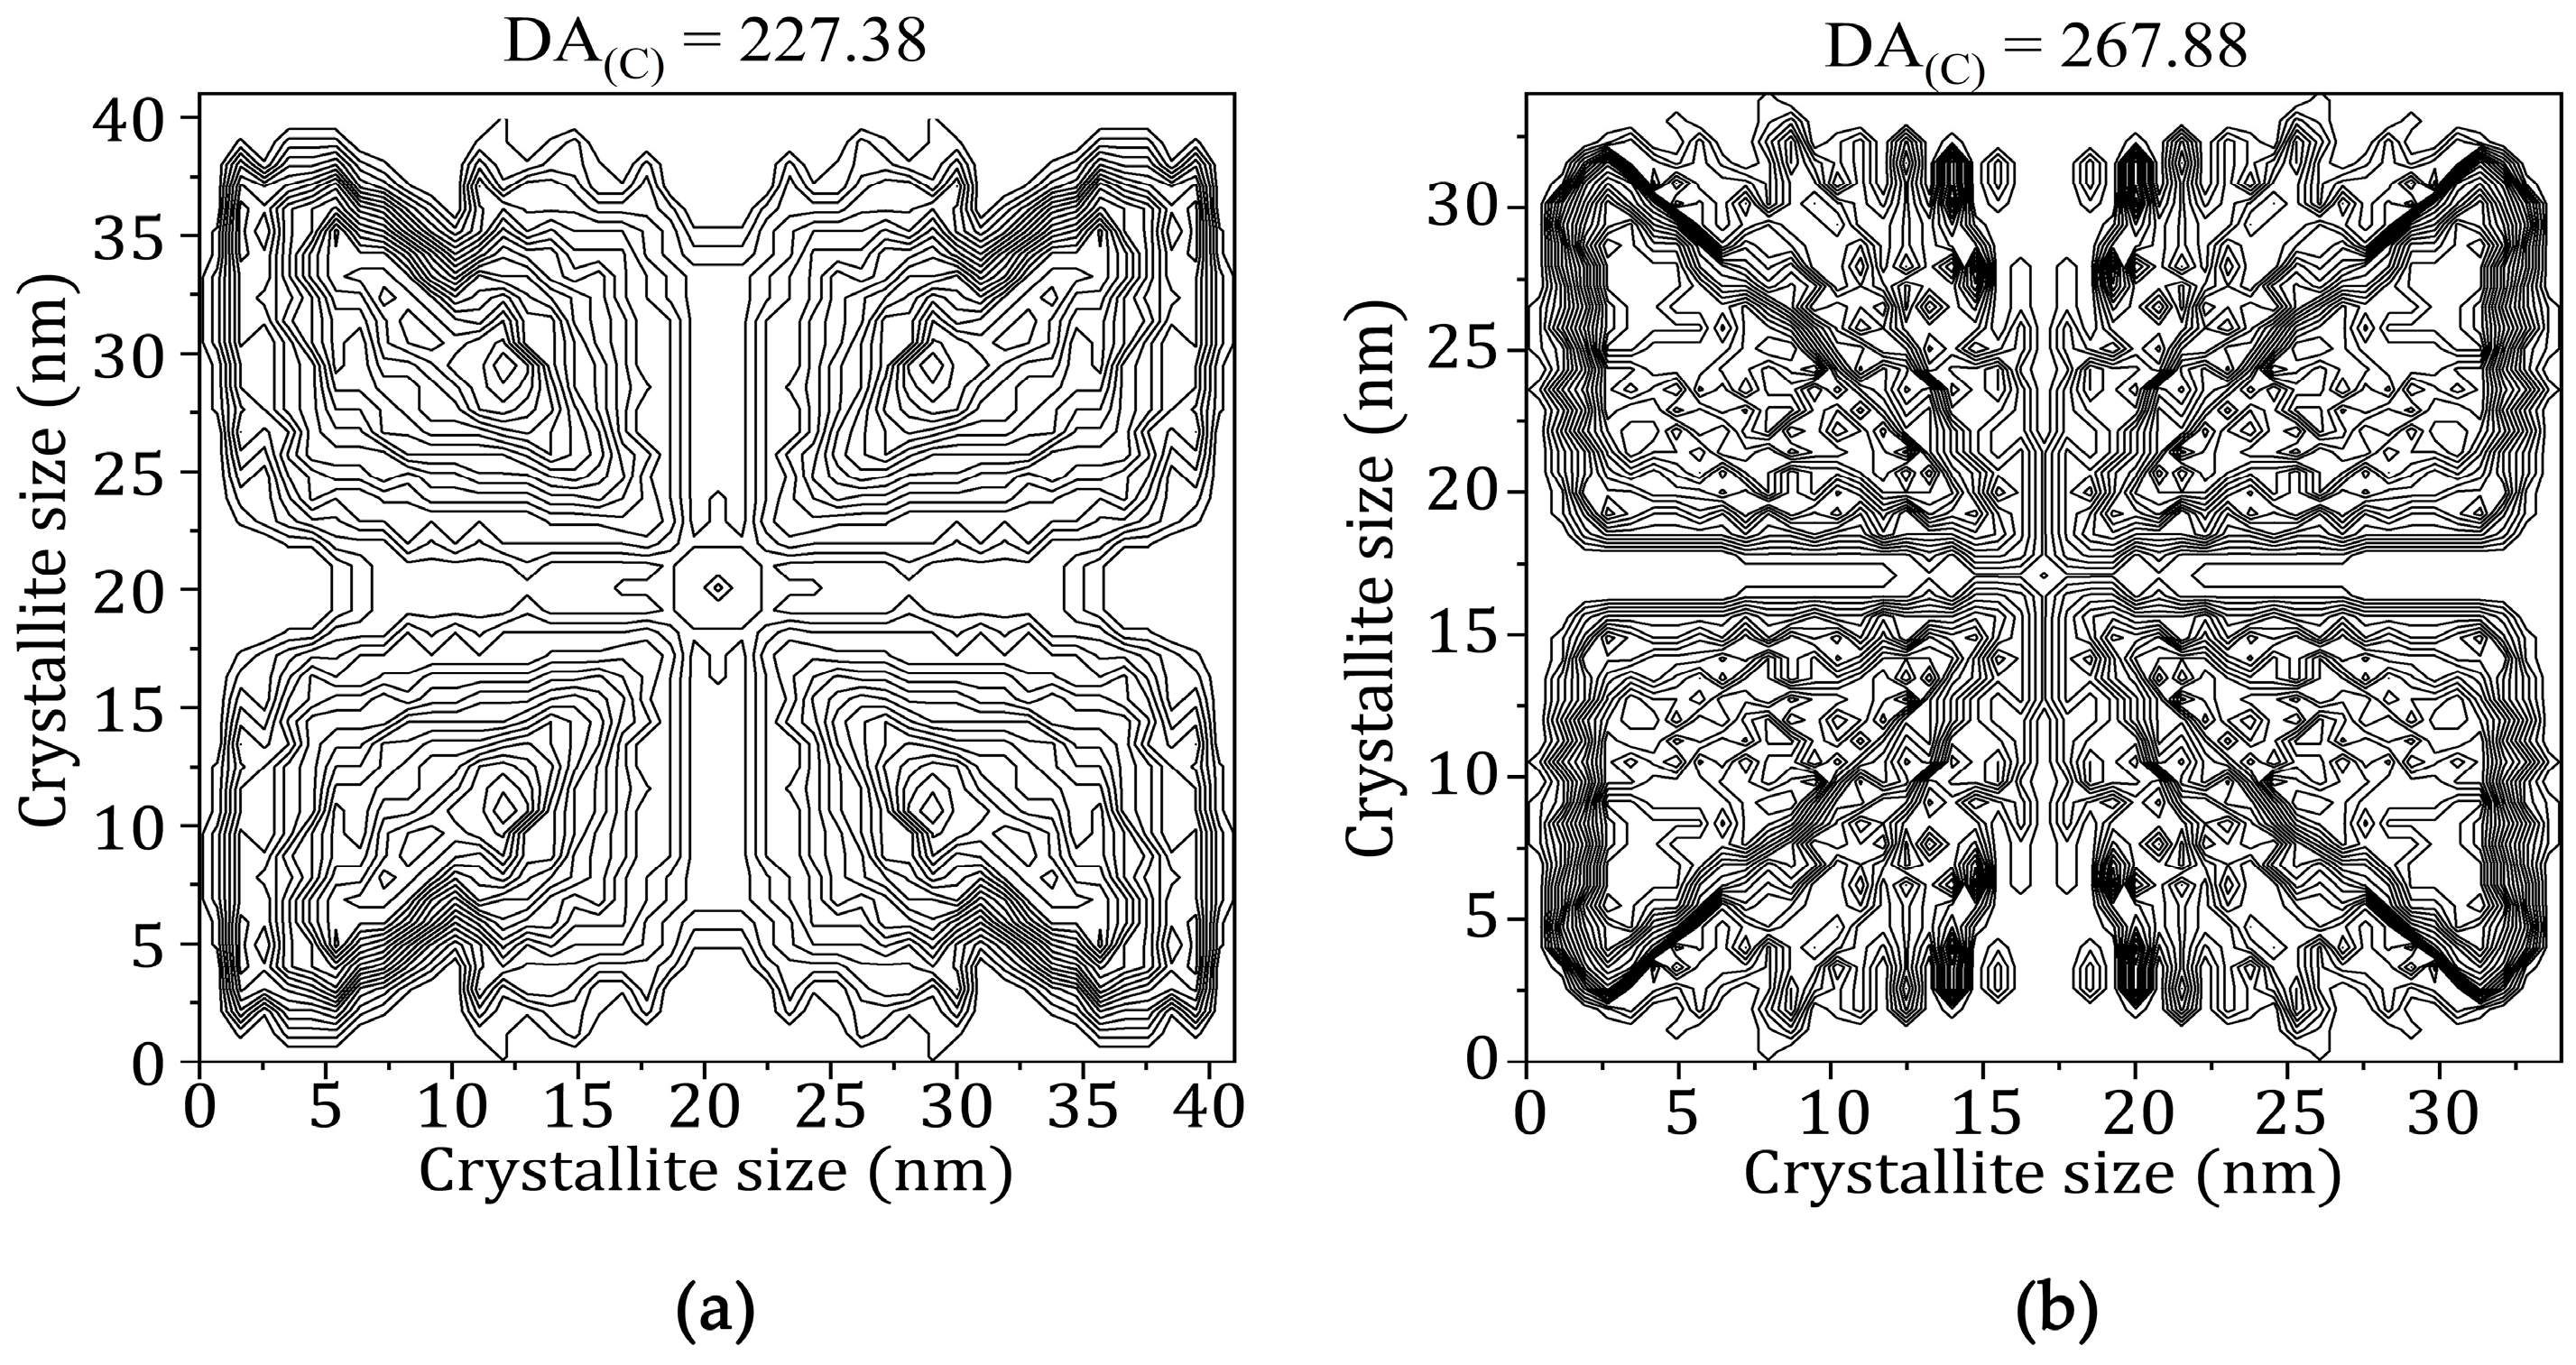
| Microstructure parameters | |||||||
| Crystallite size (nm) | 40.82 | 32.65 | 80.16 | 127.24 | 198.24 | 231.11 | 33.50 |
| DA(C) | 227.38 | 87.32 | 151.49 | 190.70 | 399.48 | 505.26 | 267.88 |
| Maximum strain (10−4) | 21.81 | 36.51 | 11.57 | 6.03 | 4.28 | 3.63 | 36.05 |
| DA(S) | 11.58 | 1.39 | 0.80 | 0.49 | 0.31 | 0.17 | 5.69 |
| Agreement factors | |||||||
| Rwp (%) | 13.27 | 16.1 | 14.5 | 16.2 | 13.4 | 11.8 | 10.9 |
| Rexp (%) | 11.61 | 14.66 | 8.15 | 8.88 | 6.45 | 5.44 | 10.3 |
| χ2 | 1.31 | 1.21 | 3.18 | 3.33 | 4.32 | 4.68 | 1.11 |
Disclaimer/Publisher’s Note: The statements, opinions and data contained in all publications are solely those of the individual author(s) and contributor(s) and not of MDPI and/or the editor(s). MDPI and/or the editor(s) disclaim responsibility for any injury to people or property resulting from any ideas, methods, instructions or products referred to in the content. |
© 2025 by the authors. Licensee MDPI, Basel, Switzerland. This article is an open access article distributed under the terms and conditions of the Creative Commons Attribution (CC BY) license (https://creativecommons.org/licenses/by/4.0/).
Share and Cite
Sáenz-Hernández, R.J.; Santillán-Rodríguez, C.R.; Uribe-Chavira, J.S.; Matutes-Aquino, J.A.; Grijalva-Castillo, M.C. Correlation Between Structure, Microstructure, and Magnetic Properties of AlCoCrFeNi High-Entropy Alloy. Condens. Matter 2025, 10, 31. https://doi.org/10.3390/condmat10020031
Sáenz-Hernández RJ, Santillán-Rodríguez CR, Uribe-Chavira JS, Matutes-Aquino JA, Grijalva-Castillo MC. Correlation Between Structure, Microstructure, and Magnetic Properties of AlCoCrFeNi High-Entropy Alloy. Condensed Matter. 2025; 10(2):31. https://doi.org/10.3390/condmat10020031
Chicago/Turabian StyleSáenz-Hernández, Renee Joselin, Carlos Roberto Santillán-Rodríguez, Jesús Salvador Uribe-Chavira, José Andrés Matutes-Aquino, and María Cristina Grijalva-Castillo. 2025. "Correlation Between Structure, Microstructure, and Magnetic Properties of AlCoCrFeNi High-Entropy Alloy" Condensed Matter 10, no. 2: 31. https://doi.org/10.3390/condmat10020031
APA StyleSáenz-Hernández, R. J., Santillán-Rodríguez, C. R., Uribe-Chavira, J. S., Matutes-Aquino, J. A., & Grijalva-Castillo, M. C. (2025). Correlation Between Structure, Microstructure, and Magnetic Properties of AlCoCrFeNi High-Entropy Alloy. Condensed Matter, 10(2), 31. https://doi.org/10.3390/condmat10020031