Case Report

On the Design and Analysis of a Biometric Authentication System Using Keystroke Dynamics

Electronics and Computer Science, University of Southampton, Southampton SO17 1BJ, UK
*
Author to whom correspondence should be addressed.
Cryptography 2020, 4(2), 12; https://doi.org/10.3390/cryptography4020012
Submission received: 31 January 2020 / Revised: 1 April 2020 / Accepted: 2 April 2020 / Published: 7 April 2020
(This article belongs to the Special Issue Feature Papers in Hardware Security)

Abstract

:
This paper proposes a portable hardware token for user’s authentication; it is based on the use of keystroke dynamics to verify users biometrically. The proposed approach allows for a multifactor authentication scheme, in which a user cannot be granted access unless they provide a correct password on a hardware token and their biometric signature. The latter is extracted while the user is typing their password. This paper explains the design rationale of the proposed system and provides a comprehensive insight in the development of a hardware prototype of the same. The paper also presents a feasibility study that included a systematic analysis based on training data obtained from 32 users. Our results show that dynamic keystroke can be employed to construct a cost-efficient solution for biometric user authentication with an average error rate of 4.5%.

1. Introduction

To use a computer securely, a user must prove their identity to the machine in question. The vast majority of systems use a password-based (or passcode-based) authentication mechanism. Such a system, however, has a glaring hole in its security—the computer grants access if the password is correct, in other words, it only verifies the correctness of the presented password, and, crucially, it does not check the identity of the intended user. Therefore, if a malicious third-party guesses or somehow deduces the user’s password, the entire security of the system is compromised. There are numerous reported attacks that can bypass the conventional password protection mechanisms, such as the brute-force attack [1].
An alternative method of authentication involves having a physical item that the user must produce to be given access, for example a key card. A more secure version of this is based on the use of hardware tokens, to identify the user and allow access. These hardware token require two or even three factors for authentication: for example, a card reader for online banking may require the presence of the reader, the presence of the bankcard and the correct pin number to log in. There has been plenty of previous research into systems involving a hardware token and using one securely as part of a larger system [2,3,4,5,6,7,8,9]. This increases the strength of the authentication by needing multiple factors to be passed before access is allowed, however, none of these factors require the intended user to be the one logging in. In all cases, only the presence of data or hardware is being verified: the identity of the person providing them is not checked, therefore if the hardware token is lost, stolen or forged, the computer’s security collapses.
To solve this problem, the computer must check for the user directly. Rather than detecting the presence of something the user knows, like a passcode, or something the user has, like a key card, it must check for something that the user is. Authenticating the user biometrically makes for some of the most secure systems available. Examples include a fingerprint scanner in [10]; such a system is reported to achieve false rejection rate (FRR) of less than 4.12% when restricting the false acceptance rate (FAR) to 0.01%. Another biometric-based identification scheme is the retina scanners in [11], which achieve a 0% FAR and 1.85% FRR. These systems recognise the user through their body, removing the risk of stolen data or keys, as well as the risk of a password being guessed. However, these systems are prohibitively expensive, requiring complex hardware to make the biometric measurement and carry out the necessary data processing to identify the user. This work proposes an alternative biometric method for user authentication based on the use of keystroke dynamics. When people type, on a keyboard or on a number pad, they do so with differing speeds, differing press and release times, and different pressures. Furthermore, a mixture of various factors affect these differences—hand size, muscle state, how one was taught to type, and so on—and these factors are characteristic to each individual. Keystrokes can show much data about the user, with one study even managing to predict user’s emotional state when typing with around 85% accuracy [12].
The contributions of this work are as follows:
(1)
The development of a biometric-based multifactor user authentication scheme, which expolits keystrock dynamics;
(2)
The design and implementation of a hardware prototype of the proposed system;
(3)
The evaluation of the usability of the proposed system through a feasbility study, which is based on training data from 32 users.
Our results show that keystroke dynamics can be used to build a cost-effective, biometric-based authentication scheme with an average error rate of 4.5%.
The remainder of this paper is organised as follows. Section 2 discusses the related works. Section 3 explains the principles of the proposed approach. Section 4 discusses, in depth, the design and implementation of a hardware prototype of the system. Section 5 explains the technique employed to evaluate the usability of our solution. Finally, conclusions are drawn in Section 6.

2. Related Work

Keystroke dynamics as a field has seen a fair amount of research [13], with various different algorithms extracting various aspects of typing on various different platforms, including mobile phones [14]. The methodology behind keystroke dynamics follows much the same principle as the study of handwriting, but modern technology allows for multiple different methods for uniquely identifying each user. The hold time (the amount of time each key is pressed), and the space time (the time period between two key presses) are the most notable. Results using this as a feature vary from a FAR of 0.5% and an FRR rate of 3.1% when only considering the space time, to equal error rates of between 4% and 12% depending on the algorithm [15]. When also considering the interval between the same point on successive keystrokes, a 1.45% FRR and a 1.89% FAR have been obtained [16].
Additionally, there are systems that use continuous authentication in keystroke dynamics, which also rely on measuring the hold and space time metrics defined above; these measurements are performed continuously to authenticate the user as they type. This approach makes it feasible to detect a change in user after the log in process by constantly keeping track of the unique signature of the user’s keystroke dynamics. While continuous authentication is not the focus of this paper, the methods and algorithms employed are similar to login authentication, for example, Darabseh and Namin found that hold duration was a more effective identifying characteristic than latency time [17]. They produced an accuracy of around 80% when using support vector machines and k-nearest neighbour methods, however, neural nets have produced equal error rates of around 2% [18].
To produce greater accuracy, other characteristics of the keypress can be extracted apart from hold and space times. When extracting keystroke sounds for continuous authentication, Roth et al. achieved an equal error rate of around 11% [19]. Another study using the sound of keystrokes over a sentence reported an FAR of 11% and an FRR of 12% [20]. While these results are interesting, recording the pressure or displacement of keypresses has achieved better results [13]. As noted in [21], research into this area is limited by the difficulty of creating a pressure-sensing keyboard. Nevertheless, there have been a few studies into this area. One principle drawn from past studies is the idea of extracting attributes from the keypresses to have qualities to compare. Examples of how characteristics of the keypress can be used in this way are in [22] (which also measured vibration), and [23], with the best results of 1.67% FAR at 0% FRR for [23] and a 0.6% error rate for [22], which was an extensive study using neural methods.

3. Proposed System Architecture

The proposed system is envisioned as a self-contained portable hardware token. It consists of a number pad connected to an embedded chip. The latter is mainly responsible for capturing the keystroke profile associated with each user, with this information stored in the memory for a given password/user. The system allows users to change their password and allows for multiple user entries.
Each time the user logs on, they will simply enter the password onto the device (logging on is used as an example; any other use of verification would happen the same way, such as confirming a purchase). The press data from the keys are compared to the profile stored in memory, and if the data match within a suitable threshold, the user is given access. If an unintended user attempts to log on, even with the correct password, their data will not match that stored in memory, and they will not be allowed access. This system already requires multiple factors for authentication (Password, number pad and matching press data), but could also require another token, such as a card or a key, for even greater security. The beauty of this method is that it will extract the biometric signatures of users while they type their password, therefore it does not require the complicated circuitry associated with retina or fingerprint scanners, nor will it need the additional user input such systems require. To log onto a system, a user only needs to enter a password into the device, and merely doing so can be used to authenticate them. The architecture of the proposed system is divided into two main parts, hardware and software. The hardware part is responsible for capturing the keystroke profile from the user’s input and translating these analogue measurements into digital information. The software part has two functionalities: first, it is responsible for extracting user’s signature, which are stored in on-chip memory, and second, it is responsible for authenticating users at a later stage. A generic system architecture is shown in Figure 1. The operation principles are as follows. The user input is captured using motion sensors connected to a keypad or a keyboard (not shown in this figure). Next, the output of the sensing stage is fed into an ADC, which generates the digital data to be processed at a later stage. The comparator block provides a digital signal for each button press, with this signal being used to indicate to the processor that there is data on the bus to be analysed/processed. This removes the need for the processor to be constantly active, which allows for a more energy-efficient implementation. The digital signals are also used to make sure the entered password is correct. Finally, the processor samples the data from the bus and generates a profile for each user’s password, which is subsequently stored in the memory block.
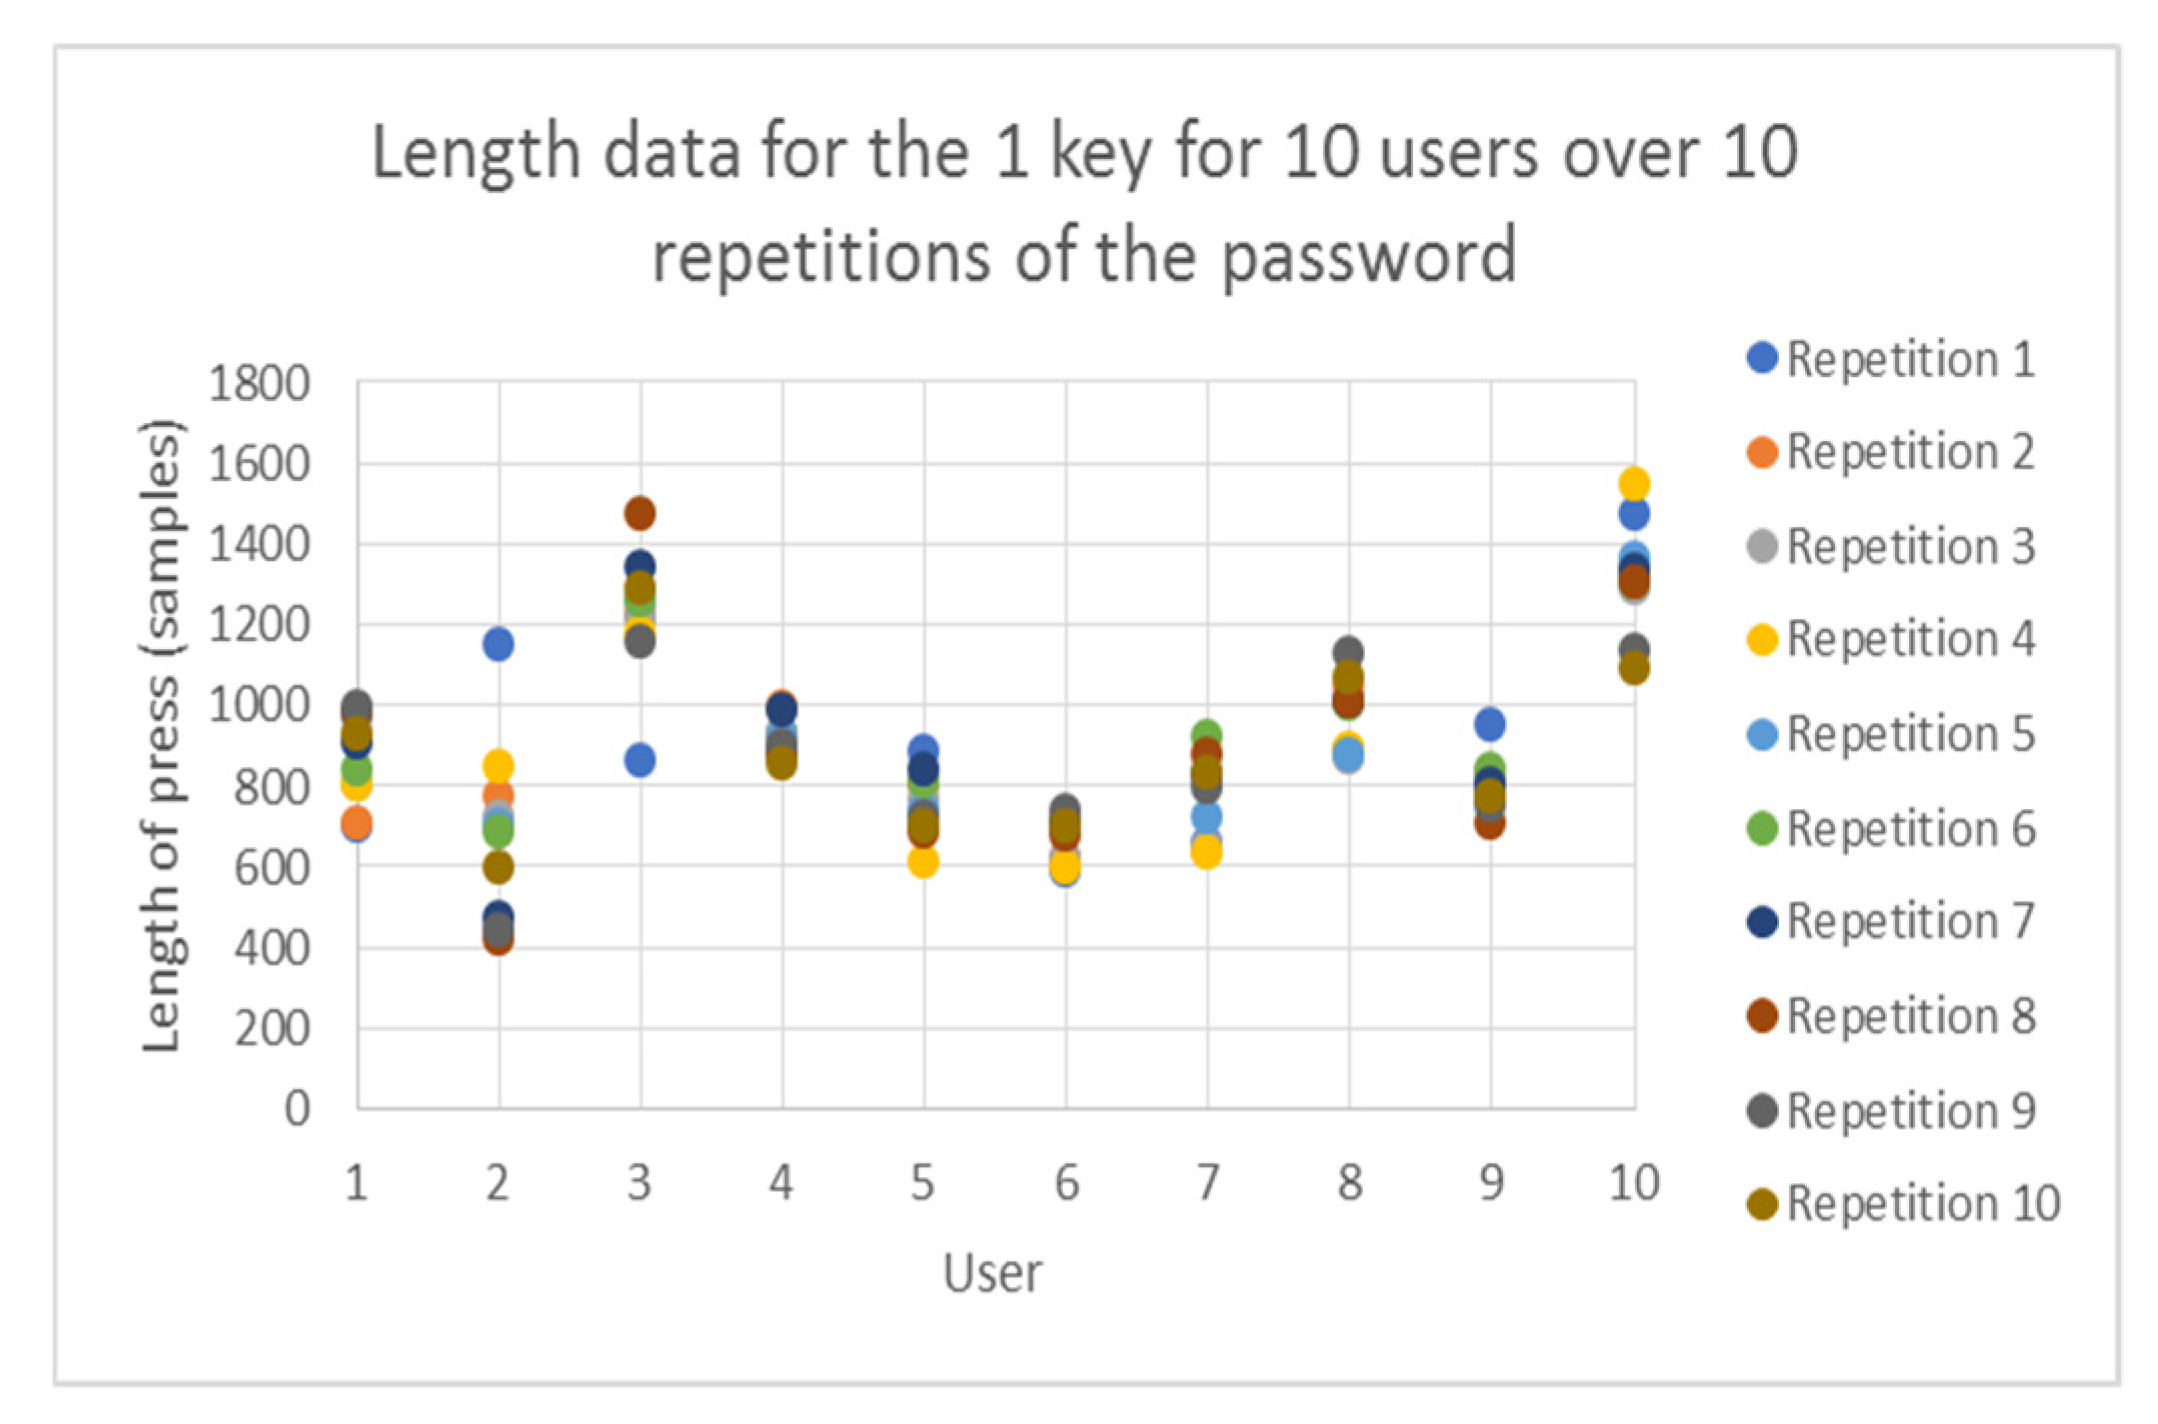
The essence of the proposed approach relies on the assumption that it is possible to distinguish between users based on their typing speed/style. To illustrate the feasibility of this technique, we carried a simple experiment wherein we measured the length of a keypad button press for ten users while typing a password. Figure 2 shows how the results. It can clearly be seen that each user’s presses are grouped around a certain range of lengths, and this differs for each user. Although there are some similarities, for example, between users 5 and 7, this is just one characteristic for one button in a passcode. When considering all of the different factors, it should be possible to verify users accurately. More details on this can be is in Section 5.1

4. Implementation

This section explains the design rationale of a prototype of the proposed system.

4.1. Key Pad

In this case study, we choose to implement a keypad that has ten buttons. This seems a reasonable trade-off between the usability of the system and its size. In principle, the more buttons there are, the longer and more secure the passwords, the larger the number of possible passwords and the larger the size of the hardware token.
The buttons on the pad should also have reasonable stiffness and travel, so that the range of travel is roughly equal to the range of a normal button press. In addition, the keys should return as fast as possible after the press, ideally moving up with the finger that pressed the key, so the data recorded on the upstroke show how the button was released, rather than how the button is returned to the resting position. The number pad should also contains analogue-sensing elements; previous studies have used piezoelectric sensors [24], or force-sensitive resistors [22,25] to measure the pressure of a button press. In this case study, we chose linear motion potentiometers mostly chosen for the ease of creating buttons.
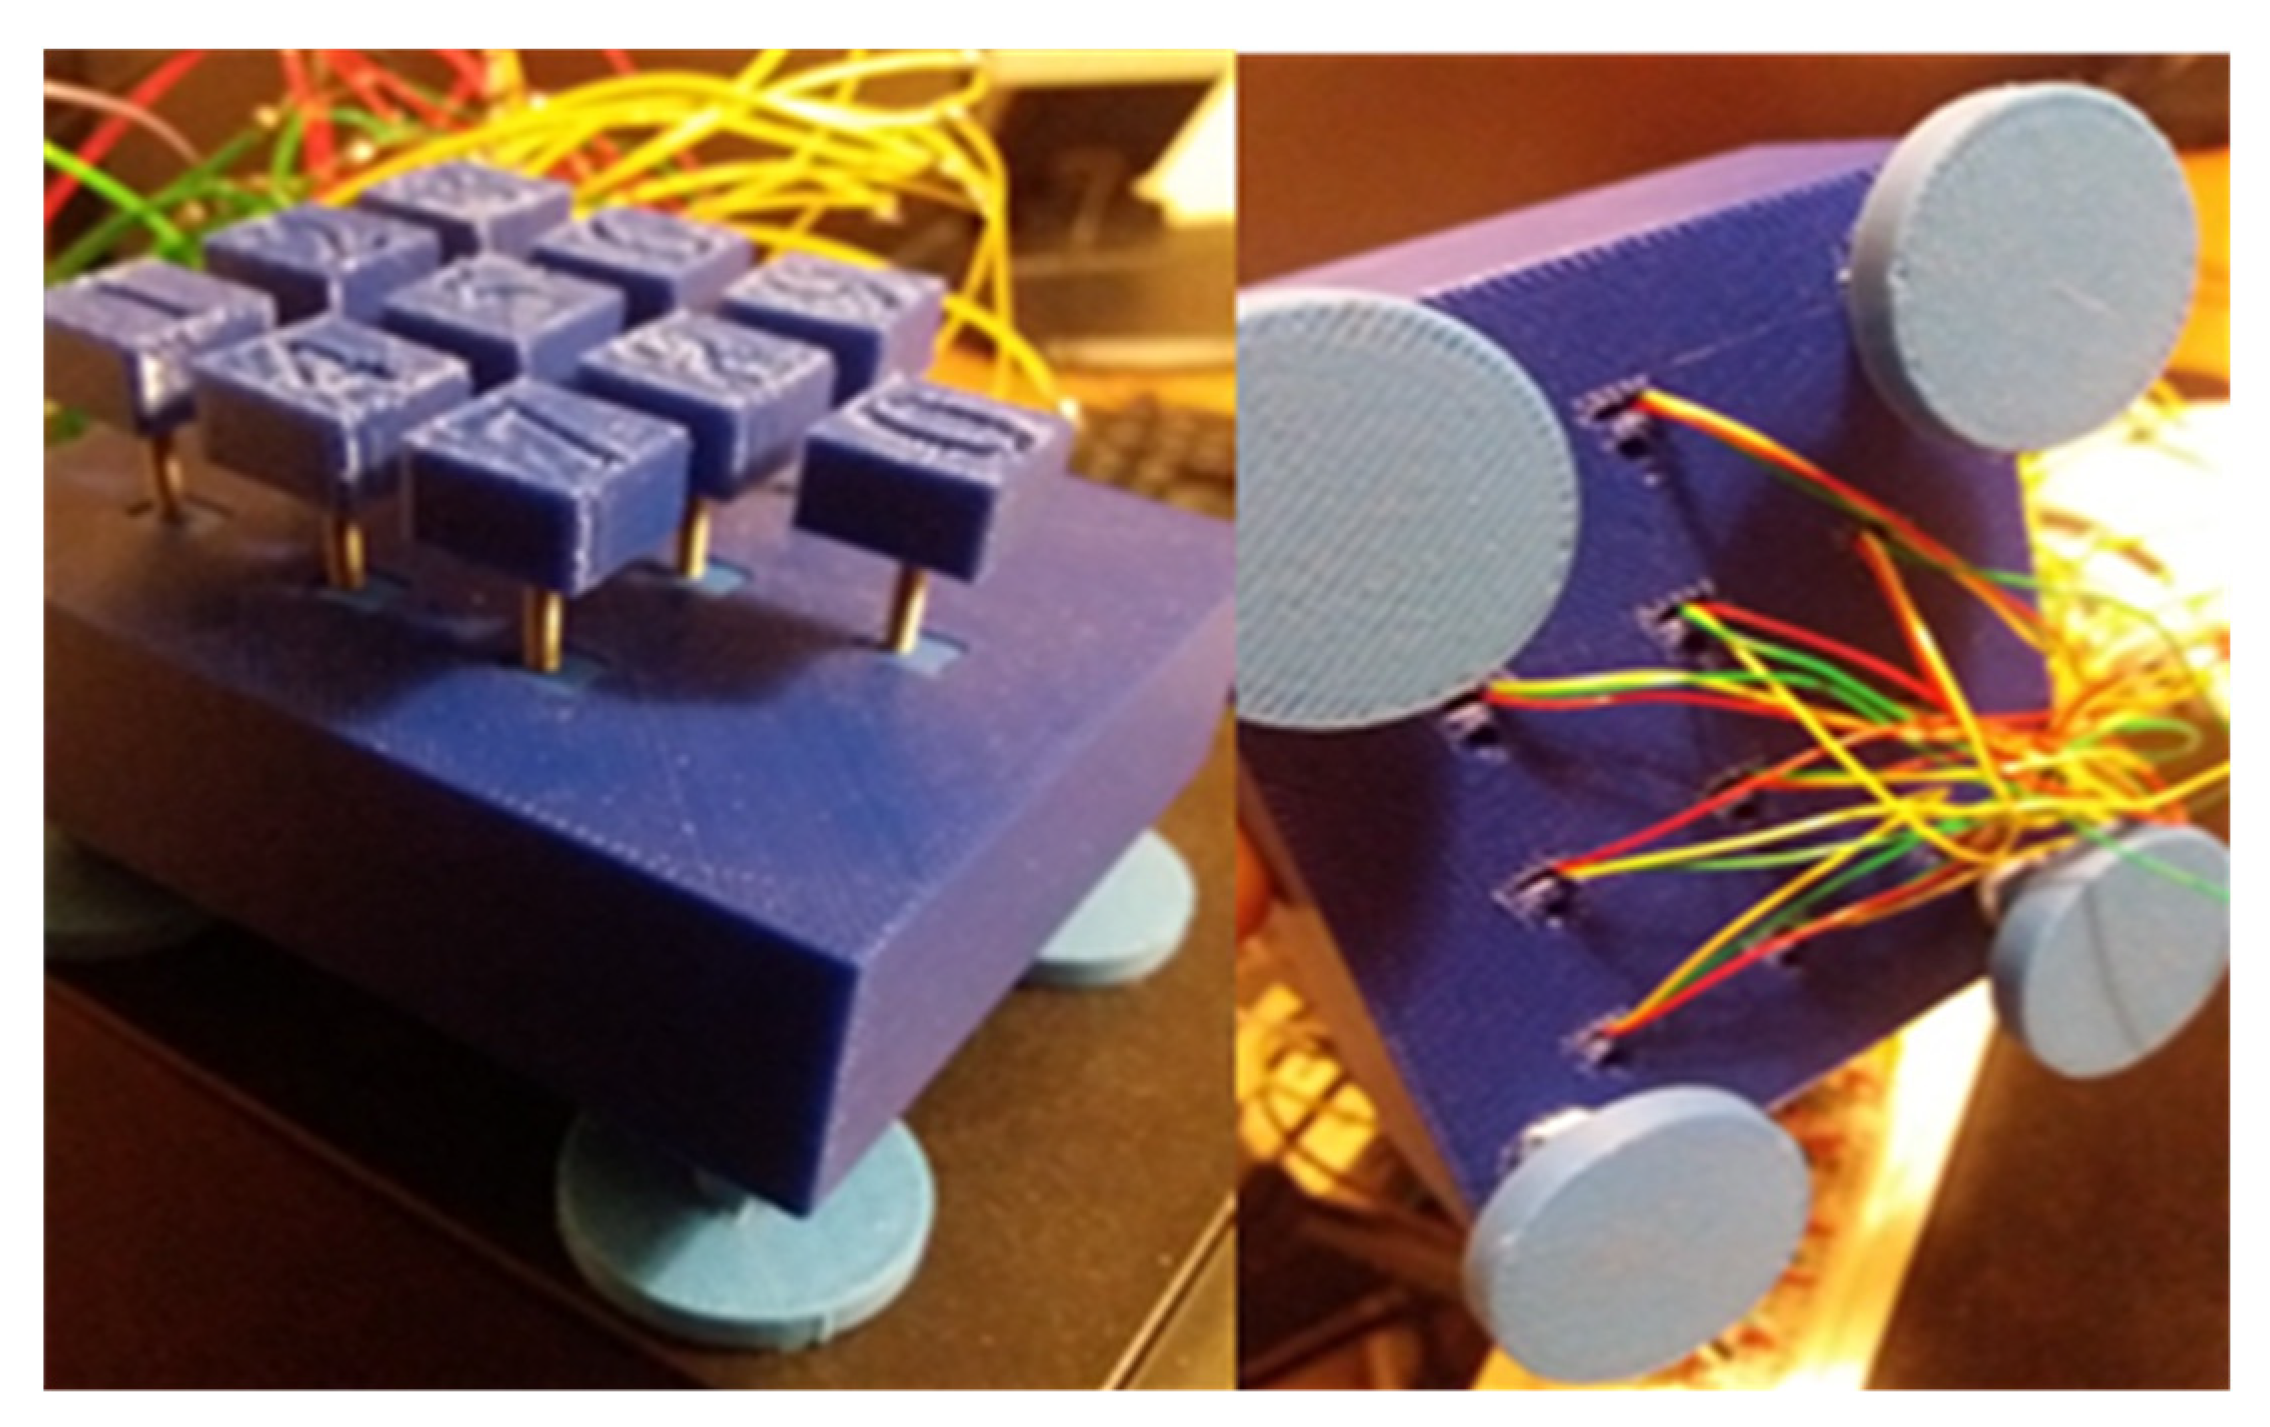
To allow for easy mounting of the analogue components, the case for the number pad was 3D-printed. Linear motion potentiometers act in the same way as normal potentiometers (the resistance between a ‘wiper’ contact and two end contacts varies with position); the only difference being that the position here is the linear position of a shaft, rather than radial position. The design of the case had slots that the potentiometers fit into, with the wires accessible from the bottom and the shafts being free to move. The key caps were also 3D-printed, so the diameter of the screw thread on the potentiometer shafts could be matched. Before each key cap was screwed onto each shaft, a spring was placed around each shaft. When a key is pressed, the spring compresses, returning the key to the resting position as the user pulls back their finger, as shown in Figure 3.

4.2. The Analogue to Digital Converter

This block needs to continuously sample the analogue signal generated by the potentiometer over the course of a button press, at a sample rate sufficiently large to collect a reasonable amount of data. A normal typing speed is 33 words per minute [19], and assuming an average of 4.5 characters in a word, and buttons being pressed at around a quarter the time, this gives a button press time of 100 ms, with a minimum time of half that. However, because of the size and travel of the buttons used, a button press on the number pad is around five times longer. To record enough data, a minimum of a hundred data values should be gathered on an average button press. Another important consideration is the resolution of the samples. If the resolution is too small or the sample rate too low, differences in button presses will not show up in the data.
The ADCs chosen for this task were the MCP3008 and the MCP3002, being ten bit eight- and two-input analogue to digital converters respectively. Ten bits gives a resolution of just over a thousand values for the full travel of the potentiometers, which is sufficient for the task. The chips are rated for up to 200 k samples per second at a 5 V supply. These ADCs are controlled via an serial peripheral interface (SPI) bus. A custom protocol was written for this connection because, commonly, SPI busses deal with 8-bit payloads, not 10-bit.

4.3. The Comparator Block

This block constantly compares the potentiometer output voltages to a reference voltage, producing a digital signal for each button pressed. The reference voltage is chosen to be sufficiently low to pick up every button press with minimal impact on the resolution (the lowest 10-bit value measured becomes 10 rather than 0 when the digital signal is on, a drop in >1% of the resolution), but also high enough to only activate when the button is pressed. A simple potential divider produced a non-zero reference voltage of around (~0.03 V). These signals from the comparator are also fed into the system bus.

4.4. The Software Part

This part of the design is responsible for user data classification and for user authentication. An off-the shelf-raspberry PI was chosen to implement bot functionalities.
Various algorithms can be used to build a distinctive profile that captures the keystroke characteristics of each user. Possibly, the most effective algorithms involve machine learning, which, although harder to implement than statistical methods, can provide better results [13,22]. Such methods may require a great deal of processing power, possibly too much to be included. Therefore, in this case study we explored two statistics-based approach for data analysis. The first is based on the computation of simple averages and the second is based on a probability estimation, with both techniques relying on the characteristics extracted from each button press.
With (S) corresponding to the displacement value, and (T) to the sample number (due to the constant sample rate this is a measure of time), the following characteristics have been extracted:
(1) The maximum displacement value (Smax);
(2) The length of button press (Tmax);
(3) The plateau length (PL).
This is the amount of time for which the displacement is at the maximum value. T[Smax0] is the sample number where the displacement hits the maximum value and T[Smax1] is when the displacement is no longer maximum. From the results, this tended to be a significant portion of the button press, normally around 50–300 samples. This is calculated based on the three highest resolution levels, to avoid fluctuations in the reading changing the result. When these fluctuations were noticed during testing, they only ever varied between adjacent levels, so having three levels should be enough to remove this risk. This is calculated as follows
PL T[Smax1] − T[Smax0]
(4) The attack value (AV)
This was calculated as the gradient of the press up until the start of the maximum level, so the maximum displacement value divided by the number of samples until the maximum displacement value (within three values, as before) was first reached. This is calculated as follows
AV = Smax0/T[Smax0]
(5) The decay value (DE)
This was calculated the same way as the attack value but using the number of samples between when the press dropped below the maximum value and the end of the press.
DE = Smax1/(TmaxT[Smax1])
(6) The mean average sample (AV) is the sum of all displacements, given as follows
AV ΣS/Tmax
The above characteristics can be used to identify/verify the users. The first stage is the enrolment state, wherein training data are collected from each user for a given password, which had to be at least 10 digits. Each user had to enter their password ten times. This number of repetitions was found experimentally in this study. It is worth noting that more repetitions at the enrolment stage and a longer password can reduce false admission rate, however, this may reduce the usability of the scheme.
The second stage is the verification phase, during which a user types their password and an algorithm compares the keystroke profile captured by the hardware part with that associated with the user and stored in the system memory. Such comparisons require the use of a metric. In this case study, we consider two metrics, one based on simple average and one on probability estimation. These two approaches are explained in detail below.
(a) User Verification using Simple Averages
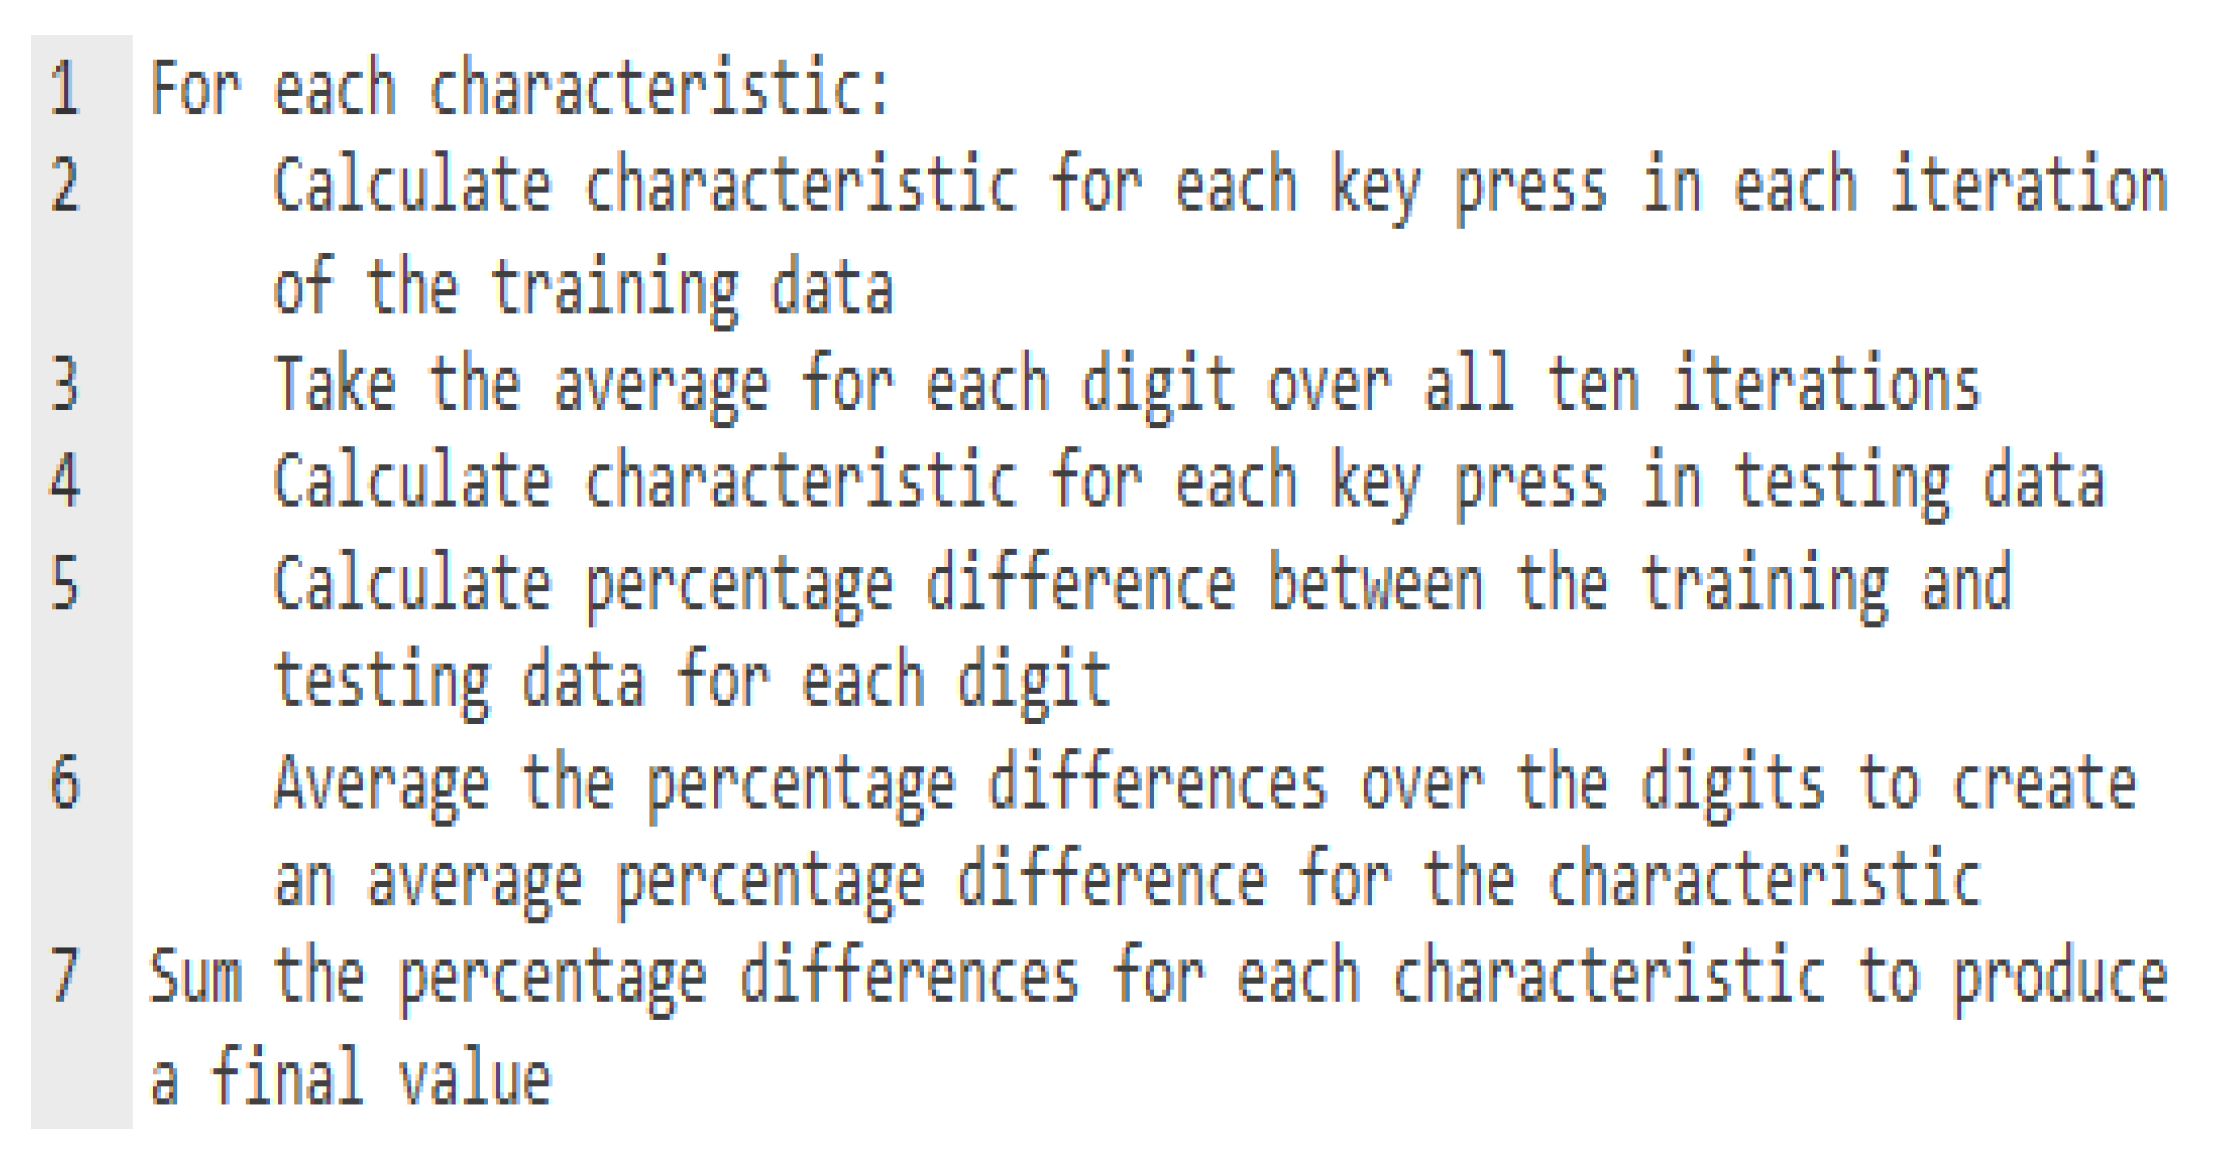
In this case, for each of the characteristics outlined above, and for each digit in the password, the mean value is extracted from the training data (ten repetitions of the password), during the enrolment stage. At the following verification phase, when a password is taken for authentication, the differences between the values for the new password and the average values are calculated. This produces a percentage discrepancy for each factor. Logically speaking, if the password was from the same user as the training data, it would be similar to the training data, and so this discrepancy would be low, but if it were another person, the difference would be high. The percentages are then summed to produce a number that is lower if the user is correct, and higher if they are wrong. A threshold can then be set that allows the majority of correct presses through, while rejecting the majority of incorrect ones. This method however does have some flaws, predominantly that there is no prevention against anomalies changing the results. If there is an anomaly in the training data, it will shift the average, and there is the potential for large anomalies with the number pad. If, say, normally the user presses the button about halfway, but once in the training data they press it down fully, this will shift the average by 5% for that key. The reverse can also be a problem, in that defining features about the wave are averaged out and do not show up in the final number, for example if the user always presses to a maximum value of 400 or 600 but not 500, this would be lost and averaged out to 500. However, for a quick comparison between the training data and test data, the averaging method can easily produce a reasonable result, and so is used as the first method of comparison. The pseudocode for this method is shown in Figure 4.
(b) User Verification using Probability Estimation
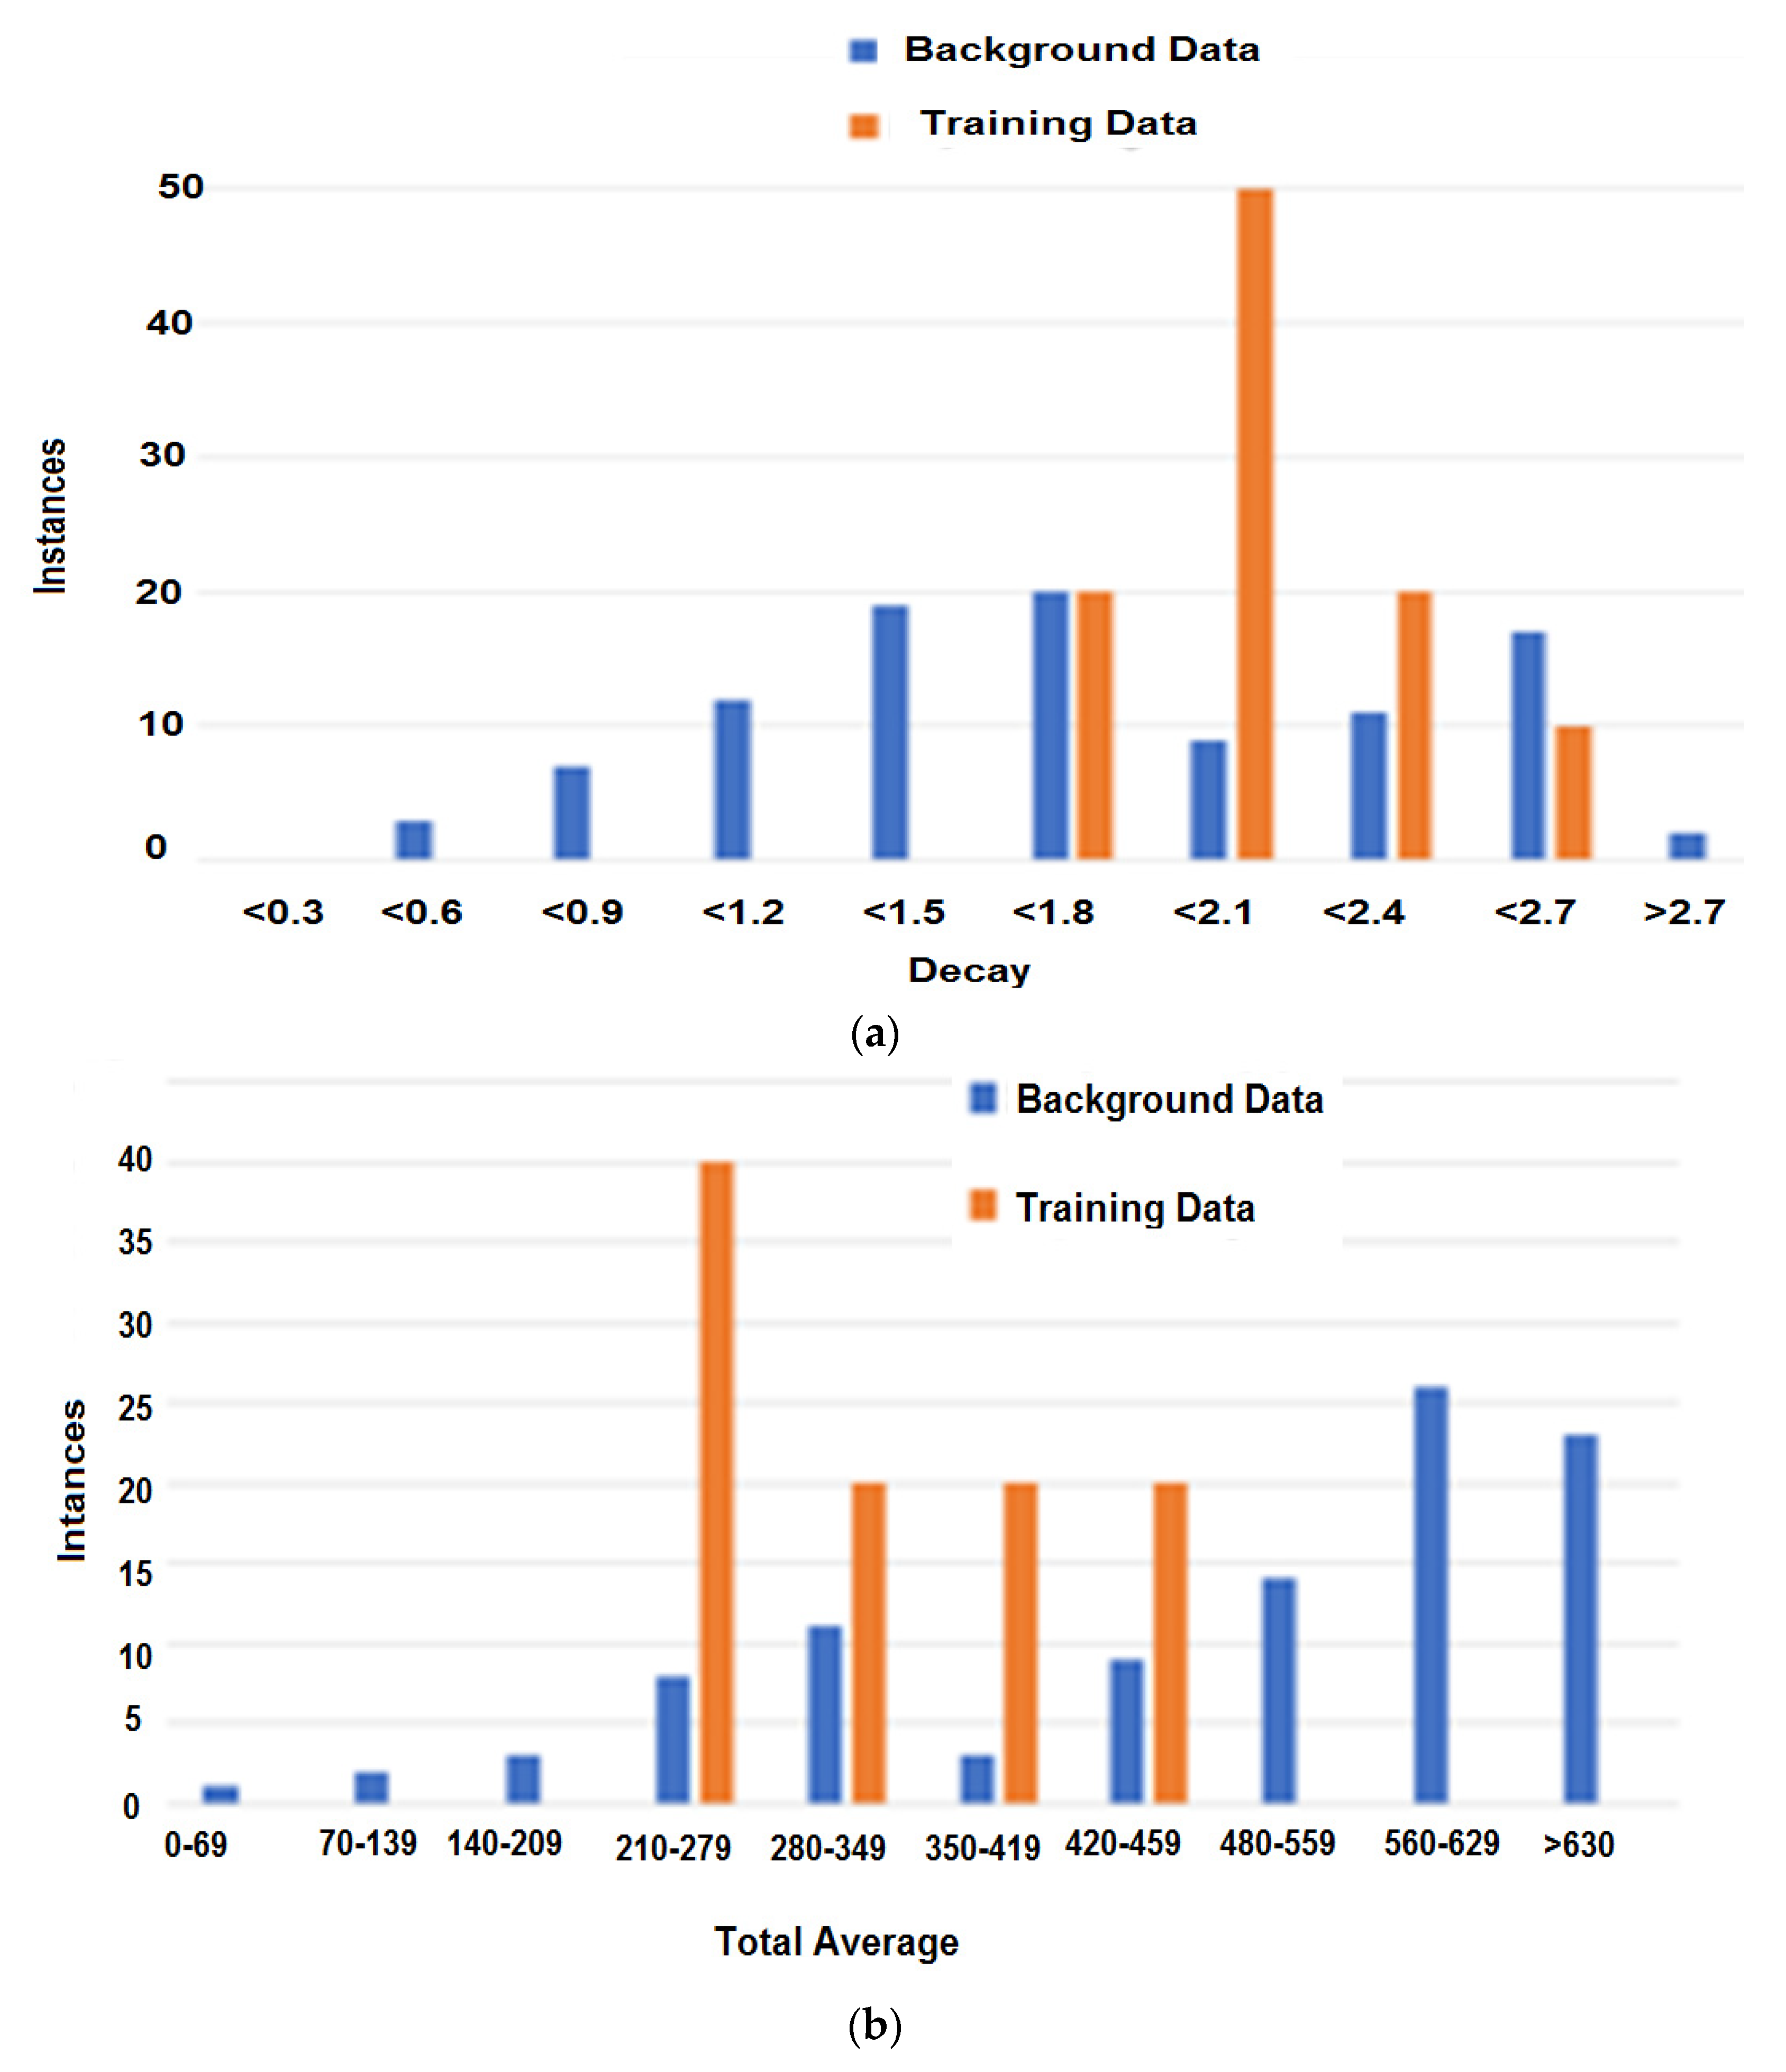
To overcome the disadvantages of the simple average approach, probability was considered as a second method. It is possible to calculate the probability that a certain value on one of the characteristics was reached by comparing the amount of background data and training data for that value. Background data are data showing how other users press the button, while the training data show how the correct user presses the button. Each characteristic was then divided into sections that encompassed a range of values. For example, the max level was divided into under 100; 100–199 and so on, until over 900 was set as the tenth category. For each button in the password, and for each characteristic, these categories were then populated with the background data and the training data. The result was two effective bell-curves, one for the background data and one for the user’s data. Figure 5 shows two characteristics and the relevant instances for background and training data. Logically the user’s data should vary less, assuming the user enters the password in a similar way each time, compared to a background made up of many different people with many different ways of entering the password. This produces a sharper peak in the training data than on the background data.
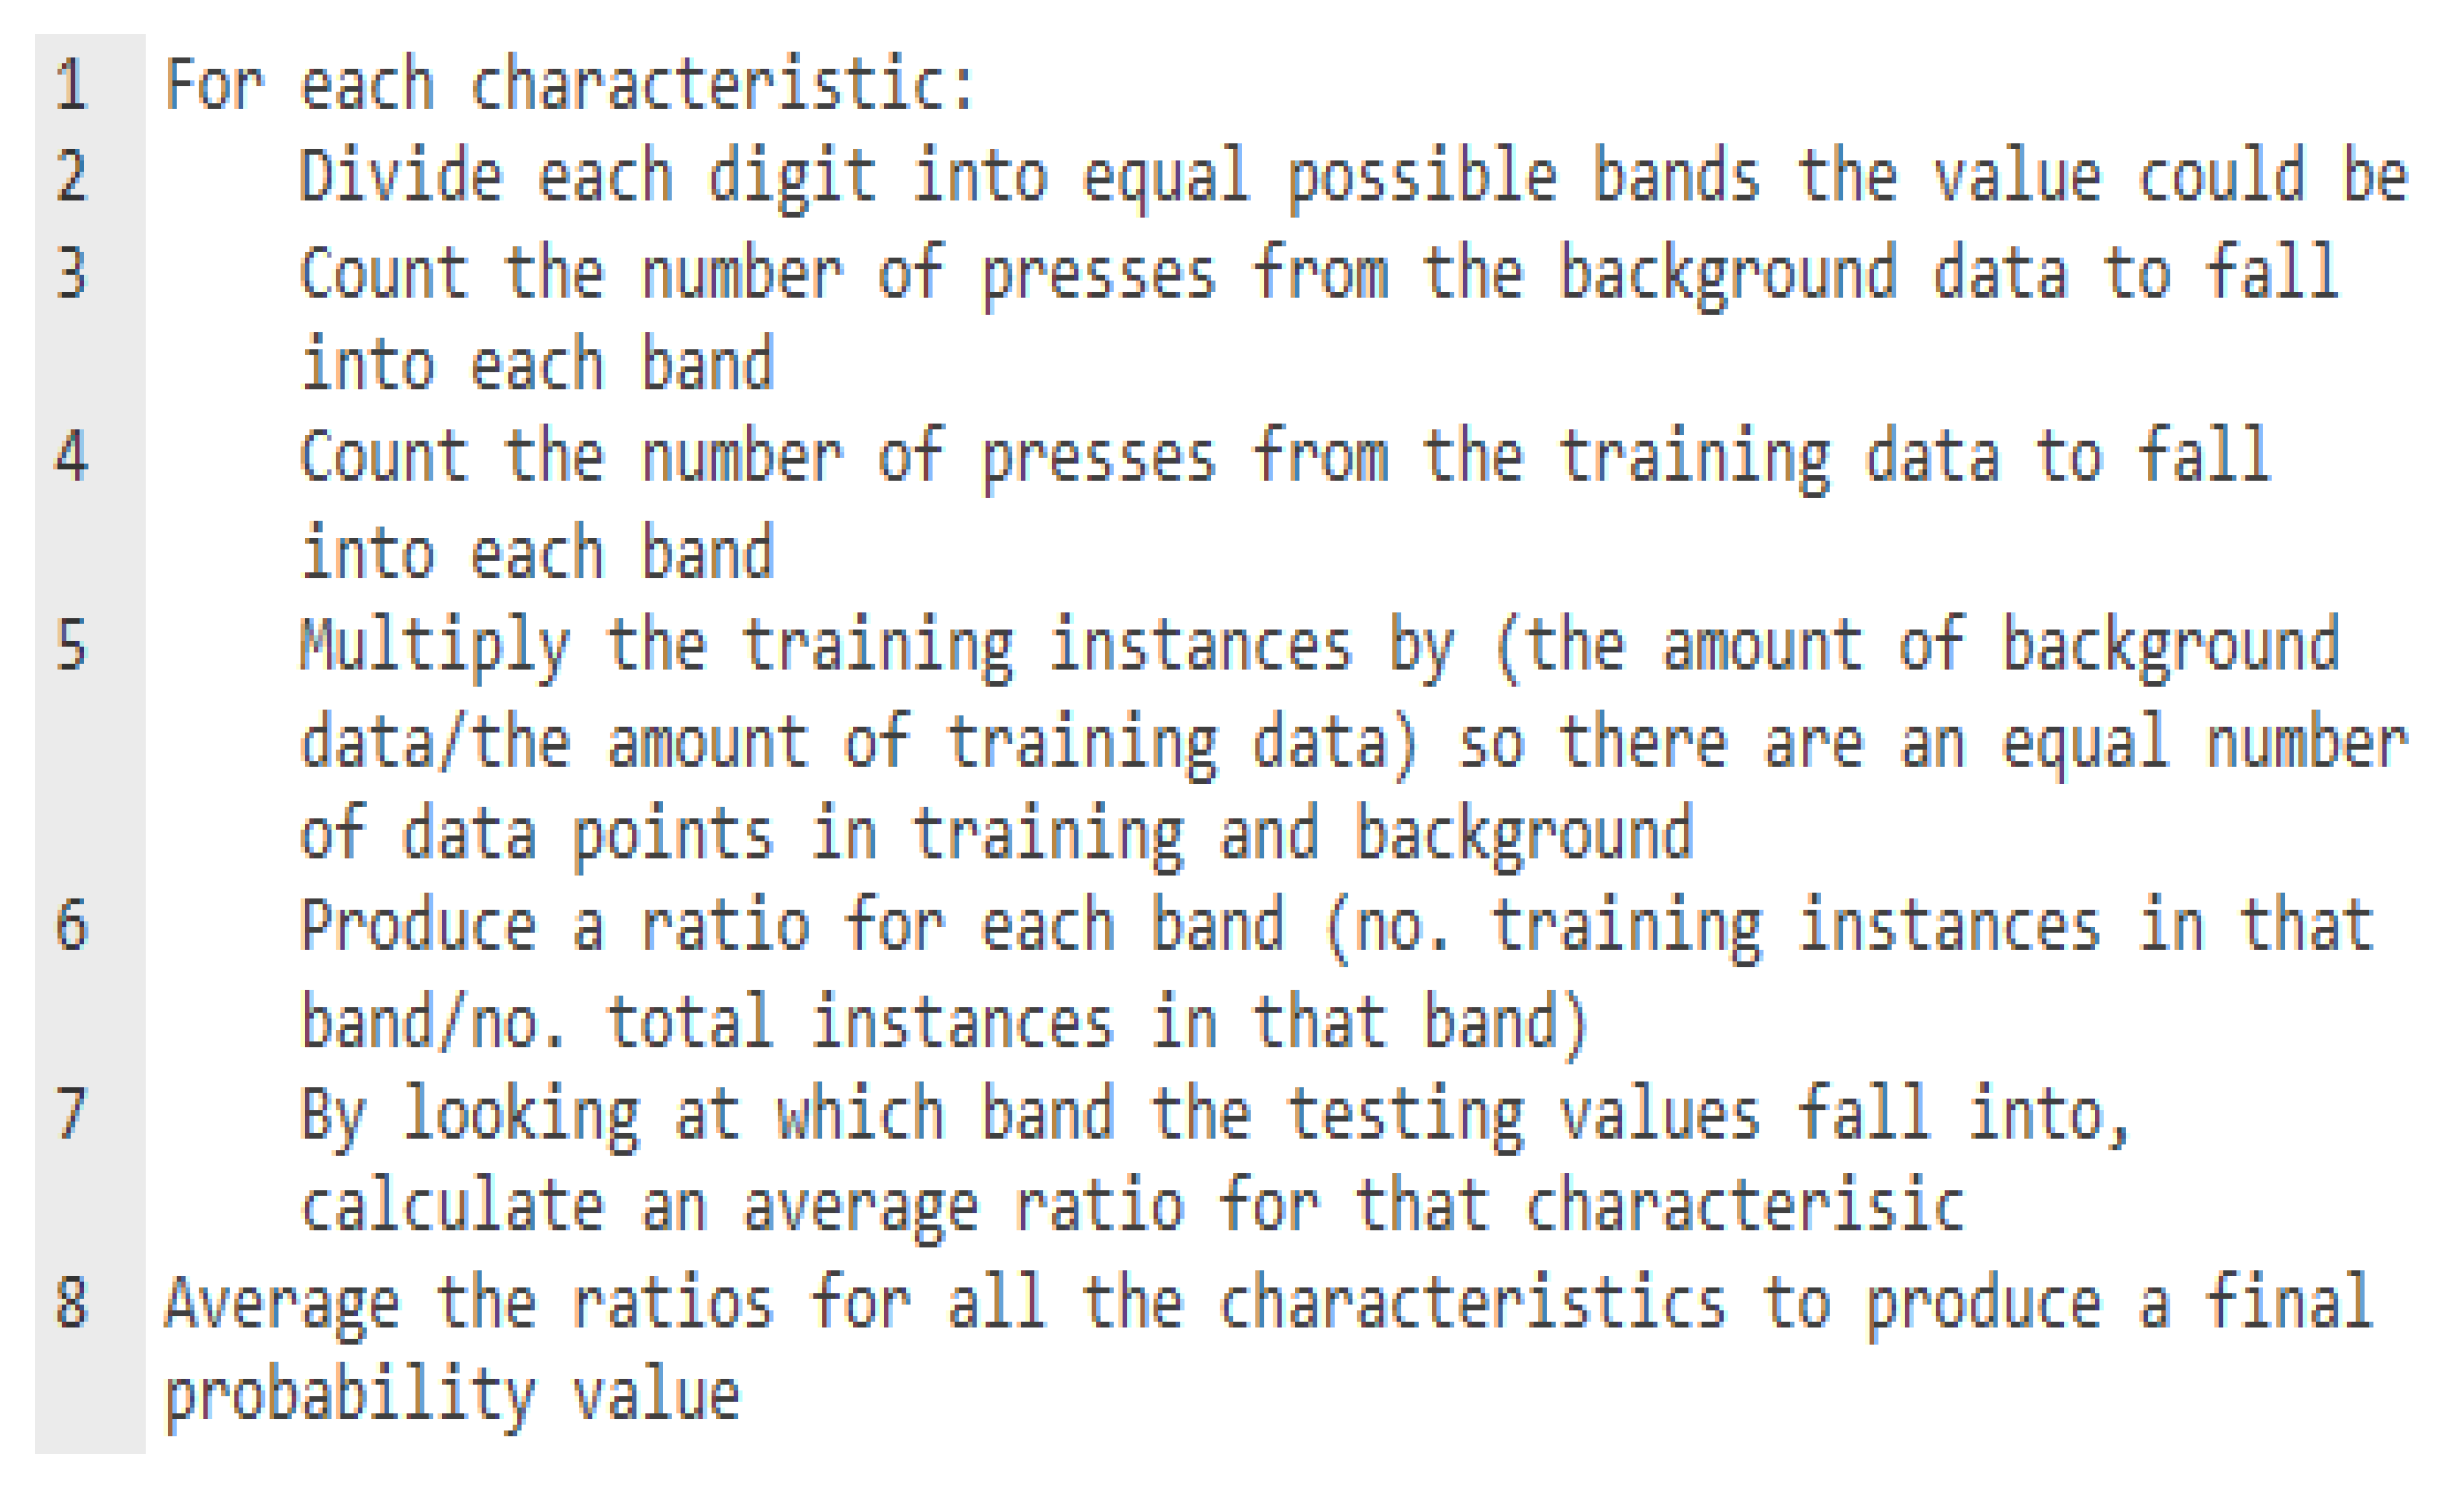
To calculate the probability that a characteristic of a press belongs to the user, the background and training data are compared at the value from the press data. First, if there are fewer datasets for the training data than there are for the background, the data must be normalised. In this case, 100 datapoints were used for background data, but only 10 for training data. To weight each instance equally, each instance of the training data is multiplied by the fraction that they differ from the background data by (in this case 10), resulting in the same number of instances for the two types of data. Next, the number of those instances that belong to the user divides the total number of instances in the section that the press data falls into (both user data and background data). This provides a number between zero and one, correlating to the probability of the press belonging to the user rather than to someone else, where zero means that there are no user instances in that section and one means there are no background instances in that section, only user instances. A value of 0.5 means the data is as likely to belong to the user as it is to belong to someone else. A value above 0.5 suggests that the data belongs to the user, while a value below this suggests that the data does not. The relevant pseudocode is shown in Figure 6.

5. Evaluation

5.1. Survey

To collect data to train and test the proposed mechanism, a survey was conducted where people were asked to enter a password onto the number pad. The password was 6193225307 (chosen using https://www.random.org/) and each participant was asked to enter the password onto the number pad in whatever way they wanted. Fourteen people gave eleven repetitions of the password to provide background and testing data, another ten people provided training data and subsequent correct testing data, and eight other people gave data to use as incorrect users. Thirty-two people were involved in the survey, with over 500 repetitions of the password used.
Ten sets of ten passwords were used as the background data for the second algorithm, thus giving 100 instances of each digit in the password against which the probability algorithm could compare. Ten separate users gave training data, and each of them tested the trained algorithms by entering the password another ten times and recording the results. The trained algorithms were then tested by using ten passwords from multiple incorrect users (users whose data were used to test the algorithms were not the same users whose data was used for the background data, and all testing data were unique). In summary, for each user tested, ten passwords trained the algorithm, while a further twenty (ten false and ten correct) tested it.

5.2. Results

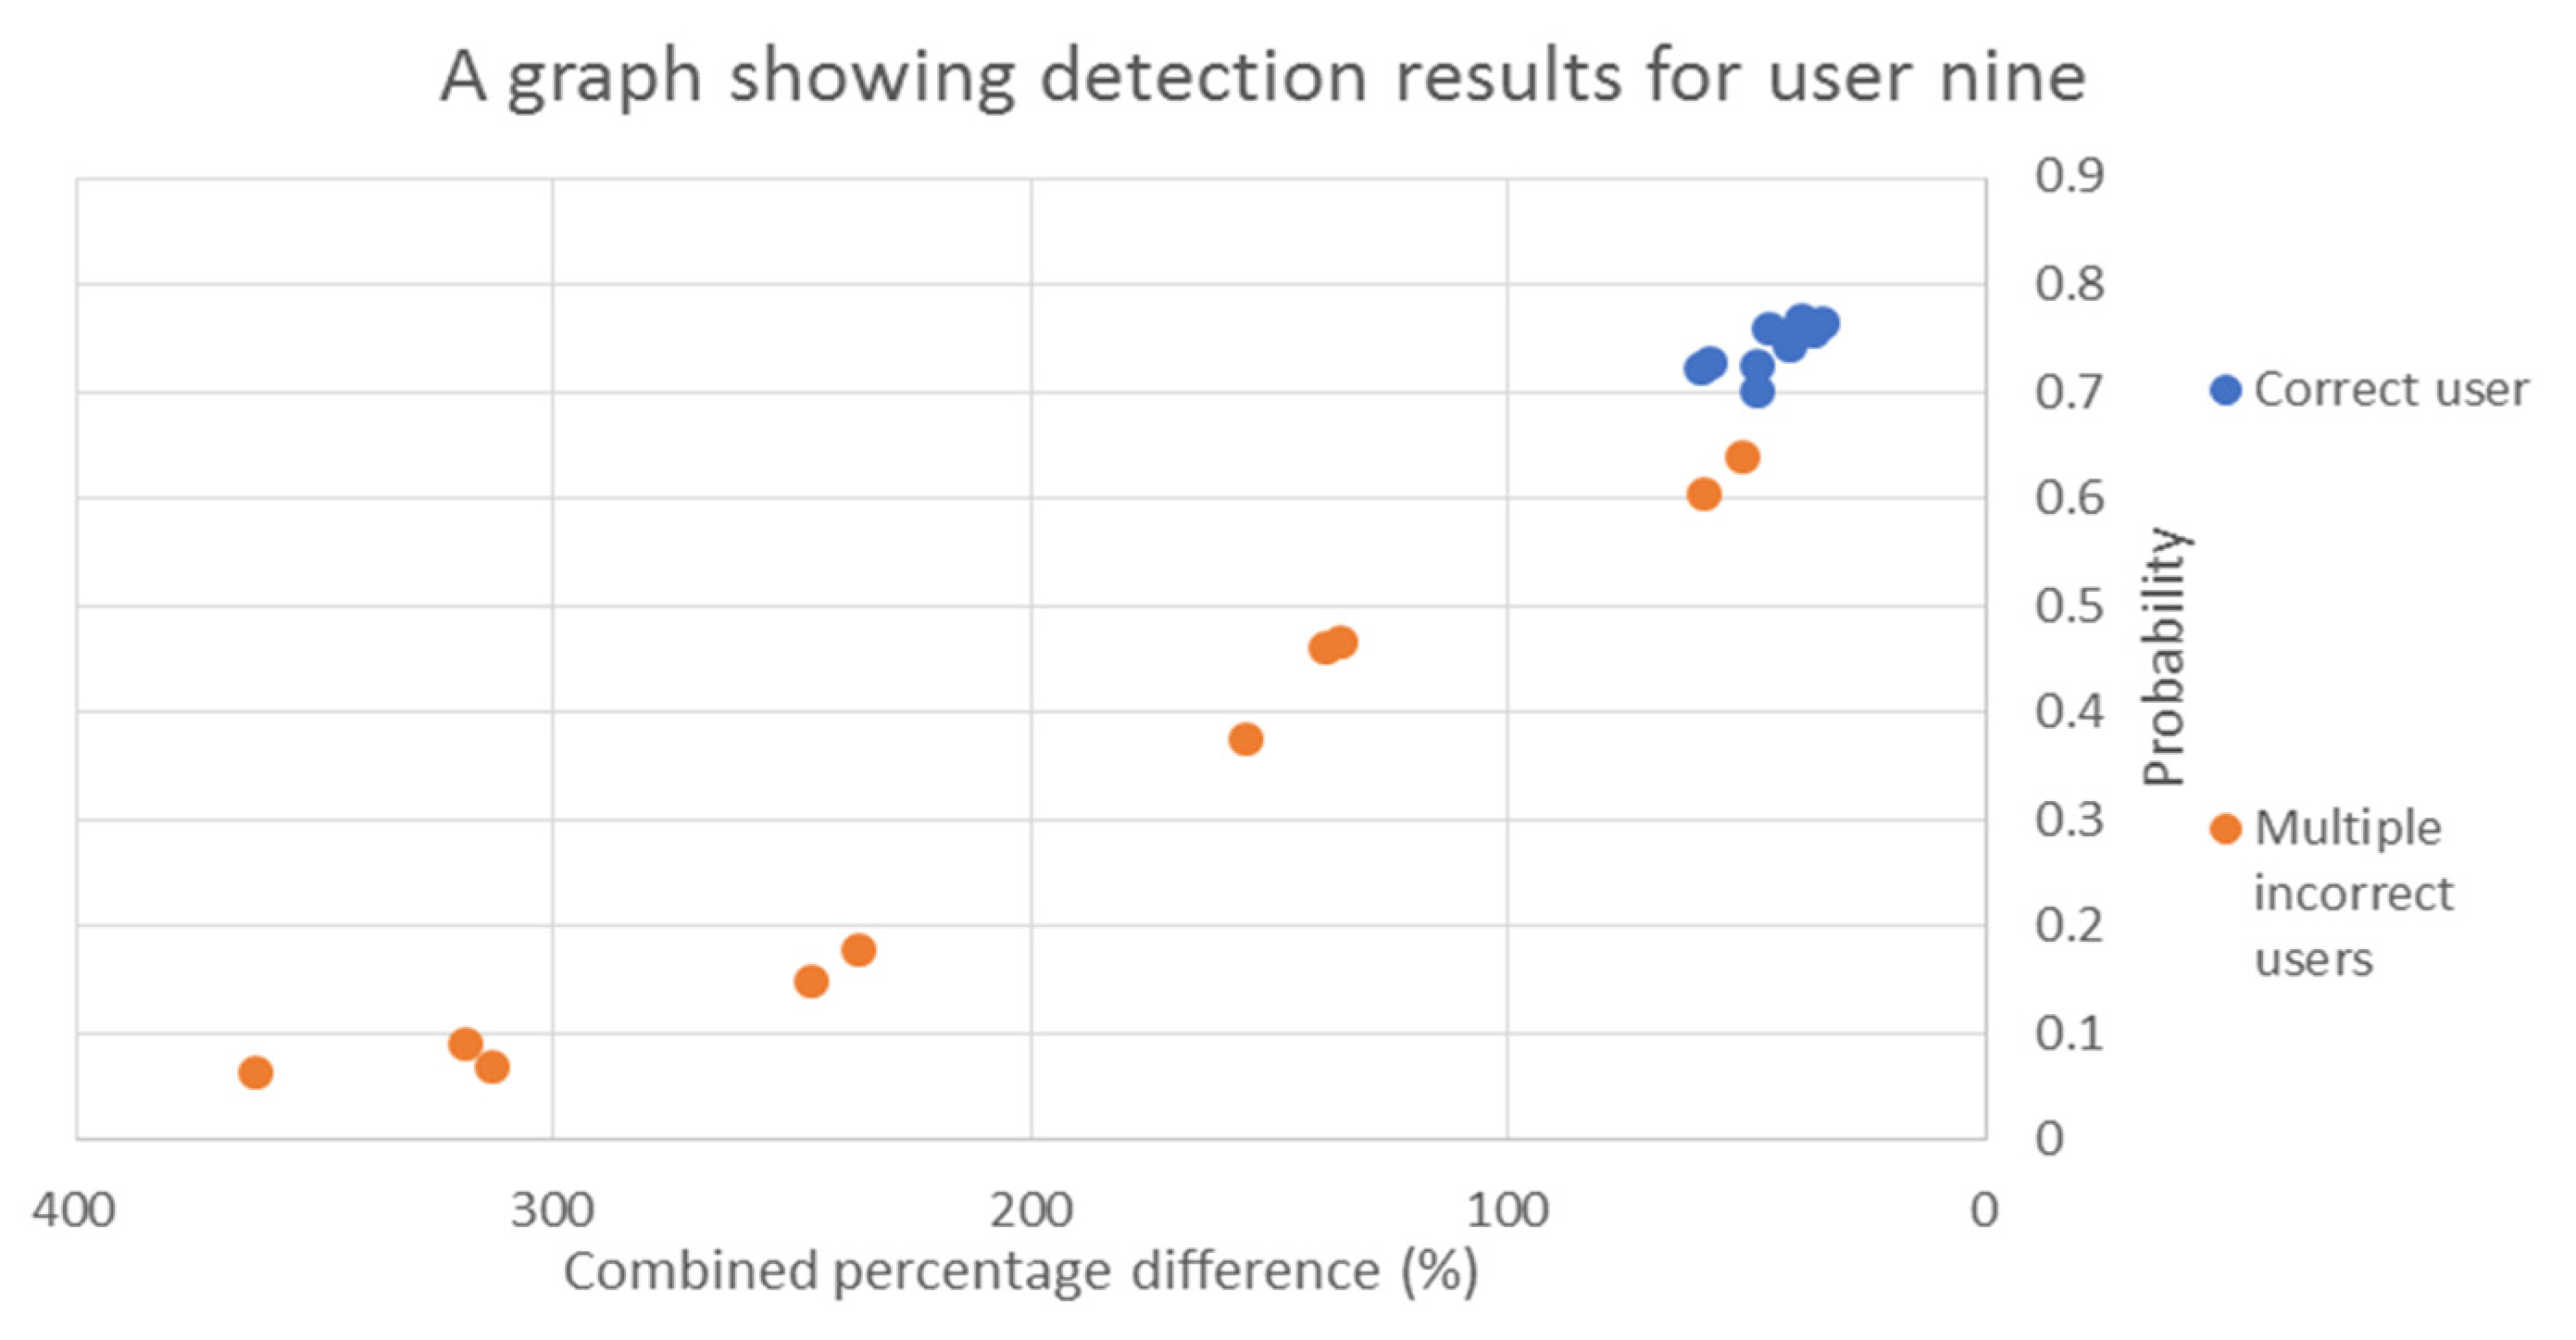
As expected, the results from the same user were similar to each other (shown in Figure 2). Two other factors show in the results, firstly that users who pressed the buttons in a specific way (always pressing the button to the maximum, or pressing the buttons quickly, for example) were less distinct from other users doing the same thing compared to others who did not. This is a relatively predictable result, as it shows that the algorithms are identifying the characteristics of the presses. The second factor is that the values for correct data varied per user, without necessarily effecting how well that user was recognised. For example, with one user the probability value for correct presses never fell below 0.65, with incorrect presses just above 0.6, whereas with another user correct values fell below 0.45, but incorrect values only reached 0.41. For both of these users, the algorithm completely distinguished the correct and incorrect passwords, but at different parts of the scale.
This shows that no fixed threshold should be used for verification with these algorithms. Therefore, thresholds were chosen for each user by selecting a threshold value such that probabilities greater than the threshold or percentage differences less than the threshold are accepted. The best possible threshold values were chosen, such that the maximum number of correct results was accepted while accepting the minimum number of incorrect results. Error rates for these thresholds could then be calculated by considering the number of falsely accepted or rejected passwords. Table 1 shows these error rates.
Many of the users managed to produce perfect results (four of the ten users for percentage difference, and six of the ten users for probability), whereas some users, for example, user 2, produced relatively high error rates. The primary factor for accurate verification was the congruence of button presses. Users who could enter their password the same way every time, both in training and testing, produced lower error rates than those whose passwords varied more. This was more of a factor than any particular method of pressing—both users who pressed buttons faster and those who pressed slower were among the results with zero error rates. In addition, worthy of note is that the more complex probability algorithm was more successful than the percentage difference algorithm.
An example of the results taken is shown in Figure 7. The graph shows the clustering of correct data from user 9 in the upper right. The incorrect data also cluster into four different groups, each one corresponding to the four different participants who provided incorrect data against which to test. Three of the groups are clearly distinct from the correct data, while the fourth is distinct only in probability. This is likely because user 9 and that incorrect user share a similar method of typing, in terms of speed and pressure. The probability algorithm is still able to separate the two, however, whereas the percentage algorithm has some overlap. To calculate errors, ideal thresholds are applied. For probability, this can be >0.65, giving zero errors. For percentage, the best threshold is <58, giving one falsely accepted datapoint and one falsely rejected datapoint, so FAR = FRR = 10%.
The average error rates are 4.50% for the probability algorithm and 8.50% for the percentage difference algorithm. By keeping presses consistent, one might expect better results, but it must be mentioned that the thresholds chosen are ideal for the data and therefore may, in practice, give worse results. However, if this system was to be adopted, then it is expected that a better algorithm could be developed and drastically lower the error rate. For a prototype, these results do suggest that very low error rates are possible in practice. Achieving such results with relatively basic algorithms and hardware suggests that a complete system should be successful.

5.3. Comparison with Existing Techniques

This paper differs from most papers using analogue keystroke dynamics because the system is on a keypad, not a full keyboard as shown in details in Table 2. Logically speaking, authenticating on a keypad would be harder, because there are fewer unique keys to compare against, and generally fewer fingers are used when keying in passcodes. Although possible implementations have been suggested [24], the terror rates for previous systems have been relatively high. For example, the accuracy is only 40% in [25], and the equal error rate (EER) (i.e., the maximum of (FAR, FRR)) is 10% in [26].
The majority of most previous studies into keystroke dynamics only use digital timing data. While this means that conventional keyboards or number pads can be used, taking additional data allows for more complex and accurate authentication algorithms, reducing error rates. Studies using static statistical analysis (in the way that this study does) on a keyboard have given error rates from 0.25% to 6% FAR and 1.45% to 12% FRR [13]. Araujo et al. and Bleha et al. give examples of such results [16,27]. These studies used whole keyboards rather than the ten buttons of a number pad, and may have had more complex algorithms for authentication, so the 4.5% average error rate for the probability-based algorithm in this study suggests that the analogue measurements are effective, and a good choice for the limited space available on a hardware token. They are also more effective than the purely maximum-pressure-based systems, which only reported a 40% average accuracy [25]. Similar previous studies that used neural methods instead of statistical ones showed a notable improvement in the error rates, with a study giving an average error rate of 1% in [28]. This suggests that the proposed system with analogue measurements may be able to achieve even better results using neural methods.
The proposed system has a number of advantages over previous studies. The system can be self-contained—the prototype used a raspberry pi for all computation, and such a processor could be embedded onto the number pad to make it one unit, no bigger than a normal number pad. Studies have shown good results for analogue data in the past [22], but these have mostly been situated on a computer with an attached analogue keyboard, rather than a self-contained unit. A possible issue with this would be if a large neural net were used for computation, in which case the processing power of an embedded chip may not be sufficient [13,14]. This could be solved by doing the processing remotely, on the host machine or a server, or by generating the algorithm remotely and then loading the completed algorithm onto the keypad. While the prototype used linear motion potentiometers, a full system could use linear encoders or similar to save on price, and this would be cheaper than the force-sensitive resistors of past studies [22,25].

6. Conclusions

This paper has proposed a multi-factor authentication scheme to enhance the security of password perfection schemes, by introducing a biometric element based on keystroke dynamics.
It consists of using portable hardware token for each user’s authentication, which collects the password and the biometric data. A prototype of the proposed system has been designed and verified experimentally. The results indicated the feasibility of building dynamic keystroke-based authentication system that can achieve an average error rate of 4.5%, using minimal computation resources and without being invasive or time consuming for the user. Future extension of this work will explore the use of machine learning algorithms to reduce authentication errors. Another future direction on the design side includes expanding the current implementation to take into consideration temporally close keystrokes, this effectively means treating the entire password as an n-dimensional feature vector, which may provide better authentication.

Author Contributions

Conceptualization, B.H. and R.C. methodology, B.H. and R.C.; software, R.C.; validation, B.H. and R.C.; formal analysis, B.H. and R.C.; investigation, B.H. and R.C.; original draft preparation, R.C.; writing—review and editing, B.H. All authors have read and agreed to the published version of the manuscript.

Funding

This research received no external funding.

Conflicts of Interest

The authors declare no conflict of interest.

References

  1. Tian, Z.; Qiao, H.; Tian, J.; Zhu, H.; Li, X. An Automated Brute Force Method Based on Webpage Static Analysis. In Proceedings of the 2018 10th International Conference on Measuring Technology and Mechatronics Automation (ICMTMA), Changsha, China, 10–11 February 2018; pp. 100–103. [Google Scholar]
  2. Crocker, P.; Querido, P. Two Factor Encryption in Cloud Storage Providers Using Hardware Tokens. In Proceedings of the 2015 IEEE Globecom Workshops (GC Wkshps), San Diego, CA, USA, 6–10 December 2015; pp. 1–6. [Google Scholar]
  3. Nobayashi, D.; Nakamura, Y.; Ikenaga, T.; Hori, Y. Development of Single Sign-On System with Hardware Token and Key Management Server. In Proceedings of the 2007 Second International Conference on Systems and Networks Communications (ICSNC 2007), Cap Esterel, France, 25–31 August 2007; p. 73. [Google Scholar]
  4. Halak, B. Physically Unclonable Functions: From Basic Design Principles to Advanced Hardware Security Applications; Springer International Publishing: New York, NY, USA, 2018. [Google Scholar]
  5. Yilmaz, Y.; Gunn, S.R.; Halak, B. Lightweight PUF-Based Authentication Protocol for IoT Devices. In Proceedings of the 2018 IEEE 3rd International Verification and Security Workshop (IVSW), Costa Brava, Spain, 2–4 July 2018; pp. 38–43. [Google Scholar]
  6. Su, H.; Zwolinski, M.; Halak, B. A Machine Learning Attacks Resistant Two Stage Physical Unclonable Functions Design. In Proceedings of the 2018 IEEE 3rd International Verification and Security Workshop (IVSW), Costa Brava, Spain, 2–4 July 2018; pp. 52–55. [Google Scholar]
  7. Mispan, M.S.; Su, H.; Zwolinski, M.; Halak, B. Cost-efficient design for modeling attacks resistant PUFs. In Proceedings of the 2018 Design, Automation & Test in Europe Conference & Exhibition (DATE), Dresden, Germany, 19–23 March 2018; pp. 467–472. [Google Scholar]
  8. Halak, B. Security Attacks on Physically Unclonable Functions and Possible Countermeasures. In Physically Unclonable Functions: From Basic Design Principles to Advanced Hardware Security Applications; Springer International Publishing: Cham, Switzerland, 2018; pp. 131–182. [Google Scholar]
  9. Halak, B. Hardware-Based Security Applications of Physically Unclonable Functions. In Physically Unclonable Functions: From Basic Design Principles to Advanced Hardware Security Applications; Halak, B., Ed.; Springer International Publishing: Cham, Switzerland, 2018; pp. 183–227. [Google Scholar]
  10. Marasco, E.; Feldman, A.; Romine, K.R. Enhancing Optical Cross-Sensor Fingerprint Matching Using Local Textural Features. In Proceedings of the 2018 IEEE Winter Applications of Computer Vision Workshops (WACVW), Lake Tahoe, NV, USA, 15 March 2018; pp. 37–43. [Google Scholar]
  11. Haware, S.; Barhatte, A. Retina based biometric identification using SURF and ORB feature descriptors. In Proceedings of the 2017 International conference on Microelectronic Devices, Circuits and Systems (ICMDCS), Vellore, India, 10–12 August 2017; pp. 1–6. [Google Scholar]
  12. Epp, C.; Lippold, M.; Mandryk, R.L. Identifying emotional states using keystroke dynamics. In Proceedings of the Proceedings of the SIGCHI Conference on Human Factors in Computing Systems, CHI 2011, Vancouver, BC, Canada, 7–12 May 2011; pp. 715–724. [Google Scholar]
  13. Crawford, H. Keystroke dynamics: Characteristics and opportunities. In Proceedings of the 2010 Eighth International Conference on Privacy, Security and Trust, Ottawa, ON, Canada, 17–19 August 2010; pp. 205–212. [Google Scholar]
  14. Maiorana, E.; Campisi, P.; González-Carballo, N.; Neri, A. Keystroke dynamics authentication for mobile phones. In Proceedings of the 2011 ACM Symposium on Applied Computing (SAC), TaiChung, Taiwan, 21–24 March 2011. [Google Scholar]
  15. Anusas-Amornkul, T.; Wangsuk, K. A comparison of keystroke dynamics techniques for user authentication. In Proceedings of the 2015 International Computer Science and Engineering Conference (ICSEC), Zhengzhou, China, 19 July 2015; pp. 1–5. [Google Scholar]
  16. Araujo, L.; Sucupira, L.; Lizarraga, M.; Ling, L.; Yabu-Uti, J. User authentication through typing biometrics features. IEEE Trans. Signal Process. 2005, 53, 851–855. [Google Scholar] [CrossRef]
  17. Darabseh, A.; Namin, A.S. On Accuracy of Classification-Based Keystroke Dynamics for Continuous User Authentication. In Proceedings of the 2015 International Conference on Cyberworlds (CW), Visby, Sweden, 7–9 October 2015; pp. 321–324. [Google Scholar]
  18. Ahmed, A.A.; Traore, I. Biometric Recognition Based on Free-Text Keystroke Dynamics. IEEE Trans. Cybern. 2013, 44, 458–472. [Google Scholar] [CrossRef] [PubMed]
  19. Roth, J.; Liu, X.; Ross, A.; Metaxas, D. Investigating the Discriminative Power of Keystroke Sound. IEEE Trans. Inf. Forensics Secur. 2015, 10, 333–345. [Google Scholar] [CrossRef]
  20. Zhou, Q.; Yang, Y.; Hong, F.; Feng, Y.; Guo, Z. User Identification and Authentication Using Keystroke Dynamics with Acoustic Signal. In Proceedings of the 2016 12th International Conference on Mobile Ad-Hoc and Sensor Networks (MSN), Hefei, China, 16–18 December 2016; pp. 445–449. [Google Scholar]
  21. Teh, P.S.; Yue, S.; Teoh, A.B.J. Improving keystroke dynamics authentication system via multiple feature fusion scheme. In Proceedings of the 2012 International Conference on Cyber Security, Cyber Warfare and Digital Forensic (CyberSec), Kuala Lumpur, Malaysia, 26–28 June 2012; pp. 277–282. [Google Scholar]
  22. Sulavko, A.; Eremenko, A.V.; Fedotov, A.A. Users’ identification through keystroke dynamics based on vibration parameters and keyboard pressure. In Proceedings of the 2017 Dynamics of Systems, Mechanisms and Machines (Dynamics), Omsk, Russia, 14–16 November 2017; pp. 1–7. [Google Scholar]
  23. Sulong, A.; Siddiqi, M.U. Intelligent keystroke pressure-based typing biometrics authentication system using radial basis function network. In Proceedings of the 2011 IEEE 7th International Colloquium on Signal Processing and Its Applications, Kuala Lumpur, Malaysia, 6–8 March 2009; pp. 151–155. [Google Scholar]
  24. Leberknight, C.S.; Widmeyer, G.R.; Recce, M.L. An Investigation into the Efficacy of Keystroke Analysis for Perimeter Defense and Facility Access. In Proceedings of the 2008 IEEE Conference on Technologies for Homeland Security, Waltham, MA, USA, 12–13 May 2008; pp. 345–350. [Google Scholar]
  25. Loh, S.X.C.; Ow-Yong, H.Y.; Lim, H.Y.; Lai, W.K.; Lim, L.L. Fuzzy inference for user identification of pressure-based keystroke biometrics. In Proceedings of the 2017 IEEE 15th Student Conference on Research and Development (SCOReD), Putrajaya, Malaysia, 13–14 December 2017; pp. 77–82. [Google Scholar]
  26. Grabham, N.; White, N. Use of a Novel Keypad Biometric for Enhanced User Identity Verification. In Proceedings of the 2008 IEEE Instrumentation and Measurement Technology Conference, Victoria, BC, Canada, 12–15 May 2008; pp. 12–16. [Google Scholar]
  27. Bleha, S.; Slivinsky, C.; Hussien, B. Computer-access security systems using keystroke dynamics. IEEE Trans. Pattern Anal. Mach. Intell. 1990, 12, 1217–1222. [Google Scholar] [CrossRef]
  28. Cho, S.; Han, C.; Han, D.H.; Kim, H.-I. Web-Based Keystroke Dynamics Identity Verification Using Neural Network. J. Organ. Comput. Electron. Commer. 2000, 10, 295–307. [Google Scholar] [CrossRef]
Figure 1. A system block diagram.
Cryptography 04 00012 g001
Figure 2. A graph showing the clustering effect of the length of press of different users when typing the same password.
Cryptography 04 00012 g002
Figure 3. The top and bottom of the complete number pad. On the left, you can see the potentiometers as the small light blue squares with the shafts protruding up from them. The shafts each have a spring on them, and each key cap is screwed on top. The right picture shows how the wires from the potentiometers lead out through the holes, and the feet.
Cryptography 04 00012 g003
Figure 4. Pseudocode for the statistical algorithm.
Cryptography 04 00012 g004
Figure 5. Examples of the difference between training data and background data, (a) decay (9th key); (b) total average (7th key).
Cryptography 04 00012 g005
Figure 6. Pseudocode for the probability based algorithm.
Cryptography 04 00012 g006
Figure 7. The results of user 9’s training data.
Cryptography 04 00012 g007
Table 1. Error Rates.
User No.ProbabilityPercentage Difference
FARFRRFARFRR
10.00%0.00%0.00%0.00%
210.00%10.00%10.00%40.00%
30.00%0.00%0.00%0.00%
410.00%10.00%10.00%20.00%
510.00%10.00%30.00%0.00%
60.00%0.00%0.00%0.00%
730.00%0.00%10.00%0.00%
80.00%0.00%30.00%0.00%
90.00%0.00%10.00%10.00%
100.00%0.00%0.00%0.00%
Average6.00%3.00%10.00%7.00%
Table 2. Comparison with Existing Techniques.
User Authentication Technique Measured DataError Rates
Bleha et al. [27]Keyboard timing dataFalse Acceptance Rate (FAR) 0.5%, False Rejection Rate (FRR) 3.1%
Anusas-amornkul and Wangsuk [15]Keyboard timing dataEqual Error Rate (EER) 4–12%
Araujo et al. [16]Keyboard timing dataFAR 1.89%, FRR 1.45%
Darabseh and Namin [17]Continuous authenticationAround 20% error rate
Ahmed and Traore [18]Continuous authenticationAround 2% error rate
Roth et al. [19]Keystroke soundsAround 11% error rate
Zhou et al. [20]Keystroke soundsFAR 11%, FRR 12%
Sulong et al. [23]Keyboard pressure/displacementFAR 1.67%, FRR 0%
Sulavko et al. [22]Keyboard pressure/displacement0.6% error rate
Loh et al. [25]Number pad pressure/displacement60% error rate
Grabham and White [26]Number pad pressure/displacementEER 10%
This studyNumber pad pressure/displacement4.5% average error rate