
Optimized Protocol for Microalgae DNA Staining with SYTO9/SYBR Green I, Based on Flow Cytometry and RSM Methodology: Experimental Design, Impacts and Validation


Abstract
:1. Introduction
2. Experimental Design
2.1. Materials and Reagents
- Chromochloris zofingiensis SAG 211-14 (SAG culture strains collection, Göttingen, Lower Saxony, Germany).
- Dimethyl sulfoxide (DMSO) ROTIPURAN® ≥ 99.8% (Carl Roth GmbH + Co. KG, Karlsruhe, Baden-Württemberg, Germany, article number 4720.1).
- Bristol’s Modified (BM) medium (see [60] for the detailed composition).
- 0.9% NaCl solution.
- SYBRTM Green I Nucleic Acid Gel Stain (Thermo Fisher Scientific, Waltham, MA, USA; Cat.no.: S7563).
- SYTOTM 9 Green Fluorescent Nucleic Acid Stain (Thermo Fisher Scientific, Waltham, MA, USA; Cat.no.: S34854).
2.2. Equipment
- CyFlow Cube 8, equipped with 488 nm solid laser (SYSMEX GmbH, Norderstedt, Schleswig-Holstein, Germany).
- Eppendorf Thermomixer Comfort (Eppendorf AG, Hamburg, Germany; Cat.no.: 5355).
- GENESYSTM 150 UV-Visible Spectrophotometer (Thermo Fisher Scientific, Waltham, MA, USA; Cat.no.: 840-300000).
3. Procedure
3.1. Strain Cultivation Conditions
3.2. Preparation of Stock Solutions
- The stock solutions of SYBR Green I (100 X) and Syto 9 (10 µM) were prepared in DMSO in opaque plastic Falcon tubes, from an initial commercial solution of (10,000 X) and (5 mM), respectively. They were transferred to 1.5 mL, opaque Eppendorf tubes and frozen at −20 °C, for storage.
- ⚠ CRITICAL STEP: it is preferable to avoid the use of glass materials during preparation to prevent dye adsorption on the walls.
- ⚠ CRITICAL STEP: both dyes should be protected from light when preparing, using and storing the stock solutions to avoid their photodegradation.
3.3. Sample Preparation
- 2.
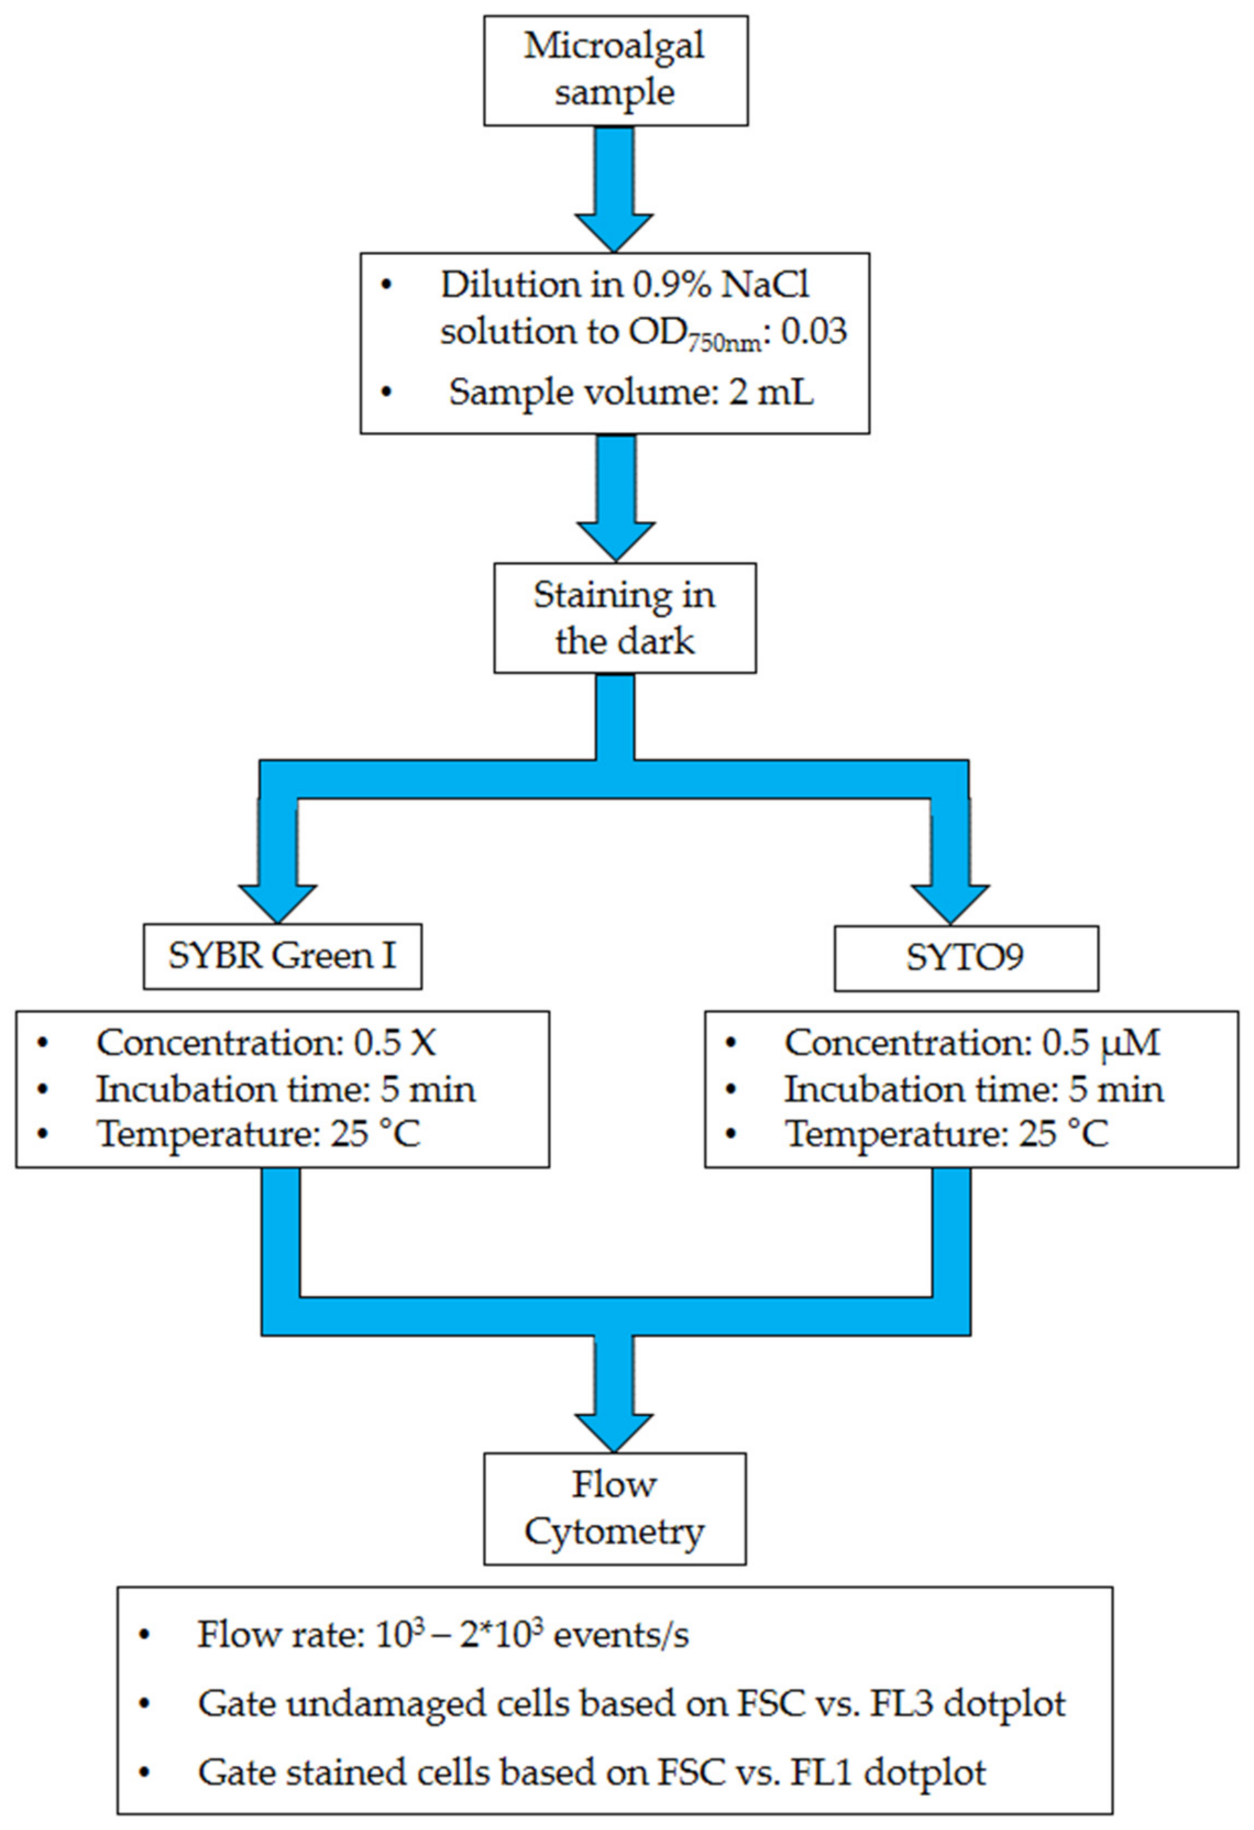
- Cell broth from the shake flasks was diluted in a 0.9% NaCl solution, in a plastic Falcon tube, to a cell density of 7.5 ∗ 106–8 ∗ 106 cells/mL (OD750nm approx. 0.03.)
3.4. Sample Staining
- 3.
- To stain 2 mL of sample solution, we calculated the volume of dye stock solution to be used, corresponding to the final concentration for every run, according to the CCD design (Table 2).
- ⚠ CRITICAL STEP: before use, allow the tubes containing the stock solution to warm at room temperature and then briefly centrifuge before every use to mix the DMSO with the dye.
- 4.
- After staining, put the Eppendorf tubes in the Thermomixer, at 350 rpm, for continuous mixing, with an incubation time and staining temperature according to the CCD design (Table 2).
- ⚠ CRITICAL STEP: at the end of the incubation time and before cytometric measurement, centrifuge briefly to obtain a homogeneous mixture.
3.5. Cytometric Measurements
- 5.
- Chlorophyll fluorescence was measured in the FL3 channel (675 ± 50 nm) and dye fluorescence was measured in the FL1 channel (520 ± 20 nm), as were forward scattered (FSC) and side scattered (SSC) light.
- ⚠ CRITICAL STEP: before starting the measurements, set the flow rate of the cytometer to approximately 103–2 ∗ 103 events per second, to be sure to detect all the cells and avoid detecting duplicates.
3.6. Cytometric Data Analyses
- 6.
- For each detected event, numerical values for its chlorophyll fluorescence (FL3), dye fluorescence (FL1) and forward (FSC) and side (SSC) scattering were recorded in (fcs) files. FCS ExpressTM software (De Novo Software, Pasadena, CA, USA) was used to process these collected data.
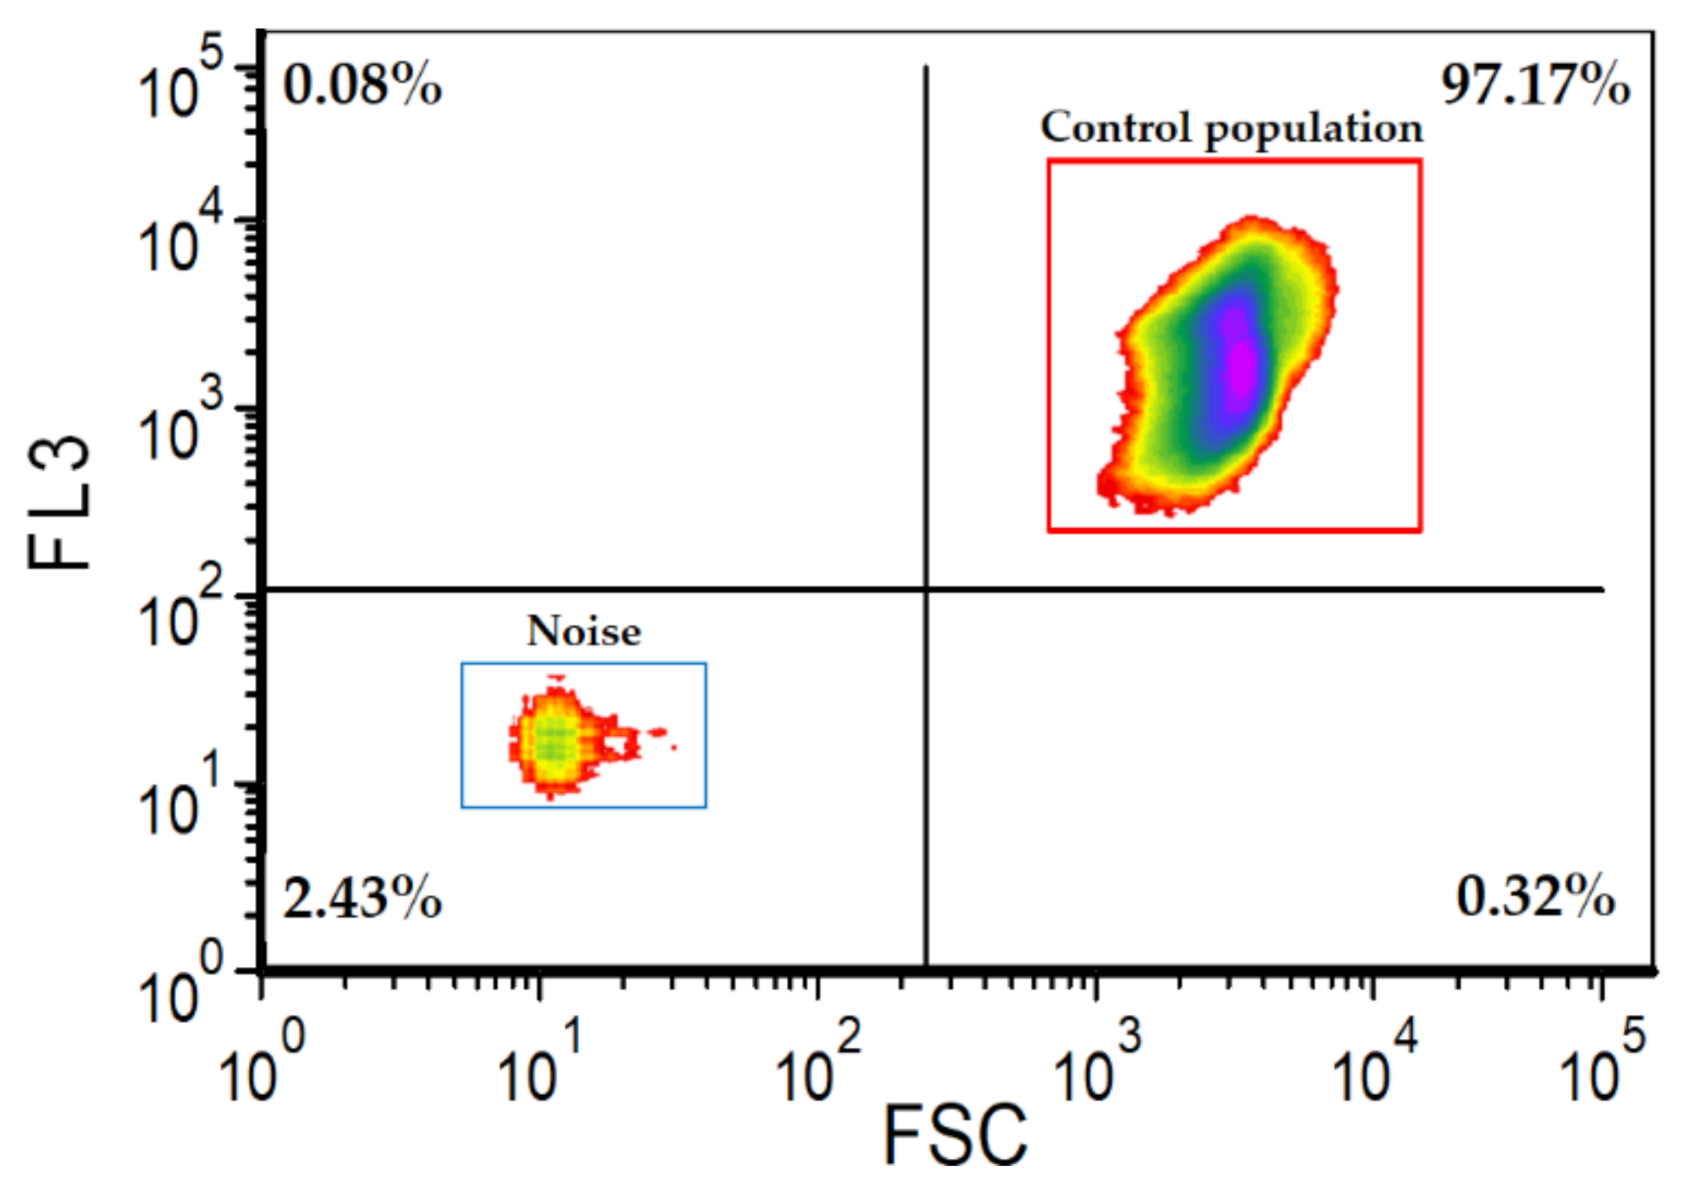
- 7.
- ⚠ CRITICAL STEP: cytometric analysis of at least a triplicate of the microalgae sample without staining is required in order to estimate the microalgae population that will serve as a control. In this study, the microalgae control population represented 97% ± 0.3 (values were calculated based on a triplicate).
3.6.1. Damaged Cells
- 8.
3.6.2. Staining Efficiency
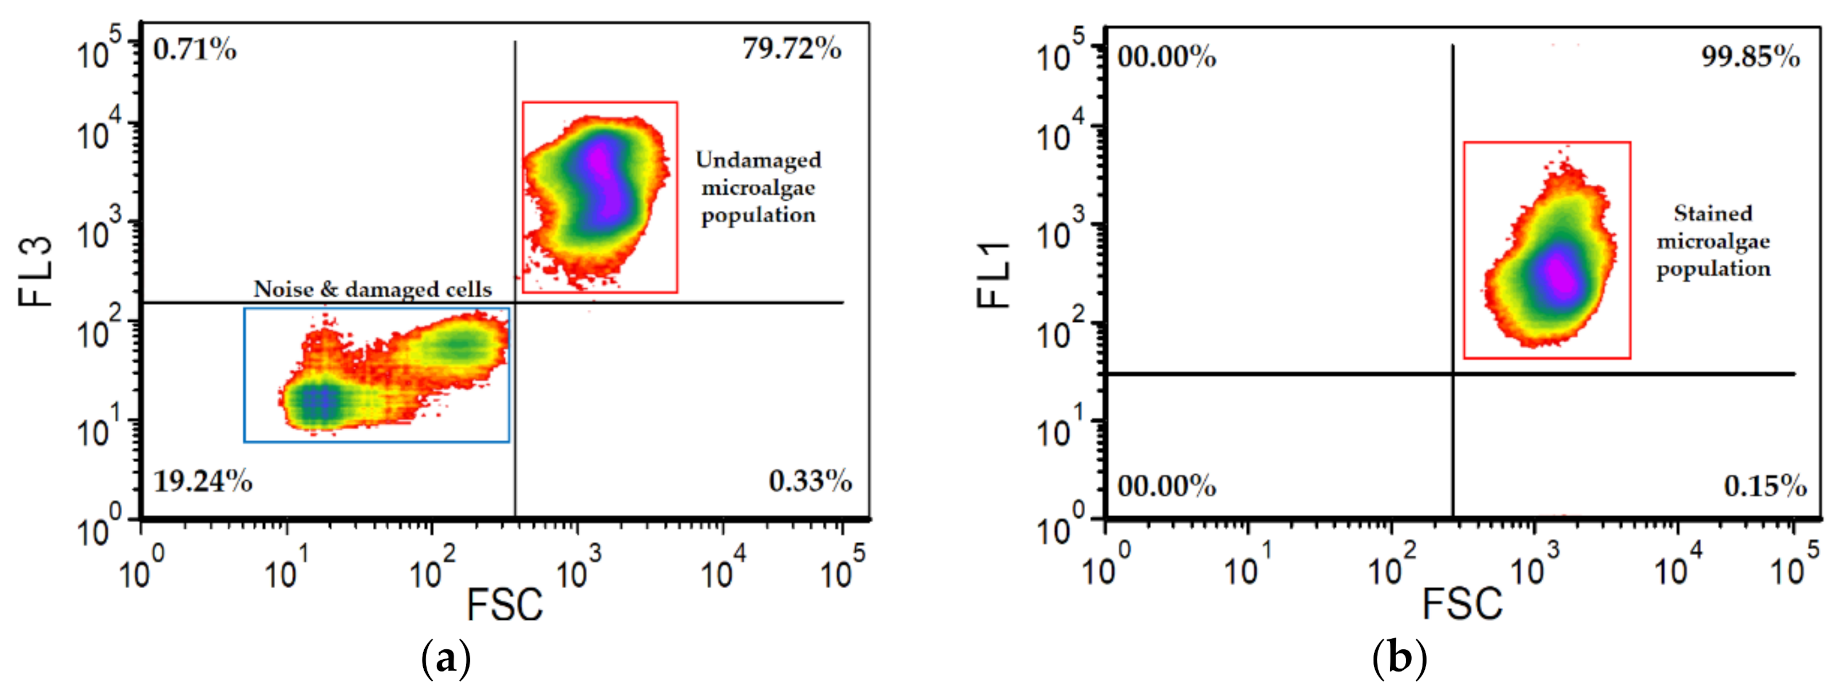
- 9.
- The staining efficiency was determined after staining by estimating what percentage of the undamaged microalgae population have cells with stained DNA (Figure 2b).
3.7. Statistical Analysis
4. Results and Discussion
4.1. DOE—Output Responses and Model Fitting
4.2. Analysis of Variance (ANOVA)
4.3. Protocol Optimization and Validation
5. Conclusions
Author Contributions
Funding
Institutional Review Board Statement
Informed Consent Statement
Data Availability Statement
Acknowledgments

Conflicts of Interest
References
- Di Caprio, F.; Posani, S.; Altimari, P.; Concas, A.; Pagnanelli, F. Single Cell Analysis of Microalgae and Associated Bacteria Flora by Using Flow Cytometry. Biotechnol. Bioprocess Eng. 2021, 26, 898–909. [Google Scholar] [CrossRef]
- Patel, A.K.; Albarico, F.P.J.B.; Perumal, P.K.; Vadrale, A.P.; Nian, C.T.; Chau, H.T.B.; Anwar, C.; Din Wani, H.M.U.D.; Pal, A.; Saini, R.; et al. Algae as an Emerging Source of Bioactive Pigments. Bioresour. Technol. 2022, 351, 126910. [Google Scholar] [CrossRef] [PubMed]
- Derakhshandeh, M.; Tezcan Un, U. Optimization of Microalgae Scenedesmus SP. Growth Rate Using a Central Composite Design Statistical Approach. Biomass Bioenergy 2019, 122, 211–220. [Google Scholar] [CrossRef]
- Hyka, P.; Lickova, S.; Přibyl, P.; Melzoch, K.; Kovar, K. Flow Cytometry for the Development of Biotechnological Processes with Microalgae. Biotechnol. Adv. 2013, 31, 2–16. [Google Scholar] [CrossRef]
- Zhu, X.; Meng, C.; Sun, F.; Wei, Z.; Chen, L.; Chen, W.; Tong, S.; Du, H.; Gao, J.; Ren, J.; et al. Sustainable Production of Astaxanthin in Microorganisms: The Past, Present, and Future. Crit. Rev. Food Sci. Nutr. 2022, 1–17. [Google Scholar] [CrossRef]
- Velmurugan, A.; Kodiveri Muthukaliannan, G. Genetic Manipulation for Carotenoid Production in Microalgae an Overview. Curr. Res. Biotechnol. 2022, 4, 221–228. [Google Scholar] [CrossRef]
- Toprak, S.F.; Dedeoğlu, S. Astaxanthin Protects against Hearing Impairment in Diabetic Rats. Braz. J. Otorhinolaryngol. 2022. [Google Scholar] [CrossRef]
- Silva, M.; Kamberovic, F.; Uota, S.; Kovan, I.-M.; Viegas, C.; Simes, D.; Katkam, G.; Varela, J.; Barreira, L. Microalgae as Potential Sources of Bioactive Compounds for Functional Foods and Pharmaceuticals. Appl. Sci. 2022, 12, 5877. [Google Scholar] [CrossRef]
- Srivastava, A.; Kalwani, M.; Chakdar, H.; Pabbi, S.; Shukla, P. Biosynthesis and Biotechnological Interventions for Commercial Production of Microalgal Pigments: A Review. Bioresour. Technol. 2022, 352, 127071. [Google Scholar] [CrossRef]
- Bárcenas-Pérez, D.; Lukeš, M.; Hrouzek, P.; Kubáč, D.; Kopecký, J.; Kaštánek, P.; Cheel, J. A Biorefinery Approach to Obtain Docosahexaenoic Acid and Docosapentaenoic Acid N-6 from Schizochytrium Using High Performance Countercurrent Chromatography. Algal Res. 2021, 55, 102241. [Google Scholar] [CrossRef]
- Satpati, G.G.; Pal, R. Rapid Detection of Neutral Lipid in Green Microalgae by Flow Cytometry in Combination with Nile Red Staining—An Improved Technique. Ann. Microbiol. 2015, 65, 937–949. [Google Scholar] [CrossRef]
- Wilkinson, M.G. Flow Cytometry as a Potential Method of Measuring Bacterial Viability in Probiotic Products: A Review. Trends Food Sci. Technol. 2018, 78, 1–10. [Google Scholar] [CrossRef]
- Robinson, J.P. Flow Cytometry: Past and Future. BioTechniques 2022, 72, 159–169. [Google Scholar] [CrossRef]
- Eren, F.; Aslan, M.; Kanarya, D.; Uysalli, Y.; Aydin, M.; Kiraz, B.; Aydin, O.; Kiraz, A. DeepCAN: A Modular Deep Learning System for Automated Cell Counting and Viability Analysis. IEEE J. Biomed. Health Inf. 2022, 1–9. [Google Scholar] [CrossRef]
- Deng, Y.; Wang, L.; Chen, Y.; Long, Y. Optimization of Staining with SYTO 9/Propidium Iodide: Interplay, Kinetics and Impact on Brevibacillus Brevis. BioTechniques 2020, 69, 88–98. [Google Scholar] [CrossRef]
- Buysschaert, B.; Byloos, B.; Leys, N.; Van Houdt, R.; Boon, N. Reevaluating Multicolor Flow Cytometry to Assess Microbial Viability. Appl. Microbiol. Biotechnol. 2016, 100, 9037–9051. [Google Scholar] [CrossRef]
- Christaki, U.; Courties, C.; Massana, R.; Catala, P.; Lebaron, P.; Gasol, J.M.; Zubkov, M.V. Optimized Routine Flow Cytometric Enumeration of Heterotrophic Flagellates Using SYBR Green I. Limnol. Oceanogr. Methods 2011, 9, 329–339. [Google Scholar] [CrossRef]
- Marie, D.; Partensky, F.; Jacquet, S.; Vaulot, D. Enumeration and Cell Cycle Analysis of Natural Populations of Marine Picoplankton by Flow Cytometry Using the Nucleic Acid Stain SYBR Green I. Appl. Environ. Microbiol. 1997, 63, 186–193. [Google Scholar] [CrossRef]
- Hammes, F.; Broger, T.; Weilenmann, H.-U.; Vital, M.; Helbing, J.; Bosshart, U.; Huber, P.; Peter Odermatt, R.; Sonnleitner, B. Development and Laboratory-Scale Testing of a Fully Automated Online Flow Cytometer for Drinking Water Analysis. Cytom. Part A 2012, 81A, 508–516. [Google Scholar] [CrossRef]
- Van Nevel, S.; Koetzsch, S.; Weilenmann, H.-U.; Boon, N.; Hammes, F. Routine Bacterial Analysis with Automated Flow Cytometry. J. Microbiol. Methods 2013, 94, 73–76. [Google Scholar] [CrossRef]
- Stiefel, P.; Schmidt-Emrich, S.; Maniura-Weber, K.; Ren, Q. Critical Aspects of Using Bacterial Cell Viability Assays with the Fluorophores SYTO9 and Propidium Iodide. BMC Microbiol. 2015, 15, 36. [Google Scholar] [CrossRef]
- McGoverin, C.; Robertson, J.; Jonmohamadi, Y.; Swift, S.; Vanholsbeeck, F. Species Dependence of SYTO 9 Staining of Bacteria. Front. Microbiol. 2020, 11, 545419. [Google Scholar] [CrossRef]
- Mazzini, G.; Danova, M. Fluorochromes for DNA Staining and Quantitation. In Histochemistry of Single Molecules: Methods and Protocols; Pellicciari, C., Biggiogera, M., Eds.; Methods in Molecular Biology; Springer: New York, NY, USA, 2017; Volume 1560, pp. 239–259. ISBN 978-1-4939-6788-9. [Google Scholar]
- Wang, M.; Ateia, M.; Hatano, Y.; Miyanaga, K.; Yoshimura, C. Novel Fluorescence-Based Method for Rapid Quantification of Live Bacteria in River Water and Treated Wastewater. Environ. Sci. Adv. 2022, 1, 30–36. [Google Scholar] [CrossRef]
- Pokorny, L.; Hausmann, B.; Pjevac, P.; Schagerl, M. How to Verify Non-Presence—The Challenge of Axenic Algae Cultivation. Cells 2022, 11, 2594. [Google Scholar] [CrossRef]
- Nescerecka, A.; Hammes, F.; Juhna, T. A Pipeline for Developing and Testing Staining Protocols for Flow Cytometry, Demonstrated with SYBR Green I and Propidium Iodide Viability Staining. J. Microbiol. Methods 2016, 131, 172–180. [Google Scholar] [CrossRef]
- Cirulis, J.T.; Strasser, B.C.; Scott, J.A.; Ross, G.M. Optimization of Staining Conditions for Microalgae with Three Lipophilic Dyes to Reduce Precipitation and Fluorescence Variability. Cytom. Part A 2012, 81A, 618–626. [Google Scholar] [CrossRef]
- Vítová, M.; Hendrychová, J.; Cepák, V.; Zachleder, V. Visualization of DNA-Containing Structures in Various Species of Chlorophyta, Rhodophyta and Cyanophyta Using SYBR Green I Dye. Folia Microbiol. 2005, 50, 333–340. [Google Scholar] [CrossRef]
- Krujatz, F.; Lode, A.; Brüggemeier, S.; Schütz, K.; Kramer, J.; Bley, T.; Gelinsky, M.; Weber, J. Green Bioprinting: Viability and Growth Analysis of Microalgae Immobilized in 3D-Plotted Hydrogels versus Suspension Cultures. Eng. Life Sci. 2015, 15, 678–688. [Google Scholar] [CrossRef]
- Čertnerová, D. Nuclei Isolation Protocols for Flow Cytometry Allowing Nuclear DNA Content Estimation in Problematic Microalgal Groups. J. Appl. Phycol. 2021, 33, 2057–2067. [Google Scholar] [CrossRef]
- Monis, P.T.; Giglio, S.; Saint, C.P. Comparison of SYTO9 and SYBR Green I for Real-Time Polymerase Chain Reaction and Investigation of the Effect of Dye Concentration on Amplification and DNA Melting Curve Analysis. Anal. Biochem. 2005, 340, 24–34. [Google Scholar] [CrossRef]
- Darzynkiewicz, Z.; Huang, X.; Zhao, H. Analysis of Cellular DNA Content by Flow Cytometry. Curr. Protoc. Immunol. 2017, 119, 5.7.1–5.7.20. [Google Scholar] [CrossRef] [PubMed]
- Darzynkiewicz, Z.; Juan, G.; Srour, E.F. Differential Staining of DNA and RNA. Curr. Protoc. Cytom. 2004, 30, 7.3.1–7.3.16. [Google Scholar] [CrossRef] [PubMed]
- Zachleder, V.; Ivanov, I.; Vítová, M.; Bišová, K. Cell Cycle Arrest by Supraoptimal Temperature in the Alga Chlamydomonas Reinhardtii. Cells 2019, 8, 1237. [Google Scholar] [CrossRef]
- Mazalova, P.; Šarhanová, P.; Ondřej, V.; Poulíčková, A. Quantification of DNA Content in Freshwater Microalgae Using Flow Cytometry: A Modified Protocol for Selected Green Microalgae. Fottea 2011, 11, 317–328. [Google Scholar] [CrossRef]
- Wlodkowic, D.; Skommer, J.; Faley, S.; Darzynkiewicz, Z.; Cooper, J.M. Dynamic Analysis of Apoptosis Using Cyanine SYTO Probes: From Classical to Microfluidic Cytometry. Exp. Cell Res. 2009, 315, 1706–1714. [Google Scholar] [CrossRef]
- Suzuki, T.; Fujikura, K.; Higashiyama, T.; Takata, K. DNA Staining for Fluorescence and Laser Confocal Microscopy. J. Histochem. Cytochem. 1997, 45, 49–53. [Google Scholar] [CrossRef]
- Rodríguez-Lázaro, D.; Hernández, M. Identification Methods Real-Time PCR. In Encyclopedia of Food Microbiology, 2nd ed.; Batt, C.A., Tortorello, M.L., Eds.; Academic Press: Oxford, UK, 2014; pp. 344–350. ISBN 978-0-12-384733-1. [Google Scholar]
- Dery, V.; Duah, N.O.; Ayanful-Torgby, R.; Matrevi, S.A.; Anto, F.; Quashie, N.B. An Improved SYBR Green-1-Based Fluorescence Method for the Routine Monitoring of Plasmodium Falciparum Resistance to Anti-Malarial Drugs. Malar. J. 2015, 14, 481. [Google Scholar] [CrossRef]
- Otto, F. DAPI Staining of Fixed Cells for High-Resolution Flow Cytometry of Nuclear DNA. In Methods in Cell Biology; Darzynkiewicz, Z., Crissman, H.A., Eds.; Flow Cytometry; Academic Press: Oxford, UK, 1990; Volume 33, pp. 105–110. [Google Scholar]
- Crissman, H.A.; Hirons, G.T. Staining of DNA in Live and Fixed Cells. In Methods in Cell Biology, 2nd ed.; Darzynkiewicz, Z., Paul Robinson, J., Crissman, H.A., Eds.; Flow Cytometry; Academic Press: Oxford, UK, 1994; Volume 41, pp. 195–209. [Google Scholar]
- Katayama, T.; Kishi, M.; Takahashi, K.; Furuya, K.; Wahid, M.E.A.; Khatoon, H.; Kasan, N.A. Isolation of Lipid-Rich Marine Microalgae by Flow Cytometric Screening with Nile Red Staining. Aquac. Int. 2019, 27, 509–518. [Google Scholar] [CrossRef]
- Loureiro, J.; Kron, P.; Temsch, E.M.; Koutecký, P.; Lopes, S.; Castro, M.; Castro, S. Isolation of Plant Nuclei for Estimation of Nuclear DNA Content: Overview and Best Practices. Cytom. Part A 2021, 99, 318–327. [Google Scholar] [CrossRef]
- Izumiyama, S.; Omura, M.; Takasaki, T.; Ohmae, H.; Asahi, H. Plasmodium Falciparum: Development and Validation of a Measure of Intraerythrocytic Growth Using SYBR Green I in a Flow Cytometer. Exp. Parasitol. 2009, 121, 144–150. [Google Scholar] [CrossRef]
- Bucevičius, J.; Lukinavičius, G.; Gerasimaitė, R. The Use of Hoechst Dyes for DNA Staining and Beyond. Chemosensors 2018, 6, 18. [Google Scholar] [CrossRef]
- Noble, R.T.; Fuhrman, J.A. Use of SYBR Green I for Rapid Epifluorescence Counts of Marine Viruses and Bacteria. Aquatic Microb. Ecol. 1998, 14, 113–118. [Google Scholar] [CrossRef]
- Gião, M.S.; Wilks, S.A.; Azevedo, N.F.; Vieira, M.J.; Keevil, C.W. Validation of SYTO 9/Propidium Iodide Uptake for Rapid Detection of Viable but Noncultivable Legionella Pneumophila. Microb. Ecol. 2008, 58, 56. [Google Scholar] [CrossRef]
- Lydon, M.J.; Keeler, K.D.; Thomas, D.B. Vital DNA Staining and Cell Sorting by Flow Microfluorometry. J. Cell. Physiol. 1980, 102, 175–181. [Google Scholar] [CrossRef]
- Haberkorn, I.; Off, C.L.; Besmer, M.D.; Buchmann, L.; Mathys, A. Automated Online Flow Cytometry Advances Microalgal Ecosystem Management as in Situ, High-Temporal Resolution Monitoring Tool. Front. Bioeng. Biotechnol. 2021, 9, 642671. [Google Scholar] [CrossRef]
- Koren, I.; Boussiba, S.; Khozin-Goldberg, I.; Zarka, A. Chromochloris Zofingiensis (Chlorophyceae) Divides by Consecutive Multiple Fission Cell-Cycle under Batch and Continuous Cultivation. Biology 2021, 10, 157. [Google Scholar] [CrossRef]
- Breig, S.J.M.; Luti, K.J.K. Response Surface Methodology: A Review on Its Applications and Challenges in Microbial Cultures. Mater. Today Proc. 2021, 42, 2277–2284. [Google Scholar] [CrossRef]
- Pereira, L.M.S.; Milan, T.M.; Tapia-Blácido, D.R. Using Response Surface Methodology (RSM) to Optimize 2G Bioethanol Production: A Review. Biomass Bioenergy 2021, 151, 106166. [Google Scholar] [CrossRef]
- Chelladurai, S.J.S.; Murugan, K.; Ray, A.P.; Upadhyaya, M.; Narasimharaj, V.; Gnanasekaran, S. Optimization of Process Parameters Using Response Surface Methodology: A Review. Mater. Today Proc. 2021, 37, 1301–1304. [Google Scholar] [CrossRef]
- Zhao, X.; Meng, X.; Liu, Y.; Bai, S.; Li, B.; Li, H.; Hou, N.; Li, C. Single-Cell Sorting of Microalgae and Identification of Optimal Conditions by Using Response Surface Methodology Coupled with Life-Cycle Approaches. Sci. Total Environ. 2022, 832, 155061. [Google Scholar] [CrossRef]
- Zahri, K.N.M.; Zulkharnain, A.; Gomez-Fuentes, C.; Sabri, S.; Abdul Khalil, K.; Convey, P.; Ahmad, S.A. The Use of Response Surface Methodology as a Statistical Tool for the Optimisation of Waste and Pure Canola Oil Biodegradation by Antarctic Soil Bacteria. Life 2021, 11, 456. [Google Scholar] [CrossRef] [PubMed]
- Yang, L.; Geng, Y.; Cui, D.; Liu, Z.; Xiong, Z.; Pavlostathis, S.G.; Shao, P.; Luo, X. Corrected Response Surface Methodology for Microalgae towards Optimized Ammonia Nitrogen Removal: A Case of Rare Earth Mining Tailings Wastewater in Southern Jiangxi, China. J. Clean. Prod. 2022, 343, 130998. [Google Scholar] [CrossRef]
- Khuri, A.I.; Mukhopadhyay, S. Response Surface Methodology. WIREs Comput. Stat. 2010, 2, 128–149. [Google Scholar] [CrossRef]
- Mäkelä, M. Experimental Design and Response Surface Methodology in Energy Applications: A Tutorial Review. Energy Convers. Manag. 2017, 151, 630–640. [Google Scholar] [CrossRef]
- Nazarpour, M.; Taghizadeh-Alisaraei, A.; Asghari, A.; Abbaszadeh-Mayvan, A.; Tatari, A. Optimization of Biohydrogen Production from Microalgae by Response Surface Methodology (RSM). Energy 2022, 253, 124059. [Google Scholar] [CrossRef]
- Ibañez, M.V.; Leonardi, R.J.; Heinrich, J.M.; Steingroewer, J.; Walther, T.; Felix, K. A rapid assessment of the radiative properties from a suspension of Chromochloris zofingiensis. J. Photochem. Photobiol. 2020, 3, 100007. [Google Scholar] [CrossRef]
- Manini, E.; Danovaro, R. Synoptic Determination of Living/Dead and Active/Dormant Bacterial Fractions in Marine Sediments. FEMS Microbiol. Ecol. 2006, 55, 416–423. [Google Scholar] [CrossRef]
- Shi, L.; Günther, S.; Hübschmann, T.; Wick, L.Y.; Harms, H.; Müller, S. Limits of Propidium Iodide as a Cell Viability Indicator for Environmental Bacteria. Cytom. Part A 2007, 71A, 592–598. [Google Scholar] [CrossRef]
- Prest, E.I.; Hammes, F.; Kötzsch, S.; Van Loosdrecht, M.C.M.; Vrouwenvelder, J.S. Monitoring Microbiological Changes in Drinking Water Systems Using a Fast and Reproducible Flow Cytometric Method. Water Res. 2013, 47, 7131–7142. [Google Scholar] [CrossRef]

| Independent Variables | Symbols | Unit | −1 Level | 0 Level | +1 Level |
|---|---|---|---|---|---|
| Dye Concentration | A | X *–µM ** | 1.21 *–0.6 ** | 2.25 *–0.75 ** | 3.3 *–0.9 ** |
| Incubation Time | B | min | 07 | 10 | 13 |
| Staining Temperature | C | °C | 22 | 25 | 28 |
| Run | Dye Concentration [X *–µM **] | Time [min] | Temperature [°C] | Staining Efficiency [%] | Damaged Cells [%] | |||||
|---|---|---|---|---|---|---|---|---|---|---|
| * | ** | * | ** | * | ** | * | ** | * | ** | |
| 01 | 2.25 | 0.6 | 10 | 7 | 20 | 22 | 99.83 | 99.76 | 51.29 | 18.19 |
| 02 | 3.3 | 0.75 | 13 | 10 | 28 | 25 | 99.79 | 99.71 | 42.37 | 16.74 |
| 03 | 1.21 | 0.75 | 7 | 10 | 28 | 20 | 99.84 | 99.76 | 38.32 | 22.1 |
| 04 | 2.25 | 0.75 | 10 | 10 | 30 | 25 | 99.81 | 99.87 | 36.24 | 23.94 |
| 05 | 1.21 | 0.75 | 13 | 10 | 22 | 25 | 99.87 | 99.85 | 40.21 | 27.12 |
| 06 | 2.25 | 0.9 | 10 | 7 | 25 | 28 | 99.65 | 99.79 | 26.74 | 24.07 |
| 07 | 4 | 0.9 | 10 | 7 | 25 | 22 | 99.82 | 99.81 | 70.52 | 28.41 |
| 08 | 3.3 | 1 | 7 | 10 | 28 | 25 | 99.8 | 99.86 | 44.53 | 32.71 |
| 09 | 2.25 | 0.75 | 10 | 15 | 25 | 25 | 99.76 | 99.85 | 52.57 | 23.33 |
| 10 | 2.25 | 0.9 | 15 | 13 | 25 | 28 | 99.8 | 99.77 | 44.99 | 18.57 |
| 11 | 1.21 | 0.9 | 7 | 13 | 22 | 22 | 99.79 | 99.8 | 34.21 | 25.08 |
| 12 | 1.21 | 0.6 | 13 | 7 | 28 | 28 | 99.74 | 99.72 | 20.92 | 11.7 |
| 13 | 2.25 | 0.75 | 5 | 5 | 25 | 25 | 99.78 | 99.81 | 40.55 | 24.3 |
| 14 | 2.25 | 0.5 | 10 | 10 | 25 | 25 | 99.72 | 99.78 | 32.79 | 13.89 |
| 15 | 3.3 | 0.6 | 13 | 13 | 22 | 28 | 99.85 | 99.71 | 53.79 | 9.6 |
| 16 | 2.25 | 0.75 | 10 | 10 | 25 | 25 | 99.83 | 99.82 | 44.99 | 19.99 |
| 17 | 3.3 | 0.75 | 7 | 10 | 22 | 30 | 99.84 | 99.75 | 53.25 | 14.35 |
| 18 | 2.25 | 0.75 | 10 | 10 | 25 | 25 | 99.84 | 99.83 | 48.41 | 22.19 |
| 19 | 2.25 | 0.6 | 10 | 13 | 25 | 22 | 99.79 | 99.75 | 43.85 | 14.31 |
| 20 | 0.5 | 0.75 | 10 | 10 | 25 | 25 | 99.67 | 99.82 | 14.16 | 19.8 |
| Damaged Cells | ||||||
|---|---|---|---|---|---|---|
| Source | SYBR Green I | |||||
| SS | DF | MS | F-Value | p-Value | Adjusted R2 | |
| Linear * | 480.53 | 11 | 43.68 | 0.4534 | 0.8726 | 0.618 |
| 2FI | 380.35 | 8 | 47.54 | 0.4935 | 0.8212 | 0.579 |
| Quadratic | 378.11 | 5 | 75.62 | 0.7849 | 0.6015 | 0.454 |
| Cubic | 13.99 | 1 | 13.99 | 0.1453 | 0.7188 | 0.476 |
| Pure error | 481.7 | 5 | 96.34 | |||
| SYTO9 | ||||||
| Linear * | 92.49 | 11 | 8.41 | 0.6395 | 0.7511 | 0.719 |
| 2FI | 91.44 | 8 | 11.43 | 0.8693 | 0.5914 | 0.656 |
| Quadratic | 40.7 | 5 | 8.14 | 0.619 | 0.6942 | 0.6977 |
| Cubic | 29.67 | 1 | 29.67 | 2.26 | 0.1934 | 0.548 |
| Pure error | 65.74 | 5 | 13.15 | |||
| Source | SYBR Green I | SYTO9 | ||
|---|---|---|---|---|
| F-Value | p-Value | F-Value | p-Value | |
| Model | 11.26 | 0.0003 * | 17.21 | <0.0001 * |
| A—Dye Concentration | 29.28 | <0.0001 * | 40.53 | <0.0001 * |
| B—Incubation Time | 0.0375 | 0.8488 | 2 | 0.1763 |
| C—Staining Temperature | 4.48 | 0.0504 | 9.11 | 0.0082 * |
| Lack of Fit | 0.4534 | 0.8726 | 0.6395 | 0.7511 |
| Staining Dye | Responses | |||||||
|---|---|---|---|---|---|---|---|---|
| Optimum Conditions | Desirability | Damaged Cells [%] | Staining Efficiency [%] | |||||
| Dye Concentration | Incubation Time | Staining Temperature | Predicted | Actual | Predicted | Actual | ||
| SYBR Green I | 0.5 X | 5 min | 25 °C | 1 | 23.32 | 13.75 | 99.77 | 99.60 |
| SYTO9 | 0.5 µM | 5 min | 25 °C | 0.93 | 13.43 | 12.86 | 99.74 | 99.80 |
Publisher’s Note: MDPI stays neutral with regard to jurisdictional claims in published maps and institutional affiliations. |
© 2022 by the authors. Licensee MDPI, Basel, Switzerland. This article is an open access article distributed under the terms and conditions of the Creative Commons Attribution (CC BY) license (https://creativecommons.org/licenses/by/4.0/).
Share and Cite
Ihadjadene, Y.; Walther, T.; Krujatz, F. Optimized Protocol for Microalgae DNA Staining with SYTO9/SYBR Green I, Based on Flow Cytometry and RSM Methodology: Experimental Design, Impacts and Validation. Methods Protoc. 2022, 5, 76. https://doi.org/10.3390/mps5050076
Ihadjadene Y, Walther T, Krujatz F. Optimized Protocol for Microalgae DNA Staining with SYTO9/SYBR Green I, Based on Flow Cytometry and RSM Methodology: Experimental Design, Impacts and Validation. Methods and Protocols. 2022; 5(5):76. https://doi.org/10.3390/mps5050076
Chicago/Turabian StyleIhadjadene, Yob, Thomas Walther, and Felix Krujatz. 2022. "Optimized Protocol for Microalgae DNA Staining with SYTO9/SYBR Green I, Based on Flow Cytometry and RSM Methodology: Experimental Design, Impacts and Validation" Methods and Protocols 5, no. 5: 76. https://doi.org/10.3390/mps5050076
APA StyleIhadjadene, Y., Walther, T., & Krujatz, F. (2022). Optimized Protocol for Microalgae DNA Staining with SYTO9/SYBR Green I, Based on Flow Cytometry and RSM Methodology: Experimental Design, Impacts and Validation. Methods and Protocols, 5(5), 76. https://doi.org/10.3390/mps5050076