Application of Three-Dimensional Culture Method in the Cardiac Conduction System Research


Abstract
:1. Introduction
2. Experimental Design
2.1. Materials and Reagents
2.1.1. Culture Vessels
- 8-Well chamber slides (Nunc™ Lab-Tek™ II CC2™ Chamber Slide System, Cat# 154941).
- CELLSTAR μClear 96-well flat bottom microplates for cell culture (Greiner Bio-One 655090, Fisher Scientific, Ottawa, ON, Canada, Cat#07000166).
2.1.2. Growth Media, Supplements and Drugs
- Dulbecco’s Modified Eagles Medium (DMEM; Wisent, Cat#319-005-CL)
- 10%. Fetal Bovine Serum (FBS; MilliporeSigma, Oakville, ON, Canada, Cat#F1051).
- 1× Antibiotic/Antimycotic (1× Ab/Am; Gibco, Thermo Fisher, Mississauga, ON, Canada, Cat#15240-062)
- Atrial natriuretic peptide (ANP; Bachem, Torrance, CA, USA, Cat#4030380)
- A71915 (A7, Natriuretic peptide receptor A inhibitor; Bachem, Cat#4030385)
2.1.3. Cell Isolation Reagents and Basement Membrane Extracts
- 0.2%. v/v type I Collagenase (Worthington Biochemical Corp., Lakewood, NJ, USA, Cat#LS004196)
- Cultrex PathClear Basement Membrane Extract (BME), (R&D System, Minneapolis, MN, USA, Cat#3432-005-01), stock concentration: 12–18 mg/mL.
- Cultrex PathClear Reduced Growth Factor BME, (R&D System, Cat#3433-001-01), stock concentration: 12–18 mg/mL.
- Gibco™ Geltrex™ LDEV-Free Reduced Growth Factor Basement Membrane Matrix, (Fisher scientific, Cat#A1413201), stock concentration: 12–18 mg/mL.
- Fibronectin (MilliporeSigma, Cat#F1141), stock concentration 1 mg/mL.
2.1.4. Cell Culture Fixing
2.1.5. Immunostaining, Western Blotting and In-Cell Western Reagents
- Connexin 40 (Cx40)/Gap junction alpha-5 Protein (CXA-5) antibodies- Rabbit Anti-mouse Cx40 IgG (Alpha Diagnostic International, San Antonio, TX, USA, Cat# Cx40-A); Western blotting—used at 1:660 dilution (1.5 µg/mL). Immunocytochemistry—used at 1:150 dilution (6.67 µg/mL).
- Sarcomeric myosin antibody. (Developmental Studies Hybridoma Bank, Iowa, Cat#MF20). Immunocytochemistry—1:150 dilution (0.15 µg/mL)
- Pan-Cadherin antibody (Thermo Fisher Scientific, Cat#71-7100), Western Blotting—1:200 dilution (1.25 µg/mL)
- Anti-rabbit IgG (H+L) secondary antibody, Alexa Fluor 488 (Thermo Fisher, Cat#A21206), 1:150 dilution (13.3 μg/mL).
- Anti-rabbit IgG (H+L) DyLight 800 PEG conjugate (New England Biolabs, Whitby, ON, Canada, Cat#515P), 1:150 dilution (6.67 μg/mL).
- Anti-mouse IgG (H+L) DyLight 680 conjugate (New England Bioloabs, Cat#5470P), 1:150 dilution (6.67 μg/mL).
- Hoechst Dye 33,258 (MilliporeSigma, Cat#14530), 1 mg/mL stock, 1 in 20,000 dilution.
- Immunofluorescence (IF) blocking solution [IF buffer with 1% Goat anti-mouse F(ab’)2 IgG (Thermo Fisher, Cat#31166) and 10% goat serum (Thermo Fisher, Cat#16210064)
- Immunofluorescence (IF) Buffer (0.2% Triton X-100, 0.1% Bovine Serum Albumin and 0.05% Tween-20 in PBS with 7.7 mM sodium azide; store as aliquots at −20 °C for long term usage)
- PBS-glycine (100 mM Glycine in PBS)
2.1.6. Cell Extraction and Protein Extraction Reagents
- Cell wash Buffe, (Thermo Fisher scientific, Cat#SD251321)
- Phosphate Buffer Saline- (PBS; 0.138 M NaCl, 0.0027 M KCl, pH 7.4)
- PBS-EDTA (5 mM EDTA, 1 mM Sodium Orthovanadate and 1.5 mM Sodium Fluoride in PBS)
- Lysis Buffer [1% NP40, 5 mM EDTA, 150 mM sodium chloride and 50 mM Tris-HCL, pH 8.0 in PBS supplemented with phosphatase and protease inhibitor cocktail (Thermo Fisher, Cat#1861281) at 1:100 dilution and Aprotinin (MilliporeSigma, Cat#A6279) at 1:1000 dilution].
2.2. Equipment
- Cell Culture Hood, class II Type A2 Biological Safety Cabinet
- Cell Culture Incubator (5% CO2, 37 °C Temperature, Model#3110, ThermoForma)
- Centrifuge (Eppendorf, Model#5415D)
- Hemocytometer
- Inverted light microscope (Leica DMIL) with a camera (Leica DFC290HD) installed
- Sonicator (Model #100, Fisher Scientific)
- Zeiss LSM710-Laser Scanning Confocal Microscope
- LI-COR imaging system (Model#Odyssey CLx)
- Polarstar Omega Fluorescence Plate Reader (BMG Labtech)
3. Procedure
3.1. Storage and Handling of BME Matrix
3.1.1. Aliquoting and Freezing of BME Matrix
 CRITICAL
STEP: Frequent thawing of the matrix can lead to loss of polymerization efficiency. To avoid multiple freeze thaw cycles, the stock solution of BME matrix can be aliquoted into multiple tubes and stored at −80 °C. This procedure must be performed on the ice platform or any chilled surface. All tubes and pipette tips must be pre-chilled and placed on ice during aliquot preparation.
CRITICAL
STEP: Frequent thawing of the matrix can lead to loss of polymerization efficiency. To avoid multiple freeze thaw cycles, the stock solution of BME matrix can be aliquoted into multiple tubes and stored at −80 °C. This procedure must be performed on the ice platform or any chilled surface. All tubes and pipette tips must be pre-chilled and placed on ice during aliquot preparation. PAUSE STEP: All the aliquoted tubes must be stored at −80 °C immediately for future use.
3.1.2. Thawing of BME Matrix
CRITICAL STEP: BME matrix is thawed overnight in the 4 °C environment prior to starting a 3-D culture experiment. Because refrigeration temperatures may vary, the BME aliquots should be kept on ice in the refrigerator during the thawing process. PAUSE STEP: Thawed BME polymerizes rapidly at temperatures above 15 °C. It is important to keep it on ice to prevent its solidification prior to coating culture vessels. Pre-chilled pipette tips and tubes must be used to prevent untimely gelling of BME during the coating procedure.3.2. Embryonic Ventricular Cell Isolation
- Embryos (E11.5) from the timed-pregnant CD1 mice (Charles River Laboratories, Senneville, Quebec, QC, Canada) are taken out from the uterus by removing the placenta and kept in dishes containing PBS with 1× Ab/Am. The whole heart is removed from the embryo, and then the atria and outflow tracts are dissected out.
- Both ventricles from each embryonic heart are placed in 0.2% v/v type I Collagenase in 1× PBS (~10 ventricles in 1 mL) and incubated for 45 min at 37 °C on a rocking platform and the ventricular tissue is digested.
CRITICAL STEP: Collagenase digestion of E11.5 ventricles should not exceed 45 min for optimal cell viability and recovery. CRITICAL STEP: After 45 min of incubation, the tissue is triturated using a pipette tip for mechanical dissociation of the remaining tissue. Subsequently, dissociated tissue fragments are allowed to settle for 5 min for gravity separation of the fibrous tissue debris.- The supernatant is recovered, leaving debris in the tube, and the aqueous fraction containing cells is centrifuged at 1600 rcf (Eppendorf centrifuge, model#5415D) for 4 min at 4 °C. The supernatant is discarded, and the cell pellet is neutralized by two washes of culture media (DMEM containing 10% FBS and 1× Ab/Am).
- Finally, cells are resuspended using 10% FBS-DMEM, and the cell number is determined using a hemocytometer. The cell suspension is resuspended in media to achieve desired cell density for 3-D cultures.
PAUSE STEP: Dispersed cells can be stored on ice for 30 min to 2 h before plating on BME matrix. However, it is recommended to plate cells immediately after isolation.3.2.1. Embryonic Ventricular 3-D Cell Culture over the Matrix Bed
- Coat pre-chilled culture surface of 8-chambered slide with a thick layer of BME matrix in a sterile environment. The volume of the matrix needs to be optimized, but 60 µL/chamber is a good starting point. Pipette the matrix in the center of the chamber and spread uniformly over the surface using a pre-chilled pipette tip. Carefully spread the matrix in all the corners of the chambered slide.
CRITICAL STEP: BME matrix polymerizes and solidifies rapidly at room temperature. Working over ice platform or any chilled platform in the culture hood delays the polymerization process and makes the uniform spread of the matrix in chambers effortless. Uniform spreading of the matrix is a critical factor in this method. Uneven matrix bed can lead to cell accumulation in areas with a thin layer of matrix.- Let the coated surface dry for 15–30 min at 37 °C in the incubator but avoid over-drying to prevent dehydration.
- In the meantime, resuspend 125,000–250,000 cells in 100 µL of culture media (DMEM-10%FBS) per chamber. This volume is half of the complete media volume to be put in one chamber.
- After incubation of the pre-coated culture surface, pipette the mixture of embryonic ventricular cells and media over the matrix bed and incubate for 30 min in a cell culture incubator at 37 °C and 5% CO2.
- Chill the remaining media on ice and mix 10% volume of the matrix (100 µL media + 10 µL matrix/chamber). Gently mix this mixture homogeneously and pipette over the incubated culture along the wall of the chamber.
- Incubate the culture at 37 °C and 5% CO2 in the incubator. Depending on the experiment, treat the culture with desired drugs either during seeding of cells or a day after when the 3-D structure begins to form.
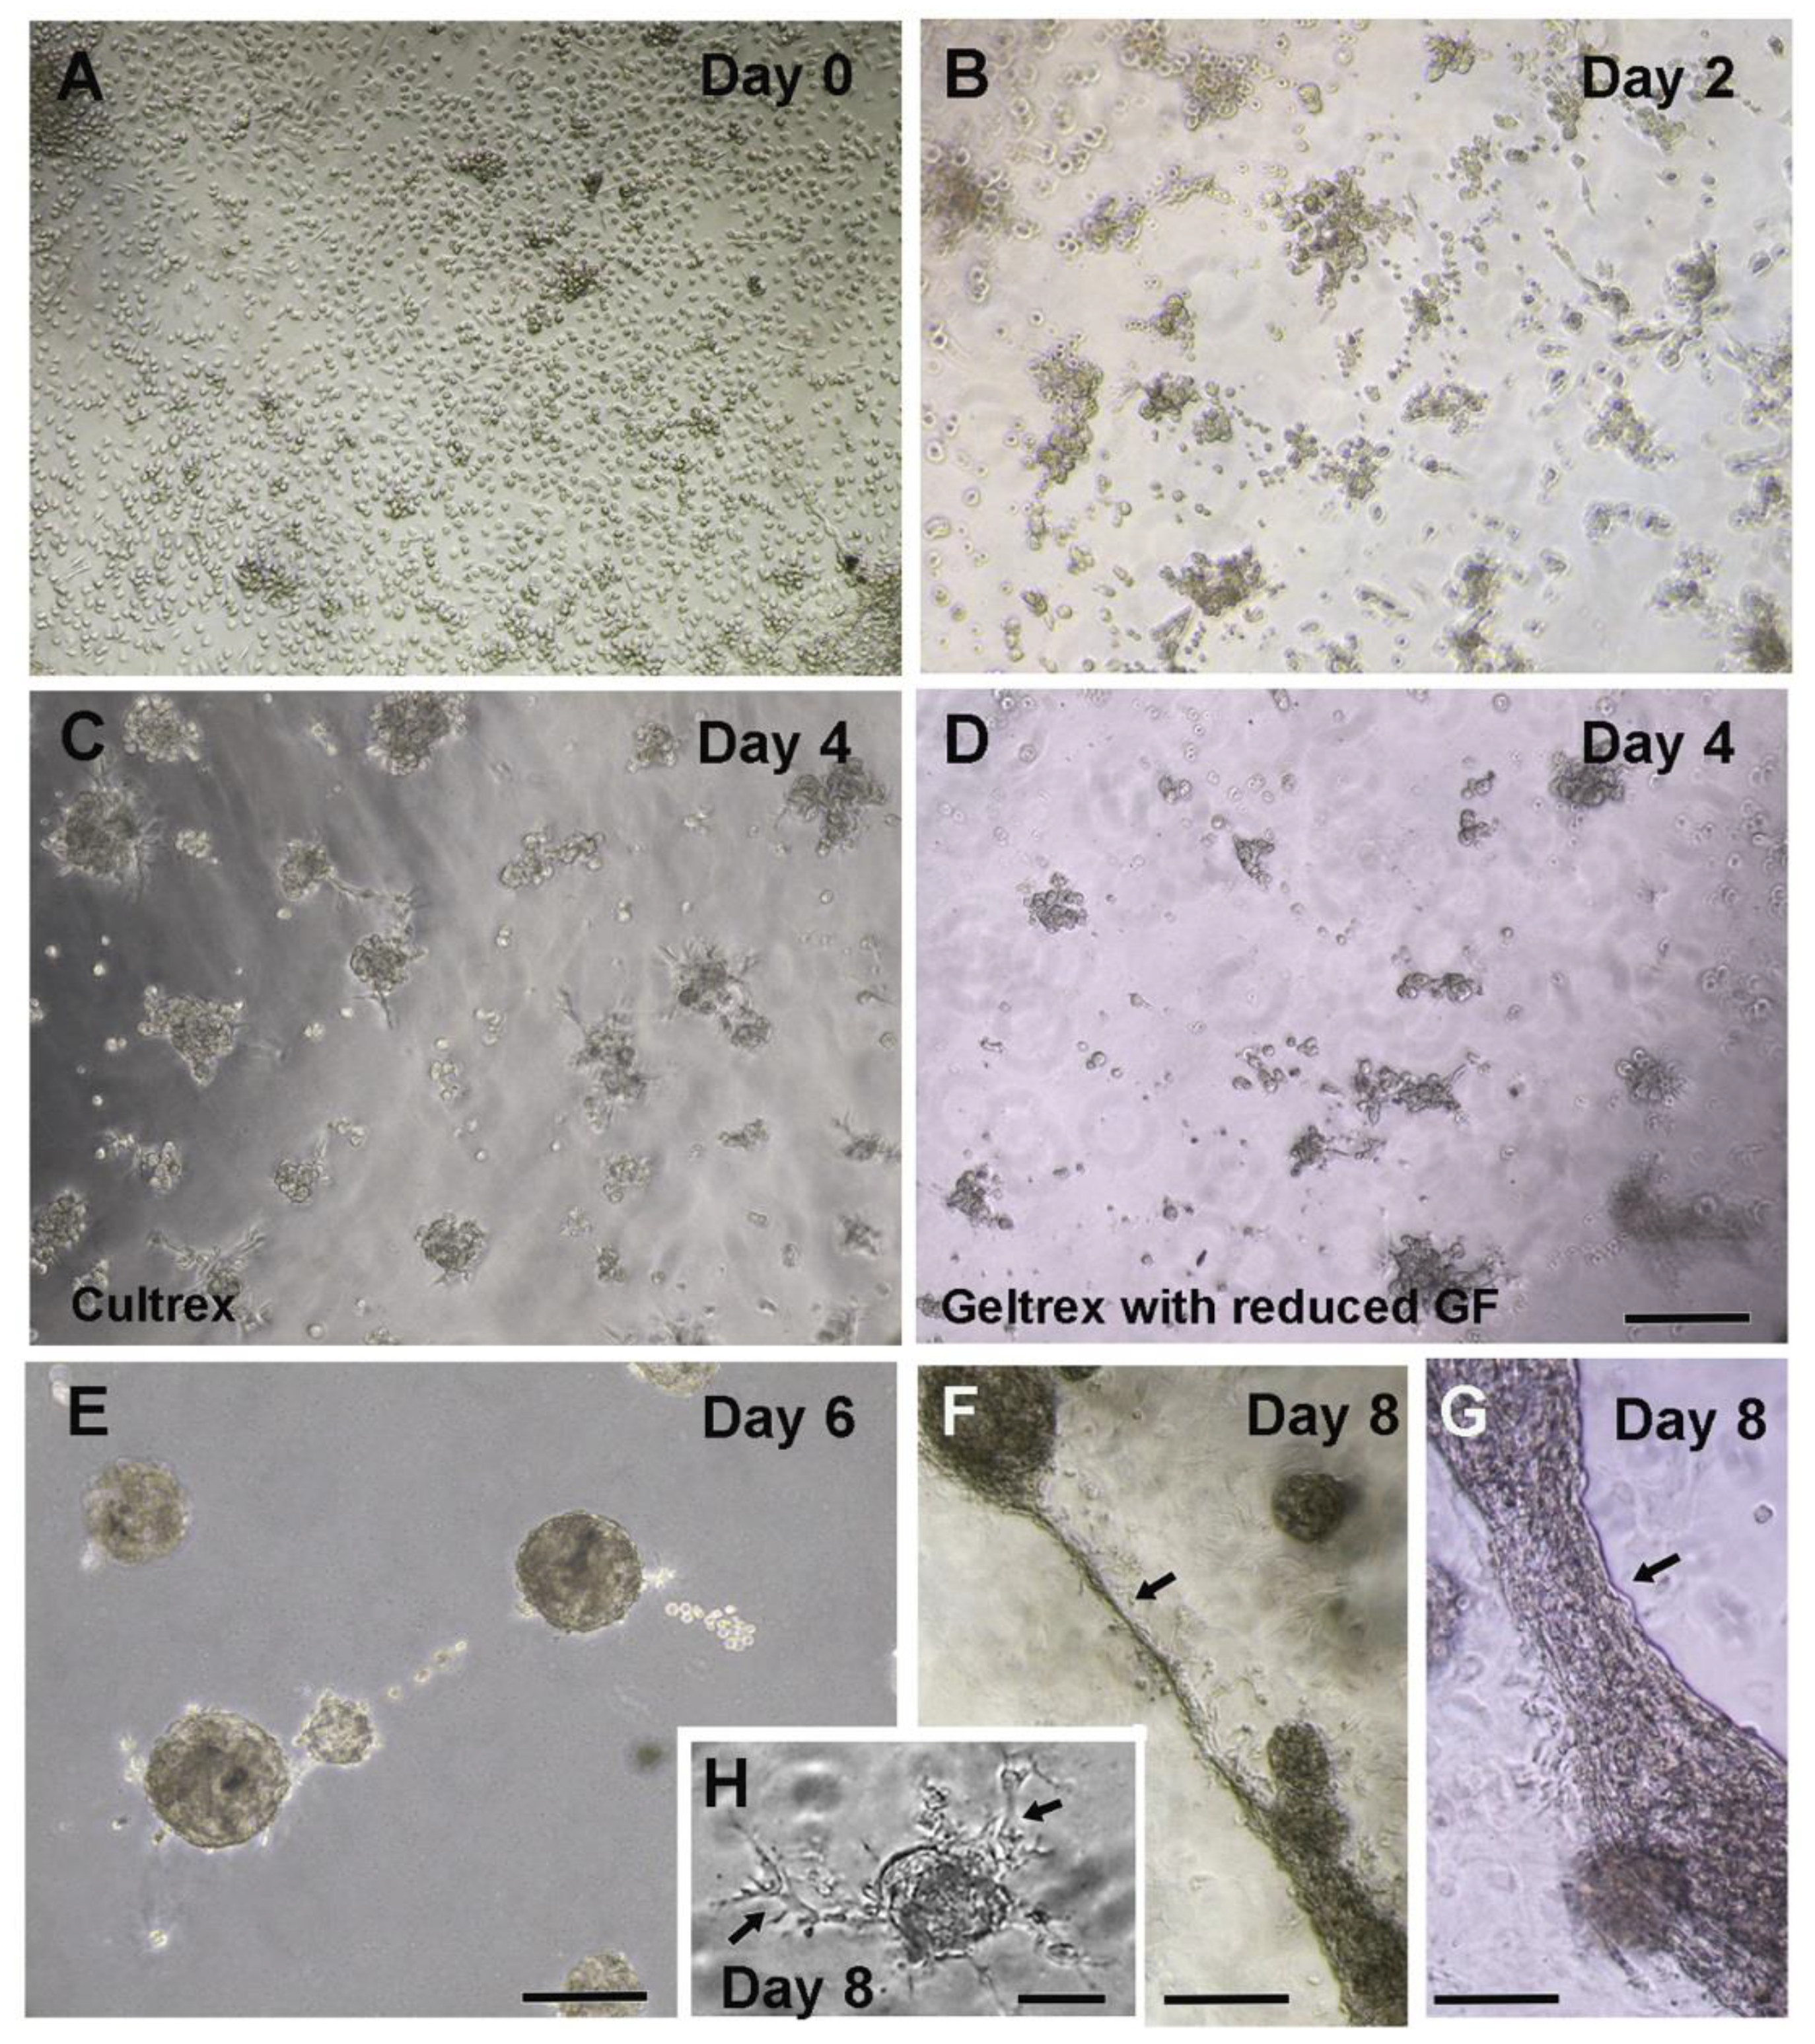
- Monitor the growth of culture under an inverted phase-contrast microscope and observe for the formation of three-dimensional structures (Figure 1C–G). Cell clusters formation starts in 2–3 days and connecting extensions between the contractile spheroid cell bodies can be observed in 7–10 days (Figure 1A–G). A healthy culture can be maintained for 13–15 days.
3.2.2. Alternative Method of 3-D Culture, Cells Embedded in Matrix
- Similar to the cells on top of the matrix bed protocol, coat the pre-chilled culture surface of an 8-Chambered slide with a thin layer of BME matrix. Evenly spread 30 µL of the matrix per chamber. Allow the coat to dry in the incubator at 37 °C for 15–30 min. Care should be taken as described in the earlier method.
- In the meantime, resuspend the isolated embryonic ventricular cells into an appropriate volume of the matrix. Optimize 150 µL matrix for 125,000–250,000 cells per chamber. The volume of the matrix can be standardized depending on the cell number used in the experiment. A higher number of cells need to be diluted with more volume of the matrix.
CRITICAL STEP: Resuspension of cells in the matrix is a critical step in cell embedded 3-D culture method. Resuspension needs to be done over the ice or any chilled platform to delay matrix polymerization. This step requires the mixing of cells in the matrix by pipetting, but it needs extra caution to prevent air bubble formation. These bubbles/vacuoles in the polymerized matrix may inhibit the formation of connecting fibers between the spheroid cell bodies produced during culture.- After polymerization of the pre-coated culture surface, pipette the mixture of cells and matrix over the pre-coated surface. Gently spread the mixture all over the surface in uniform thickness.
- Incubate for 10–15 min at 37 °C and 5% CO2 in the incubator to allow polymerization. Add the 200 µL culture media (DMEM-10%FBS) over the matrix in each chamber.
- If required, treat the culture with pharmacological agents as per the intended objective and then incubate at 37 °C and 5% CO2 in the incubator.
- Monitor the health of the culture under the inverted phase-contrast microscope and note the development of three-dimensional spheroid cell bodies (Figure 1A–G).
3.3. Feeding the Culture and Drug Testing
- The 3-D cultures are fed at a regular interval of 36–48 h. Details of drugs/agents tested, dosage and time points for media and drug additions have been indicated in a timeline chart (Table 1). Depending on the half-life of drugs, the feeding protocol can be modified, but a long gap between feedings is harmful to cells.
- Drugs are dissolved in 200 µL media per chamber, and caution must be taken while feeding the culture. The old media is aspirated out from each chamber slowly, and fresh media is added along the wall of the chamber to prevent the damage to the 3-D cultured matrix.
CRITICAL STEP: The polymerized matrix is very fragile in nature. A slight disturbance can break the matrix and spoil the 3-D culture. Pipetting in and out must be very slow and along the wall of the chamber. Pipetting from one corner of the chamber in a slightly tilted position of culture slide reduces the chances of rupture of the matrix. Multiple pipetting events in every step from the beginning of culture to downstream processing of 3-D culture product makes pipetting a very critical procedure.- Culture is fed until the desired 3-D culture morphology is achieved; 7 to 8 days are ideal for downstream procedures such as culture fixation for immunostaining (see Section 3.5 and Section 3.6) or cell extraction (see Section 3.7) for protein and RNA analyses when cells are healthy and show optimal contractions.
3.4. Analysis of Spheroid Cell Bodies and Fibers Formation in 3-D Cultures
3.4.1. Grading of Spheroid Cell Bodies Based on Size
- Spheroid cell bodies in 3-D culture environment can be graded based on their size, beating activity, and presence or absence of fiber formation. Visual inspection under the light microscope can be utilized for subjective grading of cell bodies.
- More accurate classification of spheroid cell bodies based on size can be done by measuring the area of these cell bodies from digital images taken in a blinded fashion. ImageJ software can be used in analysis of the area of the developing cell bodies. Download the software from the ImageJ website (http://rsb.info.nih.gov/ij/; accessed on 19 October 2021) and follow the instructions given in the user manual.
- Capture the images from random fields of cell culture under the light microscope. For the measurement of area, set the scale in ImageJ software prior to analysis of any image and set measurement select. Then open the image and draw an area around the cell body with the polygon selection tool and analyze the area.
3.4.2. Grading of Spheroid Cell Bodies Based on Beating Activities
- Visual observation under the microscope in temperature-controlled environment can differentiate the non-beating cell bodies from contracting cell bodies.
- Additionally, beating cell bodies can be graded based on the number of beats per minute (BPM) or percentage of beating cell bodies. This type of analysis can be used to predict the effect of a drug on ventricular cell differentiation and VCS cell development.
3.4.3. Grading of Spheroid Cell Bodies by Fiber Formation Analysis
- Fiber formation can be analyzed based on the number of outgrowths or fibers arising from each spheroid cell body in E11.5 ventricular cells grown in 3-D cultures.
- Mean fiber numbers can be determined by blinded analysis of digital images captured using a 20× phase contrast objective from 6–7 random fields/group in each experiment.
- Differences in fiber formation and distribution can be quantified by comparing the mean fiber numbers of spheroid cell bodies grown in 3-D cultures treated with different exogenous agonists and antagonists.
3.5. Culture Fixation
- Aspirate the media slowly from the chamber and rinse the culture with an equivalent volume of PBS at room temperature.
- Culture can be fixed by 4% paraformaldehyde (PFA) at room temperature.
CRITICAL STEP: Fixation with cold 4% PFA can lead to the loss of matrix integrity, and loss of 3-D cell structures. Therefore, fixation solution should be prewarmed to the room temperature.- After 10 min of fixation at room temperature, treat the fixed cultures with PBS-glycine for 5–10 min to decrease non-specific binding during immunofluorescence staining. Wash the culture with PBS and then process for immunostaining. Fixed culture can be stored in PBS at 4 °C for up to four days.
CRITICAL STEP: Longer storage of fixed culture in PBS is not advisable as storage for more than four days causes loss of matrix integrity, and 3-D cell structure cannot be visualized. Immediate or next day processing yields a better outcome.3.6. Immunofluorescence Staining of 3-D Culture
- Aspirate the PBS from the fixed 3-D culture chamber and wash the slide with PBS-glycine at room temperature for 10 min.
- After three washings with PBS-glycine, block the slide with 100 µL of immunofluorescence (IF) blocking solution. Cover the chambers with parafilm and incubate for 90 min at room temperature.
- Aspirate the IF blocking solution and add primary antibodies in 100 µL of immunofluorescence (IF) buffer. Incubate for 2 h at room temperature or overnight at 4 °C.
- Wash the culture 3 × 20 min with IF buffer. Add secondary antibodies diluted in 100 µL of IF buffer and incubate for 45 min at room temperature.
- Wash the culture with IF buffer for 20 min and then 2 × 10 min wash with PBS at room temperature.
- Counterstain the nuclei with Hoechst dye and incubate for 5 min.
- Wash the culture with PBS for 10 min and carefully remove the chamber walls without disturbing the stained culture.
- Spread a drop of mounting medium over the slide and put coverslip. The thickness of the matrix bed could pose some difficulty in the setting of the coverslip. A very gentle pressure without disrupting the matrix may be applied to set the coverslip.
- A stained slide can be stored in a dark box at −20 °C for months. A confocal microscope is ideal for imaging of 3-D cultures.
3.7. Cell Extraction from 3-D Culture and Protein Extraction
- Aspirate the culture media from the chamber and rinse the culture with ice-cold PBS twice. Add 500 µL of ice-cold PBS-EDTA to each chamber and disrupt the matrix using the pipette tip. Gently scrape the matrix and cells from the bottom of the chamber and shake the slide for 15–30 min.
- Transfer the disrupted matrix solution to the conical tube. Wash the chamber with 100 µL of ice-cold PBS-EDTA and transfer it to the tube.
- Put the tube in the ice and gently shake for 15–30 min. Look for the complete disappearance of the BME matrix in the solution. Shake the tube till no fragments of the matrix are left, and a homogenous suspension is formed.
- Centrifuge the tube at 1600 rcf for 4 min in 4 °C. A small cell pellet is formed. Discard the supernatant carefully without disrupting the cell pellet. This cell pellet can be stored at−80 °C for protein extraction in the future.
- For protein extraction, give one additional wash to the cell pellet with PBS-EDTA to ensure the complete removal of the BME matrix.
- Wash the cell pellet with cell wash buffer. Centrifuge the cell suspension at 4000 rpm for 4 min in 4 °C.
- Aspirate the supernatant and add 50–100 µL of lysis buffer. Bigger pellet size requires a larger volume of lysis buffer. Mix the cells in lysis buffer properly and put the tube in the ice for 10 min.
- Sonicate the cell suspension, 3 × 10 s with 10 s break on ice. Leave the tube in the ice for 15 min after sonication.
- Centrifuge the suspension for 15 min at 13,000 rpm in 4 °C. Collect the supernatant into a new tube. Isolated protein can be stored at −80 °C for future use.
- Western blotting can be done to analyze the protein by following a standard protocol.
CRITICAL STEP: Cell extraction from 3D cultures could be for different purposes. For the sub-culture of cells, the cell extraction procedure should be gentler. Avoid forming a tight pellet. Cells are resuspended in culture media and can be plated to the fibronectin coated dish or slides. In our experience, the yield of extracted cells from 3-D matrix for subculture is very low, but a better result can be achieved by more intense optimization of cell extraction and subculture procedures.3.8. 3-D Cell Culture over the Matrix Bed in a 96-Well Culture Plate
- We standardized the 3-D cell culture over the matrix bed method for a 96-well culture plate. This method gives us the feasibility for in-cell western for cells cultured in a 3-D environment.
- Follow the protocol for 3-D cell culture of cells over the matrix with the adjusted volume of BME matrix in each well. Coat pre-chilled 96-well culture plate with 30 µL of BME matrix. Let the coated surface dry for 15–20 min in a humid environment at 37 °C.
- After incubation of pre-coated wells, pipette the embryonic ventricular cells and media over the matrix. The optimum seeding concentration for each well is 50,000 cells in 150 µL of culture media. Incubate the culture plate at 37 °C and 5% CO2.
3.9. Marker Protein Expression in 2-D and 3-D Cell Culture by In-Cell Westerns
- The culture surface is prepared simultaneously for both 2-D and 3-D cell culture in a 96-well plate. The 2-D culture wells are coated with 1–5 µg fibronectin/cm2 surface area. The 3-D culture wells are coated with BME Matrix as described earlier.
- A total of 50,000 cells in 150 µL of 10%FBS-DMEM are seeded in each well. Cell number and media volume is equal for both 2-D and 3-D cultures.
- Incubate the culture plate at 37 °C in a 5% CO2 environment for the desired period with regular cell culture feeding and drug of interest treatment.
- After the completion of the period of cell culture, follow standard protocol of immunostaining of 2-D culture in 2-D culture wells. Wash the cell culture wells with sterile PBS twice. Fix the cells in 2-D wells with 4% paraformaldehyde for 15 min at room temperature. Rinse the wells with PBS twice and permeabilize the cells with 0.1% Triton X-100 for 5 min. Further, rinse the wells with PBS twice and put 50 µL of blocking buffer (1%BSA and 10% goat serum in PBS) in each well for 1 h at room temperature.
- For 3-D cell culture wells, follow the culture fixation and immunostaining protocols described for 3-D cultures in Section 3.6 and Section 3.7.
- A separate permeabilization step with 0.1% Triton X 100 is not required for 3-D cultures, since the IF buffer used for washings, incubation of primary and secondary antibodies has 0.2% Triton X-100.
- Wash the culture with PBS and incubate the cell culture with primary antibodies for 2 h at room temperature or overnight at 4 °C. Wash the cell culture 3 × 15 min with PBS and add DyLight conjugated secondary antibodies for 1 h at room temperature. Wash the cell culture wells with PBS twice.
- Simultaneously, perform immunostaining for 3-D culture wells. Follow the protocol of fixation and immunofluorescence staining of 3-D Culture described earlier with primary and secondary DyLight conjugated antibodies.
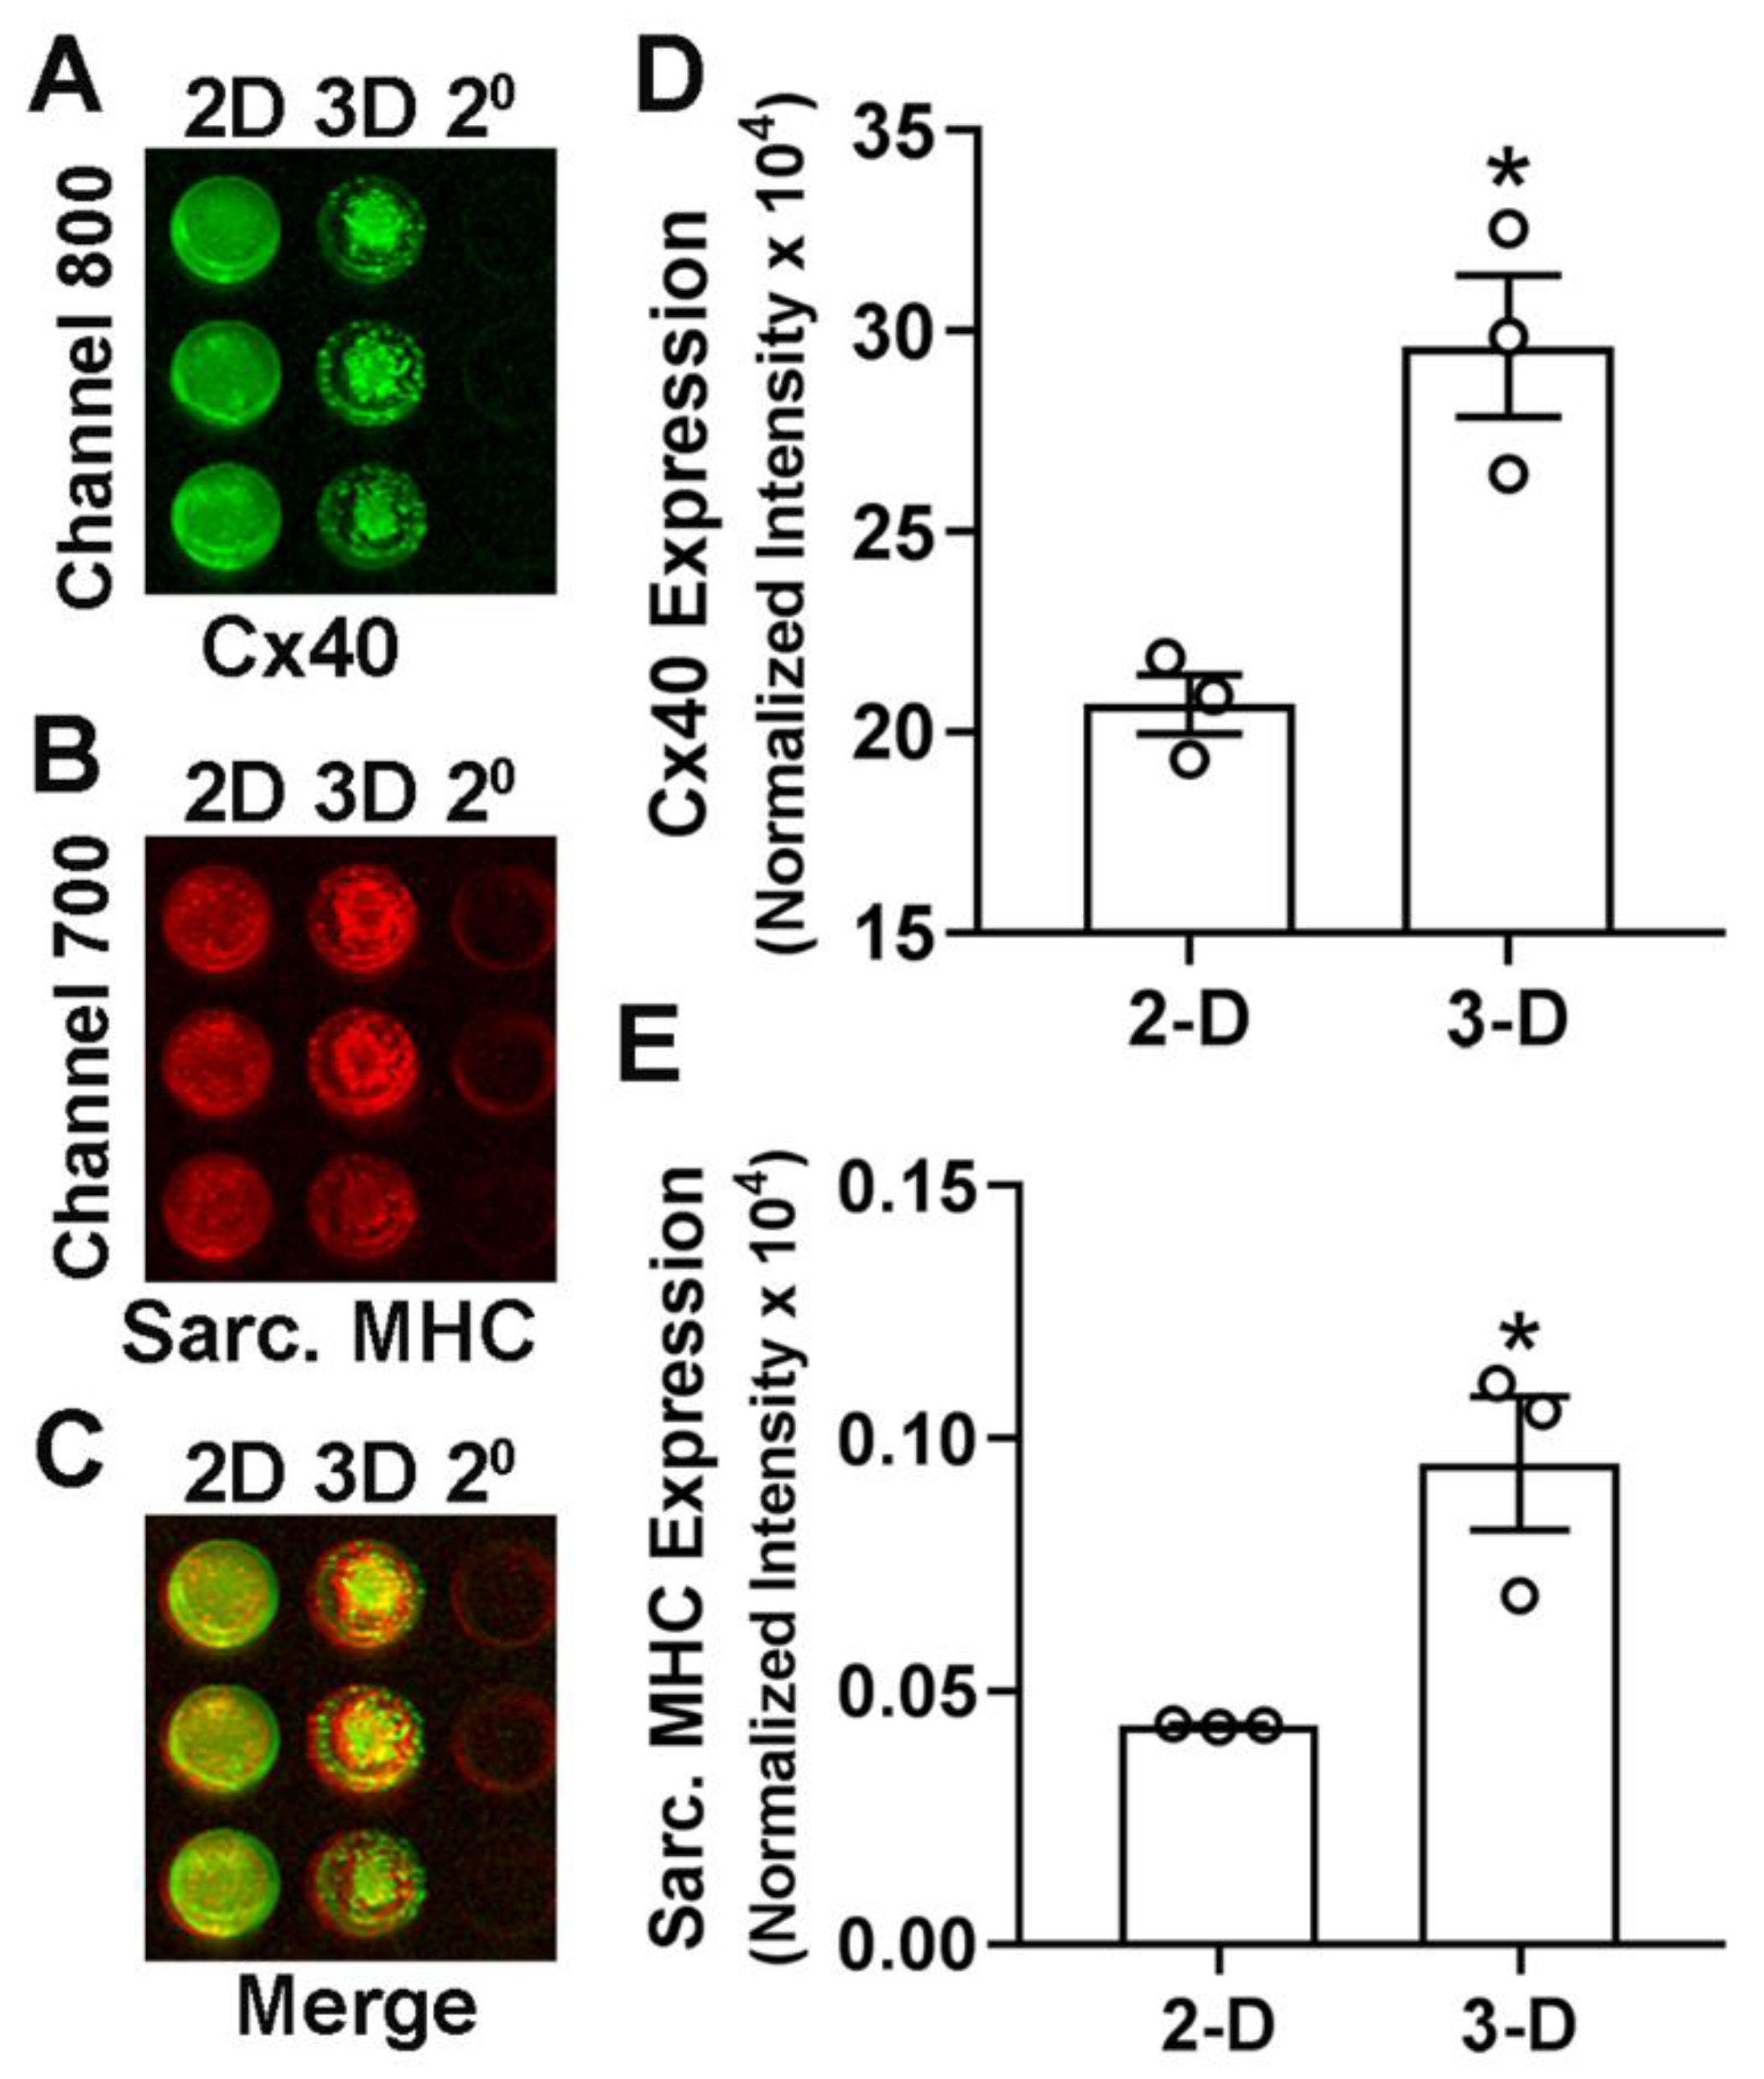
- Capture the image and analyze the in-cell westerns using the LI-COR Odyssey imaging system (Channels 700 and 800).
CRITICAL STEP: Prepare background wells for both 2-D and 3-D cell cultures with a similar number of cells. Background wells will have no primary antibodies and be added with secondary antibodies only. This helps in correction of raw values obtain by imaging system and avoid non-specific staining. CRITICAL STEP: Following in-cell westerns, stain the wells with Hoechst dye and determine the cellular DNA content using a fluorescence plate reader (BMG Labtech Polarstar Omega). Cellular content in each well can be used to normalize the respective in-cell western signals.3.10. Statistical Analysis
4. Results and Discussion
5. Conclusions
Supplementary Materials
Author Contributions
Funding
Institutional Review Board Statement
Informed Consent Statement
Data Availability Statement
Acknowledgments
Conflicts of Interest
References
- Wessels, M.W.; Willems, P.J. Genetic factors in non-syndromic congenital heart malformations. Clin. Genet. 2010, 78, 103–123. [Google Scholar] [CrossRef] [PubMed]
- Bink-Boelkens, M.T.; Bergstra, A.; Landsman, M.L. Functional abnormalities of the conduction system in children with an atrial septal defect. Int. J. Cardiol. 1988, 20, 263–272. [Google Scholar] [CrossRef]
- Franco, D.; Icardo, J.M. Molecular characterization of the ventricular conduction system in the developing mouse heart: Topographical correlation in normal and congenitally malformed hearts. Cardiovasc. Res. 2001, 49, 417–429. [Google Scholar] [CrossRef] [Green Version]
- Wang, F.; Harel-Sterling, L.; Cohen, S.; Liu, A.; Brophy, J.M.; Paradis, G.; Marelli, A.J. Heart failure risk predictions in adult patients with congenital heart disease: A systematic review. Heart 2019, 105, 1661–1669. [Google Scholar] [CrossRef]
- Brown, M.A.; Rajamarthandan, S.; Francis, B.; O’Leary-Kelly, M.K.; Sinha, P. Update on stem cell technologies in congenital heart disease. J. Card. Surg. 2019, 35, 174–179. [Google Scholar] [CrossRef]
- Miquerol, L.; Beyer, S.; Kelly, R.G. Establishment of the mouse ventricular conduction system. Cardiovasc. Res. 2011, 91, 232–242. [Google Scholar] [CrossRef] [Green Version]
- Virágh, S.; Challice, C. The development of the conduction system in the mouse embryo heart: II. Histogenesis of the atrioventricular node and bundle. Dev. Biol. 1977, 56, 397–411. [Google Scholar] [CrossRef]
- Delorme, B.; Dahl, E.; Jarry-Guichard, T.; Marics, I.; Briand, J.-P.; Willecke, K.; Gros, D.; Théveniau-Ruissy, M. Developmental regulation of connexin 40 gene expression in mouse heart correlates with the differentiation of the conduction system. Dev. Dyn. 1995, 204, 358–371. [Google Scholar] [CrossRef]
- Gourdie, R.; Severs, N.; Green, C.; Rothery, S.; Germroth, P.; Thompson, R. The spatial distribution and relative abundance of gap-junctional connexin40 and connexin43 correlate to functional properties of components of the cardiac atrioventricular conduction system. J. Cell Sci. 1993, 105, 985–991. [Google Scholar] [CrossRef]
- Gourdie, R.G.; Wei, Y.; Kim, D.; Klatt, S.C.; Mikawa, T. Endothelin-induced conversion of embryonic heart muscle cells into impulse-conducting Purkinje fibers. Proc. Natl. Acad. Sci. USA 1998, 95, 6815–6818. [Google Scholar] [CrossRef] [Green Version]
- Govindapillai, A.; Hotchkiss, A.; Baguma-Nibasheka, M.; Rose, R.A.; Miquerol, L.; Smithies, O.; Maeda, N.; Pasumarthi, K.B.S. Characterizing the role of atrial natriuretic peptide signaling in the development of embryonic ventricular conduction system. Sci. Rep. 2018, 8, 6939. [Google Scholar] [CrossRef] [Green Version]
- Rentschler, S.; Zander, J.; Meyers, K.; France, D.; Levine, R.; Porter, G.; Rivkees, S.A.; Morley, G.E.; Fishman, G.I. Neuregulin-1 promotes formation of the murine cardiac conduction system. Proc. Natl. Acad. Sci. USA 2002, 99, 10464–10469. [Google Scholar] [CrossRef] [PubMed] [Green Version]
- van Weerd, J.H.; Christoffels, V.M. The formation and function of the cardiac conduction system. Development 2016, 143, 197–210. [Google Scholar] [CrossRef] [PubMed] [Green Version]
- Hotchkiss, A.; Feridooni, T.; Baguma-Nibasheka, M.; McNeil, K.; Chinni, S.; Pasumarthi, K.B.S. Atrial natriuretic peptide inhibits cell cycle activity of embryonic cardiac progenitor cells via its NPRA receptor signaling axis. Am. J. Physiol. Cell Physiol. 2015, 308, C557–C569. [Google Scholar] [CrossRef] [PubMed] [Green Version]
- McMullen, N.M.; Zhang, F.; Hotchkiss, A.; Bretzner, F.; Wilson, J.M.; Ma, H.; Wafa, K.; Brownstone, R.M.; Pasumarthi, K.B. Functional characterization of cardiac progenitor cells and their derivatives in the embryonic heart post-chamber formation. Dev. Dyn. 2009, 238, 2787–2799. [Google Scholar] [CrossRef]
- Maass, K.; Shekhar, A.; Lu, J.; Kang, G.; See, F.; Kim, E.E.; Delgado, C.; Shen, S.; Cohen, L.; Fishman, G.I. Isolation and Characterization of Embryonic Stem Cell-Derived Cardiac Purkinje Cells. Stem Cells 2015, 33, 1102–1112. [Google Scholar] [CrossRef] [Green Version]
- Tsai, S.-Y.; Maass, K.; Lu, J.; Fishman, G.I.; Chen, S.; Evans, T. Efficient Generation of Cardiac Purkinje Cells from ESCs by Activating cAMP Signaling. Stem Cell Rep. 2015, 4, 1089–1102. [Google Scholar] [CrossRef] [Green Version]
- Huh, N.E.; Pasumarthi, K.B.; Soonpaa, M.H.; Jing, S.; Patton, B.; Field, L.J. Functional Abrogation of p53 is Required for T-Ag Induced Proliferation in Cardiomyocytes. J. Mol. Cell. Cardiol. 2001, 33, 1405–1419. [Google Scholar] [CrossRef]
- Ono, N.; Yamaguchi, T.; Ishikawa, H.; Arakawa, M.; Takahashi, N.; Saikawa, T.; Shimada, T. Morphological varieties of the Purkinje fiber network in mammalian hearts, as revealed by light and electron microscopy. Arch. Histol. Cytol. 2009, 72, 139–149. [Google Scholar] [CrossRef] [Green Version]
- De Hoogt, R.; Estrada, M.F.; Vidic, S.; Davies, E.J.; Osswald, A.; Barbier, M.; Santo, V.E.; Gjerde, K.; Van Zoggel, H.J.A.A.; Blom, S.; et al. Protocols and characterization data for 2D, 3D, and slice-based tumor models from the PREDECT project. Sci. Data 2017, 4, 170170. [Google Scholar] [CrossRef] [Green Version]
- Eschenhagen, T.; Fink, C.; Remmers, U.; Scholz, H.; Wattchow, J.; Weil, J.; Zimmermann, W.; Dohmen, H.H.; Schäfer, H.; Bishopric, N.; et al. Three-dimensional reconstitution of embryonic cardiomyocytes in a collagen matrix: A new heart muscle model system. FASEB J. 1997, 11, 683–694. [Google Scholar] [CrossRef] [PubMed]
- Zuppinger, C. 3D Cardiac Cell Culture: A Critical Review of Current Technologies and Applications. Front. Cardiovasc. Med. 2019, 6, 87. [Google Scholar] [CrossRef] [PubMed] [Green Version]
- Bakunts, K.; Gillum, N.; Karabekian, Z.; Sarvazyan, N. Formation of cardiac fibers in Matrigel matrix. Biotechniques 2008, 44, 341–348. [Google Scholar] [CrossRef] [PubMed]
- Figtree, G.A.; Bubb, K.J.; Tang, O.; Kizana, E.; Gentile, C. Vascularized Cardiac Spheroids as Novel 3D in vitro Models to Study Cardiac Fibrosis. Cells Tissues Organs 2017, 204, 191–198. [Google Scholar] [CrossRef]
- Kawaguchi, N.; Hatta, K.; Nakanishi, T. 3D-Culture System for Heart Regeneration and Cardiac Medicine. BioMed Res. Int. 2013, 2013, 895967. [Google Scholar] [CrossRef]
- Arnaoutova, I.; Kleinman, H.K. In vitro angiogenesis: Endothelial cell tube formation on gelled basement membrane extract. Nat. Protoc. 2010, 5, 628–635. [Google Scholar] [CrossRef]
- Rozario, T.; DeSimone, D.W. The extracellular matrix in development and morphogenesis: A dynamic view. Dev. Biol. 2010, 341, 126–140. [Google Scholar] [CrossRef] [Green Version]
- Lee, G.Y.; Kenny, P.A.; Lee, E.H.; Bissell, M.J. Three-dimensional culture models of normal and malignant breast epithelial cells. Nat. Methods 2007, 4, 359–365. [Google Scholar] [CrossRef] [Green Version]
- Baguma-Nibasheka, M.; Feridooni, T.; Zhang, F.; Pasumarthi, K.B. Regulation of Transplanted Cell Homing by FGF1 and PDGFB after Doxorubicin Myocardial Injury. Cells 2021, 10, 2998. [Google Scholar] [CrossRef]
- Zhang, F.; Feridooni, T.; Hotchkiss, A.; Pasumarthi, K.B.S. Divergent cell cycle kinetics of midgestation ventricular cells entail a higher engraftment efficiency after cell transplantation. Am. J. Physiol. Physiol. 2015, 308, C220–C228. [Google Scholar] [CrossRef] [Green Version]
- Feridooni, T.; Hotchkiss, A.; Baguma-Nibasheka, M.; Zhang, F.; Allen, B.; Chinni, S.; Pasumarthi, K.B.S. Effects of β-adrenergic receptor drugs on embryonic ventricular cell proliferation and differentiation and their impact on donor cell transplantation. Am. J. Physiol. Heart Circ. Physiol. 2017, 312, H919–H931. [Google Scholar] [CrossRef] [PubMed]
- Jensen, C.; Teng, Y. Is It Time to Start Transitioning From 2D to 3D Cell Culture? Front. Mol. Biosci. 2020, 7, 33. [Google Scholar] [CrossRef] [PubMed] [Green Version]
- Zhang, J.; Wehrle, E.; Adamek, P.; Paul, G.R.; Qin, X.-H.; Rubert, M.; Müller, R. Optimization of mechanical stiffness and cell density of 3D bioprinted cell-laden scaffolds improves extracellular matrix mineralization and cellular organization for bone tissue engineering. Acta Biomater. 2020, 114, 307–322. [Google Scholar] [CrossRef] [PubMed]
- Rolver, M.G.; Elingaard-Larsen, L.O.; Pedersen, S.F. Assessing Cell Viability and Death in 3D Spheroid Cultures of Cancer Cells. J. Vis. Exp. 2019, 148, e59714. [Google Scholar] [CrossRef] [Green Version]
- Houweling, A.C.; Van Borren, M.M.; Moorman, A.F.M.; Christoffels, V.M. Expression and regulation of the atrial natriuretic factor encoding gene Nppa during development and disease. Cardiovasc. Res. 2005, 67, 583–593. [Google Scholar] [CrossRef] [PubMed] [Green Version]
- Misono, K.S.; Philo, J.S.; Arakawa, T.; Ogata, C.M.; Qiu, Y.; Ogawa, H.; Young, H.S. Structure, signaling mechanism and regulation of the natriuretic peptide receptor guanylate cyclase. FEBS J. 2011, 278, 1818–1829. [Google Scholar] [CrossRef] [Green Version]
- Parat, M.; Blanchet, J.; De Léan, A. Role of Juxtamembrane and Transmembrane Domains in the Mechanism of Natriuretic Peptide Receptor A Activation. Biochemistry 2010, 49, 4601–4610. [Google Scholar] [CrossRef] [PubMed]
- Parat, M.; McNicoll, N.; Wilkes, B.; Fournier, A.; De Lean, A. Role of Extracellular Domain Dimerization in Agonist-Induced Activation of Natriuretic Peptide Receptor A. Mol. Pharmacol. 2008, 73, 431–440. [Google Scholar] [CrossRef]
- Delporte, C.; Winand, J.; Poloczek, P.; Von Geldern, T.; Christophe, J. Discovery of a potent atrial natriuretic peptide antagonist for ANPA receptors in the human neuroblastoma NB-OK-1 cell line. Eur. J. Pharmacol. 1992, 224, 183–188. [Google Scholar] [CrossRef]
- Klaiber, M.; Dankworth, B.; Kruse, M.; Hartmann, M.; Nikolaev, V.O.; Yang, R.-B.; Völker, K.; Gaßner, B.; Oberwinkler, H.; Feil, R.; et al. A cardiac pathway of cyclic GMP-independent signaling of guanylyl cyclase A, the receptor for atrial natriuretic peptide. Proc. Natl. Acad. Sci. USA 2011, 108, 18500–18505. [Google Scholar] [CrossRef] [Green Version]
- Fishman, G.I. Transcriptional Regulation of The Cardiac Conduction System. Trans. Am. Clin. Clim. Assoc. 2020, 131, 48–54. [Google Scholar]
- Mohan, R.A.; Boukens, B.J.; Christoffels, V.M. Developmental Origin of the Cardiac Conduction System: Insight from Lineage Tracing. Pediatr. Cardiol. 2018, 39, 1107–1114. [Google Scholar] [CrossRef] [PubMed] [Green Version]
- Van Eif, V.W.W.; Devalla, H.D.; Boink, G.J.J.; Christoffels, V.M. Transcriptional regulation of the cardiac conduction system. Nat. Rev. Cardiol. 2018, 15, 617–630. [Google Scholar] [CrossRef] [PubMed]
- Choquet, C.; Kelly, R.G.; Miquerol, L. Nkx2-5 defines distinct scaffold and recruitment phases during formation of the murine cardiac Purkinje fiber network. Nat. Commun. 2020, 11, 5300. [Google Scholar] [CrossRef]
- Miquerol, L.; Bellon, A.; Moreno, N.; Beyer, S.; Meilhac, S.M.; Buckingham, M.; Franco, D.; Kelly, R.G. Resolving cell lineage contributions to the ventricular conduction system with a Cx40-GFP allele: A dual contribution of the first and second heart fields. Dev. Dyn. 2013, 242, 665–677. [Google Scholar] [CrossRef]
- Gruber, P.; Kubalak, S.; Chien, K. Downregulation of atrial markers during cardiac chamber morphogenesis is irreversible in murine embryos. Development 1998, 125, 4427–4438. [Google Scholar] [CrossRef]


| Day−1 | Day 0 | Day 1 | Day 3 | Day 5 | Day 7 | Day 9 |
|---|---|---|---|---|---|---|
| Thawing of BME matrix | Embryonic Ventricular 3-D Cell Cultures | Cell culture feeding (For all experiments) | Cell culture feeding (For all experiments) | Cell culture feeding (For all experiments) | Cell culture feeding (For all experiments) | Fixation/protein/RNA extraction |
| ± ANP (1 μg/mL) and A71915 or A7 (1μM) for Figure 2 | ± ANP (1 μg/mL) and A71915 or A7 (1μM) for Figure 2 | ± ANP (1 μg/mL) and A71915 or A7 (1μM) for Figure 2 | ± ANP (1 μg/mL) and A71915 or A7 (1μM) for Figure 2 | No drug addition |
Publisher’s Note: MDPI stays neutral with regard to jurisdictional claims in published maps and institutional affiliations. |
© 2022 by the authors. Licensee MDPI, Basel, Switzerland. This article is an open access article distributed under the terms and conditions of the Creative Commons Attribution (CC BY) license (https://creativecommons.org/licenses/by/4.0/).
Share and Cite
Mishra, A.; Pasumarthi, K.B.S. Application of Three-Dimensional Culture Method in the Cardiac Conduction System Research. Methods Protoc. 2022, 5, 50. https://doi.org/10.3390/mps5030050
Mishra A, Pasumarthi KBS. Application of Three-Dimensional Culture Method in the Cardiac Conduction System Research. Methods and Protocols. 2022; 5(3):50. https://doi.org/10.3390/mps5030050
Chicago/Turabian StyleMishra, Abhishek, and Kishore B. S. Pasumarthi. 2022. "Application of Three-Dimensional Culture Method in the Cardiac Conduction System Research" Methods and Protocols 5, no. 3: 50. https://doi.org/10.3390/mps5030050
APA StyleMishra, A., & Pasumarthi, K. B. S. (2022). Application of Three-Dimensional Culture Method in the Cardiac Conduction System Research. Methods and Protocols, 5(3), 50. https://doi.org/10.3390/mps5030050