
Method of Microglial DNA-RNA Purification from a Single Brain of an Adult Mouse


 ,
,  and
and
Abstract
:1. Introduction
2. Experimental Design
2.1. Materials
2.2. Equipment
2.3. Freshly Prepared Solution (to Be Made Fresh Immediately before Experiment)
3. Procedure
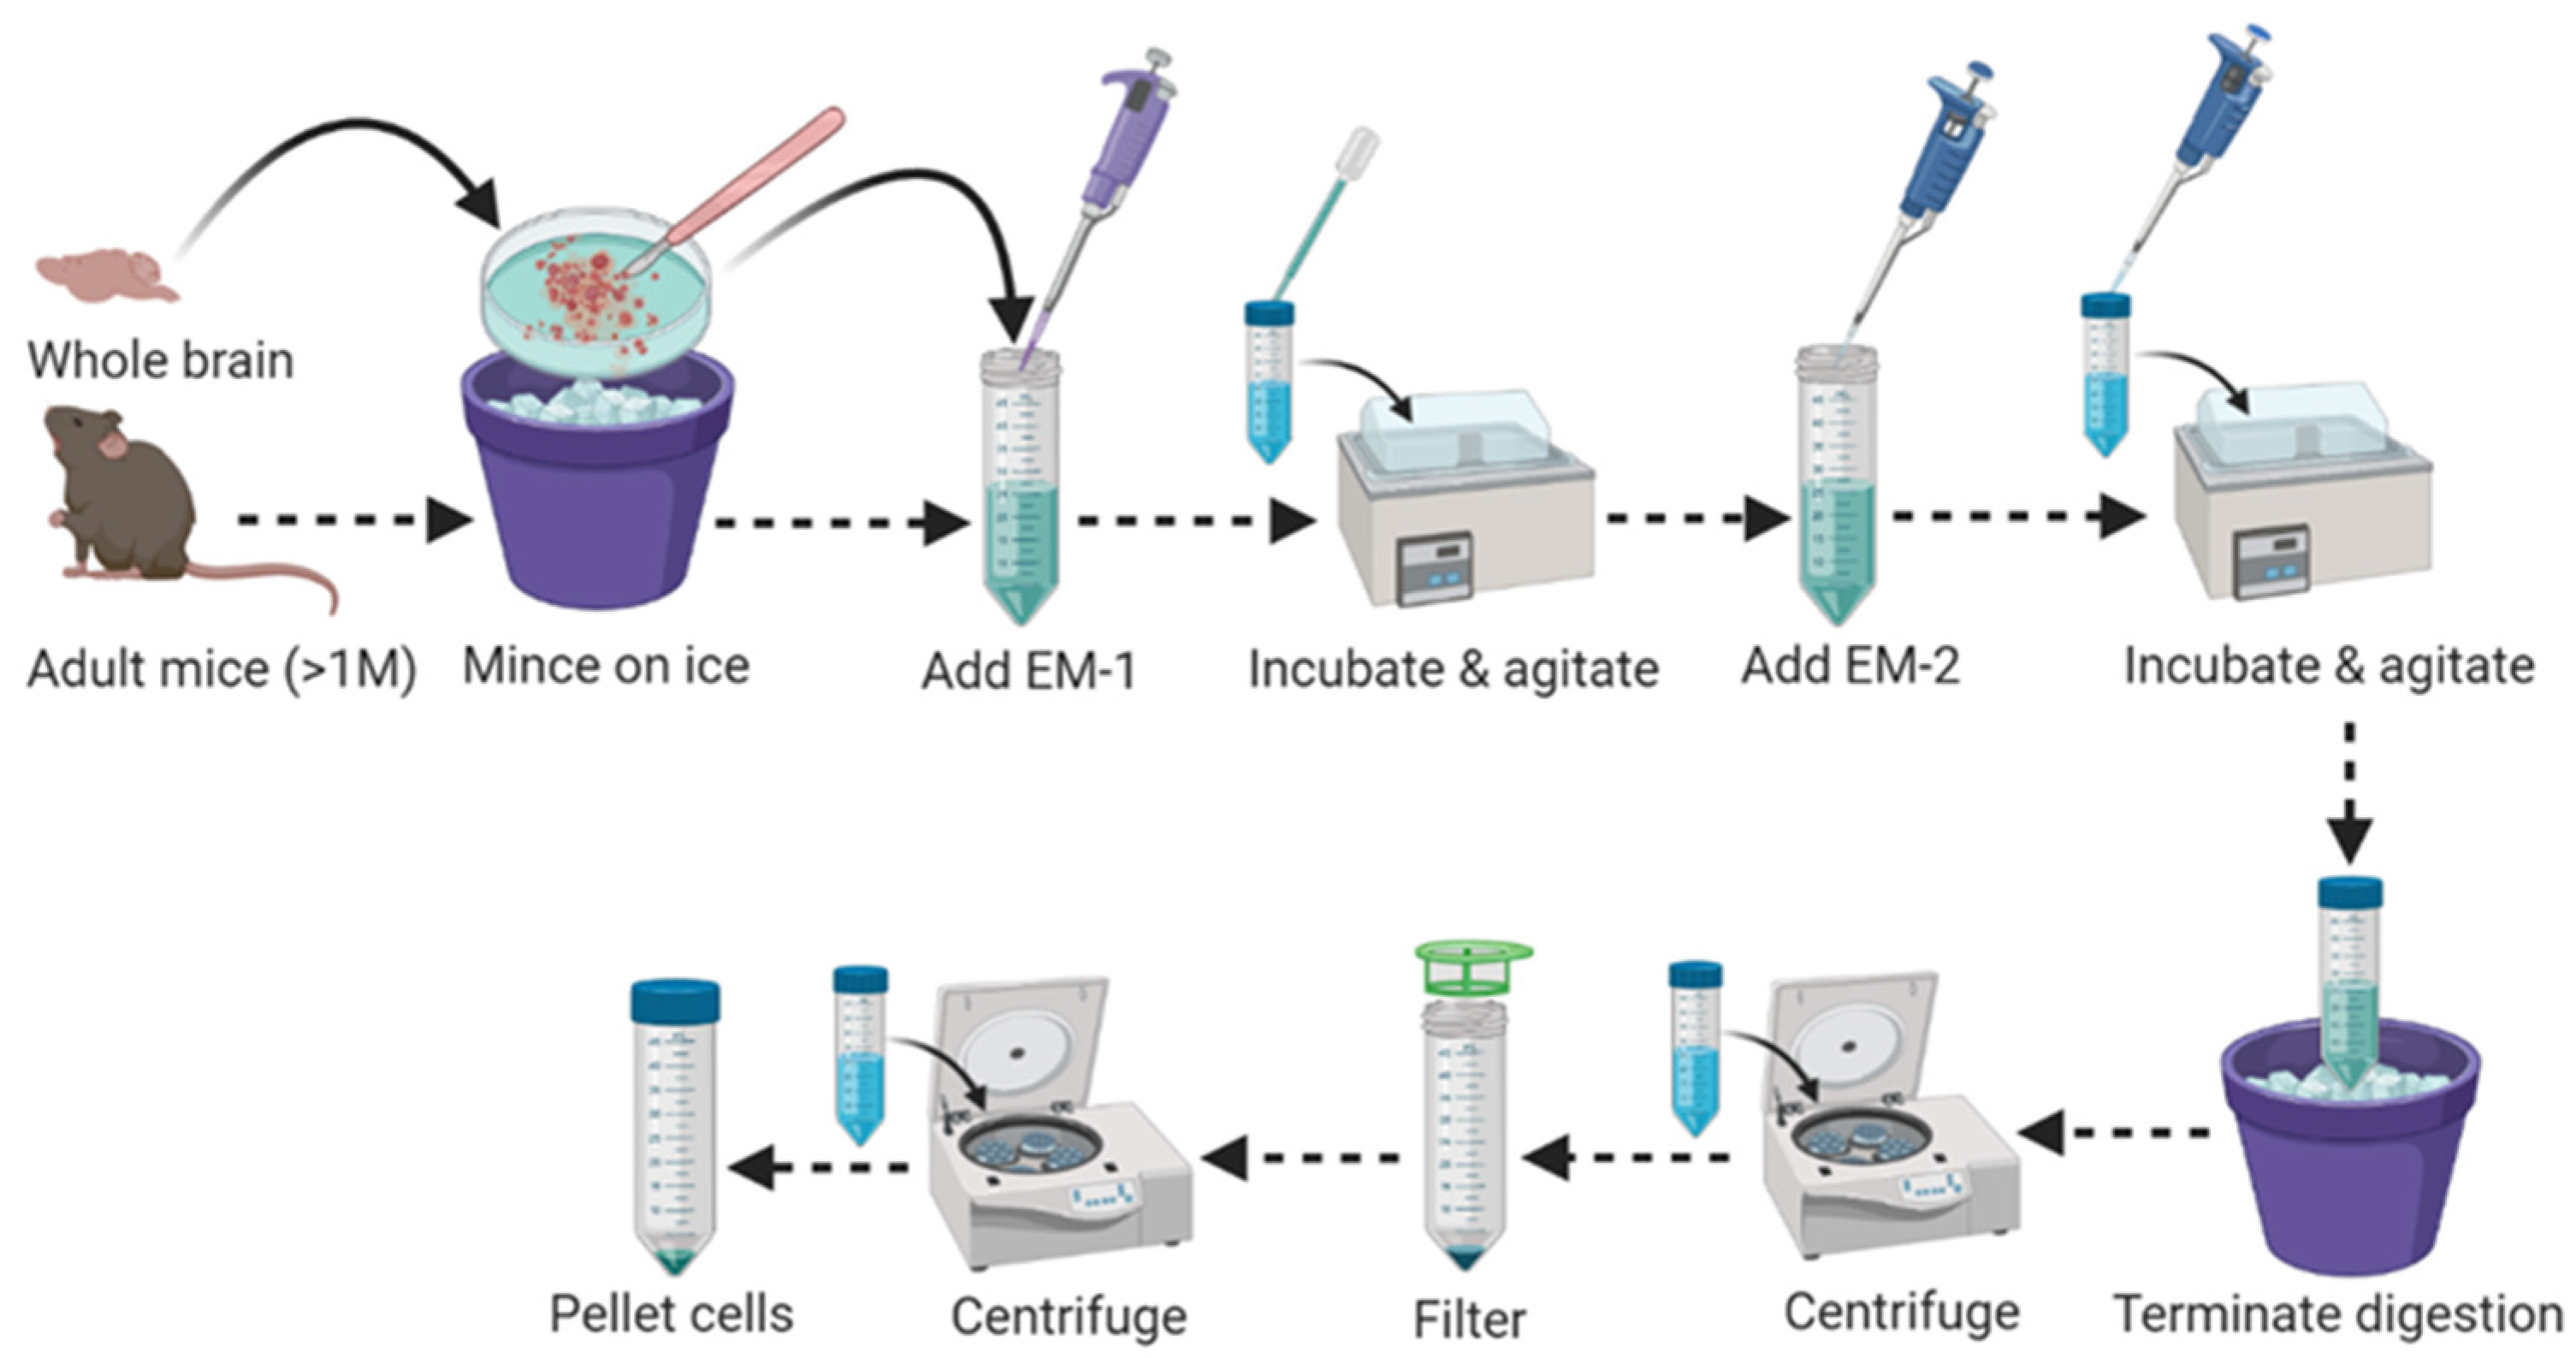
3.1. Part 1: Brain Tissue Dissociation (100 min/up to 6 Mice)
- Adult mice (>4 weeks old) euthanatize with isoflurane/CO2/Pentobarbital.
- 2.
- Perfuse the mice transcardially (through left ventricle) with 10–15 mL of ice-cold 1 × DPBS with calcium and magnesium before harvesting the brain.
- 3.
- Cut the skull upward along the sagittal suture starting from the brain stem, peel away two halves of the skull and scoop out the whole brain.
- 4.
- Place the brain segment into a sterile Petri dish on ice and wash 2–3 times with 1 mL of ice-cold 1 × HBSS without calcium and magnesium.
- 5.
- Apply a sterile, sharp knife and forceps to mince the whole brain into multiple (10–15) slices on the same Petri dish, containing 1 mL of ice-cold 1×HBSS without calcium and magnesium.
- 6.
- Transfer all minced brain slices (for a single brain) into a 15 mL Falcon tube containing 1950 μL MACS Enzyme Mix-1/EM-1 (1900 µL Buffer Z + 50 µL Enzyme P) pre-warmed at 37 °C for 5 min to aid in tissue dissociation step in Figure 1.
- 7.
- Incubate the sample mixture in a water bath at 37 °C for 15 min with continuous shaking at a speed of 50 revolutions per minute (r.p.m.).
- 8.
- At the end of incubation, agitate the aggregated tissue slices using a flame polished glass Pasteur pipette to make a single cell suspension (pipet up and down approximately 20 times or until all tissues move freely up into the Pasteur pipette).
- 9.
- Add 30 µL of MACS Enzyme mix-2/EM-2 (20 µL Buffer Y + 10 µL Enzyme A) into the agitated sample mix. Mix by pipetting; do not vortex or invert the tube.
- 10.
- Incubate the sample mix in a water bath at 37 °C for 10 min with continuous shaking at a speed of 50 r.p.m.
- 11.
- At the end of incubation, agitate the sample mixture 20–25 times using a 1 mL pipette.
- 12.
- Add DNase I (5 U/mL) into the agitated sample mix. Mix by pipetting; do not vortex or invert the tube.
- 13.
- Incubate the sample mix in a water bath at 37 °C for 10 min with continuous shaking at a speed of 50 r.p.m.
- 14.
- At the end of incubation, to completely stop the digestion reaction, dilute the tissue sample with 2 mL of ice-cold 1 × HBSS without calcium and magnesium and incubate on ice for 5 min.
- 15.
- Centrifuge tissue samples quickly at 800–1000× g for 10–15 min at room temperature (20–25 °C), decant the supernatant, and collect the cell pellet.
- 16.
- Resuspend cell pellets in 2 mL of ice-cold 1 × HBSS without calcium and magnesium.
- 17.
- Apply resuspended cell suspension directly into the middle of the pre-moisten MACS SmartStrainer (70 μm) placed on a sterile 50 mL Falcon tube.
- 18.
- Apply 7 mL of ice-cold 1 × HBSS with calcium and magnesium on the MACS SmartStrainer (70 μm). Rinse the old Falcon tube carefully by pipetting up and down with 1 mL 1 × HBSS with calcium and magnesium, and add it directly to the MACS SmartStrainer to prevent any cell loss.
- 19.
- Discard the MACS SmartStrainer (70 μm) and centrifuge cell suspension at 600–700× g for 10 min at 4–8 °C. Carefully remove the supernatant by vacuum aspiration or by pipetting.
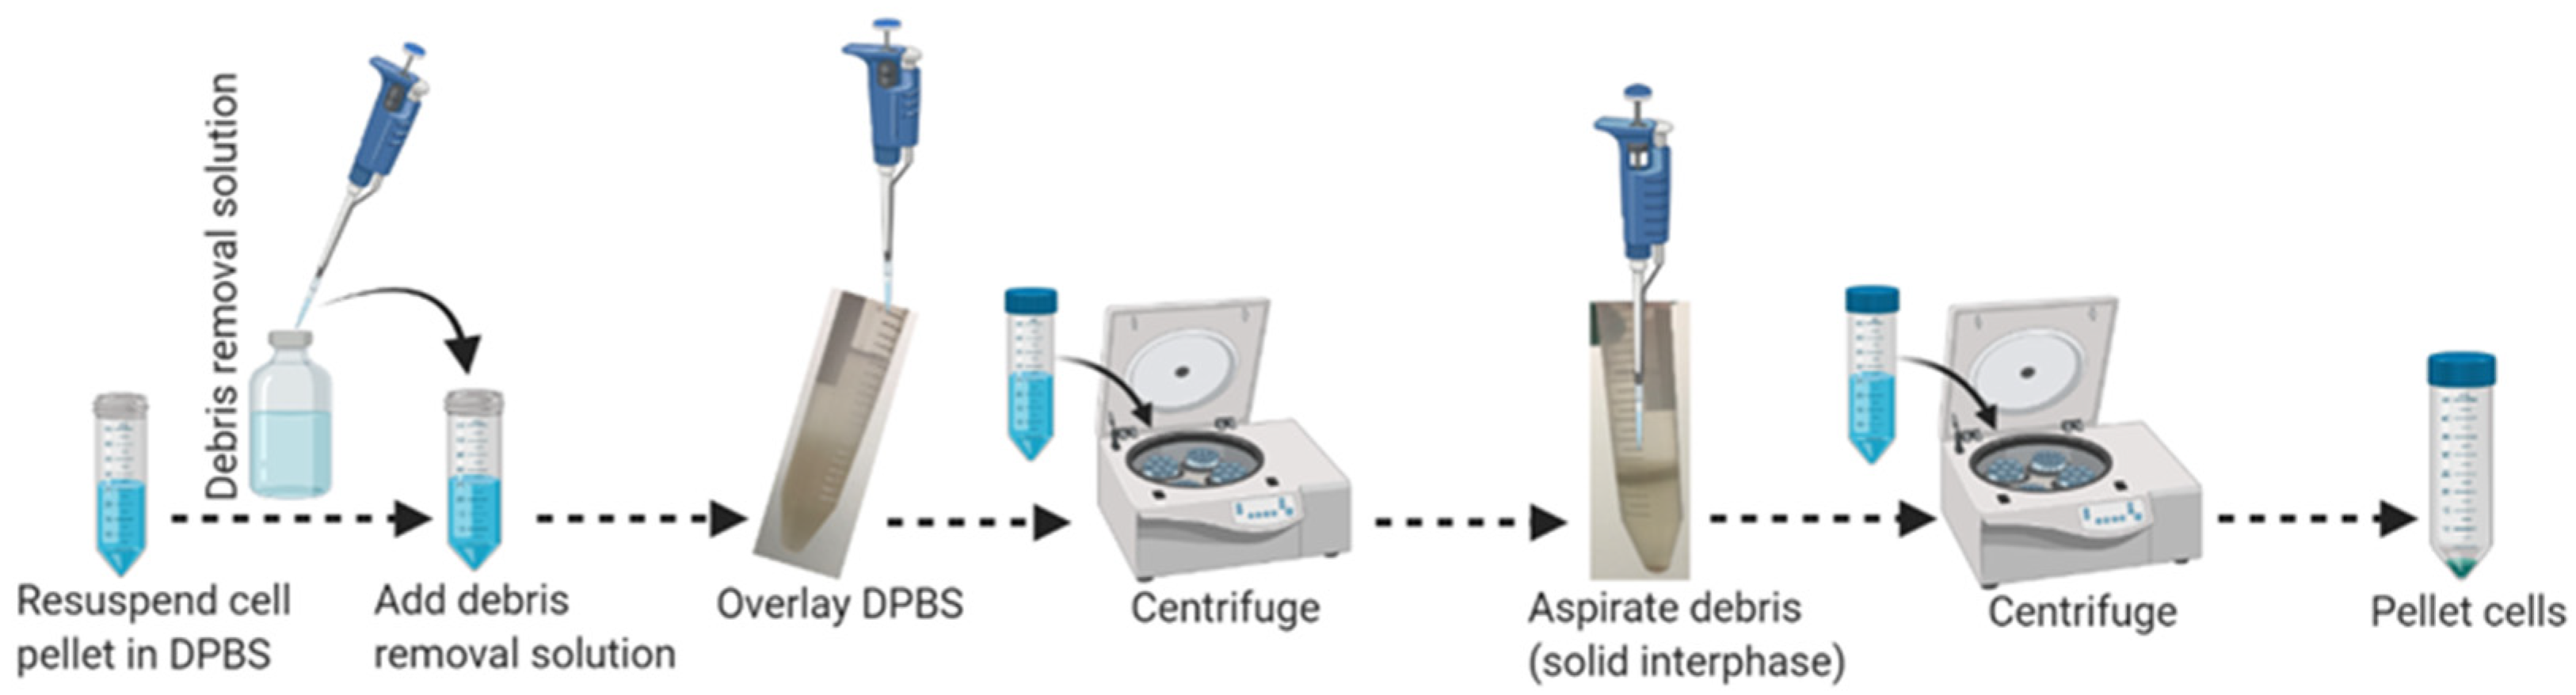
3.2. Part 2: Debris Removal (40 min)
- 20.
- Resuspend cell pellets gently by pipetting with the appropriate volume (3100 μL/single brain) of ice-cold 1 × DPBS, without calcium and magnesium, and transfer cell suspension into a new sterile 15 mL conical tube. Do not vortex.
- 21.
- Add the appropriate volume (900 μL/single brain) of cold MACS debris removal solution into the resuspended sample and mix gently by pipetting 10–12 times as outlined in Figure 2.
- 22.
- Overlay 4 mL of ice-cold 1 × DPBS without calcium and magnesium very gently above the cell suspension to make a transparent gradient.
- 23.
- Centrifuge at 1000× g for 10 min at 4 °C with maximum acceleration and full brake.
- 24.
- Aspirate the two top phases (top liquid and solid interphase) completely and discard them.
- 25.
- Fill the tube with the appropriate volume (~11 mL) of ice-cold 1 × DPBS without calcium and magnesium to a final volume of 14 mL.
- 26.
- Gently invert the tube three (3×) times. Do not vortex!
- 27.
- Centrifuge the tube at 1000× g for 10 min at 4 °C with maximum acceleration and full brake.
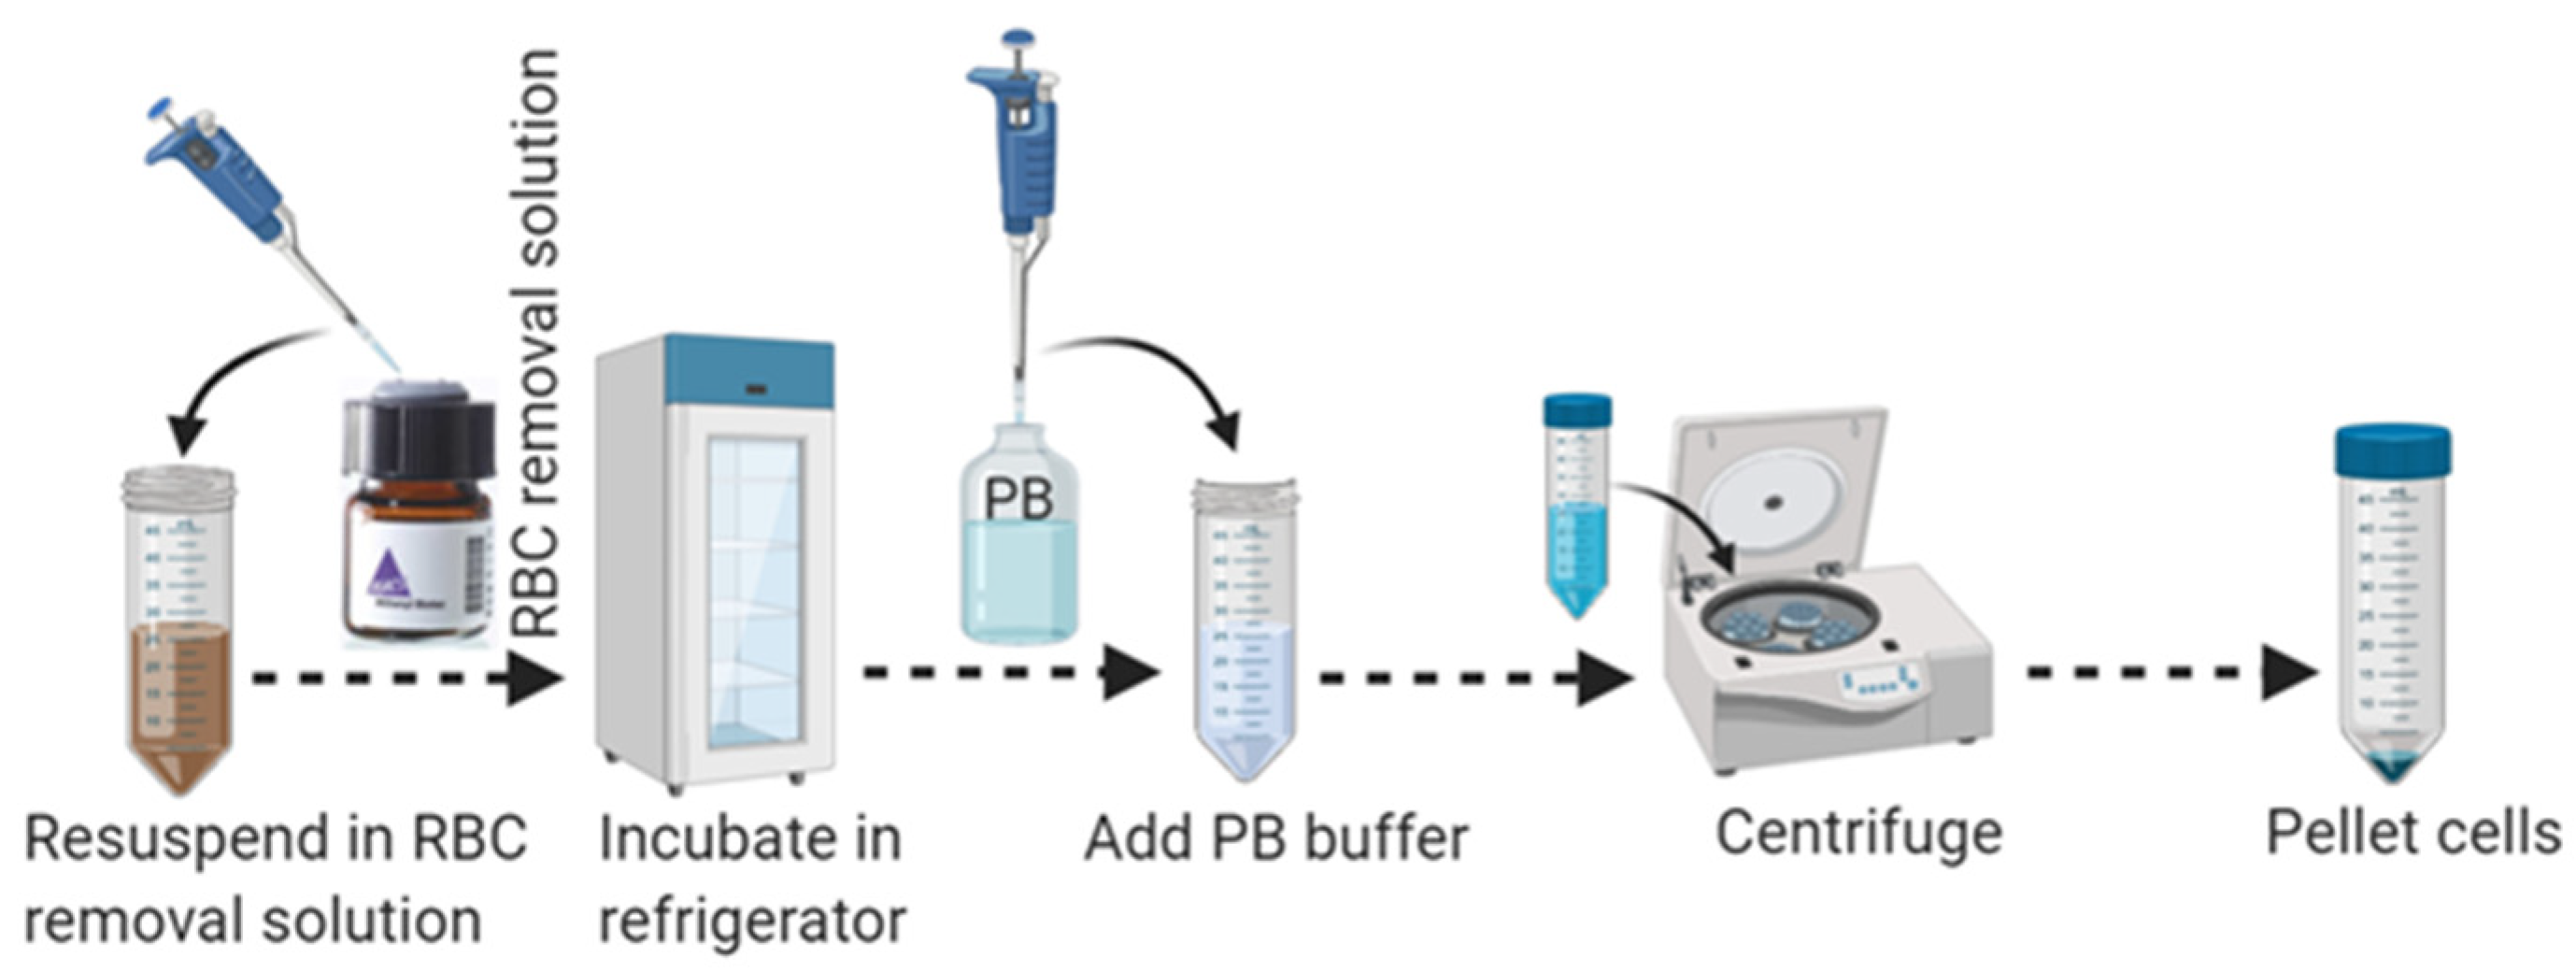
3.3. Part 3: Red Blood Cell (RBC) Removal (30 min)
- 28.
- Aspirate supernatant completely and resuspend cell pellets carefully in 1 mL of cold 1 × RBC removal solution by pipetting up and down 10–15 times with a 1 mL pipette. Do not vortex.
- 29.
- Incubate the cell mixture for 10 min in the refrigerator at 2–8 °C.
- 30.
- Add 10 mL of ice-cold PB buffer to the cell mixture to wash out the RBC removal solution.
- 31.
- Centrifuge at 400× g for 10 min at 4 °C. Aspirate supernatant completely to eliminate RBC as shown in Figure 3.
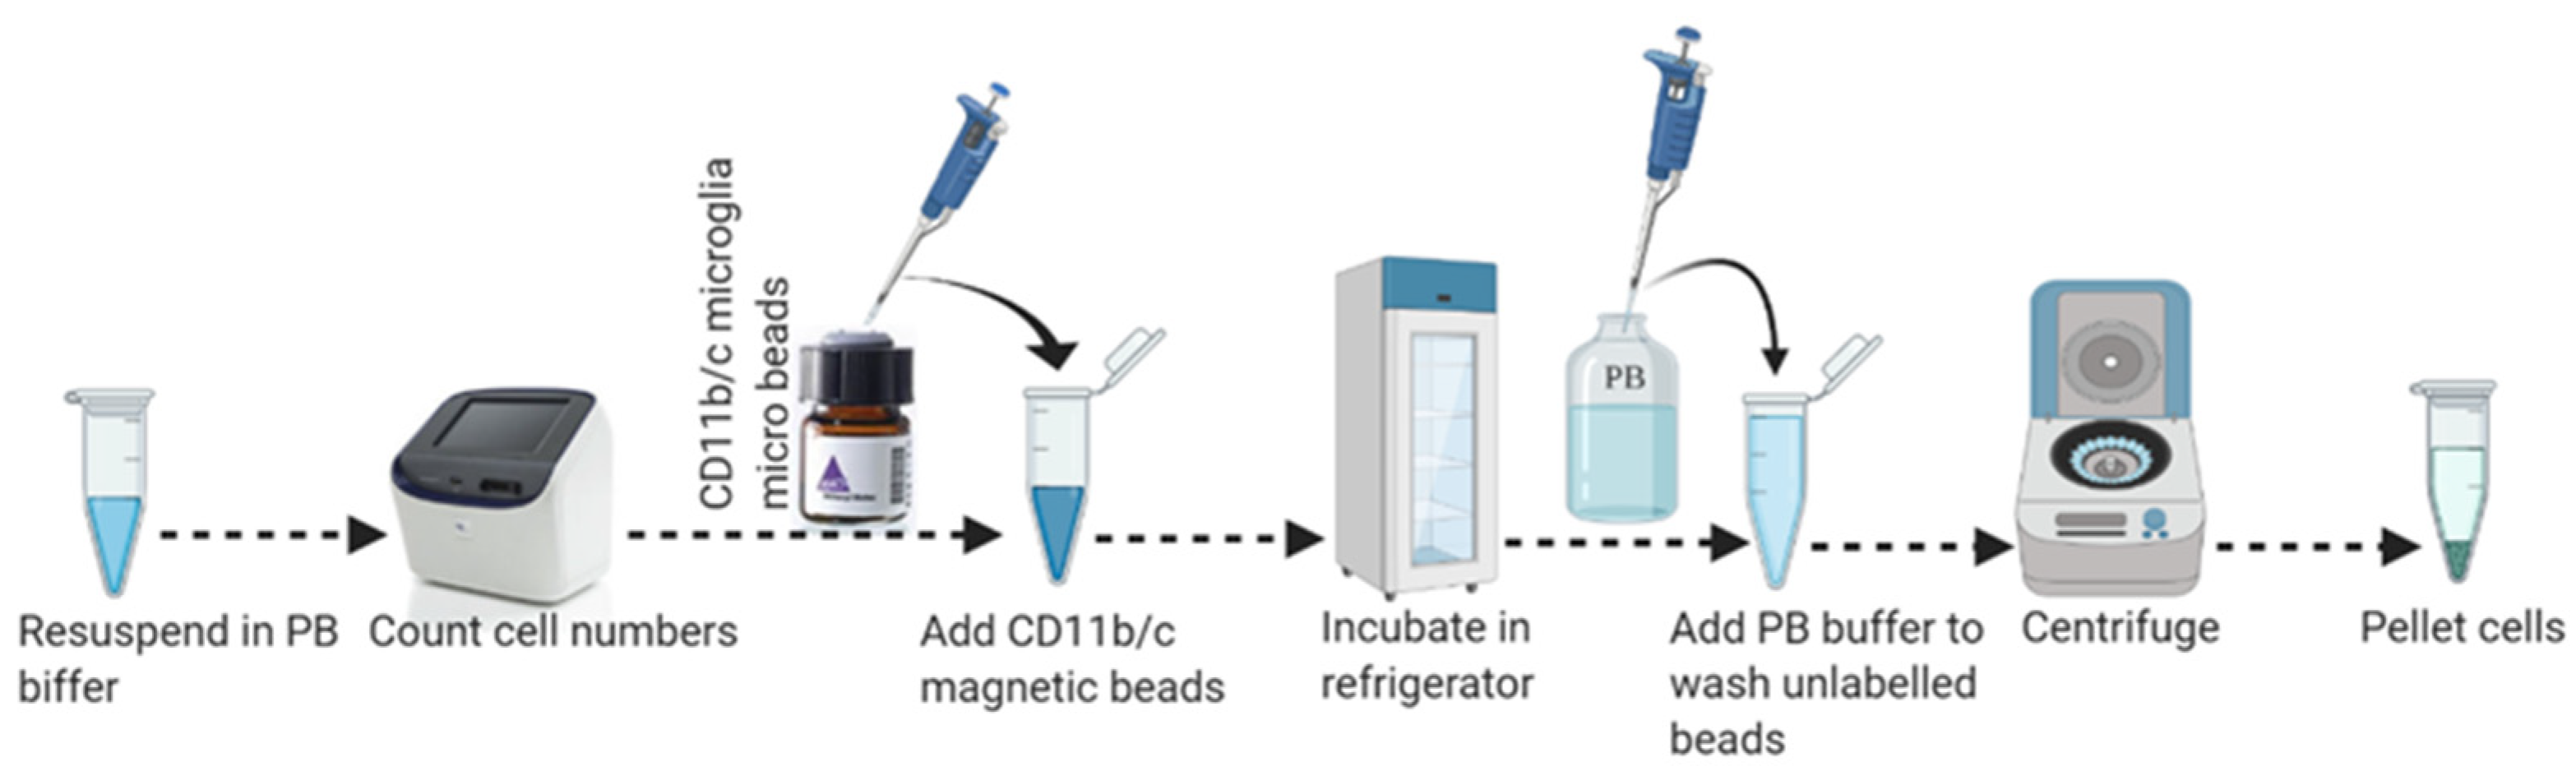
3.4. Part 4: Magnetic Labeling (45 min)
- 32.
- Resuspend cell pellets (from the single mouse brain) in 150 µL of ice-cold PB buffer by gently pipetting up and down. Transfer resuspended cell suspension to a sterile 1.5 mL microcentrifuge tube. Do not vortex cell suspension.
- 33.
- Transfer 15 µL of the cell suspension to a new tube and proceed to cell count. Use 135 μL of cell suspension (for up to 5 × 10⁷ total cells/single mouse brain) for magnetic labeling as shown in Figure 4.
- 34.
- Add 15 µL of MACS CD11b magnetic (Microglia) micro-beads (human and mouse) into the 135 µL of cold cell suspension and mix by pipetting gently up and down 10–15 times with 200 µL pipette.
- 35.
- Place the tube (cell-beads mixture) in an End Over End shaker, keep the mix protected from light, and incubate for 15 min in the refrigerator at 2−8 °C.
- 36.
- Add 1–2 mL of cold PB buffer into the cell-beads mixture per 108 cells and centrifuge at 300–350× g for 10 min at 4 °C to wash out the unlabeled beads. Aspirate supernatant completely.
- 37.
- Resuspend magnetically labeled cells (up to 5 × 10⁷ cells/single mice brain) carefully in 500 µL of cold PB buffer and remove any bubbles if formed during resuspension.
- 38.
- Transfer 40 µL of the cell suspension to another sterile 1.5 mL tube from the 500 µL cells for later flow cytometric analysis (this cell fraction is designated as the total cells fraction or original cell fraction for FACS compensation analysis).
3.5. Part 5: Magnetic Separation of CD11b Positive Cells (35 min)
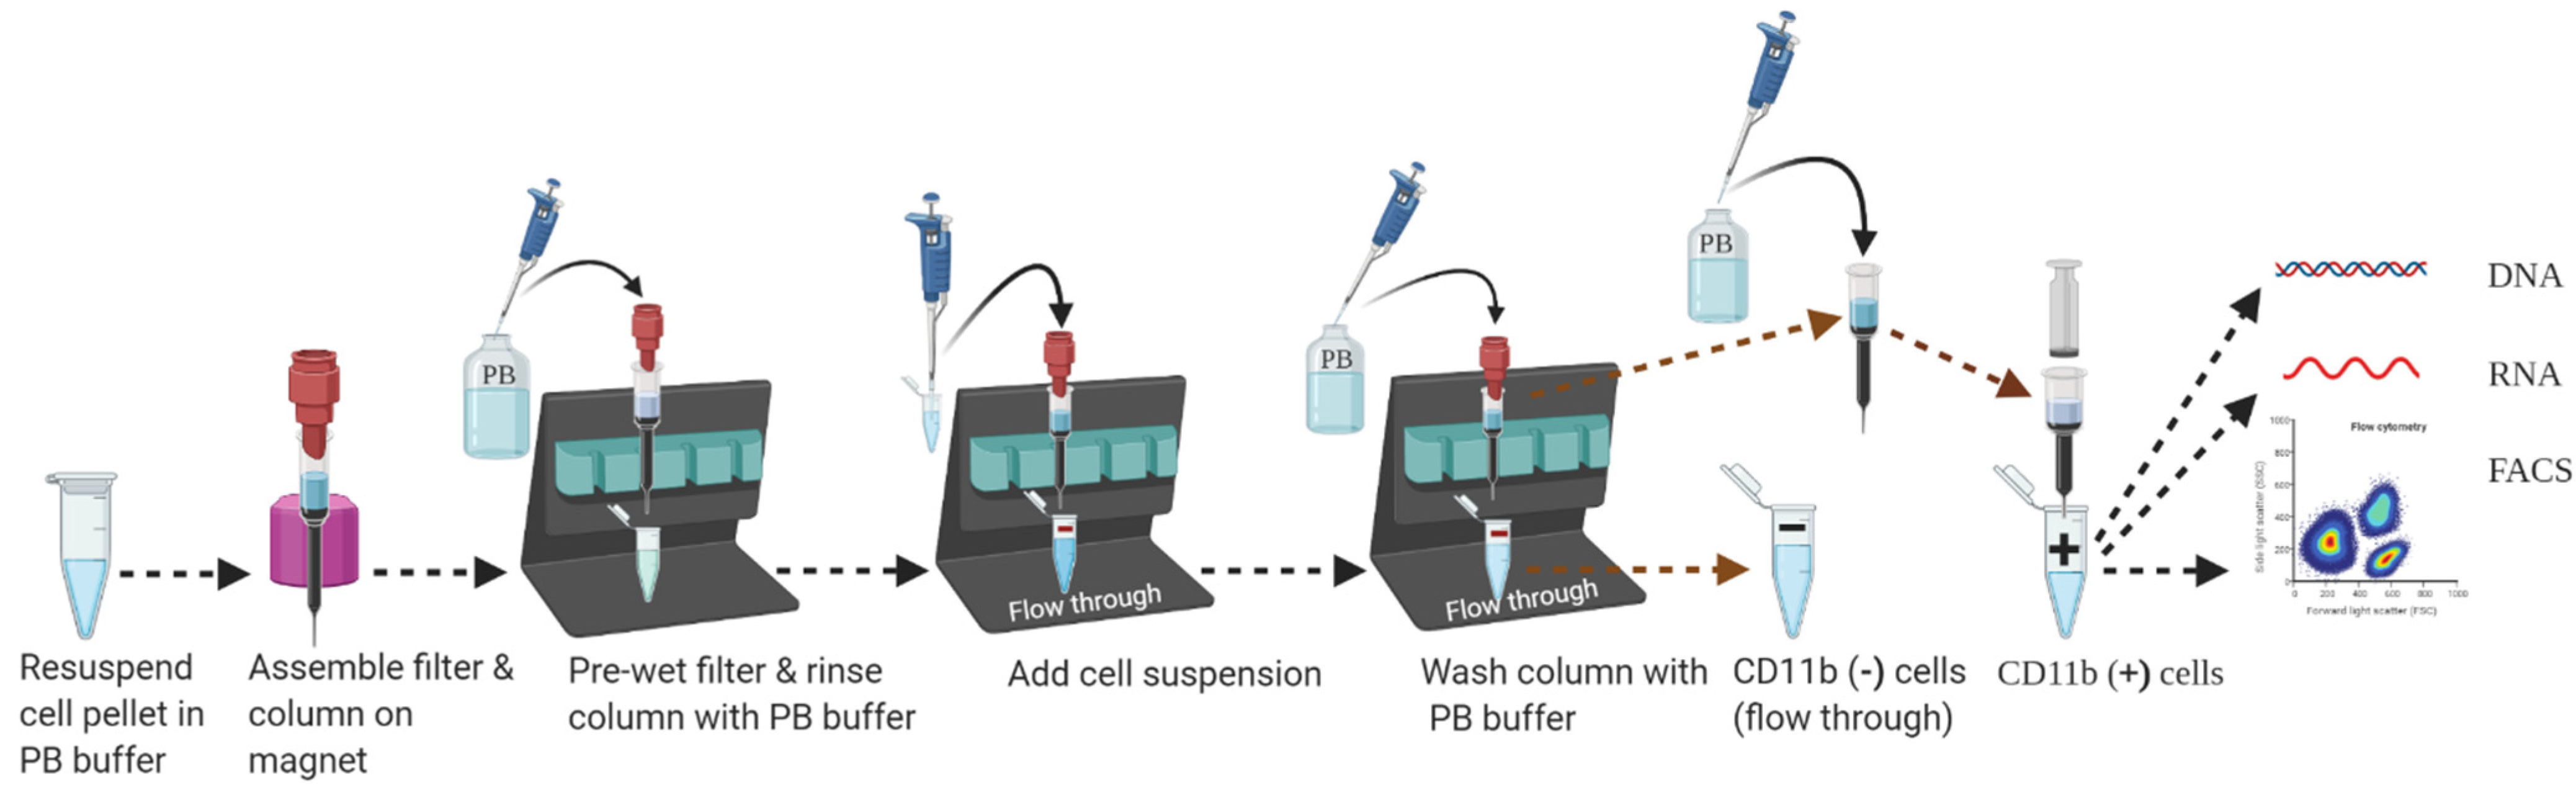
- 39.
- Assemble miniMACS MS column (label up to1 × 10⁷ cells from up to 1 × 10⁸ total cells) inside the miniMACS magnet attached to a suitable MACS separator as shown in Figure 5. Place an open 1.5 mL collection tube below the column to collect flow-through.
- 40.
- Place MACS pre-separation filter (30 µm) on top of the column to remove any cell clumps which may clog the column.
- 41.
- Apply 500 µL degassed PB buffer on the middle of the pre-separation filter and let the buffer run through the column (for LS column, apply 3 mL of buffer) to activate the column. Discard the flow-through and replace the collection tube with a new one.
- 42.
- Apply 460 μL of CD11b-magnetic labeled cell suspension on a pre-separation filter placed on top of the column. Collect flow-through in a sterile 1.5 mL microcentrifuge tube labeled as negative fraction or CD11b (−) cell fraction.
- 43.
- Wash the miniMACS MS column by adding 500 µL of PB buffer on the pre-separation filter 3 times (for the LS column, use 2 mL of PB buffer 3 times). Collect unlabeled cells that pass through and combine with the flow-through from Step 42. This is the CD11b (−) cell fraction or negative fraction.
- 44.
- Remove the miniMACS MS column gently from the magnetic field and place it on a suitable (a sterile 1.5 mL microcentrifuge tube for the MS column and a 5 mL tube for the LS column) collection tube held on ice. Place the flow-through or CD11b (−) cell fraction collection tube immediately on ice.
- 45.
- Pipet an appropriate amount of PB buffer (for the miniMACS MS column: 1 mL and for the LS column: 5 mL; for the MS column, first add 200 uL of PB buffer to pass without pressure, then add 800 uL of PB buffer to flush out with a plunger) into the column reservoir. Push the plunger firmly inside the column reservoir and immediately flush out the magnetically labeled cells in the collection tube. This is the target cell fraction (positive fraction, target fraction, CD11b (+) positive cell fraction, or microglia population).
- 46.
- To increase the purity of isolated microglial cells, it is recommended to enrich the positive fraction over a second miniMACS MS or LS column and repeat the magnetic separation procedure from Step 41 to Step 45, applying a new separation column.
- 47.
- Pellet CD11b (+) cell fraction or microglia cells in the PB buffer by centrifugation at 300–400× g for 10 min at 4 °C.
- 48.
- Aspirate supernatant very carefully, leaving a meniscus of liquid (~50 μL) at the bottom of the tube (as CD11b+ cells pellet, they may not be visible to unaided eyes) to prevent any cell loss.
- 49.
- Resuspend cell pellet in 1 mL of 1 × DPBS, centrifuge at 300–400× g for 10 min at 4 °C, and aspirate supernatant carefully.
- 50.
- Loosen the cell pellets by flicking the microcentrifuge tube 2–3 times and resuspend cell pellets in media of choice for downstream applications.
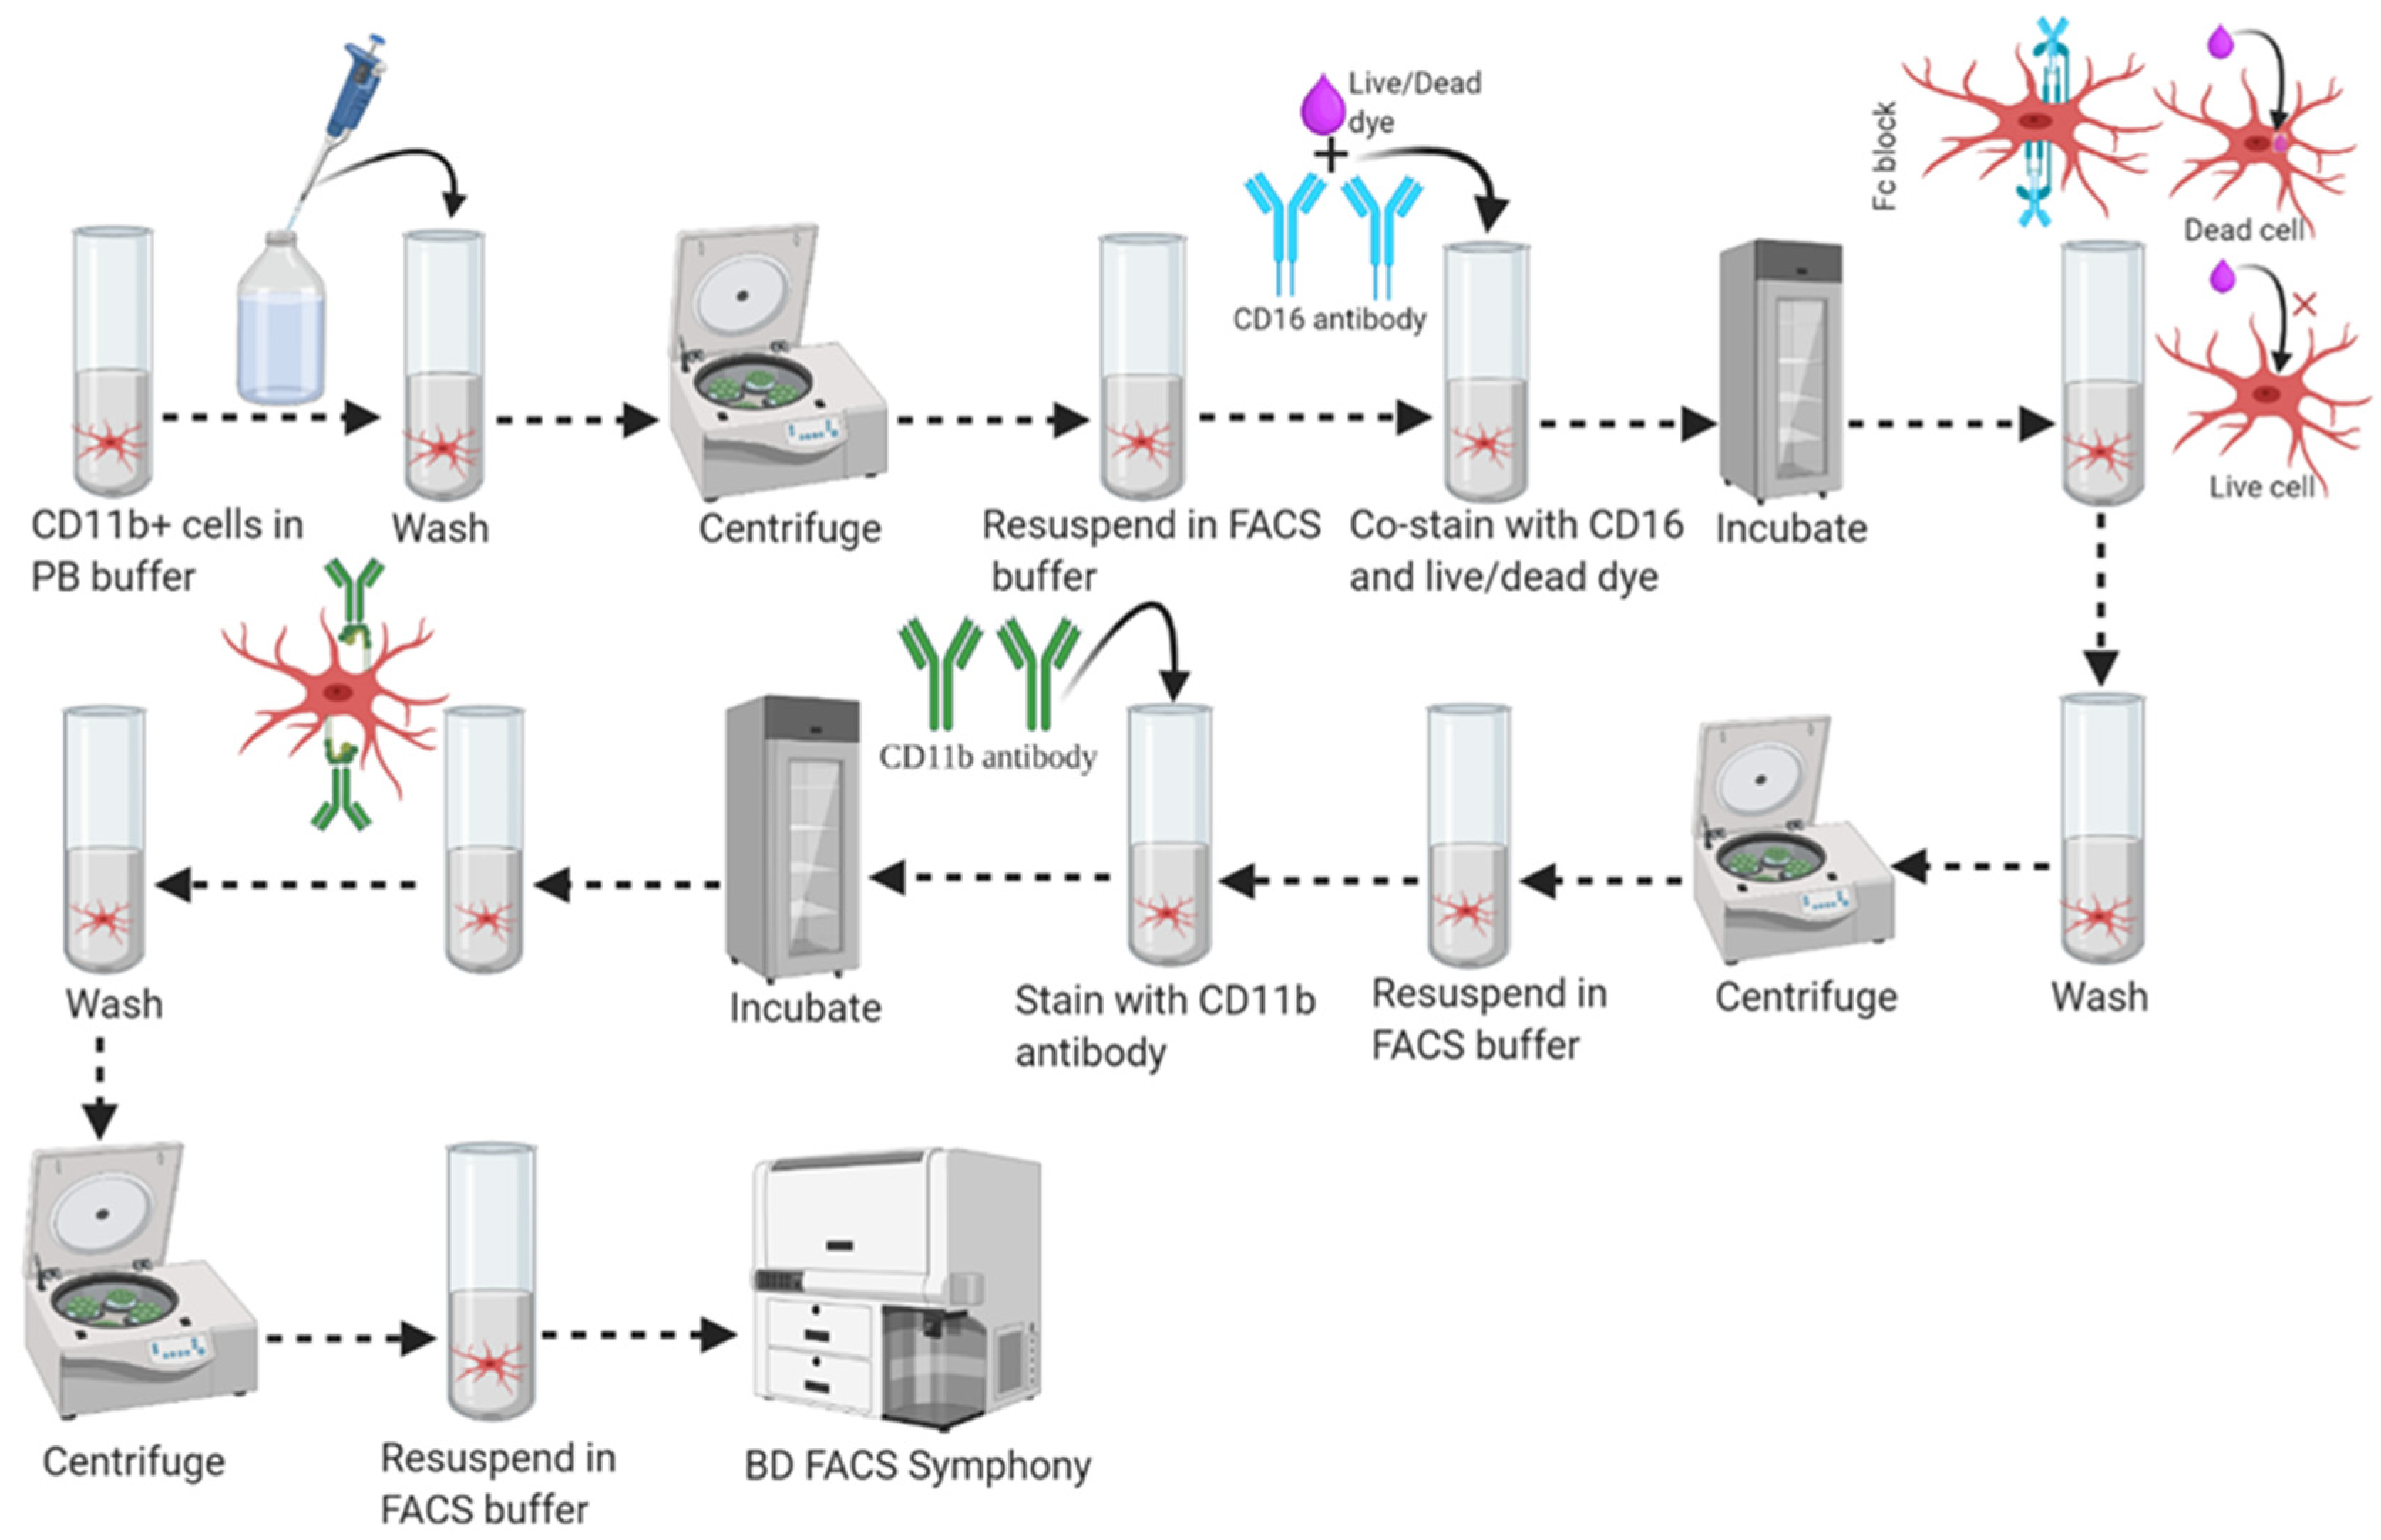
3.6. Part 6: FACS Analysis (100 min)
- A.
- Centrifuge newly received antibodies at high speed to remove “aggregated immunoglobulin”, a major source of nonspecific binding.
- B.
- Prepare fresh buffers:
- C.
- Always stain on ice to prevent internalization of antigen-antibody complexes.
- D.
- Keep stained sample protected from light and heat to avoid tandem degradation.
- E.
- Always include a live/dead (viability dye) staining dye to discriminate live cells.
- F.
- Titrate optimal antibody concentration to maximize the signals to noise ratio. High antibody concentration can increase non-specific binding whereas lower concentration can decrease signal intensity.
- G.
- Carefully select the antibody conjugate. Fluorophores with the highest staining index (such as PE, APC) are best used for cells that have the lowest antigen expression or lower subsets, whereas dimmer fluorophores (PerCP, Alexa Fluor 405) are better suited for more highly expressed antigens or higher subsets.
- H.
- The combined volume of the cell sample and antibody should not exceed 100 μL. High concentration or dilution may affect staining efficiency.
- I.
- For multiple antigens staining, make an antibody cocktail with FACS stain buffer and then add equally to the designated cell suspension.)
- 1.
- Transfer 100 µL of CD11b (+) cell fraction (~1.0 mL stock) and CD11b (−) cell fraction (~1.8 mL stock from Step 46) into two different round-bottom FACS Falcon tubes as shown in Figure 6.
- 2.
- Distribute 40 µL of the “total cells fraction” or “original cell fraction” from Step #38 to another four (4) FACS Falcon tubes (individual tubes labeled as Unstained, CD11b-APC single stain, live/dead-violet 510 single stain, and all stain) and adjust each individual tube’s final volume to 100 μL with 90 μL of FACS stain buffer.
- 3.
- Wash the cells once in 1 mL of FACS stain buffer and centrifuge at 350–400× g for 10 min at 20–25 °C. Resuspend cells in 90 μL of FACS stain buffer.
- 4.
- Add 1 μL of live/dead staining dye (Tonbo Bioscience, Ghost Dye, Violet #510) to the cell suspension and vortex to mix immediately.
- 5.
- Incubate in 2–8 °C freezer for 30 min in the dark.
- 6.
- Wash cells once in 1 mL of FACS stain buffer and centrifuge at 350–400× g for 10 min at 20–25 °C. Resuspend cells in 100 μL of FACS stain buffer.
- 7.
- Add 1/2 μL (Tonbo Bioscience) of anti-mouse CD16/CD32 (Fc shield) antibody to the cell suspension and vortex to mix.
- 8.
- Incubate cell suspension with CD16/CD32 antibody in a 2–8 °C freezer for 5 min in the dark.
- 9.
- Add 5 μL of anti-mouse and human CD11b antibody (Tonbo Bioscience) directly to the pre-incubated cell suspension in the presence of the CD16/CD32 antibody and vortex to mix.
- 10.
- Incubate cell suspension with the CD11b plus Fc shield antibody then mix in a 2–8 °C freezer for 30 min in the dark.
- 11.
- Wash cells twice in 1 mL of FACS buffer and centrifuge at 350–400× g for 10 min at 20–25 °C.
- 12.
- Aspirate supernatant completely via vacuum aspiration and resuspend cell pellets (briefly vortex to dissociate the cell pellet) in a suitable amount (300–400 μL) of FACS buffer for analysis by flow cytometry (FACS) immediately, or store it in a 4 °C freezer for short-term storage. Supplemental Figure S2 shows the gating strategy and associated purity of isolated microglial populations.
3.7. Part 7: Proteomic Analysis (24 h)
- Add 150 μL of RIPA extraction buffer, supplied with protease inhibitor, to microglia cell pellets from Step 49 after the 1 × DPBS wash and resuspend by pipetting up and down with a 200 μL pipette.
- Homogenize cells on ice (to protect from overheating, proteases work best at high temperature) by sonication (total 3–6 pulse, 5-s intervals among individual pulses) to get a uniform, opaque solution with microscopic bubbles.
- Immediately incubate the sample on ice for 10 min and then centrifuge at 15,000× g for 15 min at 4 °C.
- Transfer supernatant to a fresh sterile microcentrifuge tube and keep a record of the transfer volume.
- Quantify protein concentration by the Bradford assay or similar protein assay methods and add 3 × protein loading buffer, considering the total transfer volume.
- Incubate the sample at 95 °C for 5 min to denature the protein, spin briefly, and use for protein loading or store at −80 °C for later use.
- Load an equal amount of the sample (30 μg for GAPDH and IBA1 and 40 μg for GFAP and NeuN) into 10 × SDS-PAGE gel (1.5 mm thick) and run at 100 V. Load protein ladder (page ruler pre-stained protein ladder) to identify the protein band according to molecular weight.
- Activate the PVDF membrane by pre-wetting in methanol for 10 min followed by 10 min of wetting in the transfer buffer.
- Disassemble gel tank, carefully remove the gel, and place on the PVDF membrane, then reassemble the gel-sponge-membrane sandwich in the wet transfer tank (Bio-Rad mini protean tetra cell) containing transfer buffer and run the power supply at 300 mA for 2 h to completely transfer the protein to the PVDF membrane.
- Disassemble the protein transfer tank, carefully remove the PVDF membrane, and block the membrane with the vacuum filtered blocking buffer (3% w/v BSA in 1 × TBST) to avoid a high background during chemiluminescence detection due to non-specific binding of the primary and secondary antibody of interest.
- Incubate the PVDF membrane with the primary antibody of interest (diluted in 5% w/v BSA in 1 × TBST) in a GenHunter Western blot container placed on a platform shaker overnight at 4 °C (cover the membrane completely with antibody solution).
- Remove the primary antibody after incubation, wash the membrane 3–4 times with TBST (5 min for each time), and incubate with the secondary antibody (diluted in blocking buffer) for 1 h at room temperature.
- Remove the secondary antibody after incubation and wash the membrane 3–4 times with TBST (5 min for each time).
- Detect the protein band by applying an equal volume of chemiluminescence solution E and F in a chemiluminescence detector (Azure biosystem, c600).
3.8. Parts 8 and 9: Simultaneous Purification of DNA and RNA (40 min)
- A.
- During the entire procedure, work quickly.
- B.
- Perform all centrifugation steps in a standard tabletop microcentrifuge at 20–25 °C. Make sure the centrifugation chamber does not cool below 20 °C.
- C.
- Make sure all surfaces, including benchtops, pipettors, glassware, lab coats, and solution, are RNase-free. Before starting, decontaminate all surfaces with a decontaminant, such as RNaseZap solution or RNaseZap Wipes. Always use RNase-free tubes, tips, and reagents, and change hand gloves frequently while working.
- D.
- Make sure β-mercaptoethanol is added to the Buffer RLT Plus (lysis buffer) before use. Add 10 μL of β-mercaptoethanol per 1 mL of RLT Plus buffer.
- E.
- Buffer RPE, AW1, and AW2 are each supplied as a concentrated solution. Add the appropriate volume of ethanol (96–100%) as indicated on each bottle to obtain a working solution before using it for the first time.)
- Collect the microglial cell pellet from Step 49 and follow the DNA purification steps shown in Figure 7.
- Loosen the cell pellet by flicking the tube 2–3 times.
- Add 350 uL (<5 × 10⁶ cells)/600 µL (5 × 10⁶ – 1 × 10⁷) of RLT Plus buffer and mix smoothly by pipetting 8–10 times.
- Transfer the lysate directly into a QIAshredder spin column placed on a 2 mL tube. Centrifuge at 20,000× g for 2–3 min.
- Transfer the supernatant carefully (leave any solid pellet or undissolved materials at the bottom) into a Qiagen AllPrep DNA spin column. Place in a 2 mL collection tube. Close the lid carefully so that it does not touch the liquid and centrifuge at ≥8000× g for 30 s. Use the flow-through for RNA extraction.
- Place the AllPrep DNA spin column in a new 2 mL blank collection tube and centrifuge at ≥8000× g for 30 s. After centrifugation, store the AllPrep DNA column at room temperature (15–25 °C) for immediate use or at 4 °C for later DNA purification.
3.8.1. Part 8: Genomic DNA Purification
- 7.
- Add 500 μL buffer AW1 to the AllPrep DNA spin column from step 6. Close the lid carefully so that it does not touch the flow-through and centrifuge at ≥8000× g for 15 s. Discard the flow-through by pipetting. Reuse the DNA spin column for the next step.
- 8.
- Add 500 μL of buffer AW2 to the AllPrep DNA spin column, close the lid carefully so that it does not touch the flow-through, and centrifuge at 20,000× g for 2 min to wash the DNA spin column membrane.
- 9.
- Place the AllPrep DNA spin column in a new 2 mL blank collection tube and discard the old collection tube with the flow-through. Centrifuge at 20,000× g for 1 min.
- 10.
- Place the AllPrep DNA spin column into a new 1.5 mL DNases-free collection tube. Add 15–25 μL of the appropriate volume of Buffer EB directly to the spin column membrane and close the lid carefully. Incubate at room temperature (15–25 °C) for 2–3 min followed by centrifugation at ≥8000× g for 1 min to elute the DNA.
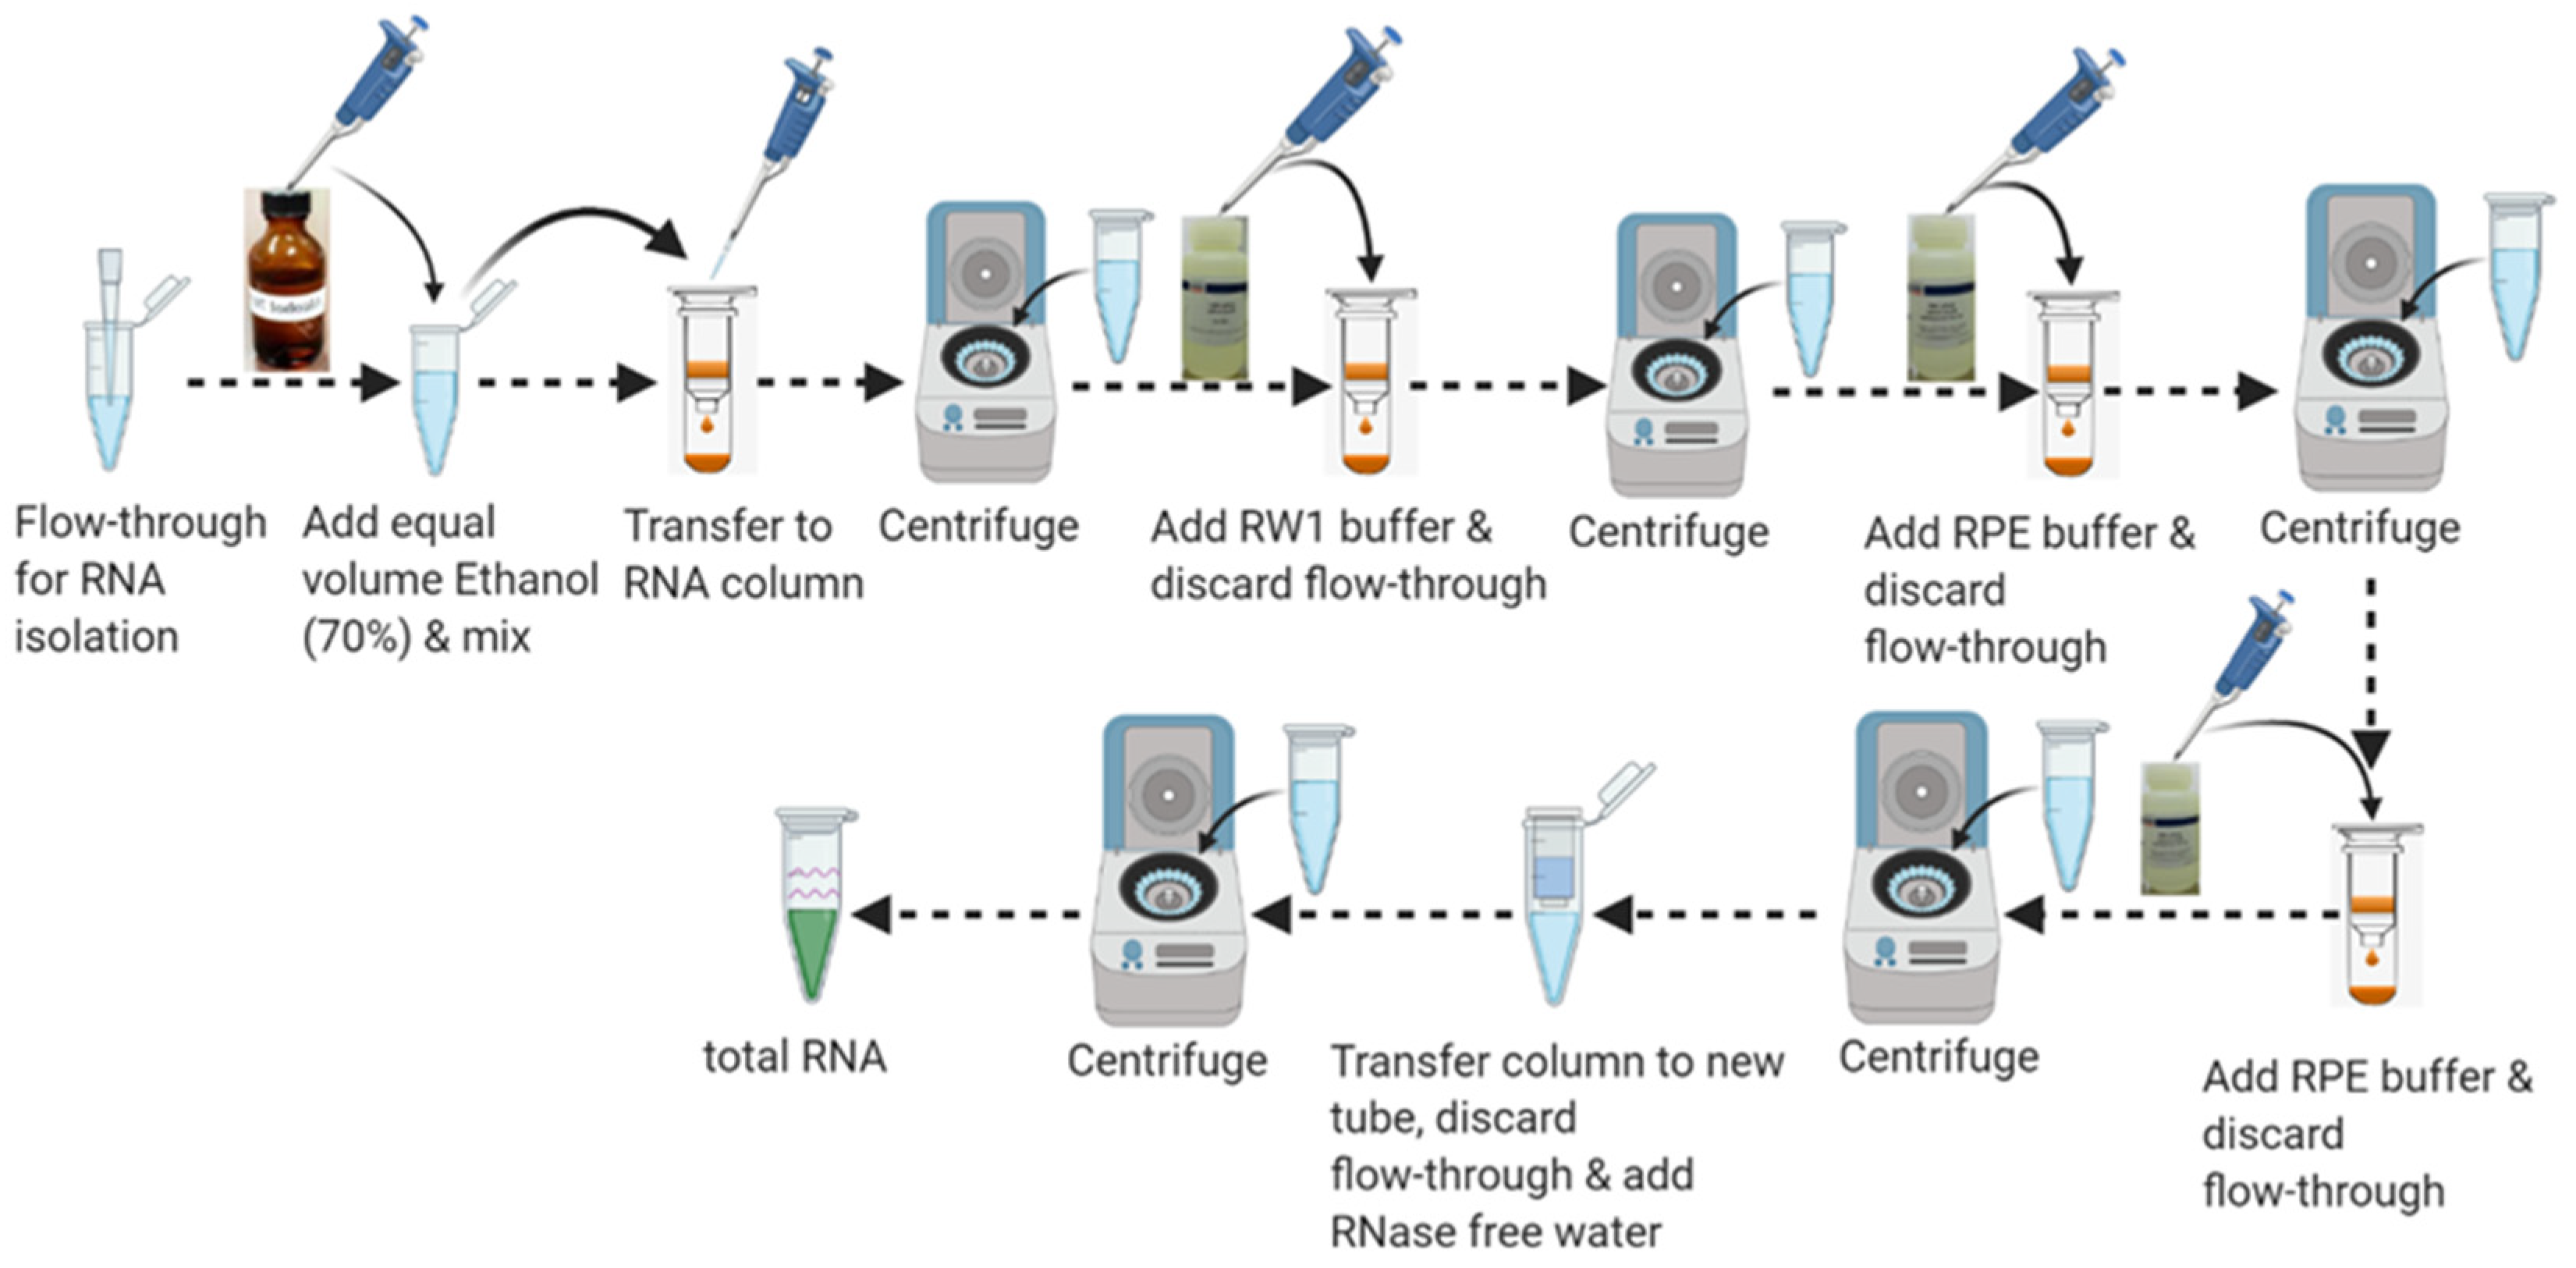
3.8.2. Part 9: Total RNA Purification
- 11.
- Add 1 volume or an equal volume of 70% ethanol (350–600 µL) to the flow-through in the collection tube from Step 5 and mix well by pipetting 3–5 times. Do not vortex or centrifuge. Proceed to the next step immediately.
- 12.
- Pipet up to 700 µL of the sample including any precipitate from Step 11 into the RNeasy spin column and place in a 2 mL collection tube. Close the lid carefully so that it does not touch the sample and centrifuge at ≥8000× g for 15 s. Remove the flow-through by pipetting. Reuse the collection tube for the next step.
- 13.
- Add 700 µL buffer RW1 to the RNeasy spin column. Close the lid carefully so that it does not touch the sample and centrifuge at ≥8000× g for 15 s to wash the RNeasy spin column membrane. Remove the flow-through completely by pipetting. Reuse the collection tube for the next step.
- 14.
- Add 500 µL buffer RPE to the RNeasy spin column. Close the lid carefully so that the column does not contact the flow-through and centrifuge at ≥8000× g for 15 s to wash the RNeasy spin column membrane. Remove the flow through completely. Reuse the collection tube for the next step.
- 15.
- Add 500 µL of buffer RPE to the RNeasy spin column. Close the lid carefully so that the column does not contact the flow-through and centrifuge at ≥8000× g for 2 min to further wash the spin column membrane. Remove the flow-through by pipetting. Reuse the collection tube for the next step.
- 16.
- Place the RNeasy spin column to a new 2 mL blank collection tube and discard the old collection tube with the flow-through. Centrifuge at 20,000× g for 1 min.
- 17.
- Place the RNeasy spin column in a new 1.5 mL RNase-free collection tube. Add 15–25 μL or an appropriate volume of RNase-free water directly to the spin column membrane. Close the lid gently and centrifuge at ≥8000× g for 1 min to elute the RNA as shown in Figure 8. Supplemental Figure S3 shows the quality control analysis of DNA-RNA isolated from purified microglia.
4. Results and Discussion
5. Conclusions
Supplementary Materials
Author Contributions
Funding
Institutional Review Board Statement
Informed Consent Statement
Data Availability Statement
Acknowledgments
Conflicts of Interest
References
- Bachiller, S.; Ferrer, I.J.; Paulus, A.; Yang, Y.; Swanberg, M.; Deierborg, T.; Boza-Serrano, A. Microglia in neurological diseases: A road map to brain-disease dependent-inflammatory response. Front. Cell. Neurosci. 2018, 12, 488. [Google Scholar] [CrossRef] [PubMed] [Green Version]
- Priller, J.; Prinz, M. Targeting microglia in brain disorders. Science 2019, 365, 32–33. [Google Scholar] [CrossRef] [PubMed]
- Casano, A.M.; Peri, F. Microglia: Multitasking specialists of the Brain. Dev. Cell 2015, 32, 469–477. [Google Scholar] [CrossRef] [PubMed] [Green Version]
- Lannes, N.; Eppler, E.; Etemad, S.; Yotovski, P.; Filgueira, L. Microglia at center stage: A comprehensive review about the versatile and unique residential macrophages of the central nervous system. Oncotarget 2017, 8, 114393–114413. [Google Scholar] [CrossRef] [Green Version]
- Masuda, T.; Sankowski, R.; Staszewski, O.; Böttcher, C.; Amann, L.; Sagar; Scheiwe, C.; Nessler, S.; Kunz, P.; Van Loo, G.; et al. Spatial and temporal heterogeneity of mouse and human microglia at single-cell resolution. Nature 2019, 566, 388–392. [Google Scholar] [CrossRef]
- Nacheva, E.; Mokretar, K.; Soenmez, A.; Pittman, A.M.; Grace, C.; Valli, R.; Ejaz, A.; Vattathil, S.; Maserati, E.; Houlden, H.; et al. DNA isolation protocol effects on nuclear DNA analysis by microarrays, droplet digital PCR, and whole genome sequencing, and on mitochondrial DNA copy number estimation. PLoS ONE 2017, 12, e0180467. [Google Scholar] [CrossRef] [Green Version]
- Vesty, A.; Biswas, K.; Taylor, M.W.; Gear, K.; Douglas, R.G. Evaluating the impact of DNA extraction method on the representation of human oral bacterial and fungal communities. PLoS ONE 2017, 12, e0169877. [Google Scholar] [CrossRef]
- Scholes, A.N.; Lewis, J.A. Comparison of RNA isolation methods on RNA-Seq: Implications for differential expression and meta-analyses. BMC Genom. 2020, 21, 249. [Google Scholar] [CrossRef] [Green Version]
- Sultan, M.; Amstislavskiy, V.; Risch, T.; Schuette, M.; Dökel, S.; Ralser, M.; Balzereit, D.; Lehrach, H.; Yaspo, M.-L. Influence of RNA extraction methods and library selection schemes on RNA-seq data. BMC Genom. 2014, 15, 675. [Google Scholar] [CrossRef] [Green Version]
- Cardona, A.; Huang, D.; Sasse, M.E.; Ransohoff, R.M. Isolation of murine microglial cells for RNA analysis or flow cytometry. Nat. Protoc. 2006, 1, 1947–1951. [Google Scholar] [CrossRef]
- Garcia, J.A.; Cardona, S.M.; Cardona, A.E. Isolation and analysis of mouse microglial cells. Curr. Protoc. Immunol. 2014, 104, 14.35.1–14.35.15. [Google Scholar] [CrossRef] [Green Version]
- Grabert, K.; McColl, B.W. Isolation and phenotyping of adult mouse microglial cells. Methods Mol. Biol. 2018, 1784, 77–86. [Google Scholar]
- Lee, J.-K.; Tansey, M.G. Microglia isolation from adult mouse brain. Springer Protoc. Handb. 2013, 1041, 17–23. [Google Scholar]
- Nikodemova, M.; Watters, J.J. Efficient isolation of live microglia with preserved phenotypes from adult mouse brain. J. Neuroinflamm. 2012, 9, 147. [Google Scholar] [CrossRef] [PubMed] [Green Version]
- Olah, M.; Raj, D.; Brouwer, N.; De Haas, A.H.; Eggen, B.J.; Dunnen, W.F.A.D.; Biber, K.P.H.; Boddeke, H.W.G.M. An optimized protocol for the acute isolation of human microglia from autopsy brain samples. Glia 2012, 60, 96–111. [Google Scholar] [CrossRef] [PubMed]
- Rustenhoven, J.; Park, T.I.-H.; Schweder, P.; Scotter, J.; Correia, J.; Smith, A.M.; Gibbons, H.M.; Oldfield, R.L.; Bergin, P.S.; Mee, E.W.; et al. Isolation of highly enriched primary human microglia for functional studies. Sci. Rep. 2016, 6, 19371. [Google Scholar] [CrossRef] [Green Version]
- Hopperton, K.E.; Mohammad, D.; Trépanier, M.O.; Giuliano, V.; Bazinet, R.P. Markers of microglia in post-mortem brain samples from patients with Alzheimer’s disease: A systematic review. Mol. Psychiatry 2018, 23, 177–198. [Google Scholar] [CrossRef]
- Rangaraju, S.; Raza, S.A.; Li, N.X.; Betarbet, R.; Dammer, E.B.; Duong, D.; Lah, J.J.; Seyfried, N.T.; Levey, A.I. Differential phagocytic properties of CD45low microglia and CD45high brain mononuclear phagocytes—Activation and age-related effects. Front. Immunol. 2018, 9, 405. [Google Scholar] [CrossRef] [Green Version]
- Denker, S.P.; Ji, S.; Dingman, A.; Lee, S.Y.; Derugin, N.; Wendland, M.F.; Vexler, Z.S. Macrophages are comprised of resident brain microglia not infiltrating peripheral monocytes acutely after neonatal stroke. J. Neurochem. 2007, 100, 893–904. [Google Scholar] [CrossRef] [Green Version]
- Harms, A.S.; Tansey, M.G. Isolation of murine postnatal brain microglia for phenotypic characterization using magnetic cell separation technology. Methods Mol. Biol. 2013, 1041, 33–39. [Google Scholar]
- Tan, S.C.; Yiap, B.C. DNA, RNA, and protein extraction: The past and the present. J. Biomed. Biotechnol. 2009, 2009, 574398. [Google Scholar] [CrossRef] [Green Version]
- Mattei, D.; Ivanov, A.; van Oostrum, M.; Pantelyushin, S.; Richetto, J.; Mueller, F.; Beffinger, M.; Schellhammer, L.; vom Berg, J.; Wollscheid, B.; et al. Enzymatic dissociation induces transcriptional and proteotype bias in brain cell populations. Int. J. Mol. Sci. 2020, 21, 7944. [Google Scholar] [CrossRef] [PubMed]
- Marsh, S.E.; Kamath, T.; Walker, A.J.; Dissing-Olesen, L.; Hammond, T.R.; Young, A.M.H.; Abdulraouf, A.; Nadaf, N.; Dufort, C.; Murphy, S.; et al. Single cell sequencing reveals glial specific responses to tissue processing & enzymatic dissociation in mice and humans. bioRxiv 2020. [Google Scholar] [CrossRef]
- Li, Q.; Lan, X.; Han, X.; Wang, J. Expression of Tmem119/Sall1 and Ccr2/CD69 in FACS-sorted microglia- and monocyte/macrophage-enriched cell populations after intracerebral hemorrhage. Front Cell Neurosci. 2019, 12, 520. [Google Scholar] [CrossRef] [PubMed]
- Satoh, J.-I.; Kino, Y.; Asahina, N.; Takitani, M.; Miyoshi, J.; Ishida, T.; Saito, Y. TMEM119 marks a subset of microglia in the human brain. Neuropathology 2015, 36, 39–49. [Google Scholar] [CrossRef]
- Turano, A.; Lawrence, J.H.; Schwarz, J.M. Activation of neonatal microglia can be influenced by other neural cells. Neurosci. Lett. 2017, 657, 32–37. [Google Scholar] [CrossRef] [PubMed]
- Bohlen, C.J.; Bennett, F.; Bennett, M. Isolation and culture of microglia. Curr. Protoc. Immunol. 2019, 125, e70. [Google Scholar] [CrossRef]


| Name | Source | Identifier | Location |
|---|---|---|---|
| Chemical, kit, and supplies | |||
| MACS adult mouse brain dissociation kit | Miltenyi Biotec | 130-107-677 (O.N) | Auburn, CA, USA |
| DNase I (1 U/μL) | Invitrogen | 55803 | Eugene, OR, USA |
| PageRulerTM Prestained Protein ladder (26616) | Thermo Fisher Scientific | 815-968-0747 | Waltham, MA, USA |
| Tetramethylethylenediamine (TEMED) | Thermo Fisher Scientific | KA1180732 | Waltham, MA, USA |
| Sodium Dodecyl Sulfate (SDS) | Thermo Fisher Scientific | BP166-500 | Waltham, MA, USA |
| NaOH pellet | Thermo Fisher Scientific | BP359-212 | Waltham, MA, USA |
| Protease inhibitor cocktail | Thermo Fisher Scientific | NE1509703 | Waltham, MA, USA |
| Pentobarbital (1 mg/mL in 1 mL methanol) | Cerilliant Corporation | P-010-1ML | Round Rock, TX, USA |
| 1× PIERCE RIPA buffer | Thermo Fisher Scientific | 89900s | Waltham, MA, USA |
| PVDF transfer membrane (0.45 μm), Immobilon | Bio-Rad | IPVH00010 | Hercules, CA, USA |
| Tween 20 | Acros Organics | A015198101 | Geel, Antwerp, BE |
| Tris base | Thermo Fisher Scientific | BP 152-5 | Waltham, MA, USA |
| Glycine | Thermo Fisher Scientific | BP381-5 | Waltham, MA, USA |
| Sodium Chloride (NaCl) | Thermo Fisher Scientific | S671-10 | Waltham, MA, USA |
| 30× Acrylamide (Protogel) | National Diagnostics | EC-890 | Atlanta, GA, USA |
| 1× Penicillin/streptomycin | Thermo Fisher Scientific | 15140122 | Waltham, MA, USA |
| Bovine serum albumin (BSA) solid | Thermo Fisher Scientific | BP1600-100 | Waltham, MA, USAS |
| Ethylenediaminetetraacetic acid (EDTA) | Millipore Sigma | 58F-0292 | Burlington, MA, USA |
| CD11b (microglia) Microbeads, human and mouse | Miltenyi Biotec | 130-093-634 (O.N) | Auburn, CA, USA |
| RNase & DNase free tips (250 µL) | Rainin | 0703BLTS | Oakland, CA, USA |
| RNase & DNase free tips (20 µL) | CELLTREAT | 229017 | Pepperell, MA, USA |
| RNase & DNase free tips (1 mL) | Thermo Fisher Scientific | 02707402 | Waltham, MA, USA |
| RNase away wipes | Molecular Biology Products | 7007 | Toronto, Ontario, CA |
| Polystyrene round bottom tube (5 mL) | Becton Dickinson Labware | 130-091598 | Franklin Lakes, NJ, USA |
| Syringe filter (0.2 μm) | Nalgene | 190-2520 | Rochester, NY, USA |
| Syringe (5 mL), sterile | Becton Dickinson Labware | 309646 | Franklin Lakes, NJ, USA |
| Conical tube (15 & 50 mL) | Sarstedt, Inc | 62554.205 & 62547.100 | Newton, NC, USA |
| Microcentrifuge tube (1.5 mL), DNase & RNase free | Thermo Fisher Scientific | AM12400 | Waltham, MA, USA |
| AllPrep DNA/RNA mini kit | Qiagen | 160014919 | Hilden, Germany |
| AllPrep DNA/RNA/miRNA Universal Kit | Qiagen | 166047328 | Hilden, Germany |
| 2-mercaptoethanol (β-ME) | Thermo Fisher Scientific | 21985-023 | Waltham, MA, USA |
| Ammonium persulfate (APS) | National Diagnostics | National Diagnostics, EC-504 | Atlanta, GA, USA |
| Glutamic acid | Millipore Sigma | G7029 | Burlington, MA, USA |
| MACS pre-separation filter (70 μm & 30 μm) | Miltenyi Biotec | 130-095-823 (O.N) | Auburn, CA, USA |
| QIAshredder (REF79654) | Qiagen | 160010887 | Hilden, Germany |
| MACS separation column (LS) | Miltenyi Biotec | 130-042-401 | Auburn, CA, USA |
| Disposable vacuum filter, 0.22 µm (50 mL) | Millipoe Sigma | SCGP00525 | Burlington, MA, USA |
| Cell culture petri dish (60 × 15 mm) | Becton Dickinson Labware | 35-3002 | Franklin Lakes, NJ, USA |
| Countess cell counting chamber slide | Invitrogen | 2C11940P | Eugene, OR, USA |
| Antibody and dyes | |||
| Anti-mouse GFAP antibody | Millipore Sigma | G3893 | Burlington, MA, USA |
| Anti-rabbit IBA1 antibody | Wako | 016-20001 | Chuo-ku, Osaka, JP |
| Anti-mouse GAPDH antibody | Santa Cruz Biotechnology | sc32233 | Dallas, TX, USA |
| Anti-rabbit NeuN antibody | Invitrogen | PA578499 | Eugene, OR, USA |
| Anti-mouse IgG-HRP, secondary antibody | Santa Cruz Biotechnology | sc516102 | Dallas, TX, USA |
| Anti-rabbit IgG-HRP, secondary antibody | Santa Cruz Biotechnology | sc2317 | Dallas, TX, USA |
| Anti-mouse/-human FITC-CD11b antibody M1/70 | Tonbo Biosciences | 35-0112-U100 | San Diego, CA, USA |
| Anti-mouse CD16/CD32 (Fc shield) antibody 2.4G2 | Tonbo Biosciences | 70-0161-U500 | San Diego, CA, USA |
| Ghost Dye violet 510 (viability dye) | Tonbo Biosciences | 13-0870-T100 | San Diego, CA, USA |
| Trypan blue stain (0.4×) solution | Thermo Fisher Scientific | 15250-061 | Waltham, MA, USA |
| Ready stock solution | |||
| DPBS (with calcium/magnesium) | Thermo Fisher Scientific | 14040-133 | Waltham, MA, USA |
| DPBS (without calcium/magnesium) | Hyclone Laboratories, Inc | SH30028.02 | Logan, UT, USA |
| HBSS (with calcium/magnesium) | Thermo Fisher Scientific | 14025-092 | Waltham, MA, USA |
| HBSS (without calcium/magnesium) | ATCC | 30-2213 | Manassas, VA, USA |
| Distilled Water | Thermo Fisher Scientific | 15230-162 | Waltham, MA, USA |
| RNase free surface decontaminant | APExBIO | 10-228 | Houston, TX, USA |
| MACS BSA stock solution | Miltenyi Biotec | 130-091-376 (O.N) | Auburn, CA, USA |
| HyPure molecular biology grade water, Hyclone | Genesee Scientific | 87-1162 | El Cajon, CA, USA |
| MACS debris removal solution | Miltenyi Biotec | 130-107-677 (O.N) | Auburn, CA, USA |
| MACS red blood cell (RBC) removal solution | Miltenyi Biotec | 130-107-677 (O.N) | Auburn, CA, USA |
| Diethyl pyrocarbonate (DEPC) | RPI | D43060-25.0 | Mount Prospect, IL, USA |
| Dulbecco’s Modified Eagle Medium (DMEM) | ATCC | 30-2002 | Manassas, VA, USA |
| Pierce Chemiluminescence solution (ECL solution) | Thermo Fisher Scientific | 89880E & F | Waltham, MA, USA |
| RNase free water | Thermo Fisher Scientific | BP561-1 | Waltham, MA, USA |
| Fetal bovine serum (FBS) liquid | R&D Systems | S11150H | Minneapolis, MN, USA |
| Methanol | Thermo Fisher Scientific | A412-4 | Waltham, MA, USA |
| Ethanol (absolute), 200 proof | Thomas Scientific | 05K16PA | |
| Experimental animal strain | |||
| Male, C67BL6J mice, 7 months old, body weight 46.23 g | University of North Dakota | n/a | |
| Male, Thy1-aSyn mice, 7 months old, body weight 39 g | University of North Dakota | n/a | |
| Others | |||
| GraphPad Prism | GraphPad Software | n/a | |
| ImageJ | National Institute of Mental Health | Imajej.nih.gov/ij/download.html | |
| BioRender | BioRender | n/a | |
| Name | Supplier/Manufacturer | Location |
|---|---|---|
| Refrigerated Ultracentrifuge | Eppendorf, model 5417R | Enfield, CT, USA |
| Refrigerated Rotor with buckets | Sorvall-RT7 Plus | Hampton, NH, USA |
| Glass Pasteur Pipet (sterile) | Thermo Fisher Scientific | Waltham, MA, USA |
| Scissors and knife (sterile) | FEATHER safety razor | Kita-Ku, Osaka, JP |
| MACS MultiStand | Miltenyi Biotec | Auburn, CA, USA |
| MACS Separation Columns (MS) | Miltenyi Biotec | Auburn, CA, USA |
| MACS magnet for MS column | Miltenyi Biotec, | Auburn, CA, USA |
| −80° freezer | Thermo Fisher Scientific | Waltham, MA, USA |
| Reciprocal shaking water bath | Precision Scientific, model 25 | Winchester, VA, USA |
| 4–8° freezer | Biomedical Solutions, Inc | Stafford, TX, USA |
| Speed Vacuum System (SC200) | Savant Systems Inc | Hyannis, MA, USA |
| End Over End shaker | Barnstead Thermolyne Corporation | Ramsey, MN, USA |
| CO2 water-jacketed incubator | NUAIRE IR Autoflow | Plymouth, MN, USA |
| Countess II automated cell counter | Life Technologies | Carlsbad, CA, USA |
| Chemiluminescence detector system | Azure biosystem, c600 | Dublin, CA, USA |
| Vortex mixer | Thermo Fisher Scientific, 02215365 | Waltham, MA, USA |
| Gel electrophoresis power supply | Bio-Rad, 041BR85979 | Hercules, CA, USA |
| Name | Recipe |
|---|---|
| PB buffer | Dissolve 0.5 × BSA in 1 × DPBS, sterile filter, degas, and cool to 2–4 °C |
| 1 × PBS | Mix 8 g NaCl, 0.2 g KCl, 1.15 g Na2HPO4, 0.24 g KH2PO4 in 800 mL H2O, adjust pH to 7.4, add H2O until volume 1L |
| FACS buffer | Dissolve 2%FBS in 1 × DPBS, add 5 mM EDTA, sterile filter |
| FACS stain buffer | Dissolve 2%FBS in 1 × DPBS, sterile filter |
| MACS Enzyme Mix-I (EM-1) | Mix 1900 μL Buffer Z and 50 μL Enzyme P (prepare fresh) |
| MACS Enzyme Mix-II (EM-2) | Mix 20 μL Buffer Y and 10 μL Enzyme A |
| 500 mM EDTA solution, pH 8.0 | Mix 186.1 g Na2-EDTA in 800 mL dH2O, adjust pH 8.0 by adding NaOH pellets and make volume 1 L with dH2O |
| Transfer Buffer | Mix 14.4 g glycine and 3 g Tris in 800 mL dH2O, add 200 mL methanol to make the volume 1 L |
| Running Buffer | Mix 14.4 g glycine, 3 g Tris and 1 g SDS in 800 mL dH2O, adjust pH to 8.3 and add dH2O till the volume 1 L |
| Stacking gel (4×) | dH2O 2.7 mL, 30×acrylamide 0.67 mL, 1.0 mol/L Tris (pH 6.8) 0.5 mL, 10%SDS 40 µL, 10%APS 40 µL and TEMED 4.0 µL |
| Resolving gel (10× and 15×) | dH2O 4 mL, 30 × acrylamide 3.3 mL, 1.5 mol/L Tris (pH 8.8) 2.5 mL, 10%SDS 100 µL, 10%APS 100 µL and TEMED 4.0 µL (10×) dH2O 2.3 mL, 30 × acrylamide 5 mL, 1.5 mol/L Tris (pH 8.8) 2.5 mL, 10%SDS 100 µL, 10%APS 100 µL and TEMED 4.0 µL (15×) |
| Washing buffer (1 × TBST) | Mix 8.0 g NaCl, 0.2 g KCl and 3.0 g tris base in 800 mL dH2O, add 0.1% tween20, adjust pH 8.0, then add dH2O till the volume 1 L, autoclave and store at room temperature (RT) |
| Blocking buffer | Dissolve 3% BSA in 1 × TBST, sterile filter |
| Filtering | CD11b+ Cells | Viability (%) | Purity (%) | DNA (mini) | RNA (mini) | DNA (Universal) | RNA (Universal) |
|---|---|---|---|---|---|---|---|
| Single Filter | (3.3–6.0) × 105 | 85–91% | 73–78% | 300–1100 ng | 250–625 ng | 1000–1505 ng | 900–1000 ng |
| Double Filter | (3.0–5.1) × 105 | 71–80% | 90–95% | 200–510 ng | 200–410 ng | 780–1050 ng | 750–800 ng |
Publisher’s Note: MDPI stays neutral with regard to jurisdictional claims in published maps and institutional affiliations. |
© 2021 by the authors. Licensee MDPI, Basel, Switzerland. This article is an open access article distributed under the terms and conditions of the Creative Commons Attribution (CC BY) license (https://creativecommons.org/licenses/by/4.0/).
Share and Cite
Raihan, M.O.; McGregor, B.A.; Velaris, N.A.; Brishti, A.; Hur, J.; Porter, J.E. Method of Microglial DNA-RNA Purification from a Single Brain of an Adult Mouse. Methods Protoc. 2021, 4, 86. https://doi.org/10.3390/mps4040086
Raihan MO, McGregor BA, Velaris NA, Brishti A, Hur J, Porter JE. Method of Microglial DNA-RNA Purification from a Single Brain of an Adult Mouse. Methods and Protocols. 2021; 4(4):86. https://doi.org/10.3390/mps4040086
Chicago/Turabian StyleRaihan, Md. Obayed, Brett A. McGregor, Nathan A. Velaris, Afrina Brishti, Junguk Hur, and James E. Porter. 2021. "Method of Microglial DNA-RNA Purification from a Single Brain of an Adult Mouse" Methods and Protocols 4, no. 4: 86. https://doi.org/10.3390/mps4040086
APA StyleRaihan, M. O., McGregor, B. A., Velaris, N. A., Brishti, A., Hur, J., & Porter, J. E. (2021). Method of Microglial DNA-RNA Purification from a Single Brain of an Adult Mouse. Methods and Protocols, 4(4), 86. https://doi.org/10.3390/mps4040086