Tracking Single Cells Motility on Different Substrates


Abstract
:1. Introduction
2. Experimental Design for Single Cell Motility Assay
2.1. Materials
- Type I collagen from rat tail tendon (Corning, Inc., Corning, NY, USA; Cat# 354249)
- 10× phosphate buffered saline (PBS) (MilliporeSigma, Burlington, MA, USA; Cat# 70011044)
- Trypsin-EDTA (Corning, Inc.; Cat# 25-052-CI)
- Dulbecco’s Modified Essential Medium (GE Healthcare, Logan, UT, USA; Cat# SH30021.01)
- 100 units/mL penicillin-100 μg/mL streptomycin (Caisson lab, Smithfield, UT, USA; Cat# PSL01-100ML)
- Fetalgro bovine growth serum (RMBIO, Missoula, MT, USA; Cat# FGR-BBT)
- 1M sodium hydroxide (NaOH) (Fisher Scientific, Waltham, MA, USA; Cat# S318-100)
- Parafilm (Southern labware, Cumming, GA, USA; Cat# HS234526A)
- 35 mm diameter glass-bottomed dish (Cellvis, Mountain View, CA, USA; Cat# D35-20-0-N)
- De-ionized (DI) water
2.2. Equipment and Software
- Cell culture incubator
- Laminar air flow
- Centrifuge
- Hemocytometer
- ImageJ software (NIH, Bethesda, MD, USA)
- 250 µm transmission electron microscopy copper grid (TED Pella, Inc., Redding, CA, USA)
- Olympus CK2 Inverted Trinocular Phase Tissue Culture Microscope (OLYMPUS OPTICAL CO. LTD., Japan) equipped with an AM Scope 3.7 digital camera (AmScope, Irvine, CA, USA)
- CytoSMART® device (Lonza Group, Basel, Switzerland)
3. Procedure
- Collagen Preparation: Time for Completion: 00:30 hNote: All reagent used should be sterile and the work should be performed under the sterile hood; collagen preparation should be done on ice.
- To prepare collagen solution of a final concentration at X mg/mL, add the required volume of type I collagen into a sterile 50 mL falcon tube.
![Mps 03 00056 i001]() CRITICAL STEP Because of the viscosity of collagen solution, be slow when adding collagen.
CRITICAL STEP Because of the viscosity of collagen solution, be slow when adding collagen.![Mps 03 00056 i001]() CRITICAL STEP Use a 50 mL tube so that collagen can be mixed easily with gentle swirls in subsequent steps.
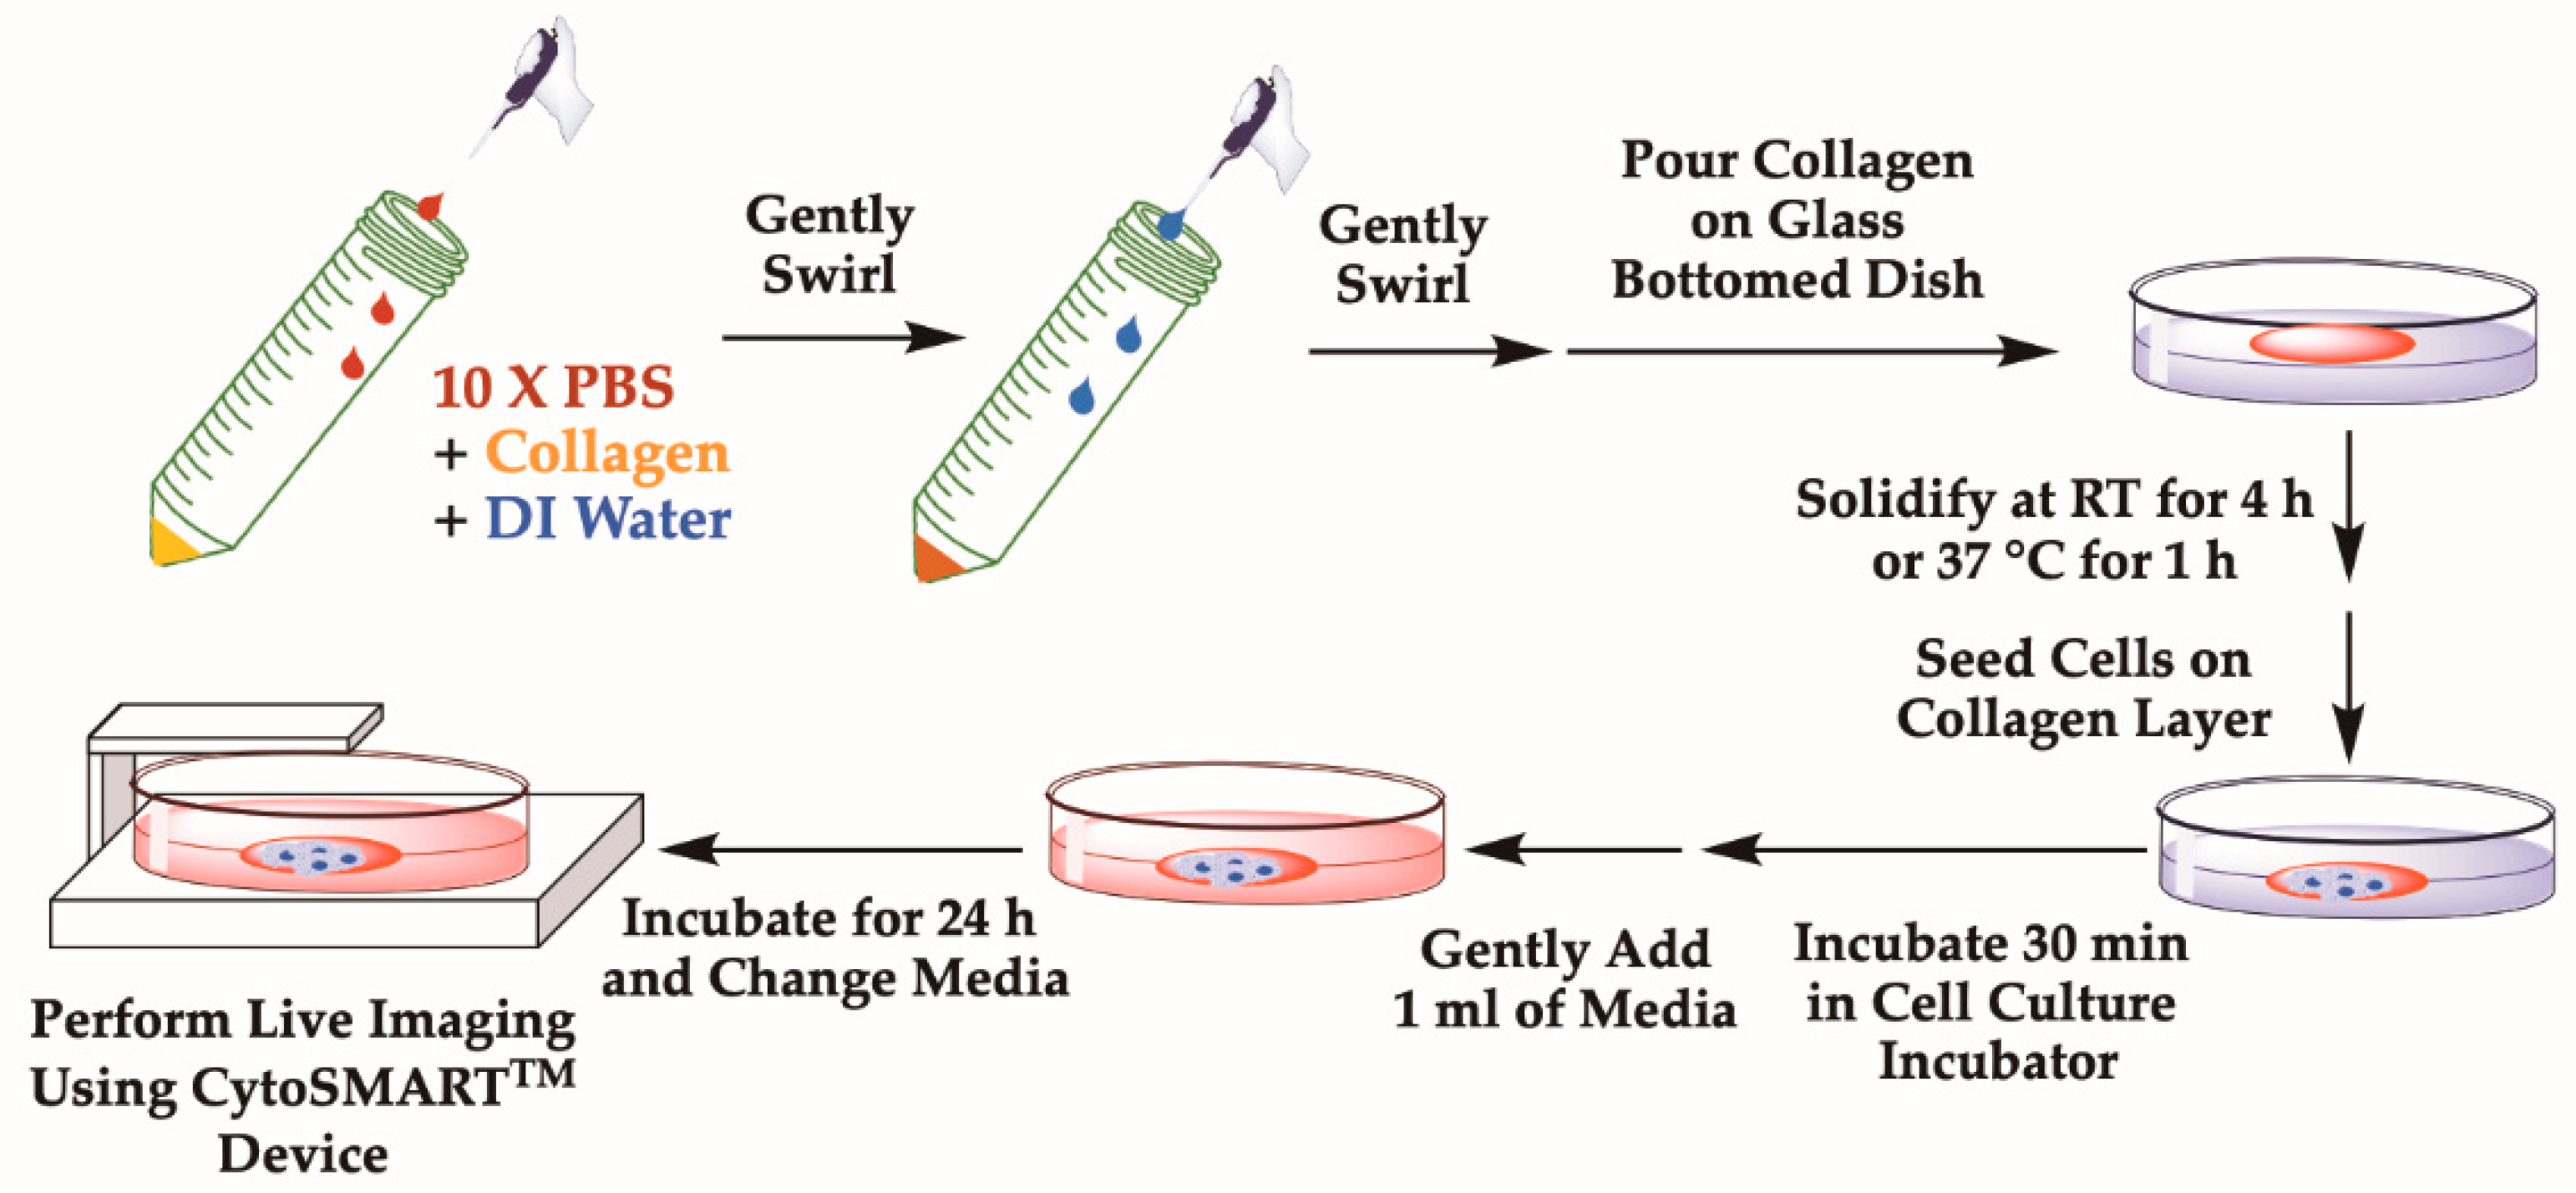
CRITICAL STEP Use a 50 mL tube so that collagen can be mixed easily with gentle swirls in subsequent steps. - Collagen should also be mixed with 1 part of sterile 10× PBS supplemented with phenol red, which is used to indicate the pH of collagen solution (Figure 1).
![Mps 03 00056 i001]() CRITICAL STEP While making collagen solution, avoid air bubble formation by gently pipetting collagen solution, as bubbles cannot be removed easily once introduced into collagen solution.
CRITICAL STEP While making collagen solution, avoid air bubble formation by gently pipetting collagen solution, as bubbles cannot be removed easily once introduced into collagen solution. - The final volume should be adjusted with sterile DI water.
- o
- For instance, if one is making 500 μL of 4 mg/mL of collagen, take out 250 μL of collagen solution (if stock is 8 mg/mL), add 50 μL of 10X PBS, add 150 μL of water to make a final volume of 500 µL.
- If the pH of the collagen solution is acidic, the color of the solution will be yellow.
- o
- If the solution is yellow, carefully add 0.1 M NaOH dropwise and examine the color of the solution. As NaOH is added, the color of the solution will shift from yellow to orange-red, which indicates that the pH is around 7.4–7.6 (Figure 1).
![Mps 03 00056 i001]() CRITICAL STEP The mixture should be kept cold while adjusting the pH.
CRITICAL STEP The mixture should be kept cold while adjusting the pH. - Mix the entire collagen solution by gently swirling the tube and keep the tube in an ice bucket until you are ready to pour the mixture into a plate.
- Add the final collagen solution onto a glass surface of a 35 mm diameter glass-bottomed dish (Figure 1).
![Mps 03 00056 i001]() CRITICAL STEP While adding collagen, avoid introducing bubbles on the dish. Swirl the dish to uniformly distribute collagen over the surface of the glass-bottomed area. In total, 250 μL of collagen solution is required to fully cover the glass bottom surface of a dish 35 mm in diameter.
CRITICAL STEP While adding collagen, avoid introducing bubbles on the dish. Swirl the dish to uniformly distribute collagen over the surface of the glass-bottomed area. In total, 250 μL of collagen solution is required to fully cover the glass bottom surface of a dish 35 mm in diameter. - Wrap the collagen-coated dish with parafilm to avoid evaporation and pH change. The dish can be left for 1 h at 37 °C or 4 h at RT to obtain different structures of collagen network.
![Mps 03 00056 i002]() PAUSE STEP The dish can instead be left overnight at 4 °C.
PAUSE STEP The dish can instead be left overnight at 4 °C. - OPTIONAL STEP Collagen concentration and polymerization condition described here have been optimized for MDA-MB-231 cells. Therefore, substrate concentration or polymerizing condition can be modified for different cells or substrate types.
- Cell Seeding (Steps #1 to 6 can vary based on cell type): Time for Completion: 01:00 h
- Wash adherent cancer cells growing on a 10 cm tissue culture-treated dish with 5 mL of 1X PBS. Remove PBS.
- Add 1 mL of 0.05% trypsin-EDTA to each dish and return cells to the tissue culture incubator (37 °C and 5% CO2). Incubate for 5 min or until cells are detached from the bottom of the dish.
- Quench trypsin by adding trypsin inhibitor or >4X the volume (4 mL) of cell culture medium.
- Vigorously pipette the 5 mL solution up and down to create single cell suspension.
- Transfer 5 mL of single cell suspension to a 15 mL conical tube and count number of cells using a hemocytometer or cell counter.
- Centrifuge the solution at 1000× g for 3 min. Aspirate the solution and resuspend the cell pellet in fresh cell culture medium so that cell number is 1 million cells/mL.
- Make 200 μL of cell suspension using complete growth medium.
- o
- For MDA-MB-231 cells, use 30,000 to 35,000 cells in Dulbecco’s modified essential medium DMEM containing 10% Fetalgro bovine growth serum, 100 units/mL penicillin, and 100 μg/mL streptomycin.
- o
- For 30,000 cells, add 30 uL of suspended cells in 170 μL of complete medium. Mix them well.
- Carefully add cell suspension dropwise on the glass surface or collagen layer (Figure 1).
- o
- Gently swirl the dish to distribute cells evenly as cells are being dropped.
![Mps 03 00056 i001]() CRITICAL STEP If plating cells on a collagen coated dish, be careful not to damage the existing collagen layer while plating cells.
CRITICAL STEP If plating cells on a collagen coated dish, be careful not to damage the existing collagen layer while plating cells. - Place the dish inside the tissue culture incubator for 30–40 min to allow cells to attach to the substrate.
- After the incubation, add 1.5 mL of complete growth medium to the plate and incubate for 24 h in the tissue culture incubator to allow cells to completely attach to their substrate.
- The next day, gently remove the old media.
![Mps 03 00056 i001]() CRITICAL STEP It is best to use a pipette, rather than using an aspirator, as the latter can remove the cell/substrate layer as well.
CRITICAL STEP It is best to use a pipette, rather than using an aspirator, as the latter can remove the cell/substrate layer as well. - Add 3 mL of fresh growth medium to the plate.
![Mps 03 00056 i001]() CRITICAL STEP Do so gently so that cell/collagen mixture remains undisturbed.
CRITICAL STEP Do so gently so that cell/collagen mixture remains undisturbed.
- Setting Up Live Cell Imaging:


- 3A. Setting up the CytoSMARTTM System for Live Imaging: Time for Completion: 24:15 h
- Disinfect the device by 70% Ethanol and place the CytoSMARTTM device inside the tissue culture incubator.
- Run the CytoSMARTTM cable between the door and the frame of the incubator.
- The cable connecting the CytoSMARTTM device and a monitoring tablet should be well connected.
- Open the incubator and check to see if the light panel around the CytoSMARTTM device is illuminated.
- o
- Blue light: no project running; Red light: project running.
- Turn on the tablet connected to the CytoSMARTTM device.
- Place a dish containing cells on the CytoSMARTTM device.
- Observe cells on the tablet screen. Adjust the focus and brightness of cells using the slider to generate good contrast between cells and the background.
![Mps 03 00056 i001]() CRITICAL STEP The plus and minus buttons can be used for more precise adjustments.
CRITICAL STEP The plus and minus buttons can be used for more precise adjustments. - To start recording, select “Project”.
- Select the “Project Name” and use the on-screen keyboard to give the project a name.OPTIONAL STEP Extra notes can be added if desired (e.g., cell type, passage, etc.).
- Select “Next” and enter your email address to receive the project link.
- Select “Next” and select the desired recording frequency.
- Use the drop-down menu to select an interval of 5 min.
- Select the “Start” button. The system will immediately enter sleep mode. Tap anywhere on the screen to re-activate the screen.
- o
- An email will be sent with a link to open the project.
- After 24 h of recording, select the red “Stop project” button to finish the project.
- o
- The system will send an email indicating that the project has ended.
- To access the project, select the “View” button in the email. This will take the user to CytoSMARTTM Connect Project Page where cells can be monitored remotely with any browser-capable device. Once the project is finished, the data can be downloaded as a movie in avi format and series of images.
- Downloaded data will be used for cell tracking analysis.
- 3B. Motility Analysis
- 3B-1. Convert Images to Stack Using ImageJ
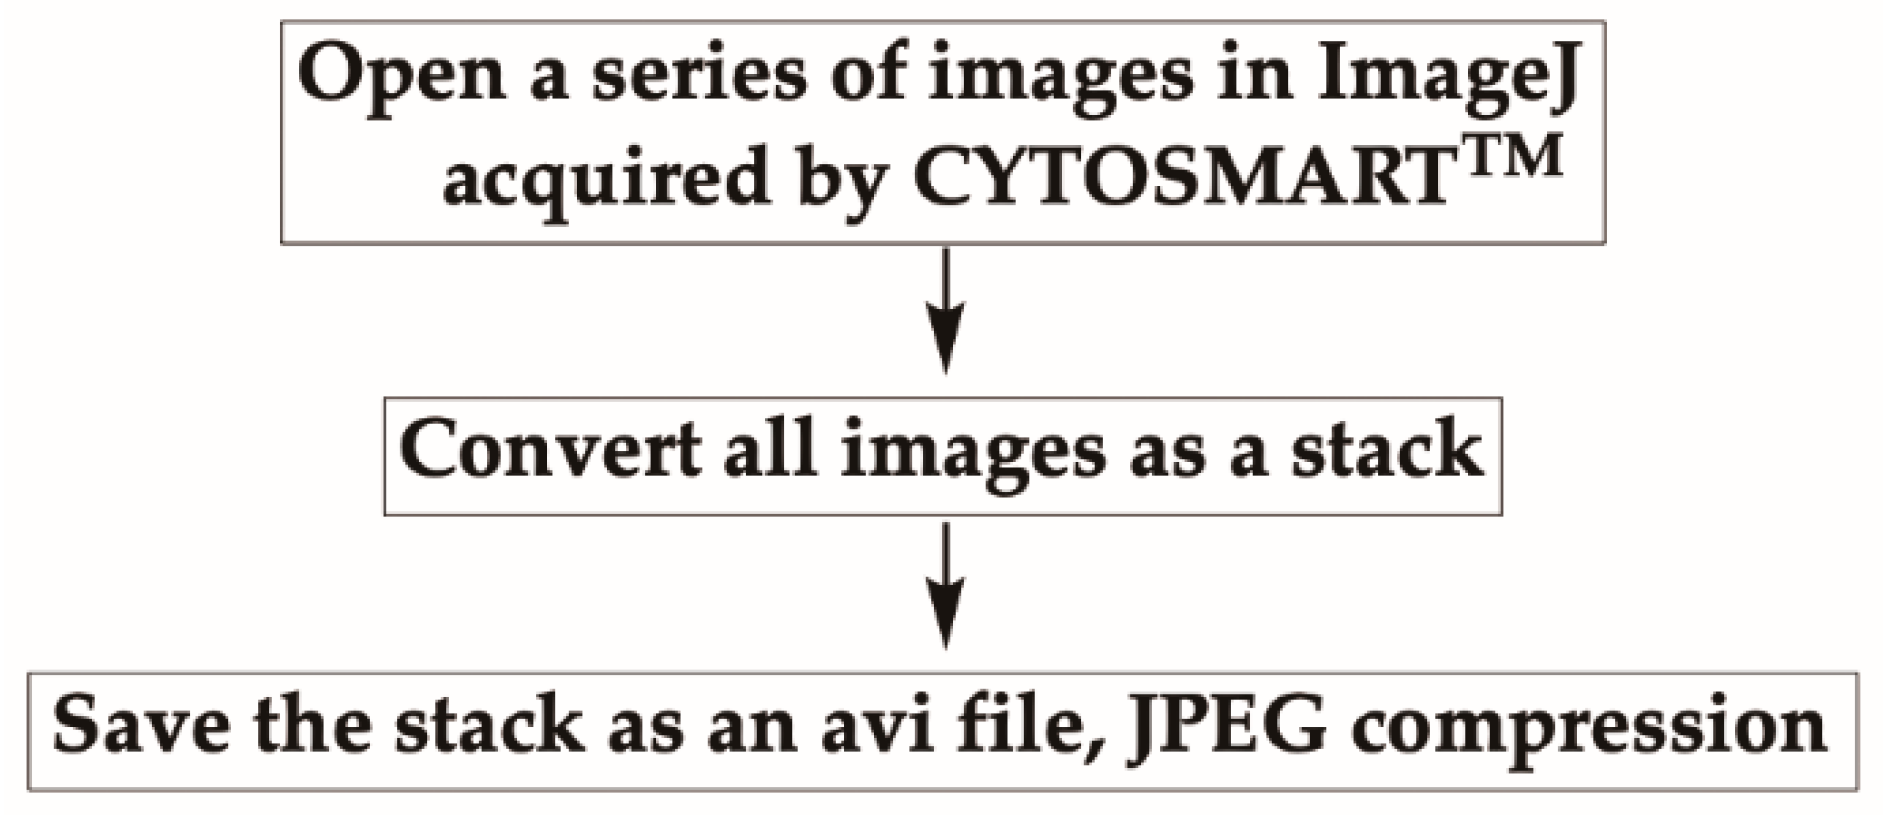
- Open a series of images in a folder acquired by the CYTOSMARTTM system in ImageJ, by either dragging the folder containing images onto the ImageJ bar or by selecting option “File” then “Open” from the top menu.
- Once all images are opened, convert them as a stack by selecting “Images” then “Images to Stack” from the menu.
- Save the stack as an avi file, JPEG compression with 7 fps (frames per second) (Figure 3).
- 3B-2. Select the Frame to AnalyzeAs cells are grown for 24 h, there may be lot of debris or cells in clusters appearing in a recorded frame, which can interfere with the analysis. To avoid this problem, choosing a field of view containing no more than 10 isolated cells is preferred.
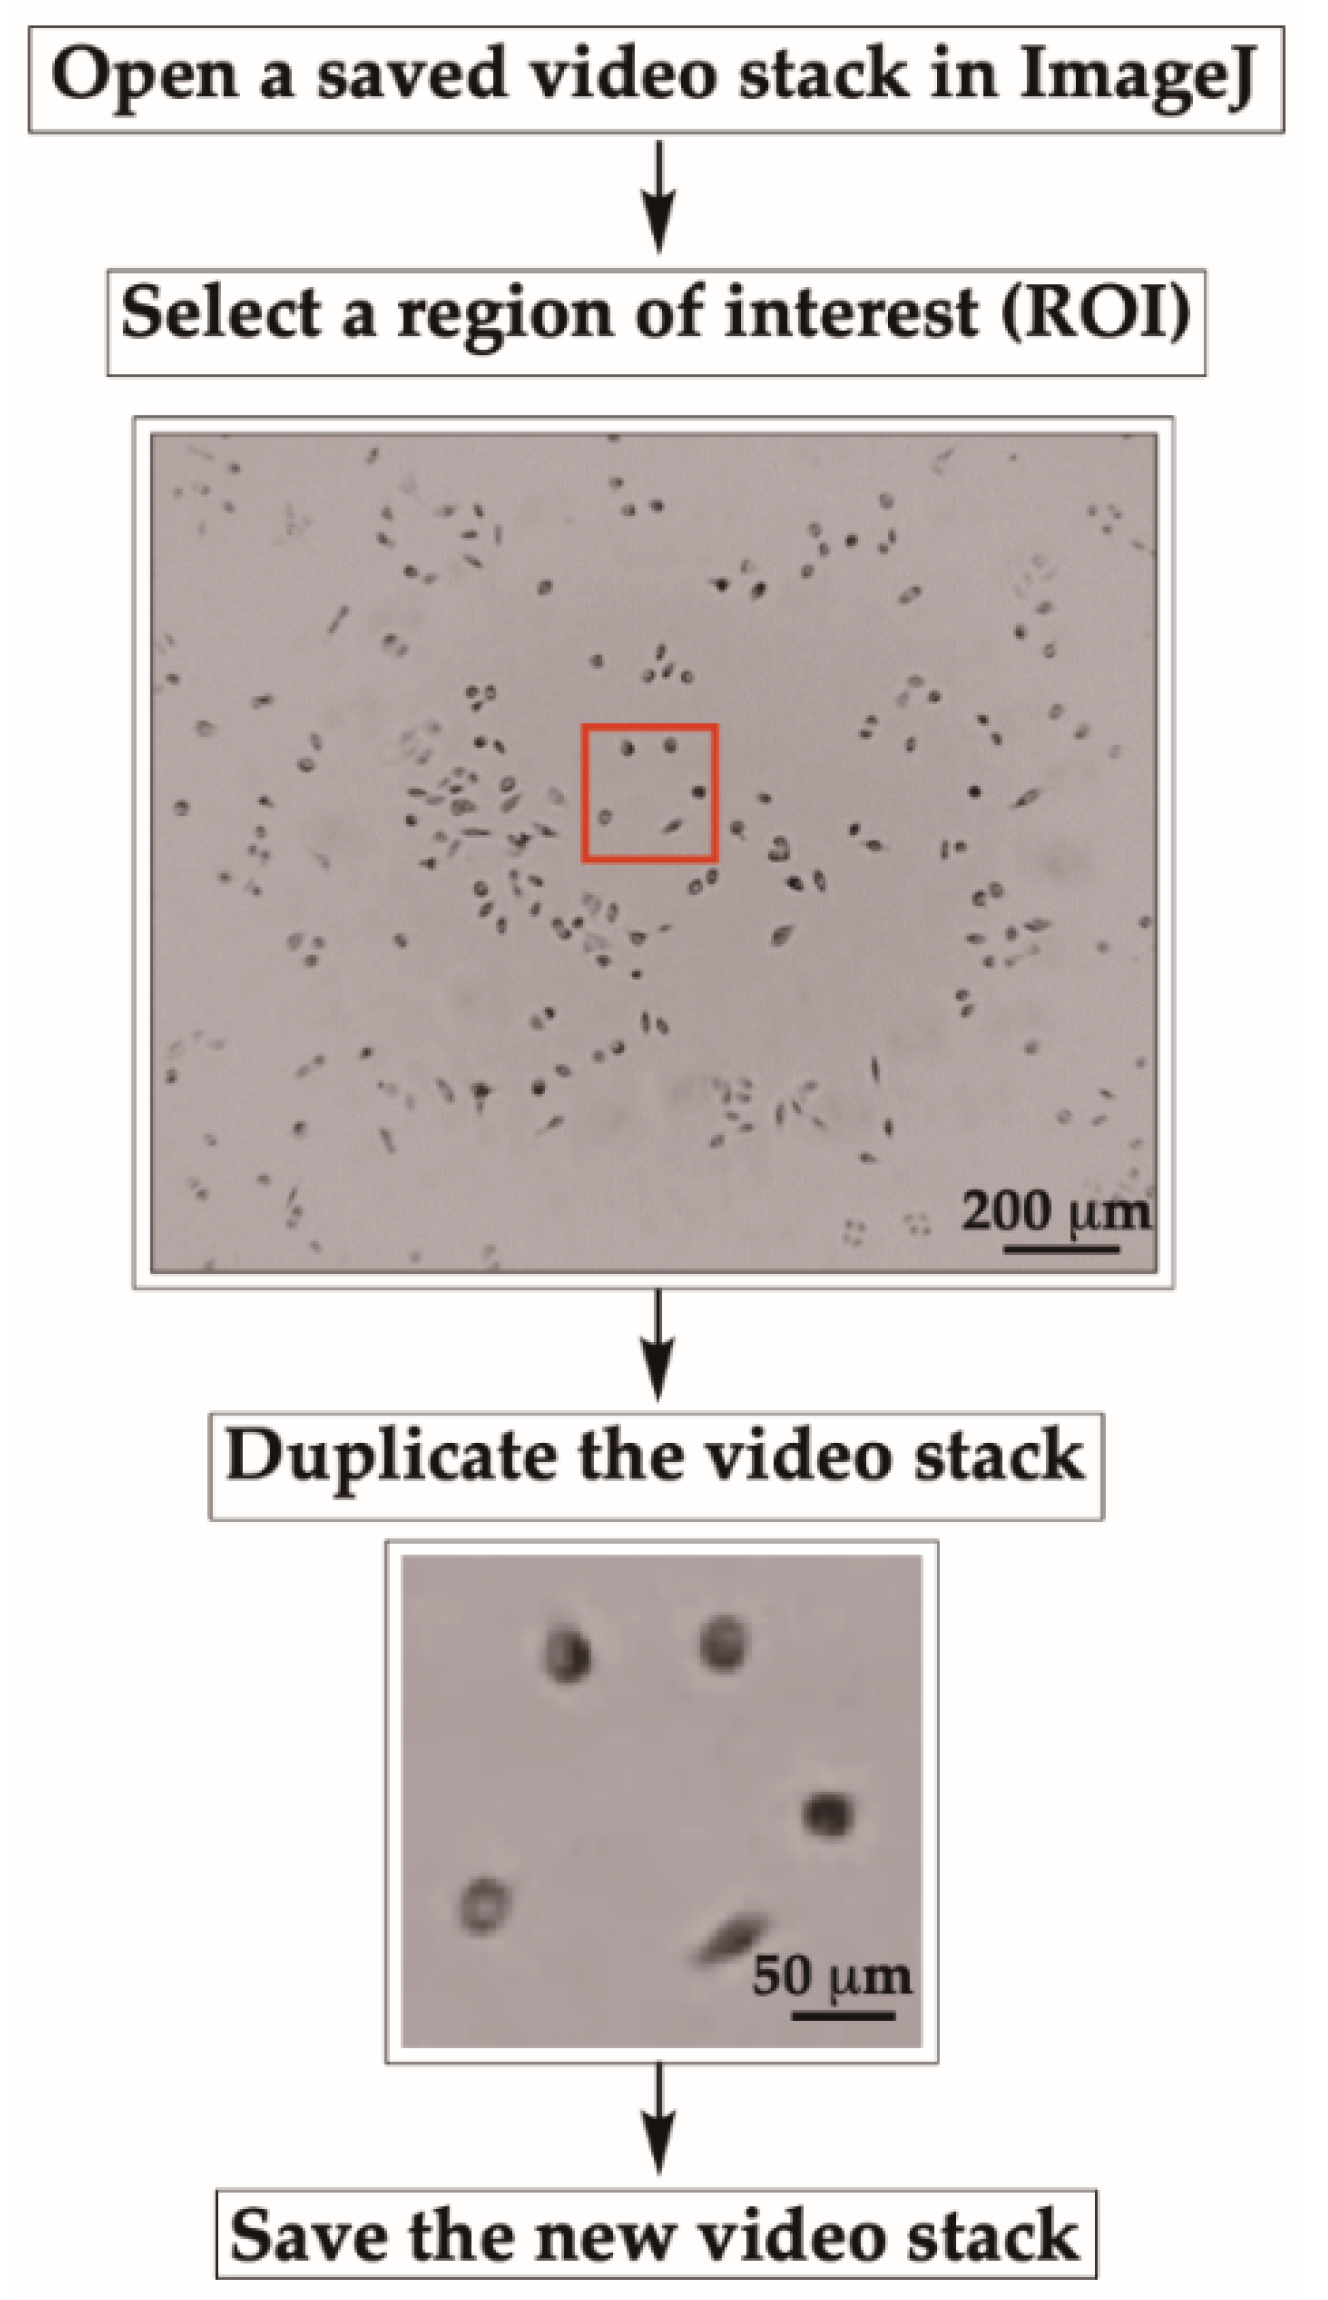
- To start cell motility analysis, open a video stack (from 3B-1) in ImageJ.
- Select a region of interest (ROI) with a “specific size of area” by using the rectangular selection tool located at the top left corner of the ImageJ tool bar.
- Save the new video stack (as described earlier in 3B-1) for further analyses.
![Mps 03 00056 i001]() CRITICAL STEP Since the entire field cannot be analyzed at once, a specific region of interest with a sufficient number of cells is cropped, duplicated, and saved as a new stack for further analysis.
CRITICAL STEP Since the entire field cannot be analyzed at once, a specific region of interest with a sufficient number of cells is cropped, duplicated, and saved as a new stack for further analysis. - Use the same procedure described earlier to select other ROIs with the same size to analyze the motility of all cells in the entire frame.
![Mps 03 00056 i001]() CRITICAL STEP MDA-MB-231 cell area usually changes dramatically over a period of 24 h. They may be more elongated during migration but become rounded during cell division, senescence, or apoptosis. Because of the drastic changes in cell shape, wrMTrck may lose track of a cell during duration of the video. To better trace cells, users should trace few cells at a time; five to 10 cells per ROI is recommended. If necessary, one cell per frame can also be analyzed.OPTIONAL STEP In some cases where cells leave the frame, reducing the number of stacks can retain the cell movement within the frame.
CRITICAL STEP MDA-MB-231 cell area usually changes dramatically over a period of 24 h. They may be more elongated during migration but become rounded during cell division, senescence, or apoptosis. Because of the drastic changes in cell shape, wrMTrck may lose track of a cell during duration of the video. To better trace cells, users should trace few cells at a time; five to 10 cells per ROI is recommended. If necessary, one cell per frame can also be analyzed.OPTIONAL STEP In some cases where cells leave the frame, reducing the number of stacks can retain the cell movement within the frame.
- 3B-3. Background Subtraction Using Rolling-Ball AlgorithmBackground subtraction is necessary to every image analysis process, as it helps to correct unevenly illuminated backgrounds caused by uncorrelated fluctuations (Figure S1A).
- To remove uneven backgrounds, the rolling-ball method [42], which can remove large spatial variations of the background densities, is applied by selecting the “Process” tab, then choosing “Subtract Background”.
![Mps 03 00056 i001]() CRITICAL STEP A dialog box will appear asking users to adjust the rolling-ball radius, which should be set to at least the size of the largest object that is not part of the background.OPTIONAL STEP A preview option can be used to check the result before the actual process.
CRITICAL STEP A dialog box will appear asking users to adjust the rolling-ball radius, which should be set to at least the size of the largest object that is not part of the background.OPTIONAL STEP A preview option can be used to check the result before the actual process.
- 3B-4. Create Binary StackAfter the background subtraction, open a video stack. While opening, select “Convert to Grayscale.” Then, create a binary video stack by selecting “Image” and choosing “Adjust” and “Threshold” (Figure 5). Adjust the sliders to find a proper level where only cells become red, limiting the appearance of red spots in the background (Figure 5).
- Once an appropriate level is achieved, check the “Stack histogram” box to apply the threshold to the entire video and click “Apply.”
![Mps 03 00056 i001]() CRITICAL STEP During migration, if cells come close to each other, the wrMTrck algorithm may falsely recognize two cells as one cell. Thus, cells to be analyzed must be visually inspected before running wrMTrck. If cells happen to touch each other, simply separate cells by drawing a line between them using a 1 pixel “Straight line” tool (Figure S1B).
CRITICAL STEP During migration, if cells come close to each other, the wrMTrck algorithm may falsely recognize two cells as one cell. Thus, cells to be analyzed must be visually inspected before running wrMTrck. If cells happen to touch each other, simply separate cells by drawing a line between them using a 1 pixel “Straight line” tool (Figure S1B). - The thresholded movie before and after adjusting the threshold will look like the stack on the right in Figure 5.
- Further noise correction to eliminate dots or fill holes in objects can be done by selecting “Process.” Next, either choose “Noise” then “Despeckle” or “Binary” then “Fill Holes.”
- Enter in the real-world scale of the cells in the movie by selecting “Analyze” then “Set Scale.”
- Insert information for “Distance in pixels,” “Known distance,” and “Unit of length” while maintaining “Pixel aspect ratio” at 1.0. Then click “OK.” If “Distance in pixel” is 164 pixels, “Known distance” is 250 and “Unit of length” is micron; the scale for the analysis would correspond to 0.656 pixels per one micron.
- IV.
- Tracking of CellsTo track cells, download the wrMTrck plugin (https://www.mrc-lmb.cam.ac.uk/wormtracker/) [39] and install in ImageJ.
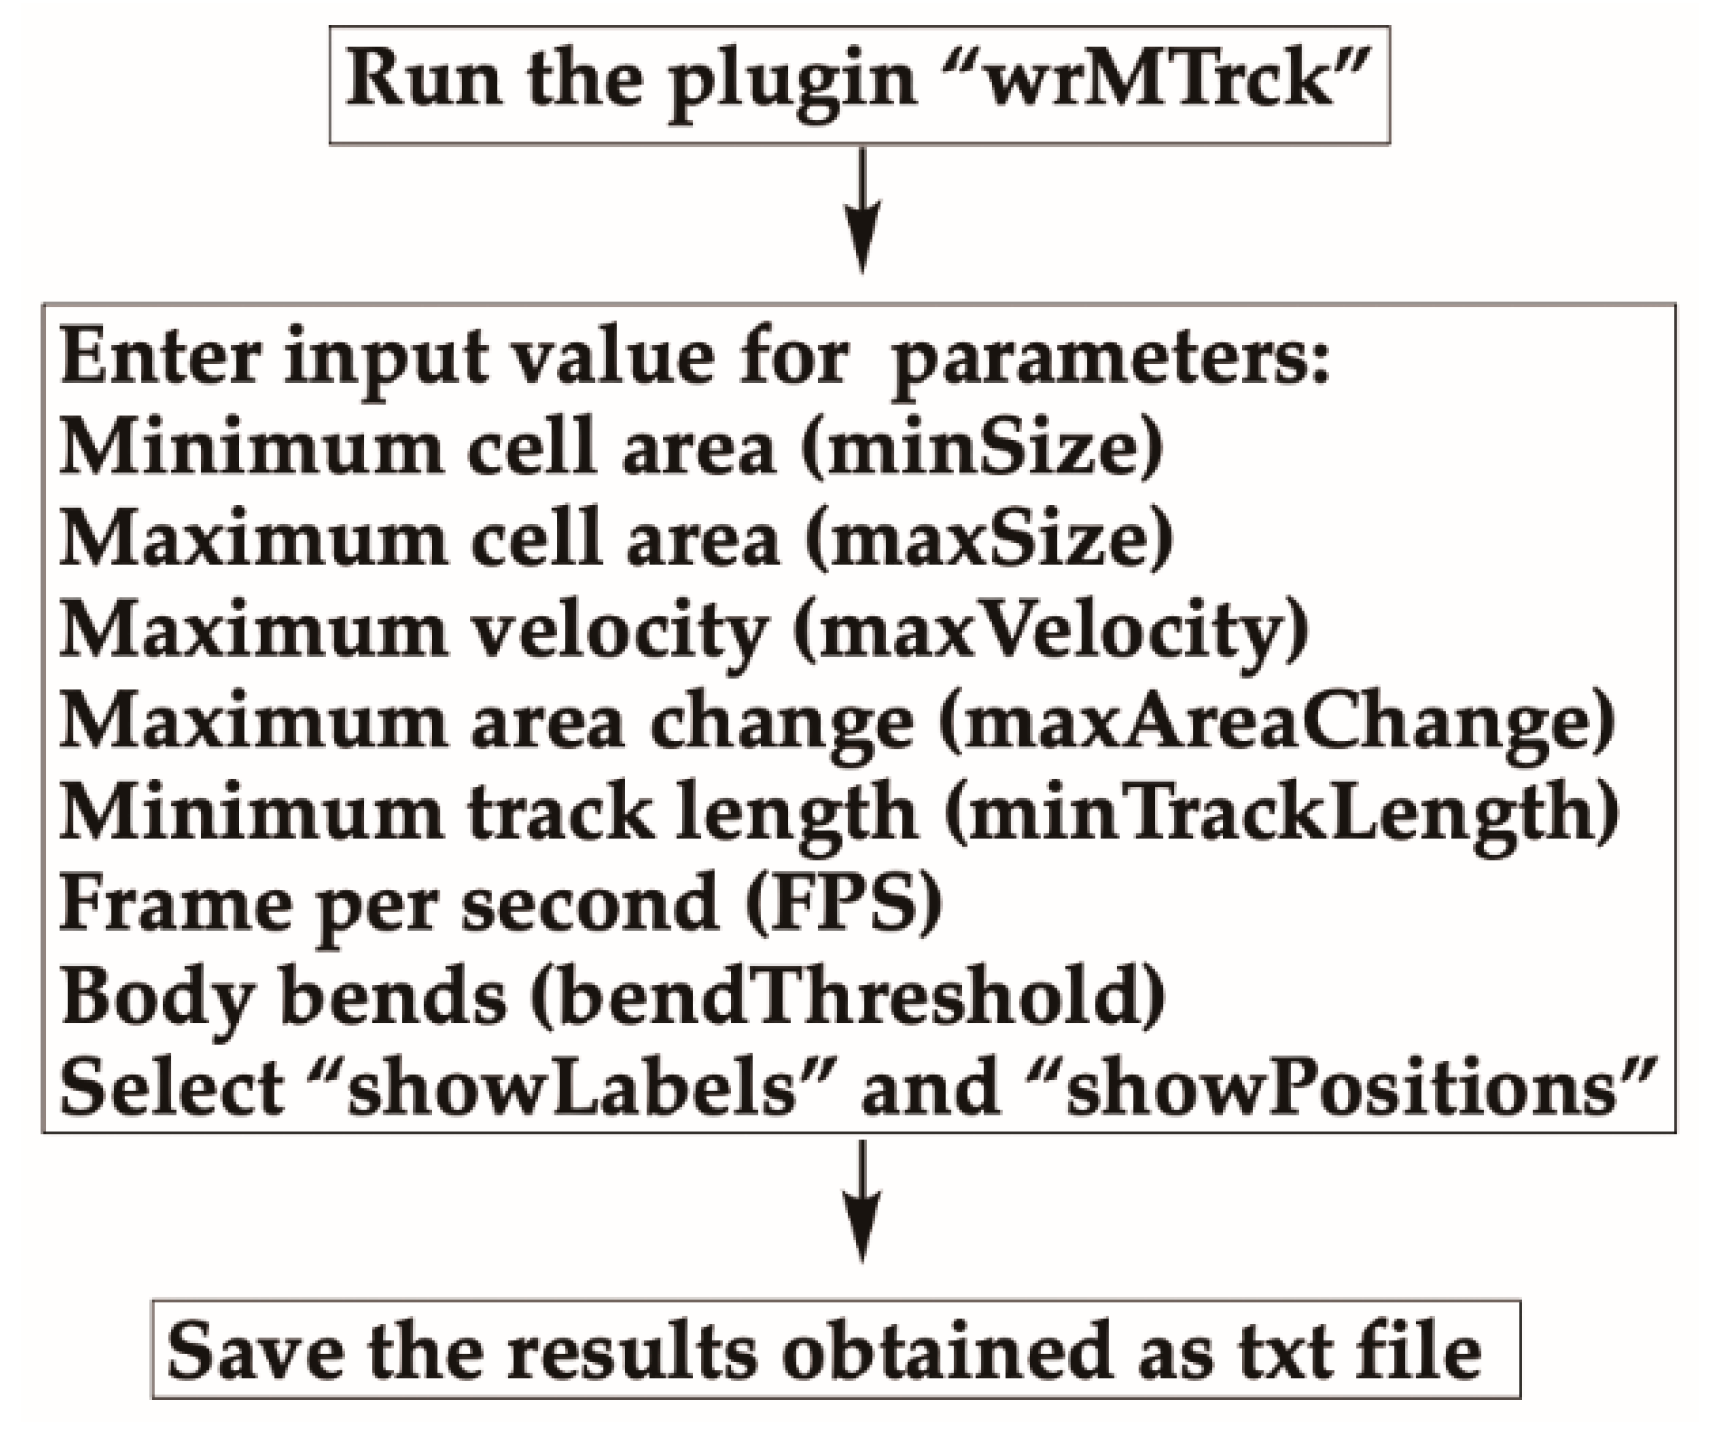
- Run the wrMTrck plugin by selecting “Plugins” then “wrMTrck” (Figure 6). A dialog box will appear.
- Enter values for:
- o
- The minimum (minSize) and maximum (maxSize) cell area in pixels.
- o
- maxVelocity: the number of pixels a cell is allowed to travel between two frames.
- o
- maxAreaChange: the % change in area between consecutive frames allowed—for example, if two cells collide on the plate, each track is broken due to the doubled area.
- o
- Tracks shorter than “minTrackLength” will be discarded.
- o
- fps stands for frames per second and is used to calculate the absolute speed of cells per second.
- o
- bendThreshold is used for detection of body-bends.
- o
- binSize for speed histogram.
![Mps 03 00056 i001]() CRITICAL STEP Input parameters should be modified depending on your experiment and cell type analyzed.
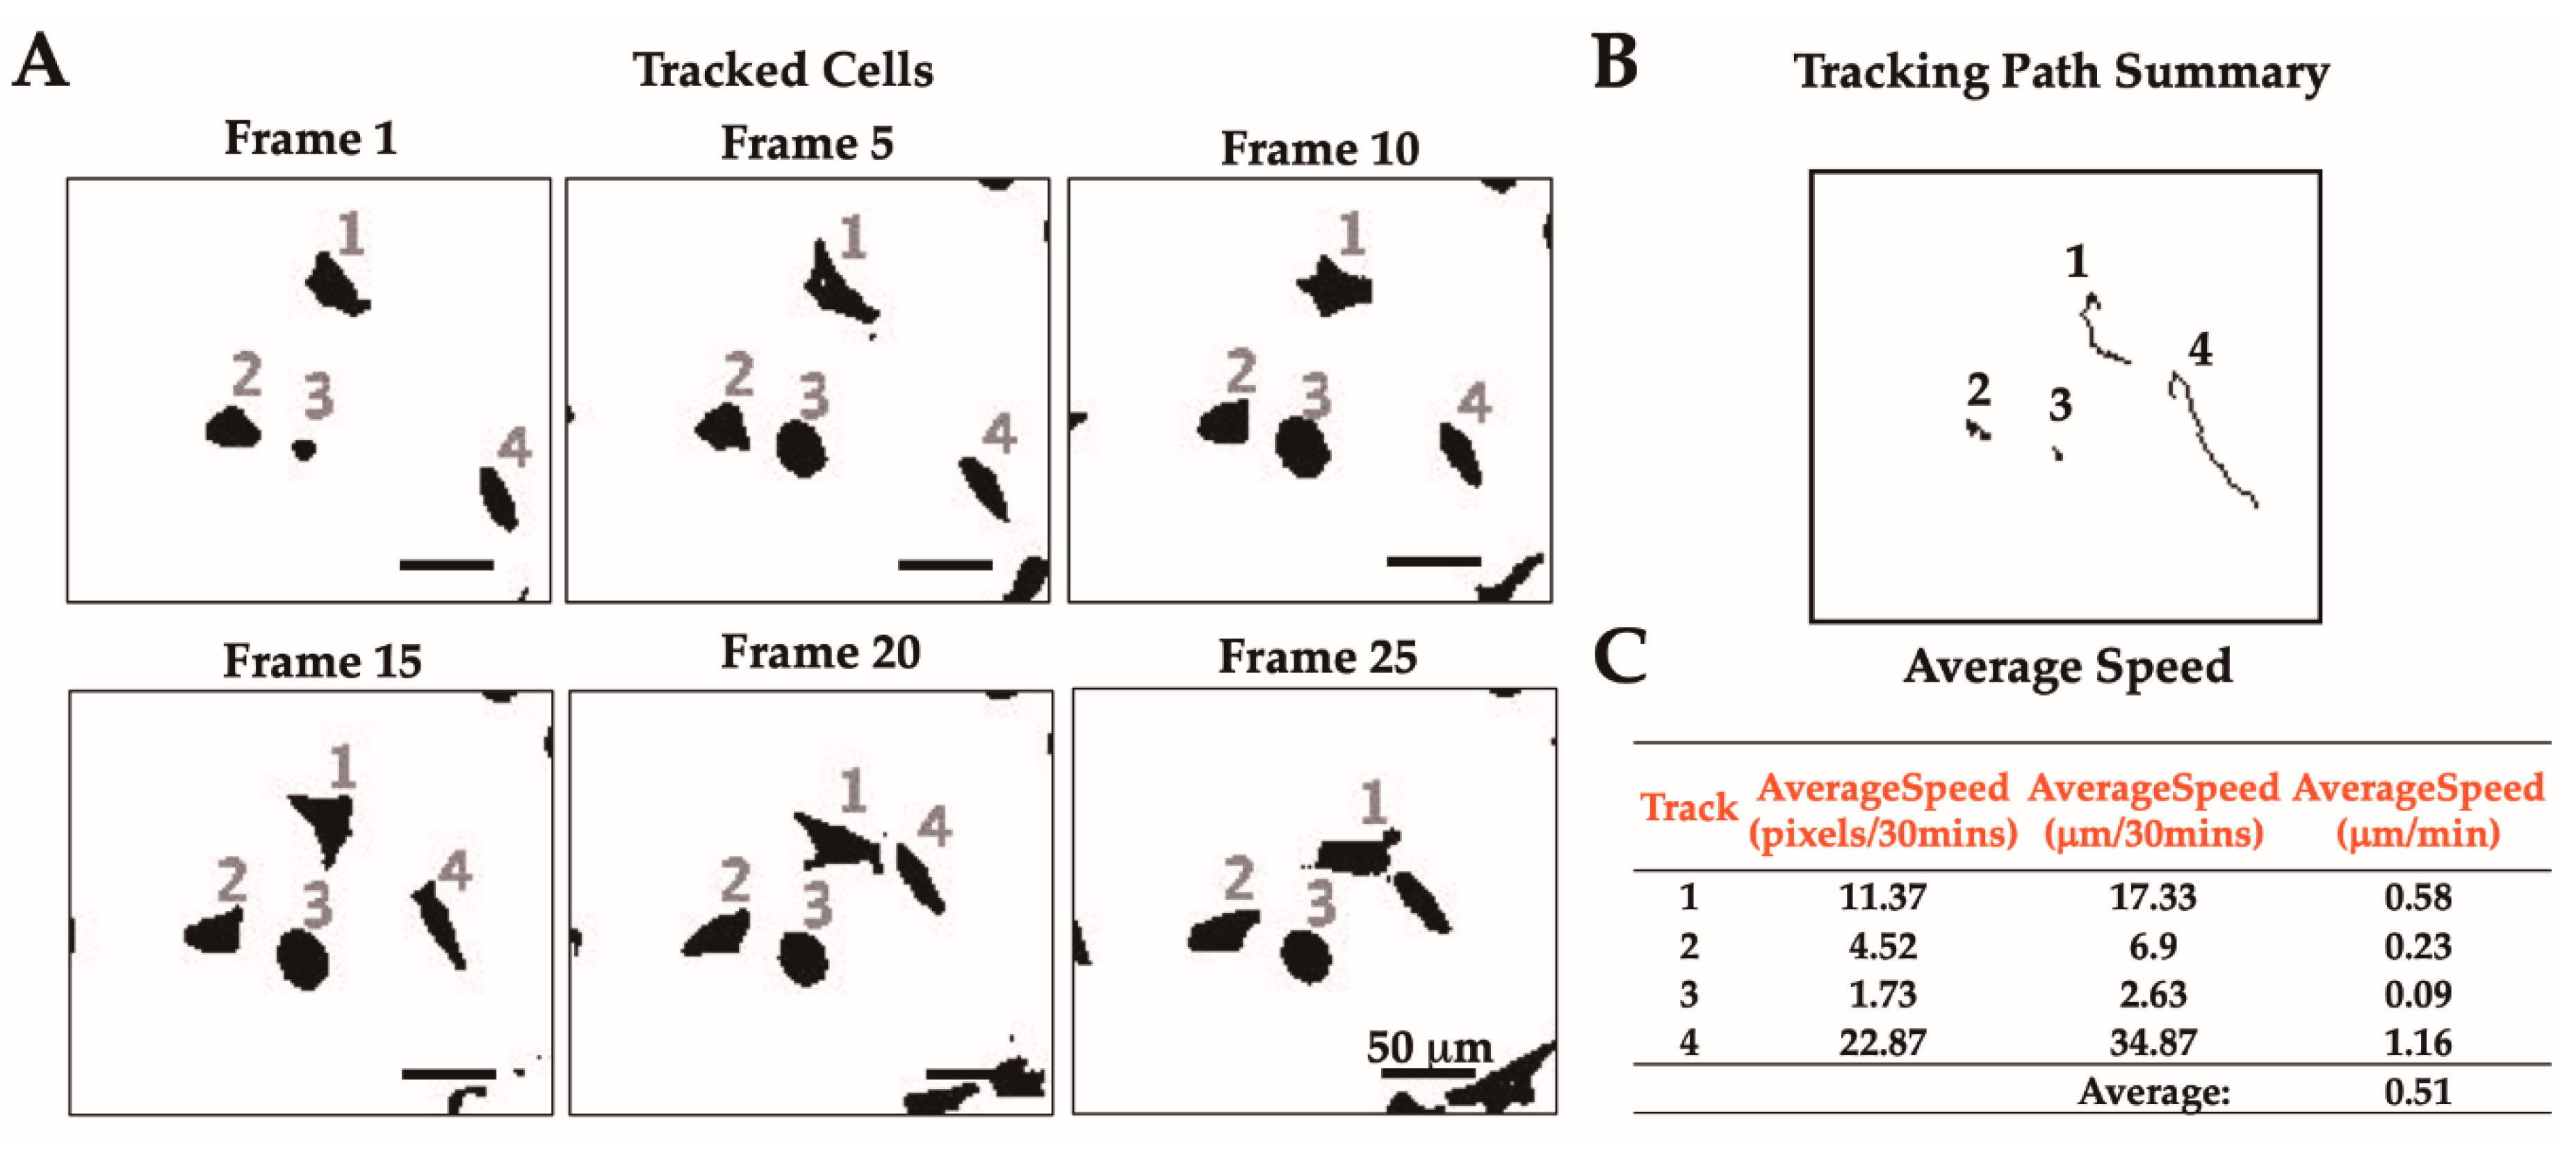
CRITICAL STEP Input parameters should be modified depending on your experiment and cell type analyzed. - Select showLabels to see a final movie where each cell is indicated by a number.
- A “Results” window will pop-up containing analyses of cells. Descriptions of column labels are described in Table 1.
- Data can be saved as a txt file or can be pasted to an excel sheet for further analyses.
4. Results and Discussion
Supplementary Materials
Author Contributions
Funding
Acknowledgments
Conflicts of Interest
References
- Chung, B.M.; Rotty, J.D.; Coulombe, P.A. Networking galore: Intermediate filaments and cell migration. Curr. Opin. Cell Biol. 2013, 25, 600–612. [Google Scholar] [CrossRef] [Green Version]
- Lauffenburger, D.A.; Horwitz, A.F. Cell Migration: A Physically Integrated Molecular Process. Cell 1996, 84, 359–369. [Google Scholar] [CrossRef] [Green Version]
- Kumar, S.; Weaver, V.M. Mechanics, malignancy, and metastasis: The force journey of a tumor cell. Cancer Metastasis Rev. 2009, 28, 113–127. [Google Scholar] [CrossRef] [Green Version]
- Yamaguchi, H.; Wyckoff, J.; Condeelis, J. Cell migration in tumors. Curr. Opin. Cell Biol. 2005, 17, 559–564. [Google Scholar] [CrossRef]
- Seetharaman, S.; Etienne-Manneville, S. Cytoskeletal Crosstalk in Cell Migration. Trends Cell Biol. 2020, in press. [Google Scholar] [CrossRef]
- Devreotes, P.; Horwitz, A.R. Signaling Networks that Regulate Cell Migration. Cold Spring Harb. Perspect. Biol. 2015, 7, a005959. [Google Scholar] [CrossRef] [Green Version]
- Charras, G.; Sahai, E. Physical influences of the extracellular environment on cell migration. Nat. Rev. Mol. Cell Biol. 2014, 15, 813–824. [Google Scholar] [CrossRef]
- Discher, D.E. Tissue Cells Feel and Respond to the Stiffness of Their Substrate. Science 2005, 310, 1139–1143. [Google Scholar] [CrossRef] [Green Version]
- Butcher, D.T.; Alliston, T.; Weaver, V.M. A tense situation: Forcing tumour progression. Nat. Rev. Cancer 2009, 9, 108–122. [Google Scholar] [CrossRef]
- Pelham, R.J.; Wang, Y.-L. Cell locomotion and focal adhesions are regulated by substrate flexibility. Proc. Natl. Acad. Sci. USA 1997, 94, 13661–13665. [Google Scholar] [CrossRef] [Green Version]
- Flanagan, L.A.; Ju, Y.-E.; Marg, B.; Osterfield, M.; Janmey, P.A. Neurite branching on deformable substrates. NeuroReport 2002, 13, 2411–2415. [Google Scholar] [CrossRef] [Green Version]
- Engler, A.J.; Sen, S.; Sweeney, H.L.; Discher, D.E. Matrix Elasticity Directs Stem Cell Lineage Specification. Cell 2006, 126, 677–689. [Google Scholar] [CrossRef] [Green Version]
- Lo, C.-M.; Wang, H.-B.; Dembo, M.; Wang, Y. Cell Movement Is Guided by the Rigidity of the Substrate. Biophys. J. 2000, 79, 144–152. [Google Scholar] [CrossRef] [Green Version]
- Brandley, B.K.; Schnaar, R.L. Tumor cell haptotaxis on covalently immobilized linear and exponential gradients of a cell adhesion peptide. Dev. Biol. 1989, 135, 74–86. [Google Scholar] [CrossRef]
- Emerman, J.T.; Burwen, S.J.; Pitelka, D.R. Substrate properties influencing ultrastructural differentiation of mammary epithelial cells in culture. Tissue Cell 1979, 11, 109–119. [Google Scholar] [CrossRef]
- Eroshenko, N.; Ramachandran, R.; Yadavalli, V.K.; Rao, R.R. Effect of substrate stiffness on early human embryonic stem cell differentiation. J. Biol. Eng. 2013, 7, 7. [Google Scholar] [CrossRef] [Green Version]
- Wang, T.; Hamilla, S.; Cam, M.; Aranda-Espinoza, H.; Mili, S. Extracellular matrix stiffness and cell contractility control RNA localization to promote cell migration. Nat. Commun. 2017, 8, 896. [Google Scholar] [CrossRef] [Green Version]
- Fraley, S.I.; Wu, P.; He, L.; Feng, Y.; Krisnamurthy, R.; Longmore, G.D.; Wirtz, D. Three-dimensional matrix fiber alignment modulates cell migration and MT1-MMP utility by spatially and temporally directing protrusions. Sci. Rep. 2015, 5, 14580. [Google Scholar] [CrossRef] [Green Version]
- Gao, H.; Chakraborty, G.; Zhang, Z.; Akalay, I.; Gadiya, M.; Gao, Y.; Sinha, S.; Hu, J.; Jiang, C.; Akram, M.; et al. Multi-organ Site Metastatic Reactivation Mediated by Non-canonical Discoidin Domain Receptor 1 Signaling. Cell 2016, 166, 47–62. [Google Scholar] [CrossRef] [Green Version]
- Frantz, C.; Stewart, K.M.; Weaver, V.M. The extracellular matrix at a glance. J. Cell Sci. 2010, 123, 4195–4200. [Google Scholar] [CrossRef] [Green Version]
- Ramanujan, S.; Pluen, A.; McKee, T.D.; Brown, E.B.; Boucher, Y.; Jain, R.K. Diffusion and Convection in Collagen Gels: Implications for Transport in the Tumor Interstitium. Biophys. J. 2002, 83, 1650–1660. [Google Scholar] [CrossRef] [Green Version]
- Rozario, T.; DeSimone, D.W. The extracellular matrix in development and morphogenesis: A dynamic view. Dev. Biol. 2010, 341, 126–140. [Google Scholar] [CrossRef] [Green Version]
- Riching, K.M.; Cox, B.L.; Salick, M.R.; Pehlke, C.; Riching, A.S.; Ponik, S.M.; Bass, B.R.; Crone, W.C.; Jiang, Y.; Weaver, A.M.; et al. 3D Collagen Alignment Limits Protrusions to Enhance Breast Cancer Cell Persistence. Biophys. J. 2014, 107, 2546–2558. [Google Scholar] [CrossRef] [Green Version]
- Grinnell, F.; Petroll, W.M. Cell Motility and Mechanics in Three-Dimensional Collagen Matrices. Annu. Rev. Cell Dev. Biol. 2010, 26, 335–361. [Google Scholar] [CrossRef]
- Abraham, L.C.; Zuena, E.; Perez-Ramirez, B.; Kaplan, D.L. Guide to collagen characterization for biomaterial studies. J. Biomed. Mater. Res. 2008, 87B, 264–285. [Google Scholar] [CrossRef]
- Wolf, K.; Alexander, S.; Schacht, V.; Coussens, L.M.; von Andrian, U.H.; van Rheenen, J.; Deryugina, E.; Friedl, P. Collagen-based cell migration models in vitro and in vivo. Semin. Cell Dev. Biol. 2009, 20, 931–941. [Google Scholar] [CrossRef] [Green Version]
- Raub, C.B.; Unruh, J.; Suresh, V.; Krasieva, T.; Lindmo, T.; Gratton, E.; Tromberg, B.J.; George, S.C. Image Correlation Spectroscopy of Multiphoton Images Correlates with Collagen Mechanical Properties. Biophys. J. 2008, 94, 2361–2373. [Google Scholar] [CrossRef] [Green Version]
- Gentleman, E.; Lay, A.N.; Dickerson, D.A.; Nauman, E.A.; Livesay, G.A.; Dee, K.C. Mechanical characterization of collagen fibers and scaffolds for tissue engineering. Biomaterials 2003, 24, 3805–3813. [Google Scholar] [CrossRef]
- Boyden, S. THE CHEMOTACTIC EFFECT OF MIXTURES OF ANTIBODY AND ANTIGEN ON POLYMORPHONUCLEAR LEUCOCYTES. J. Exp. Med. 1962, 115, 453–466. [Google Scholar] [CrossRef] [Green Version]
- Liang, C.-C.; Park, A.Y.; Guan, J.-L. In vitro scratch assay: A convenient and inexpensive method for analysis of cell migration in vitro. Nat. Protoc. 2007, 2, 329–333. [Google Scholar] [CrossRef] [Green Version]
- Brekhman, V.; Neufeld, G. A novel asymmetric 3D in-vitro assay for the study of tumor cell invasion. BMC Cancer 2009, 9, 415. [Google Scholar] [CrossRef] [Green Version]
- Libotte, T.; Kaiser, H.-W.; Alt, W.; Bretschneider, T. Polarity, Protrusion–Retraction Dynamics and Their Interplay during Keratinocyte Cell Migration. Exp. Cell Res. 2001, 270, 129–137. [Google Scholar] [CrossRef]
- Wolf, K.; Mazo, I.; Leung, H.; Engelke, K.; von Andrian, U.H.; Deryugina, E.I.; Strongin, A.Y.; Bröcker, E.-B.; Friedl, P. Compensation mechanism in tumor cell migration. J. Cell Biol. 2003, 160, 267–277. [Google Scholar] [CrossRef] [Green Version]
- Mastyugin, V.; McWhinnie, E.; Labow, M.; Buxton, F. A Quantitative High-Throughput Endothelial Cell Migration Assay. J. Biomol. Screen. 2004, 9, 712–718. [Google Scholar] [CrossRef] [Green Version]
- Albrecht-Buehler, G. The phagokinetic tracks of 3T3 cells. Cell 1977, 11, 395–404. [Google Scholar] [CrossRef]
- Naffar-Abu-Amara, S.; Shay, T.; Galun, M.; Cohen, N.; Isakoff, S.J.; Kam, Z.; Geiger, B. Identification of Novel Pro-Migratory, Cancer-Associated Genes Using Quantitative, Microscopy-Based Screening. PLoS ONE 2008, 3. [Google Scholar] [CrossRef]
- Kedrin, D.; Gligorijevic, B.; Wyckoff, J.; Verkhusha, V.V.; Condeelis, J.; Segall, J.E.; van Rheenen, J. Intravital imaging of metastatic behavior through a mammary imaging window. Nat. Methods 2008, 5, 1019–1021. [Google Scholar] [CrossRef]
- Raub, C.B.; Suresh, V.; Krasieva, T.; Lyubovitsky, J.; Mih, J.D.; Putnam, A.J.; Tromberg, B.J.; George, S.C. Noninvasive Assessment of Collagen Gel Microstructure and Mechanics Using Multiphoton Microscopy. Biophys. J. 2007, 92, 2212–2222. [Google Scholar] [CrossRef] [Green Version]
- Nussbaum-Krammer, C.I.; Neto, M.F.; Brielmann, R.M.; Pedersen, J.S.; Morimoto, R.I. Investigating the spreading and toxicity of prion-like proteins using the metazoan model organism C. elegans. J. Vis. Exp. 2015, 52321. [Google Scholar] [CrossRef]
- Schneider, C.A.; Rasband, W.S.; Eliceiri, K.W. NIH Image to ImageJ: 25 years of image analysis. Nat. Methods 2012, 9, 671–675. [Google Scholar] [CrossRef]
- Lam, V.K.; Sharma, P.; Nguyen, T.; Nehmetallah, G.; Raub, C.B.; Chung, B.M. Morphology, Motility, and Cytoskeletal Architecture of Breast Cancer Cells Depend on Keratin 19 and Substrate. Cytometry 2020, cyto.a.24011. [Google Scholar] [CrossRef]
- Sternberg Biomedical Image Processing. Computer 1983, 16, 22–34. [CrossRef]
- Meijering, E.; Dzyubachyk, O.; Smal, I. Methods for Cell and Particle Tracking. In Methods in Enzymology; Elsevier: Amsterdam, The Netherlands, 2012; Volume 504, pp. 183–200. ISBN 978-0-12-391857-4. [Google Scholar]


| Column Label | Description |
|---|---|
| Length | Sum of length of all movement vectors between frames given track [42]. |
| Distance | Distance covered by cell from start to finish. |
| #Frames | Number of frames the cell was tracked. |
| 1stFrame | The first frame where the cell is tracked. |
| Time(s) | The time cell was tracked (zero if the fps value is not detected correctly). |
| MaxSpeed | Maximum distance (pixels) covered by one cell between two frames. |
| Area | Average area of the cell tracked (in this case in mm2). |
| sdArea | Standard deviation of the area. |
| Perim | The length the average perimeter (outline) of the cell tracked. This number is approximately two times the length of the cell (i.e., 1.1–1.25 mm in this case). Tracks with abnormal lengths could indicate that two cells moved together as one. |
| sdPerim | Standard deviation of the perimeter. You may want to discard cells with large sdPerims, since this could indicate a collision between cells that was not detected by the wrMTrck plugin. |
| AvgSpeed | The average speed calculated from Length/Time(s). |
| BLPS | Body Lengths Per Second, calculated by dividing the Length of the track by Perim/2 and the time(s). |
| avgX | The average X-coordinate of the track. |
| avgY | The average Y-coordinate of the track. |
| Bends | Counting the number of body-bends for a few of the tracks |
| BBPS | Counting the body bends per seconds |
© 2020 by the authors. Licensee MDPI, Basel, Switzerland. This article is an open access article distributed under the terms and conditions of the Creative Commons Attribution (CC BY) license (http://creativecommons.org/licenses/by/4.0/).
Share and Cite
Sharma, P.; Lam, V.K.; Raub, C.B.; Chung, B.M. Tracking Single Cells Motility on Different Substrates. Methods Protoc. 2020, 3, 56. https://doi.org/10.3390/mps3030056
Sharma P, Lam VK, Raub CB, Chung BM. Tracking Single Cells Motility on Different Substrates. Methods and Protocols. 2020; 3(3):56. https://doi.org/10.3390/mps3030056
Chicago/Turabian StyleSharma, Pooja, Van K. Lam, Christopher B. Raub, and Byung Min Chung. 2020. "Tracking Single Cells Motility on Different Substrates" Methods and Protocols 3, no. 3: 56. https://doi.org/10.3390/mps3030056
APA StyleSharma, P., Lam, V. K., Raub, C. B., & Chung, B. M. (2020). Tracking Single Cells Motility on Different Substrates. Methods and Protocols, 3(3), 56. https://doi.org/10.3390/mps3030056