Multiplex Cell Fate Tracking by Flow Cytometry

Abstract
:1. Introduction
2. Experimental Design
2.1. Materials
- Flp-In T-Rex 293 Cell Line (Thermo Fisher Scientific, Gloucester, UK; Cat.no.: R78007, RRID:CVCL_U427, authenticated by Thermo Fisher Scientific and routinely confirmed to be mycoplasma-free), or another mammalian cell line or system of choice.
- High glucose DMEM–Dulbecco’s Modified Eagle Medium (Thermo Fisher Scientific, Gloucester, UK; Cat.no.: 11965118).
- Gibco Fetal Bovine Serum (Thermo Fisher Scientific, Gloucester, UK; Cat.no.: 10270098).
- PBS (Phosphate-buffered saline, VWR, Poole, UK; Cat.no.: 45000).
- Trypsin-EDTA Solution 0.25% (Sigma-Aldrich LTD, Gillingham, UK; Cat.no.: T4049.
- Formaldehyde solution 37% (Sigma-Aldrich LTD, UK; Cat.no.: F1635).
- Click-iT™ Plus EdU Alexa Fluor™ 647 Flow Cytometry Assay Kit (Thermo Fisher Scientific, Gloucester, UK; Cat.no.: C10634). A different Alexa dye should not affect the results of the protocol.
- BrdU (5-Bromo-2′-Deoxyuridine, Sigma-Aldrich LTD, Gillingham, UK; Cat.no.: B5002-1G).
- BrdU Monoclonal Antibody (MoBU-1) (Thermo Fisher Scientific, Gloucester, UK; Cat.no.: B35141, RRID:AB_2536441).
- For FBC. Alexa Fluor 488 NHS Ester (Succinimidyl Ester) (Thermo Fisher Scientific, Gloucester, UK; Cat.no.: A20000). A different Alexa dye should not affect the results of the protocol.
- Hydrochloric acid 37% (Sigma-Aldrich LTD, Gillingham, UK; Cat.no.: 258148).
- Bovine serum albumin (BSA) (Sigma-Aldrich LTD, Gillingham, UK; Cat.no.: A3983).
- Ethanol absolute 99.8+% (Thermo Fisher Scientific, Gloucester, UK; Cat.no.: 10437341).
- Goat Anti-Mouse IgG H&L (Alexa Fluor 555) (Abcam, Cambridge, UK; Cat.no.: ab150114, RRID:AB_2687594). A different Alexa dye should not affect the results of the protocol.
- DAPI (4′,6-diamidino-2-phenylindole, Sigma-Aldrich LTD, Gillingham, UK; Cat.no.: D9542).
- RNase A, DNase and protease-free (10 mg/mL) (Thermo Fisher Scientific, Gloucester, UK; Cat.no.: EN0531).
2.2. Equipment
- Biological safety cabinet type II
- CO2 incubator
- Chemical fume hood
- Tissue culture plates of the desired size (for instance, Corning, Deeside, UK; Cat.no.: 3506)
- Low binding/maximum recovery 1.5 mL microcentrifuge tubes (for instance, Axigen, Corning, Deeside, UK; Cat.no.: 11311984)
- Swing rotor centrifuge for 1.5 mL microcentrifuge tubes (for instance, Eppendorf, Stevenage, UK; Cat.no.: 5804R with 1.5 ml adapters)
- Falcon 5 mL Round Bottom Polystyrene Test Tube with Cell Strainer Cap (Falcon, Corning, Deeside, UK, Cat.no.: 352235)
- Rotating wheel for 1.5 mL microcentrifuge tubes (for instance, SB3, Cole-Parmer, Saint Neots, UK; Cat.no.: 11496548)
- Flow cytometry analyzer (for instance, LSR II, BD Biosciences, UK)
3. Procedure
-
![Mps 03 00050 i001]()
- All centrifugations should be performed in a swing rotor centrifuge at room temperature (RT) to minimize cell loss.
-
![Mps 03 00050 i001]()
- It is critical to pipette up and down after every step to avoid cell aggregation.
3.1. Cell EdU and BrdU Labelling. Time for Completion: Defined by Experimental Design. 1 Day in This Setup
- Seed Flp-In T-REx 293 cells in 6 well plates at a density of 5 × 10⁵ cells/well. Add 3 mL of tissue culture medium and leave overnight (O/N) in a CO2 incubator at 37 °C and 5% CO2.
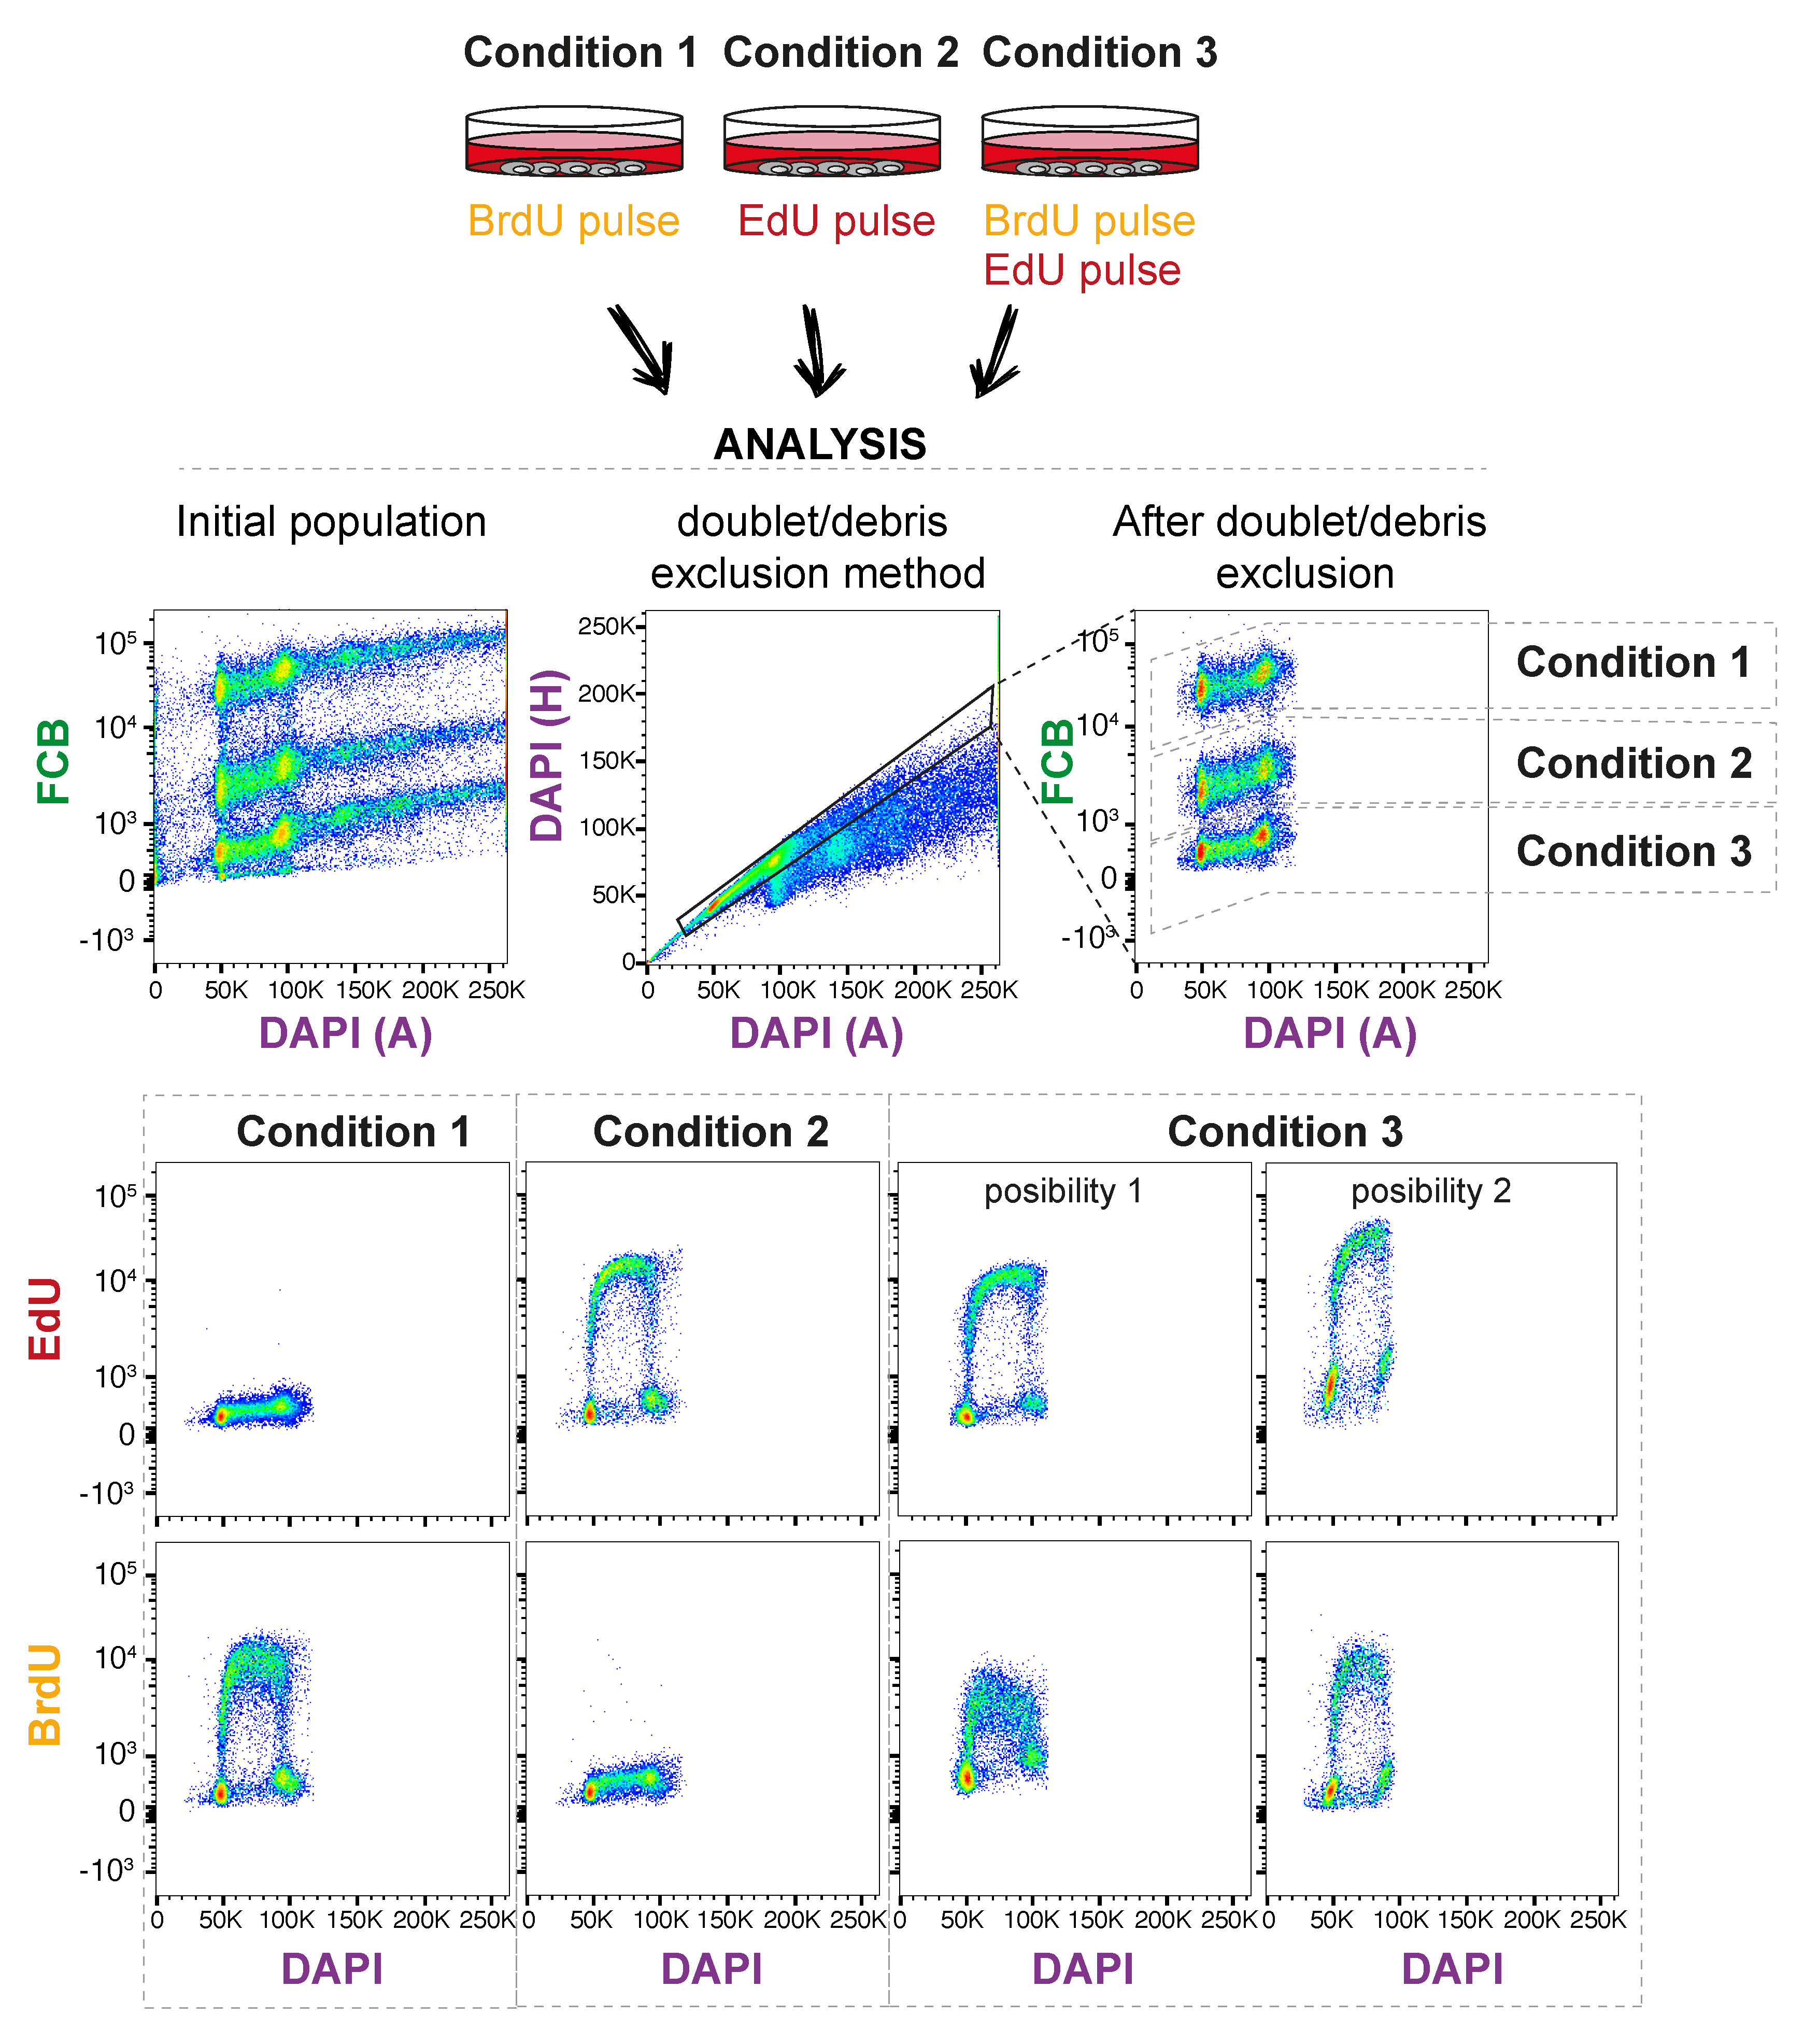
- Add EdU and BrdU as required by the experiment. A 30 min 10 µM pulse of each analogue is commonly used for cell cycle studies.
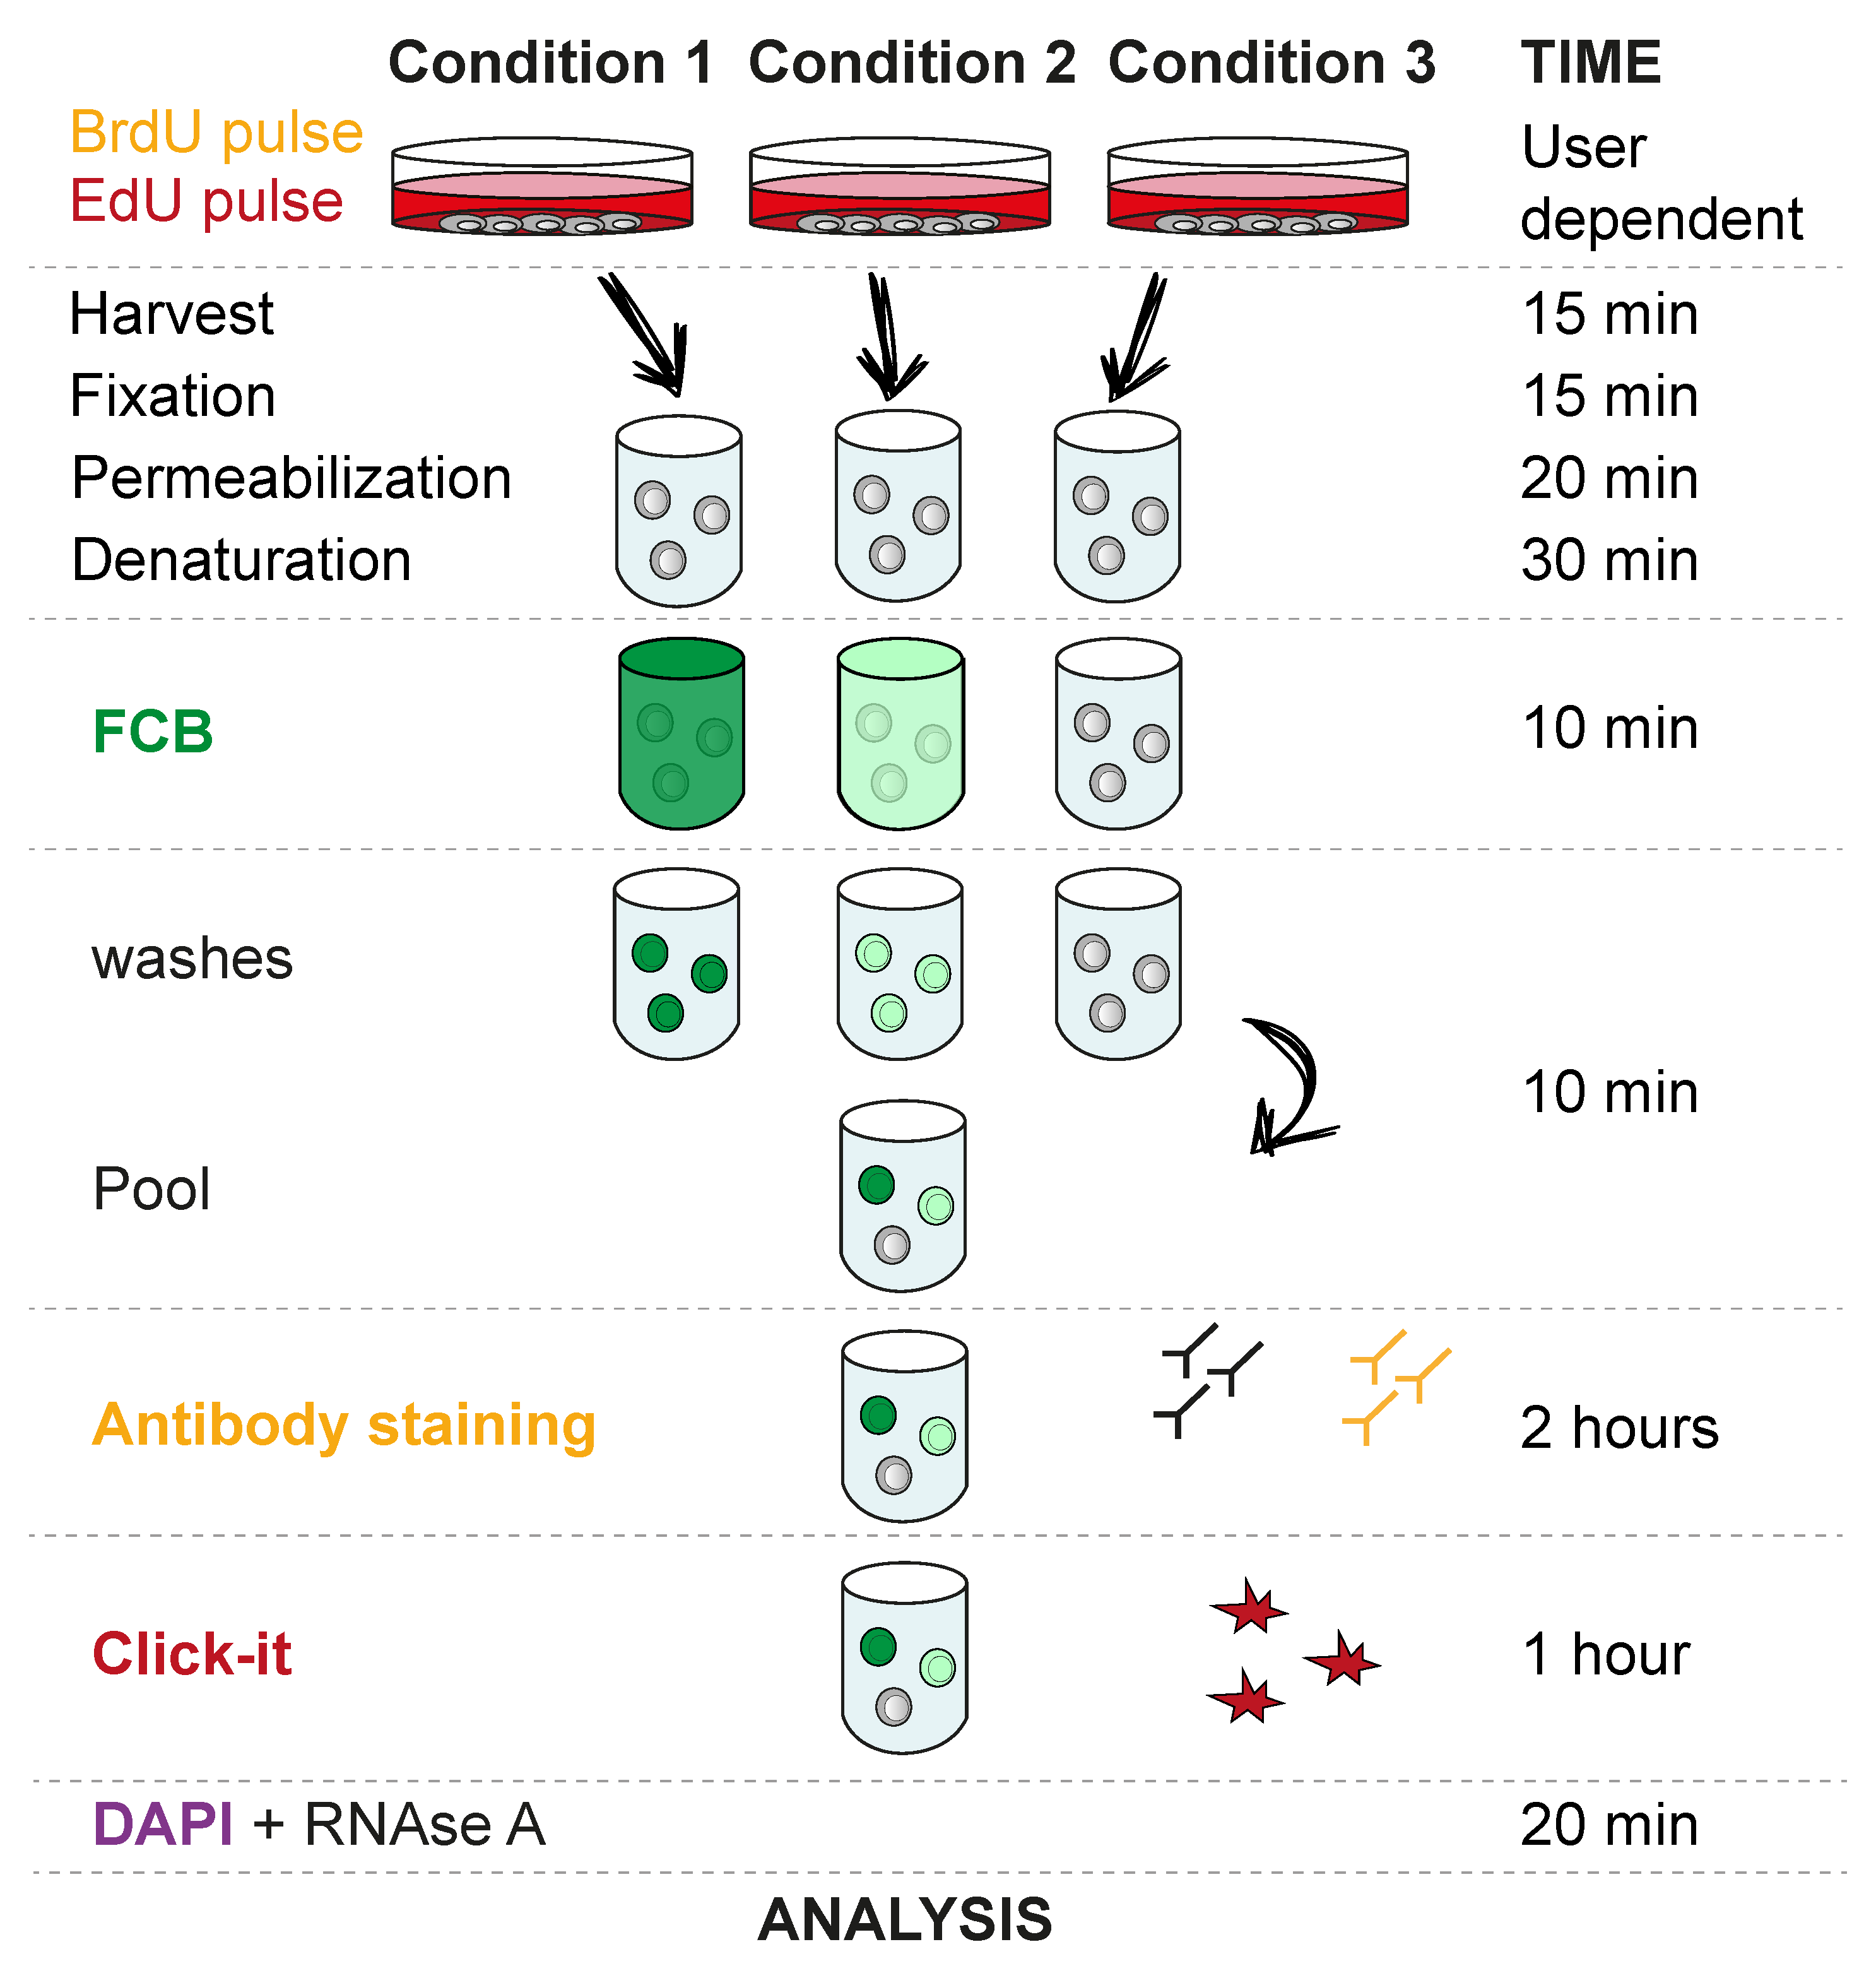
3.2. Harvest, Fixation, Permeabilization and Denaturation. Time for Completion: 01:20 h
- Harvest cells by washing once with PBS and adding 250 µL trypsin to a well of a 6-well plate for 3 min or until cells are fully detached (other harvesting methods may be used, depending on the cell type and experiment setup). Neutralize trypsin by adding 1 mL of tissue culture medium and transfer cells to a 1.5 mL low binding tube. Wash once with PBS.
- Resuspend in 500 µL of freshly prepared 4% formaldehyde and incubate 10 min at RT in the dark. Wash once with 500 µL wash buffer.
![Mps 03 00050 i002]() PAUSE STEP: After wash, the mix can be stored at 4 °C for up to one week in wash buffer.
PAUSE STEP: After wash, the mix can be stored at 4 °C for up to one week in wash buffer. - Resuspend in 500 µL 70% ethanol and incubate 20 min at −20 °C. Wash once with 500 µL wash buffer.
- Resuspend in 500 µL 2N HCl and incubate 20 min at RT. Wash twice with 500 µL wash buffer.

3.3. Fluorescent Cell Barcoding (FCB). Time for Completion: 00:20 h
 CRITICAL STEP Use the previously prepared NHS Ester stock solution to prepare the dilutions indicated in Table 1. Dilutions can be kept at −20 °C for a few weeks. It is important to verify how many dilutions can be used efficiently in the cell type of choice. We have used up to 6 dilutions in non-denaturing conditions. However, after the denaturation step necessary for BrdU staining, we recommend using only 3 dilutions, as indicated in Table 1.
- Each sample will be stained with one concentration of the dye. To do so, add 3 µL diluted dye to 147 µL wash buffer (70% ethanol can also be used). For the compensation control, the highest concentration is recommended.
- Add the total 150 µL to the sample and incubate for 10 min at RT.
![Mps 03 00050 i001]() CRITICAL STEP Wash 3 × 150 µL wash buffer. It is very important to thoroughly wash the samples to remove any non-incorporated dye before pooling the samples.
CRITICAL STEP Wash 3 × 150 µL wash buffer. It is very important to thoroughly wash the samples to remove any non-incorporated dye before pooling the samples.- Pool samples, spin down and remove supernatant.
![Mps 03 00050 i002]() PAUSE STEP: Samples can be kept O/N in at 4 °C wash buffer.
PAUSE STEP: Samples can be kept O/N in at 4 °C wash buffer.
3.4. BrdU Antibody Staining and EdU Click-iT. Time for Completion: 03:00 h
![Mps 03 00050 i001]() CRITICAL STEP Add 200 µL 1:50 BrdU Monoclonal Antibody (MoBU-1) in wash buffer to each sample and incubate 45 min at RT. It is absolutely necessary to use this specific antibody clone (MoBU-1), as it has no cross reactivity with EdU.
CRITICAL STEP Add 200 µL 1:50 BrdU Monoclonal Antibody (MoBU-1) in wash buffer to each sample and incubate 45 min at RT. It is absolutely necessary to use this specific antibody clone (MoBU-1), as it has no cross reactivity with EdU.- Wash 3 × 150 µL wash buffer.
- Add 200 µL 1:200 Goat Anti-Mouse Alexa Fluor (555) in wash buffer to each sample and incubate 45 min at RT.
- Wash 3 × 150 µL wash buffer.
- Perform Click-iT reaction following the manufacturer’s instructions.
3.5. RNase A Treatment and DAPI Staining. Time for Completion: 00:20 h
- Resuspend cells in 200 µL wash buffer containing 100 µg/mL RNase A and 1 µg/mL DAPI and incubate for 15 min.
- Centrifuge and resuspend in 200 µL wash buffer.
![Mps 03 00050 i001]() CRITICAL STEP Transfer solution to a 5 mL round bottom polystyrene test tube with cell strainer cap. It is necessary to filter the cell suspension through the tube cap to avoid cell clumps.
CRITICAL STEP Transfer solution to a 5 mL round bottom polystyrene test tube with cell strainer cap. It is necessary to filter the cell suspension through the tube cap to avoid cell clumps.
3.6. Analyze in Flow Cytometry Analyzer. Time for Completion: Defined by Experimental Design
- The parameters used in this illustrative example are shown in Table 2; however, others can be used depending on the user requirements and availability.
4. Expected Results
5. Reagents Setup
5.1. Tissue Culture Medium
- High glucose DMEM
- 10% v/v FBS
- 100 U/mL penicillin
- 100 μg/mL streptomycin
5.2. Wash buffer
- PBS
- 1% BSA
5.3. NHS Ester Stock Solution
5.4. BrdU 100µM
Author Contributions
Funding
Acknowledgments
Conflicts of Interest
References
- Van Dilla, M.A.; Truiullo, T.T.; Mullaney, P.F.; Coultex, J.R. Cell microfluorometry: A method for rapid fluorescence measurement. Science 1969, 163, 1213–1214. [Google Scholar] [CrossRef] [PubMed]
- Pozarowski, P.; Darzynkiewicz, Z. Analysis of cell cycle by flow cytometry. Checkp. Control Cancer 2004, 281, 301–312. [Google Scholar]
- Darzynkiewicz, Z.; Huang, X. Analysis of cellular DNA content by flow cytometry. Curr. Protoc. Immunol. 2017, 119, 5–7. [Google Scholar] [CrossRef]
- Darzynkiewicz, Z.; Gong, J.; Juan, G.; Ardelt, B.; Traganos, F. Cytometry of cyclin proteins. Cytom. J. Int. Soc. Anal. Cytol. 1996, 25, 1–13. [Google Scholar] [CrossRef]
- Endl, E.; Hollmann, C.; Gerdes, J. Chapter 18 antibodies against the Ki-67 protein: Assessment of the growth fraction and tools for cell cycle analysis. Methods Cell Biol. 2001, 63, 399–418. [Google Scholar] [PubMed]
- Larsen, J.K.; Landberg, G.; Roos, G. Detection of proliferating cell nuclear antigen. Methods Cell Biol. 2001, 63, 419–431. [Google Scholar] [PubMed]
- Davis, P.K.; Ho, A.; Dowdy, S.F. Biological methods for cell-cycle synchronization of mammalian cells. Biotechniques 2001, 30, 1322–1331. [Google Scholar] [CrossRef] [Green Version]
- Yoshizawa-Sugata, N.; Masai, H. Cell cycle synchronization and flow cytometry analysis of mammalian cells. Adv. Struct. Saf. Stud. 2014, 1170, 279–293. [Google Scholar]
- Dolbeare, F.; Selden, J.R. Chapter 19 Immunochemical quantitation of bromodeoxyuridine: Application to cell–cycle kinetics. Methods Cell Biol. 1994, 41, 297–316. [Google Scholar]
- Aten, J.A.; Bakker, P.J.M.; Stap, J.; Boschman, G.A.; Veenhof, C.H.N. DNA double labelling with IdUrd and CldUrd for spatial and temporal analysis of cell proliferation and DNA replication. J. Mol. Histol. 1992, 24, 251–259. [Google Scholar] [CrossRef]
- Begg, A.C.; McNally, N.J.; Shrieve, D.C.; Kärche, H.; Kärcher, H. A method to measure the duration of DNA syntheses and the potential doubling time from a single sample. Cytometry 1985, 6, 620–626. [Google Scholar] [CrossRef]
- Dolbeare, F.; Gratzner, H.; Pallavicini, M.G.; Gray, J.W. Flow cytometric measurement of total DNA content and incorporated bromodeoxyuridine. Proc. Natl. Acad. Sci. USA 1983, 80, 5573–5577. [Google Scholar] [CrossRef] [PubMed] [Green Version]
- Gratzner, H. Monoclonal antibody to 5-bromo- and 5-iododeoxyuridine: A new reagent for detection of DNA replication. Science 1982, 218, 474–475. [Google Scholar] [CrossRef] [PubMed]
- Manders, E.M.; Stap, J.; Brakenhoff, G.J.; Van Driel, R.; A Aten, J. Dynamics of three-dimensional replication patterns during the S-phase, analysed by double labelling of DNA and confocal microscopy. J. Cell Sci. 1992, 103, 857–862. [Google Scholar] [PubMed]
- A White, R.; Meistrich, M.L.; Pollack, A.; Terry, N.H. Simultaneous estimation of T(G2+M), T(S), and T(pot) using single sample dynamic tumor data from bivariate DNA-thymidine analogue cytometry. Cytometry 2000, 41, 1–8. [Google Scholar] [CrossRef]
- Zeng, C.; Pan, F.; Jones, L.A.; Lim, M.M.; Griffin, E.A.; Sheline, Y.I.; Mintun, M.A.; Holtzman, D.M.; Mach, R.H. Evaluation of 5-ethynyl-2′-deoxyuridine staining as a sensitive and reliable method for studying cell proliferation in the adult nervous system. Brain Res. 2010, 1319, 21–32. [Google Scholar] [CrossRef] [Green Version]
- Buck, S.B.; Bradford, J.; Gee, K.R.; Agnew, B.J.; Clarke, S.T.; Salic, A. Detection of S-phase cell cycle progression using 5-ethynyl-2′-deoxyuridine incorporation with click chemistry, an alternative to using 5-bromo-2′-deoxyuridine antibodies. Biotechniques 2008, 44, 927–929. [Google Scholar] [CrossRef]
- Hua, H.; Kearsey, S.E. Monitoring DNA replication in fission yeast by incorporation of 5-ethynyl-2′-deoxyuridine. Nucleic Acids Res. 2011, 39, e60. [Google Scholar] [CrossRef] [Green Version]
- Salic, A.; Mitchison, T.J. A chemical method for fast and sensitive detection of DNA synthesis in vivo. Proc. Natl. Acad. Sci. USA 2008, 105, 2415–2420. [Google Scholar] [CrossRef] [Green Version]
- Bradford, J.A.; Clarke, S.T. Dual-pulse labeling using 5-ethynyl-2’-deoxyuridine (EdU) and 5-bromo-2’-deoxyuridine (BrdU) in flow cytometry. Curr. Protoc. Cytom. 2011, 55, 7–38. [Google Scholar] [CrossRef]
- Krutzik, P.O.; Clutter, M.R.; Trejo, A.; Nolan, G.P. Fluorescent cell barcoding for multiplex flow cytometry. Curr. Protoc. Cytom. 2011, 55, 6–31. [Google Scholar] [CrossRef] [PubMed]
- Krutzik, P.Q.; Nolan, G.P. Fluorescent cell barcoding in flow cytometry allows high-throughput drug screening and signaling profiling. Nat. Methods 2006, 3, 361–368. [Google Scholar] [CrossRef] [PubMed]


| Final Concentration | Make 50x | Dye (from Previous Dilution) | DMSO |
|---|---|---|---|
| µg/ml | µg/ml | µL | µL |
| 15 | 750 | 75 | 25 |
| 5 | 250 | 33.3 | 66.6 |
| 1.3 | 65 | 26 | 74 |
| 0.3 | 15 | 23.1 | 76.9 |
| 0.075 | 3.75 | 25 | 75 |
| 0 | 0 | 0 | 100 |
| Reagent | Laser | Bandpass Filter |
|---|---|---|
| FCB (Alexa 488) | 488 | 525/50 |
| BrdU (Alexa 555) | 561 | 582/15 |
| EdU (Alexa 647) | 633 | 660/20 |
| DAPI (UV) | 355 | 450/50 |
| Issue | Possible Causes | Suggestions |
|---|---|---|
| Cell loss | Cell loss during centrifugation | Use swing rotor as recommended |
| Inefficient FCB detection |
|
|
| Insufficient FCB population separation |
|
|
| Poor BrdU detection |
|
|
| Poor EdU detection |
|
|
© 2020 by the authors. Licensee MDPI, Basel, Switzerland. This article is an open access article distributed under the terms and conditions of the Creative Commons Attribution (CC BY) license (http://creativecommons.org/licenses/by/4.0/).
Share and Cite
Rodríguez-Martínez, M.; Hills, S.A.; Diffley, J.F.X.; Svejstrup, J.Q. Multiplex Cell Fate Tracking by Flow Cytometry. Methods Protoc. 2020, 3, 50. https://doi.org/10.3390/mps3030050
Rodríguez-Martínez M, Hills SA, Diffley JFX, Svejstrup JQ. Multiplex Cell Fate Tracking by Flow Cytometry. Methods and Protocols. 2020; 3(3):50. https://doi.org/10.3390/mps3030050
Chicago/Turabian StyleRodríguez-Martínez, Marta, Stephanie A. Hills, John F. X. Diffley, and Jesper Q. Svejstrup. 2020. "Multiplex Cell Fate Tracking by Flow Cytometry" Methods and Protocols 3, no. 3: 50. https://doi.org/10.3390/mps3030050
APA StyleRodríguez-Martínez, M., Hills, S. A., Diffley, J. F. X., & Svejstrup, J. Q. (2020). Multiplex Cell Fate Tracking by Flow Cytometry. Methods and Protocols, 3(3), 50. https://doi.org/10.3390/mps3030050