
Baseline Characteristics Associated with Good Collateral Status Using Hypoperfusion Index as an Outcome

 , , ,
, , ,
Abstract
:1. Introduction
2. Materials and Methods
2.1. Study Population
2.2. Technical Parameters
2.3. Data Collection
2.4. Study Outcomes
2.5. Statistical Analysis
3. Results
4. Discussion
5. Conclusions
Author Contributions
Funding
Institutional Review Board Statement
Informed Consent Statement
Data Availability Statement
Acknowledgments
Conflicts of Interest
References
- Malhotra, K.; Gornbein, J.; Saver, J.L. Ischemic Strokes Due to Large-Vessel Occlusions Contribute Disproportionately to Stroke-Related Dependence and Death: A Review. Front. Neurol. 2017, 8, 651. [Google Scholar] [CrossRef] [PubMed] [Green Version]
- Dozois, A.; Hampton, L.; Kingston, C.W.; Lambert, G.; Porcelli, T.J.; Sorenson, D.; Templin, M.; VonCannon, S.; Asimos, A.W. PLUMBER Study (Prevalence of Large Vessel Occlusion Strokes in Mecklenburg County Emergency Response). Stroke 2017, 48, 3397–3399. [Google Scholar] [CrossRef] [PubMed]
- Berkhemer, O.A.; Fransen, P.S.S.; Beumer, D.; van den Berg, L.A.; Lingsma, H.F.; Yoo, A.J.; Schonewille, W.J.; Vos, J.A.; Nederkoorn, P.J.; Wermer, M.J.H.; et al. A Randomized Trial of Intraarterial Treatment for Acute Ischemic Stroke. N. Engl. J. Med. 2015, 372, 11–20. [Google Scholar] [CrossRef] [Green Version]
- Qian, J.; Fan, L.; Zhang, W.; Wang, J.; Qiu, J.; Wang, Y. A Meta-analysis of Collateral Status and Outcomes of Mechanical Thrombectomy. Acta Neurol. Scand. 2020, 142, 191–199. [Google Scholar] [CrossRef]
- Nordmeyer, H.; Webering, N.; Chapot, R.; Hadisurya, J.; Heddier, M.; Stracke, P.; Berger, K.; Isenmann, S.; Weber, R. The Association between Collateral Status, Recanalization and Long Term Outcome in Stroke Patients Treated with Stent Retrievers-Are There Indications Not to Perform Thrombectomy Based on CT Angiography? J. Neuroradiol. 2017, 44, 217–222. [Google Scholar] [CrossRef]
- Jung, S.; Gilgen, M.; Slotboom, J.; El-Koussy, M.; Zubler, C.; Kiefer, C.; Luedi, R.; Mono, M.-L.; Heldner, M.R.; Weck, A.; et al. Factors That Determine Penumbral Tissue Loss in Acute Ischaemic Stroke. Brain 2013, 136, 3554–3560. [Google Scholar] [CrossRef]
- Olivot, J.M.; Mlynash, M.; Inoue, M.; Marks, M.P.; Wheeler, H.M.; Kemp, S.; Straka, M.; Zaharchuk, G.; Bammer, R.; Lansberg, M.G.; et al. Hypoperfusion Intensity Ratio Predicts Infarct Progression and Functional Outcome in the DEFUSE 2 Cohort. Stroke 2014, 45, 1018–1023. [Google Scholar] [CrossRef] [Green Version]
- Wouters, A.; Christensen, S.; Straka, M.; Mlynash, M.; Liggins, J.; Bammer, R.; Thijs, V.; Lemmens, R.; Albers, G.W.; Lansberg, M.G. A Comparison of Relative Time to Peak and Tmax for Mismatch-Based Patient Selection. Front. Neurol. 2017, 8, 539. [Google Scholar] [CrossRef] [Green Version]
- Zachrison, K.S.; Schwamm, L.H.; Xu, H.; Matsouaka, R.; Shah, S.; Smith, E.E.; Xian, Y.; Fonarow, G.C.; Saver, J. Frequency, Characteristics, and Outcomes of Endovascular Thrombectomy in Patients with Stroke Beyond 6 Hours of Onset in US Clinical Practice. Stroke 2021, 52, 3805–3814. [Google Scholar] [CrossRef]
- Dutra, B.G.; Tolhuisen, M.L.; Alves, H.C.B.R.; Treurniet, K.M.; Kappelhof, M.; Yoo, A.J.; Jansen, I.G.H.; Dippel, D.W.J.; van Zwam, W.H.; van Oostenbrugge, R.J.; et al. Thrombus Imaging Characteristics and Outcomes in Acute Ischemic Stroke Patients Undergoing Endovascular Treatment. Stroke 2019, 50, 2057–2064. [Google Scholar] [CrossRef]
- Feng, X.; Ye, G.; Cao, R.; Qi, P.; Lu, J.; Chen, J.; Wang, D. Identification of Predictors for Hemorrhagic Transformation in Patients with Acute Ischemic Stroke After Endovascular Therapy Using the Decision Tree Model. CIA 2020, 15, 1611–1624. [Google Scholar] [CrossRef] [PubMed]
- Nawabi, J.; Kniep, H.; Schön, G.; Flottmann, F.; Leischner, H.; Kabiri, R.; Sporns, P.; Kemmling, A.; Thomalla, G.; Fiehler, J.; et al. Hemorrhage After Endovascular Recanalization in Acute Stroke: Lesion Extent, Collaterals and Degree of Ischemic Water Uptake Mediate Tissue Vulnerability. Front. Neurol. 2019, 10, 569. [Google Scholar] [CrossRef] [PubMed]
- Tian, B.; Tian, X.; Shi, Z.; Peng, W.; Zhang, X.; Yang, P.; Li, Z.; Zhang, X.; Lou, M.; Yin, C.; et al. Clinical and Imaging Indicators of Hemorrhagic Transformation in Acute Ischemic Stroke After Endovascular Thrombectomy. Stroke 2022, 53, 1674–1681. [Google Scholar] [CrossRef] [PubMed]
- Iwasawa, E.; Ichijo, M.; Ishibashi, S.; Yokota, T. Acute Development of Collateral Circulation and Therapeutic Prospects in Ischemic Stroke. Neural Regen Res. 2016, 11, 368–371. [Google Scholar] [CrossRef] [PubMed]
- Wang, C.-M.; Chang, Y.-M.; Sung, P.-S.; Chen, C.-H. Hypoperfusion Index Ratio as a Surrogate of Collateral Scoring on CT Angiogram in Large Vessel Stroke. JCM 2021, 10, 1296. [Google Scholar] [CrossRef] [PubMed]
- Liebeskind, D.S.; Cotsonis, G.A.; Saver, J.L.; Lynn, M.J.; Cloft, H.J.; Chimowitz, M.I. Investigators for the Warfarin—Aspirin Symptomatic Intracranial Disease (WASID) Collateral Circulation in Symptomatic Intracranial Atherosclerosis. J. Cereb. Blood Flow Metab. 2011, 31, 1293–1301. [Google Scholar] [CrossRef] [PubMed] [Green Version]
- Li, H.; Chai, Q.; Gutterman, D.D.; Liu, Y. Elevated Glucose Impairs CAMP-Mediated Dilation by Reducing Kv Channel Activity in Rat Small Coronary Smooth Muscle Cells. Am. J. Physiol.-Heart Circ. Physiol. 2003, 285, H1213–H1219. [Google Scholar] [CrossRef] [Green Version]
- Tsuruta, R.; Fujita, M.; Ono, T.; Koda, Y.; Koga, Y.; Yamamoto, T.; Nanba, M.; Shitara, M.; Kasaoka, S.; Maruyama, I.; et al. Hyperglycemia Enhances Excessive Superoxide Anion Radical Generation, Oxidative Stress, Early Inflammation, and Endothelial Injury in Forebrain Ischemia/Reperfusion Rats. Brain Res. 2010, 1309, 155–163. [Google Scholar] [CrossRef] [PubMed]
- Brunner, F.; Tomandl, B.; Hanken, K.; Hildebrandt, H.; Kastrup, A. Impact of Collateral Circulation on Early Outcome and Risk of Hemorrhagic Complications after Systemic Thrombolysis. Int. J. Stroke 2014, 9, 992–998. [Google Scholar] [CrossRef]
- Romano, J.G.; Liebeskind, D.S. Revascularization of Collaterals for Hemodynamic Stroke: Insight on Pathophysiology from the Carotid Occlusion Surgery Study. Stroke 2012, 43, 1988–1991. [Google Scholar] [CrossRef] [Green Version]
- Ovbiagele, B.; Saver, J.L.; Starkman, S.; Kim, D.; Ali, L.K.; Jahan, R.; Duckwiler, G.R.; Vinuela, F.; Pineda, S.; Liebeskind, D.S. Statin Enhancement of Collateralization in Acute Stroke. Neurology 2007, 68, 2129–2131. [Google Scholar] [CrossRef] [PubMed]
- Lima, F.O.; Furie, K.L.; Silva, G.S.; Lev, M.H.; Camargo, É.C.S.; Singhal, A.B.; Harris, G.J.; Halpern, E.F.; Koroshetz, W.J.; Smith, W.S.; et al. The Pattern of Leptomeningeal Collaterals on CT Angiography Is a Strong Predictor of Long-Term Functional Outcome in Stroke Patients with Large Vessel Intracranial Occlusion. Stroke 2010, 41, 2316–2322. [Google Scholar] [CrossRef] [PubMed] [Green Version]
- Wiegers, E.J.A.; Mulder, M.J.H.L.; Jansen, I.G.H.; Venema, E.; Compagne, K.C.J.; Berkhemer, O.A.; Emmer, B.J.; Marquering, H.A.; van Es, A.C.G.M.; Sprengers, M.E.; et al. Clinical and Imaging Determinants of Collateral Status in Patients with Acute Ischemic Stroke in MR CLEAN Trial and Registry. Stroke 2020, 51, 1493–1502. [Google Scholar] [CrossRef] [PubMed]
- Faber, J.E.; Zhang, H.; Lassance-Soares, R.M.; Prabhakar, P.; Najafi, A.H.; Burnett, M.S.; Epstein, S.E. Aging Causes Collateral Rarefaction and Increased Severity of Ischemic Injury in Multiple Tissues. ATVB 2011, 31, 1748–1756. [Google Scholar] [CrossRef] [Green Version]
- Selim, M.; Jones, R.; Novak, P.; Zhao, P.; Novak, V. The Effects of Body Mass Index on Cerebral Blood Flow Velocity. Clin. Auton. Res. 2008, 18, 331–338. [Google Scholar] [CrossRef] [Green Version]
- Alosco, M.L.; Spitznagel, M.B.; Raz, N.; Cohen, R.; Sweet, L.H.; Colbert, L.H.; Josephson, R.; van Dulmen, M.; Hughes, J.; Rosneck, J.; et al. Obesity Interacts with Cerebral Hypoperfusion to Exacerbate Cognitive Impairment in Older Adults with Heart Failure. Cerebrovasc. Dis. Extra 2012, 2, 88–98. [Google Scholar] [CrossRef]
- Kurth, T.; Gaziano, J.M.; Berger, K.; Kase, C.S.; Rexrode, K.M.; Cook, N.R.; Buring, J.E.; Manson, J.E. Body Mass Index and the Risk of Stroke in Men. Arch. Intern. Med. 2002, 162, 2557–2562. [Google Scholar] [CrossRef]
- Strazzullo, P.; D’Elia, L.; Cairella, G.; Garbagnati, F.; Cappuccio, F.P.; Scalfi, L. Excess Body Weight and Incidence of Stroke: Meta-Analysis of Prospective Studies with 2 Million Participants. Stroke 2010, 41, e418–e426. [Google Scholar] [CrossRef] [Green Version]
- Towfighi, A.; Ovbiagele, B. The Impact of Body Mass Index on Mortality after Stroke. Stroke 2009, 40, 2704–2708. [Google Scholar] [CrossRef]
- Ovbiagele, B.; Bath, P.M.; Cotton, D.; Vinisko, R.; Diener, H.-C. Obesity and Recurrent Vascular Risk after a Recent Ischemic Stroke. Stroke 2011, 42, 3397–3402. [Google Scholar] [CrossRef]
- Vemmos, K.; Ntaios, G.; Spengos, K.; Savvari, P.; Vemmou, A.; Pappa, T.; Manios, E.; Georgiopoulos, G.; Alevizaki, M. Association between Obesity and Mortality after Acute First-Ever Stroke: The Obesity-Stroke Paradox. Stroke 2011, 42, 30–36. [Google Scholar] [CrossRef] [PubMed] [Green Version]
- Carbone, S.; Lavie, C.J.; Arena, R. Obesity and Heart Failure: Focus on the Obesity Paradox. Mayo Clin. Proc. 2017, 92, 266–279. [Google Scholar] [CrossRef] [PubMed] [Green Version]
- Oesch, L.; Tatlisumak, T.; Arnold, M.; Sarikaya, H. Obesity Paradox in Stroke-Myth or Reality? A Systematic Review. PLoS ONE 2017, 12, e0171334. [Google Scholar] [CrossRef] [PubMed]
- Parto, P.; Lavie, C.J.; Arena, R.; Bond, S.; Popovic, D.; Ventura, H.O. Body Habitus in Heart Failure: Understanding the Mechanisms and Clinical Significance of the Obesity Paradox. Future Cardiol. 2016, 12, 639–653. [Google Scholar] [CrossRef]
- Clark, A.L.; Fonarow, G.C.; Horwich, T.B. Obesity and the Obesity Paradox in Heart Failure. Prog. Cardiovasc. Dis. 2014, 56, 409–414. [Google Scholar] [CrossRef]
- Horwich, T.B.; Fonarow, G.C.; Hamilton, M.A.; MacLellan, W.R.; Woo, M.A.; Tillisch, J.H. The Relationship between Obesity and Mortality in Patients with Heart Failure. J. Am. Coll. Cardiol. 2001, 38, 789–795. [Google Scholar] [CrossRef] [Green Version]

| Variables | All Cases (N = 54) | Arterial Territory | p-Value | |||
|---|---|---|---|---|---|---|
| ICA (N = 8) | M1 (N = 26) | Proximal M2 (N = 20) | ||||
| Age (years) | 67.9 ± 13.6 | 74.4 ± 15.7 | 64.7 ± 14.0 | 69.4 ± 11.5 | 0.175 | |
| Male Sex (n%) | 28 (51.9%) | 3 (37.5%) | 14 (53.8%) | 11 (55.0%) | 0.811 | |
| Race (n%) | White/Caucasian | 23 (42.6%) | 3 (37.5%) | 9 (34.6%) | 11 (55.0%) | 0.577 |
| AfricanAmerican/Black | 30 (55.6%) | 5 (62.5%) | 16 (61.5%) | 9 (45.0%) | ||
| Asian | 1 (1.9%) | 0 (0.0%) | 1 (3.8%) | 0 (0.0%) | ||
| BMI (kg/m2) | 28.9 ± 9.7 | 33.2 ± 9.7 | 28.3 ± 11.2 | 27.9 ± 7.4 | 0.399 | |
| BMI grade | <30.0 | 36 (66.7%) | 5 (62.5%) | 19 (73.1%) | 12 (60.0%) | 0.624 |
| ≥30.0 | 18 (33.3%) | 3 (37.5%) | 7 (26.9%) | 8 (40.0%) | ||
| Hemoglobin level (gm/dL) | 12.4 ± 2.1 | 11.9 ± 3.0 | 11.9 ± 2.0 | 13.3 ± 1.4 | 0.061 | |
| Hematocrit (%) | 38.5 ± 5.7 | 36.4 ± 8.1 | 37.0 ± 5.2 | 41.3 ± 4.4 | 0.019 * p1: 0.799 p2: 0.047 p3: 0.005 * | |
| WBC count (×103/mL) | 8.7 ± 3.0 | 8.9 ± 2.4 | 8.6 ± 3.0 | 8.7 ± 3.3 | 0.971 | |
| Platelet count (×103/mL) | 237.3 ± 79.3 | 223.9 ± 56.0 | 233.7 ± 70.5 | 247.4 ± 98.1 | 0.746 | |
| Platelet/WBC ratio | 29.2 ± 11.3 | 26.6 ± 8.7 | 29.1 ± 8.8 | 30.3 ± 15.0 | 0.740 | |
| Sodium level (mEq/L) | 139.2 ± 3.2 | 141.0 ± 4.2 | 138.3 ± 2.7 | 139.7 ± 3.1 | 0.085 | |
| Potassium level (mmol/L) | 4.1 ± 0.5 | 4.1 ± 0.4 | 4.1 ± 0.6 | 4.1 ± 0.4 | 0.964 | |
| Calcium level (mg/dL) | 8.8 ± 0.5 | 8.7 ± 0.5 | 8.9 ± 0.6 | 8.8 ± 0.5 | 0.725 | |
| Blood Glucose level (mg/dL) | 135.8 ± 65.1 | 118.3 ± 10.6 | 130.4 ± 73.6 | 149.8 ± 65.5 | 0.439 | |
| BUN/ creatinine ratio | 18.2 ± 7.8 | 17.5 ± 7.6 | 19.8 ± 8.5 | 16.5 ± 6.8 | 0.345 | |
| SBP (mmHg) | 148.2 ± 23.7 | 154.4 ± 21.2 | 144.2 ± 21.6 | 150.9 ± 27.3 | 0.468 | |
| DBP (mmHg) | 82.8 ± 19.9 | 88.0 ± 23.2 | 78.4 ± 18.6 | 86.4 ± 20.0 | 0.301 | |
| HR (beat/minute) | 80.6 ± 17.8 | 83.3 ± 20.8 | 80.9 ± 17.9 | 79.2 ± 17.2 | 0.857 | |
| RR (cycle/minute) | 17.6 ± 3.8 | 17.5 ± 4.3 | 17.6 ± 3.4 | 17.6 ± 4.3 | 0.997 | |
| SpO2 (%) | 97.9 ± 2.6 | 96.6 ± 4.1 | 98.1 ± 2.2 | 98.2 ± 2.4 | 0.329 | |
| NIHSS score | 15.0 ± 7.3 | 17.8 ± 5.7 | 15.5 ± 7.2 | 13.2 ± 7.9 | 0.307 | |
| Left side improvement (n%) | 32 (59.3%) | 4 (50.0%) | 16 (61.5%) | 12 (60.0%) | 0.866 | |
| HI | 0.3 ± 0.2 | 0.3 ± 0.2 | 0.3 ± 0.2 | 0.3 ± 0.2 | 0.990 | |
| Collaterals (n%) | Good | 26 (48.1%) | 4 (50.0%) | 13 (50.0%) | 9 (45.0%) | 0.933 |
| Poor | 28 (51.9%) | 4 (50.0%) | 13 (50.0%) | 11 (55.0%) | ||
| Hemorrhagic transformation (HT) within 48 H after MT, (n%) | 18 (33.3%) | 5 (62.5%) | 10 (38.5%) | 3 (15.0%) | 0.041 * p1: 0.231 p2: 0.012 * p3: 0.080 | |
| Variables | Perfusion | p-Value | ||
|---|---|---|---|---|
| Good (N = 26) | Poor (N = 28) | |||
| Age (years) | 70.7 ± 10.9 | 65.2 ± 15.3 | 0.135 | |
| Male Sex (n%) | 15 (57.7%) | 13 (46.4%) | 0.408 | |
| Race (n%) | White/Caucasian | 14 (53.8%) | 9 (32.1%) | 0.099 |
| African American/Black | 11 (42.3%) | 19 (67.9%) | ||
| Asian | 1 (3.8%) | 0 (0.0%) | ||
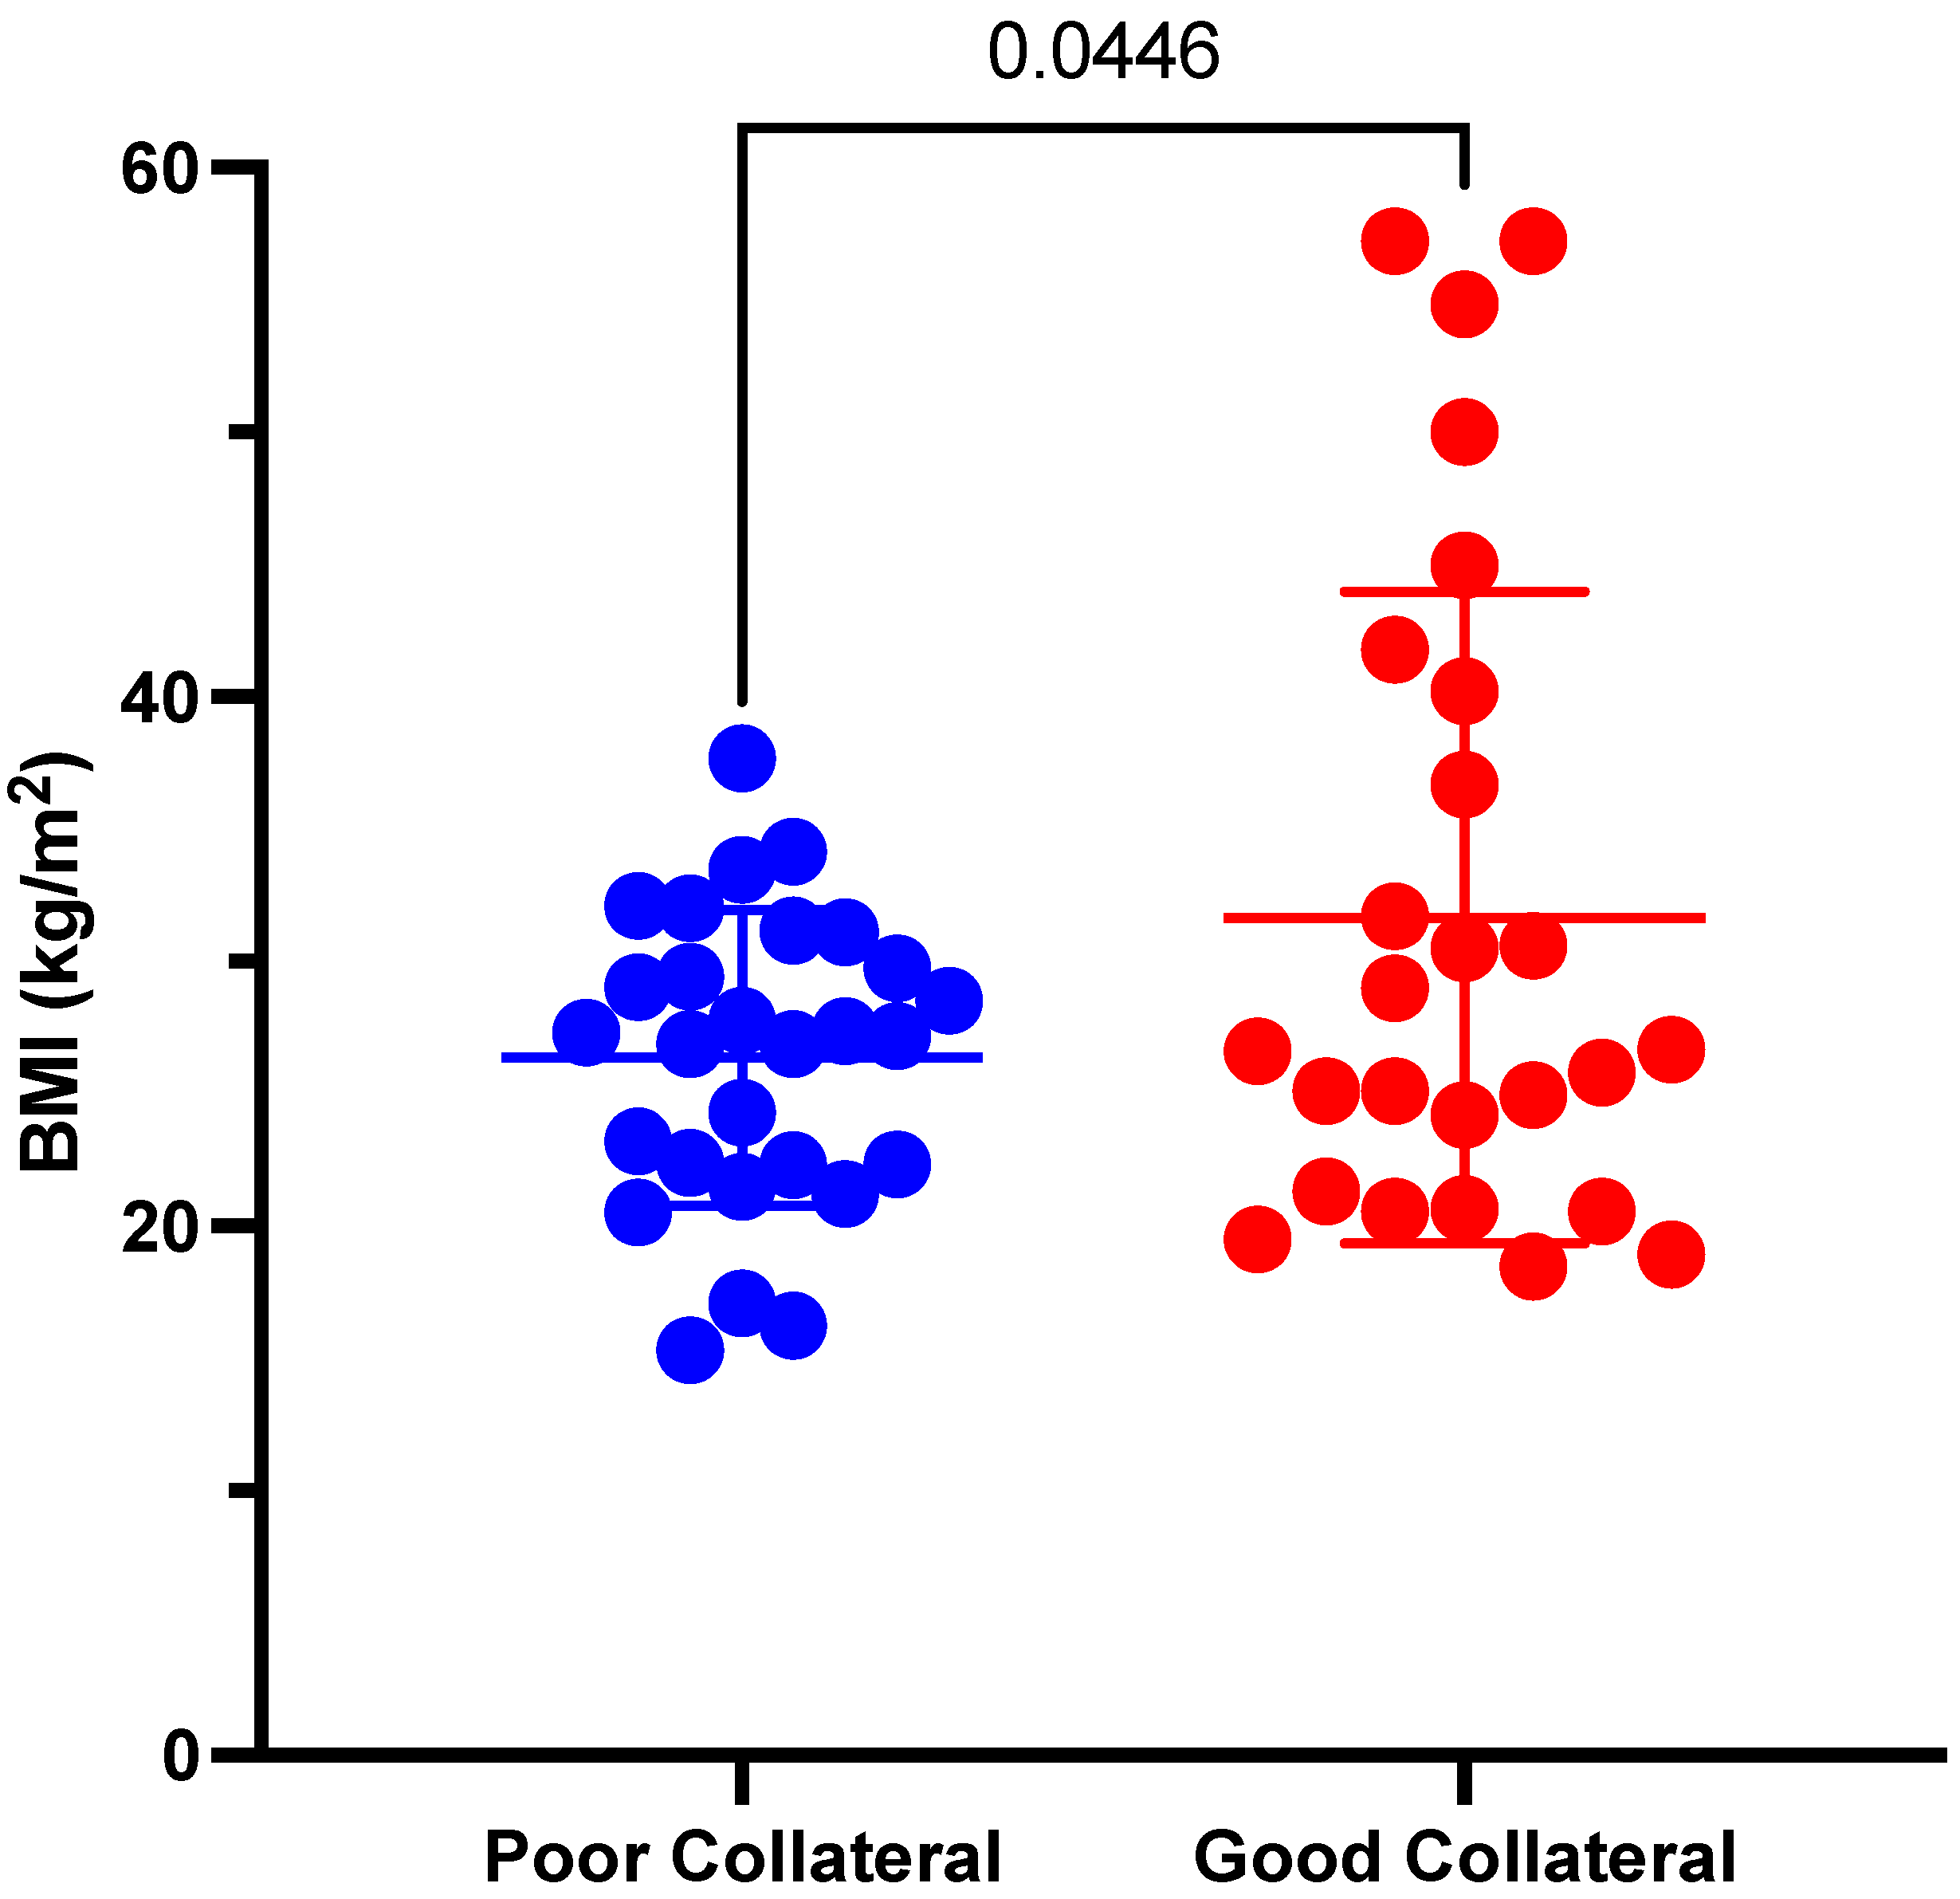
| BMI (kg/m2) | 31.7 ± 12.3 | 26.4 ± 5.6 | 0.045 * | |
| BMI grade | <30.0 kg/m2 | 15 (57.7%) | 21 (75.0%) | 0.178 |
| ≥30.0 kg/m2 | 11 (42.3%) | 7 (25.0%) | ||
| Hemoglobin level (gm/dL) | 11.9 ± 2.4 | 12.9 ± 1.6 | 0.074 | |
| Hematocrit (%) | 37.4 ± 6.8 | 39.4 ± 4.4 | 0.205 | |
| WBC count (×103/mL) | 8.0 ± 2.4 | 9.3 ± 3.3 | 0.099 | |
| Platelet count (×103/mL) | 228.2 ± 79.1 | 245.8 ± 80.0 | 0.419 | |
| Platelet/WBC ratio | 30.4 ± 12.5 | 28.1 ± 10.2 | 0.468 | |
| Sodium level (mEq/L) | 139.9 ± 3.0 | 138.6 ± 3.3 | 0.131 | |
| Potassium level (mmol/L) | 4.1 ± 0.4 | 4.1 ± 0.6 | 0.817 | |
| Calcium level (mg/dL) | 8.7 ± 0.5 | 8.9 ± 0.6 | 0.403 | |
| Blood glucose level (mg/dL) | 127.4 ± 38.1 | 143.6 ± 82.8 | 0.368 | |
| BUN/creatinine ratio | 19.0 ± 6.7 | 17.5 ± 8.8 | 0.487 | |
| SBP (mmHg) | 150.0 ± 22.6 | 146.5 ± 25.1 | 0.597 | |
| DBP (mmHg) | 84.6 ± 20.3 | 81.1 ± 19.8 | 0.518 | |
| HR (beat/minute) | 81.0 ± 14.9 | 80.2 ± 20.4 | 0.867 | |
| RR (cycle/minute) | 17.0 ± 2.5 | 18.1 ± 4.7 | 0.280 | |
| SpO2 (%) | 97.8 ± 3.2 | 98.0 ± 2.0 | 0.790 | |
| NIHSS score | 13.3 ± 8.1 | 16.6 ± 6.2 | 0.102 | |
| ASPECTS score | 9.86 ± 0.14 | 9.2 ± 0.49 | 0.696 | |
| Time from door to CT (mins) | 18.28 ± 4.84 | 14 ± 5.34 | 0.499 | |
| Time from door to needle (IV TPA) (mins) | 74.28 ± 24.04 | 50.4 ± 10.67 | 0.908 | |
| Time from door to groin puncture (MT) (mins) | 167 ± 40.06 | 122 ± 17.16 | 0.317 | |
| Time from groin puncture to recanalization (mins) | 34.28 ± 7.86 | 38 ± 12.14 | 0.489 | |
| Mechanical Thrombectomy | 26/26 (100%) | 26/28 (92.3%) | 1 | |
| IV tPA | 8/26 (30.7%) | 10/28 (36.3%) | 0.758 | |
| Site (n%) | Right | 8 (30.8%) | 14 (50.0%) | 0.151 |
| Left | 18 (69.2%) | 14 (50.0%) | ||
| Hemorrhagic transformation (HT) within 48 H after MT, (n%) | 9 (34.6%) | 9 (32.1%) | 0.847 | |
| Variables | ICA | M1 Artery | Proximal M2 Artery | |||||||
|---|---|---|---|---|---|---|---|---|---|---|
| Good (N = 4) | Poor (N = 4) | p-Value | Good (N = 13) | Poor (N = 13) | p-Value | Good (N = 9) | Poor (N = 11) | p-Value | ||
| Age (years) | 72.3 ± 16.1 | 76.5 ± 17.5 | 0.733 | 70.5 ± 9.6 | 58.9 ± 15.6 | 0.034 * | 70.4 ± 11.8 | 68.5 ± 11.7 | 0.711 | |
| Male Sex (n%) | 1 (25.0%) | 2 (50.0%) | 0.999 | 8 (61.5%) | 6 (46.2%) | 0.431 | 6 (66.7%) | 5 (45.5%) | 0.406 | |
| Race (n%) | White/ Caucasian | 2 (50.0%) | 1 (25.0%) | 0.999 | 6 (46.2%) | 3 (23.1%) | 0.226 | 6 (66.7%) | 5 (45.5%) | 0.406 |
| African American/Black | 2 (50.0%) | 3 (75.0%) | 6 (46.2%) | 10 (76.9%) | 3 (33.3%) | 6 (54.5%) | ||||
| Asian | 0 (0.0%) | 0 (0.0%) | 1 (7.7%) | 0 (0.0%) | 0 (0.0%) | 0 (0.0%) | ||||
| BMI (kg/m2) | 39.7 ± 9.7 | 26.8 ± 3.9 | 0.049 * | 31.7 ± 14.6 | 25.0 ± 4.9 | 0.138 | 28.0 ± 8.6 | 27.8 ± 6.8 | 0.944 | |
| BMI grade | <30.0 | 1 (25.0%) | 4 (100.0%) | 0.143 | 8 (61.5%) | 11 (84.6%) | 0.378 | 6 (66.7%) | 6 (54.5%) | 0.670 |
| ≥30.0 | 3 (75.0%) | 0 (0.0%) | 5 (38.5%) | 2 (15.4%) | 3 (33.3%) | 5 (45.5%) | ||||
| Hemoglobin level (gm/dL) | 10.6 ± 3.9 | 13.1 ± 1.1 | 0.296 | 11.4 ± 2.0 | 12.5 ± 1.9 | 0.188 | 13.2 ± 1.7 | 13.3 ± 1.2 | 0.796 | |
| Hematocrit (%) | 33.4 ± 10.8 | 39.3 ± 3.5 | 0.363 | 35.6 ± 4.7 | 38.4 ± 5.4 | 0.170 | 41.9 ± 5.8 | 40.7 ± 3.2 | 0.563 | |
| WBC count (×103/mL) | 8.7 ± 3.3 | 9.1 ± 1.7 | 0.826 | 8.2 ± 2.9 | 9.0 ± 3.2 | 0.505 | 7.3 ± 0.9 | 9.8 ± 4.1 | 0.098 | |
| Platelet count (×103/mL) | 214.0 ± 52.4 | 233.8 ± 65.7 | 0.655 | 228.6 ± 65.7 | 238.8 ± 77.4 | 0.722 | 233.8 ± 109.0 | 258.5 ± 92.1 | 0.590 | |
| Platelet/WBC ratio | 26.5 ± 7.3 | 26.8 ± 11.0 | 0.968 | 29.9 ± 8.3 | 28.3 ± 9.5 | 0.652 | 32.8 ± 18.7 | 28.4 ± 11.6 | 0.528 | |
| Sodium level (mEq/L) | 143.5 ± 4.0 | 138.5 ± 3.0 | 0.094 | 138.6 ± 2.2 | 138.1 ± 3.1 | 0.619 | 140.2 ± 2.4 | 139.3 ± 3.6 | 0.512 | |
| Potassium level (mmol/L) | 4.1 ± 0.4 | 4.0 ± 0.4 | 0.675 | 4.1 ± 0.4 | 4.1 ± 0.7 | 0.764 | 3.9 ± 0.4 | 4.2 ± 0.4 | 0.218 | |
| Calcium level (mg/dL) | 8.5 ± 0.5 | 9.0 ± 0.4 | 0.165 | 8.9 ± 0.5 | 8.8 ± 0.7 | 0.717 | 8.6 ± 0.5 | 8.9 ± 0.5 | 0.283 | |
| Blood glucose level (mg/dL) | 124.5 ± 5.2 | 112.0 ± 11.3 | 0.092 | 118.7 ± 20.9 | 142.2 ± 102.7 | 0.428 | 141.3 ± 59.4 | 156.7 ± 72.2 | 0.614 | |
| BUN/creatinine | 21.0 ± 6.0 | 14.0 ± 8.0 | 0.212 | 18.8 ± 5.8 | 20.8 ± 10.8 | 0.576 | 18.3 ± 8.6 | 14.9 ± 4.9 | 0.277 | |
| SBP (mmHg) | 145.0 ± 5.4 | 163.8 ± 28.0 | 0.236 | 150.1 ± 23.8 | 138.2 ± 18.2 | 0.167 | 152.0 ± 26.7 | 150.0 ± 29.1 | 0.876 | |
| DBP (mmHg) | 79.5 ± 27.7 | 96.5 ± 17.2 | 0.337 | 80.3 ± 15.7 | 76.5 ± 21.6 | 0.616 | 93.1 ± 22.5 | 80.8 ± 16.8 | 0.178 | |
| HR (beat/minute) | 81.0 ± 3.8 | 85.5 ± 31.3 | 0.785 | 83.2 ± 12.6 | 78.7 ± 22.2 | 0.535 | 78.0 ± 20.7 | 80.1 ± 14.8 | 0.795 | |
| RR (cycle/minute) | 17.8 ± 4.0 | 17.3 ± 5.2 | 0.884 | 17.0 ± 2.2 | 18.2 ± 4.3 | 0.366 | 16.7 ± 2.4 | 18.3 ± 5.3 | 0.387 | |
| SpO2 (%) | 96.3 ± 5.7 | 97.0 ± 2.4 | 0.816 | 97.9 ± 2.5 | 98.3 ± 2.0 | 0.667 | 98.3 ± 3.0 | 98.0 ± 1.9 | 0.766 | |
| NIHSS score | 16.8 ± 5.0 | 18.8 ± 7.0 | 0.658 | 13.2 ± 8.1 | 17.6 ± 5.8 | 0.123 | 11.9 ± 9.4 | 14.4 ± 6.4 | 0.503 | |
| Site (n%) | Right | 1 (25.0%) | 3 (75.0%) | 0.486 | 6 (46.2%) | 4 (30.8%) | 0.420 | 1 (11.1%) | 7 (63.6%) | 0.028 * |
| Left | 3 (75.0%) | 1 (25.0%) | 7 (53.8%) | 9 (69.2%) | 8 (88.9%) | 4 (36.4%) | ||||
| Hemorrhagic transformation (HT) within 48 H after MT, (n%) | 2 (50.0%) | 3 (75.0%) | 0.999 | 6 (46.2%) | 4 (30.8%) | 0.420 | 1 (11.1%) | 2 (18.2%) | 0.362 | |
| Characteristics | All Cases | ICA | M1 | Proximal M2 | ||||
|---|---|---|---|---|---|---|---|---|
| Value | 95% CI | Value | 95% CI | Value | 95% CI | Value | 95% CI | |
| Poor Collaterals from Good Collateral | ||||||||
| AUC | 0.560 | 0.401–0.720 | 0.813 | 0.465–1.000 | 0.550 | 0.320–0.781 | 0.465 | 0.199–0.730 |
| p-value | 0.446 | 0.149 | 0.663 | 0.790 | ||||
| Cut point | ≤35.0 | ≤35.0 | ≤35.0 | ≤35.0 | ||||
| Sensitivity | 96.4% | 81.7–99.9% | 100% | 39.8–100% | 100% | 75.3–100% | 90.9% | 58.7–99.8% |
| Specificity | 30.8% | 14.3–51.8% | 75.0% | 19.4–99.4% | 23.1% | 5.0–53.8% | 22.2% | 2.8–60.0% |
| DA | 64.8% | 50.6–77.3% | 87.5% | 47.3–99.7% | 61.5% | 40.6–79.8% | 60.0% | 36.1–80.9% |
| YI | 27.2% | 8.2–46.2% | 75.0% | 32.6–100% | 23.1% | 0.2–46.0% | 13.1% | 18.9–45.2% |
| PPV | 60.0% | 44.3–74.3% | 80.0% | 28.4–99.5% | 56.5% | 34.5–76.8% | 58.8% | 32.9–81.6% |
| NPV | 88.9% | 51.8–99.7% | 100% | 29.2–100% | 100% | 29.2–100% | 66.7% | 9.4–99.2% |
Publisher’s Note: MDPI stays neutral with regard to jurisdictional claims in published maps and institutional affiliations. |
© 2022 by the authors. Licensee MDPI, Basel, Switzerland. This article is an open access article distributed under the terms and conditions of the Creative Commons Attribution (CC BY) license (https://creativecommons.org/licenses/by/4.0/).
Share and Cite
Hamam, O.; Garg, T.; Elmandouh, O.; Wang, R.; Aslan, A.; Ahmed, A.; Moustafa, A.; Yedavalli, V. Baseline Characteristics Associated with Good Collateral Status Using Hypoperfusion Index as an Outcome. Tomography 2022, 8, 1885-1894. https://doi.org/10.3390/tomography8040159
Hamam O, Garg T, Elmandouh O, Wang R, Aslan A, Ahmed A, Moustafa A, Yedavalli V. Baseline Characteristics Associated with Good Collateral Status Using Hypoperfusion Index as an Outcome. Tomography. 2022; 8(4):1885-1894. https://doi.org/10.3390/tomography8040159
Chicago/Turabian StyleHamam, Omar, Tushar Garg, Omar Elmandouh, Richard Wang, Alperen Aslan, Amara Ahmed, Abdallah Moustafa, and Vivek Yedavalli. 2022. "Baseline Characteristics Associated with Good Collateral Status Using Hypoperfusion Index as an Outcome" Tomography 8, no. 4: 1885-1894. https://doi.org/10.3390/tomography8040159
APA StyleHamam, O., Garg, T., Elmandouh, O., Wang, R., Aslan, A., Ahmed, A., Moustafa, A., & Yedavalli, V. (2022). Baseline Characteristics Associated with Good Collateral Status Using Hypoperfusion Index as an Outcome. Tomography, 8(4), 1885-1894. https://doi.org/10.3390/tomography8040159