Article

Exploring the Discharge Performance of Li-ion Batteries Using Ohmic Drop Compensation

Université Grenoble Alpes, Université Savoie Mont Blanc, CNRS, Grenoble INP, LEPMI, F-38000 Grenoble, France
*
Author to whom correspondence should be addressed.
Batteries 2023, 9(9), 451; https://doi.org/10.3390/batteries9090451
Submission received: 24 July 2023 / Revised: 25 August 2023 / Accepted: 29 August 2023 / Published: 1 September 2023
(This article belongs to the Section Battery Performance, Ageing, Reliability and Safety)

Abstract

:
In this study, we investigate the use of the ohmic drop compensation method during battery discharges at different rates. Four different types of NMC Li-ion batteries are compared and three 18,650 cells of each type are tested to evaluate the performance dispersion. The cell type that shows significant performance improvement thanks to ohmic drop compensation in this first experimental part is then selected to complete the exploration. A drone-type usage profile is set up and demonstrates without any doubt the interest of using this type of protocol in such usage. Finally, a preliminary aging study is also performed on this type of cells: ohmic drop compensation use has no effect on low-power performance decrease during aging and has a moderate impact on high-power performances.

Graphical Abstract

1. Introduction

Today, lithium-ion batteries are used in a wide variety of applications, from powering portable equipment to electric vehicles (EVs) or stationary electrical energy storage systems [1,2]. The main reason for the rapid growth of this type of battery in the market, especially for portable usages, is their high specific energy (Wh/kg) and/or specific power density (W/kg) compared to older chemistries [3,4]. Today, even better characteristics are still being sought, as well as increasing concerns about safety, cost, and environmental impacts [5,6,7,8].
Ragone plots are a good tool to highlight the differences between energy storage systems in terms of specific energy and power. These plots allow the comparison, on the one hand, of the specific energy at low power densities and, on the other hand, of the range of powers for which the specific energy decreases significantly [9,10,11]. They are a good help in designing and sizing the battery for a new application. It should be noted that the selection and sizing of the battery for each particular use almost always includes oversizing factors to provide for occasional power demands. As a result, batteries are very rarely used over the full state of charge range (i.e., almost never completely discharged) and consequently, the weight of the batteries for a given application is also oversized.
The inevitable battery energy drop at high power is partly related to the ohmic drop phenomena since ohmic drop effects increase for high currents or powers, as detailed in the following. For an electrochemical system made up of a sandwich of conductive, ionic, or electronic materials, the voltage between the terminals can be split into two different types of terms: interfacial and volume potential differences [12,13], as shown in Equation (1):
U = i n t e r f a c e s U i n t e r f a c i a l + v o l u m e s U v o l u m e
The interfacial terms consist of two parts:
A part that does not depend on the current, frequently called open circuit voltage OCV;
A part that strongly depends on the level of current flowing through the cell and which is mainly located at the positive and negative interfaces, usually called overpotentials or polarizations:
i n t e r f a c e s U i n t e r f a c i a l = U O C V + η + I η I
The volume terms, also called ohmic drop, are related to the charge transport in each volume of conductive materials of the cell: current collectors, active materials, electrolyte, connections, etc. A generally good approximation of these terms is given by Ohm’s law with a voltage drop proportional to the current. The corresponding proportionality factor is usually called the internal resistance of the cell (R in Ω):
v o l u m e s U v o l u m e R   I
Since the electrochemical process involves electrochemical (redox) reactions only at the positive and negative interfaces, ohmic drop phenomena do not have a direct impact on faradaic efficiencies and therefore on the greater or lesser occurrence of side reactions in such systems. The main secondary effect of ohmic drop is related to the Joule effect, which can cause an increase in the cell temperature [14,15].
The method known as “ohmic drop compensation” is a technique commonly used in analytical electrochemistry and is available in all potentiostats used for experiments in this field [16,17]. It consists in modifying the voltage applied to the cell (Uapplied) in order to compensate for the ohmic drop. For example:
U a p p l i e d = U t a r g e t + A   I = i n t e r f a c e s U i n t e r f a c i a l + v o l u m e s U v o l u m e
where Utarget (V) is the desired interfacial voltage between the two electrodes, and A (in Ω) is the compensation level parameter. Then:
i n t e r f a c e s U i n t e r f a c i a l U t a r g e t + A   I R   I
This technique is mainly used in laboratory experiments with three-electrode devices and is not very common in the battery field [18]. Indeed, in most batteries, electrolyte-impregnated volumetric electrodes are generally used, and the concept of interfacial surfaces becomes more difficult to handle. Nevertheless, the idea of correcting battery voltage by a factor proportional to current remains an interesting method to be explored. Fast battery charging protocols based on this method have been studied in recent years, leading to the use of higher-than-usual maximum voltages [19,20,21,22,23,24]. For example, Noh et al. [22] have demonstrated on LiFePO4 cells that a very fast charge is easy to achieve thanks to the introduction of the ohmic drop compensation (90% of recharge in 6 min for example). It should be added that a non-negligible effect on aging has simultaneously been detected in the case of charging protocols using ohmic drop compensation [25]. To our knowledge, no study with ohmic drop compensation has been performed under discharge conditions.
This study is devoted to the study of the influence of the use of ohmic drop compensation on the discharge performance of Li-ion batteries. After having detailed the protocol with ohmic drop compensation and the corresponding results for constant current discharges, the results are gathered through the comparison of Ragone plots with or without ohmic drop compensation for different types of Li-ion cells. The influence of this technique is also studied on a non-constant current protocol representative, for example, on a drone flight. Finally, the impact on battery aging is also explored.

2. Materials and Methods

Batteries manufacturers often develop two product lines for the same chemistry: one dedicated to power uses and the other focusing on energy performance. This study uses two 18,650 “energy” cells from LG and Samsung manufacturers and two 18,650 “power” cells from the same manufacturers [26,27]. Their references and the main characteristics found in the data sheets are gathered in Table 1.
All experiments are conducted in a climatic chamber with forced air cooling regulated at 25 °C. Two dummy cell rings (i.e., non-connected cells) are constructed around the study cell to improve heat dissipation, as shown in Figure 1. A thermocouple is placed on the outer surface of the study cell to verify that its surface temperature remains below the manufacturer’s maximum recommended temperature. A C-clamp is used to hold the cell with the electrical contacts to the power cables through nickel strips. A BioLogic® (Seyssinet-Pariset, France) potentiostat is used to perform the experiments.
The charging protocol is always the same: Constant Current (CC) at C/2 until 4.2 V is reached, then Constant Voltage (CV) at 4.2 V until the current drops below C/20. After five cycles at –C/2 for initialization, each cell undergoes about 30 discharges at different rates, including reproducibility tests for three rates: –C/2, –2C, and –4C (a negative value for the discharge currents is chosen by convention). The sequence of the different currents is randomly chosen and different for each cell studied and a 30 min rest period is always observed after each charge or discharge Thanks to the previously described heat dissipation setup (see Figure 1), cell temperatures remain well below the maximum recommended by the manufacturer (less than 75 °C) (see Figure 2b). As a consequence, only very slight aging is observed during the first tests (Section 3.1). This aging level is estimated through the evolution of the discharge capacity of the reproducibility data (e.g., six values at –C/2 randomly placed in the sequence for each cell). A correction by an aging coefficient is then applied to all raw capacity data, assuming a constant decrease at each cycle (see details in the Supplementary Materials Support). All values of the aging coefficient are well below 1% as expected: they range from 0.04% to 0.21% per cycle for all cells.
From the manufacturer’s data, a single cut-off voltage is defined for all cells: Ucut-off = 2.75 V. Since constant current discharges or discharges with different constant current periods are used for this study (see Section 3.1, Section 3.2 and Section 3.3), the ohmic drop compensation technique described above will only affect the voltage limitation, Umin, according to the following expression with a negative value for the discharge currents:
U m i n = U c u t o f f + A   I = 2.75 + A   I
As an example, for an A value of 30 mΩ, the new cut-off voltage (Umin) at –10 A is 2.45 V. The compensation factor A is estimated by the current interrupt technique at 50% SOC. Alternating periods of 5 ms between open circuit and discharge at –C/2 are applied to the cell, and A is chosen to be equal to the ΔUI ratio calculated at Δt = 1 ms.
In order to appreciate the dispersion between cells of the same type, constant current discharges are performed on three different cells (see Section 3.1). Table 2 gives an idea of this dispersion on two different parameters: the available discharge capacity at –C/2 and the compensation factor A.
As expected for fresh cells purchased from reputable manufacturers, there is very little dispersion in capacity, related to the good quality of production and sorting of the batteries before sale. The slightly more dispersed values of the ohmic drop compensation factor can be attributed to two causes, which are difficult to separate: the first is the intrinsic dispersion related to the manufacturing, and the second is due to the non-perfectly reproducible electrical connections in the experimental setup. However, all experiments on one cell are performed without modification of these electrical connections: the ohmic drop compensation factor is always determined in the same configuration before the following experiments.

3. Results

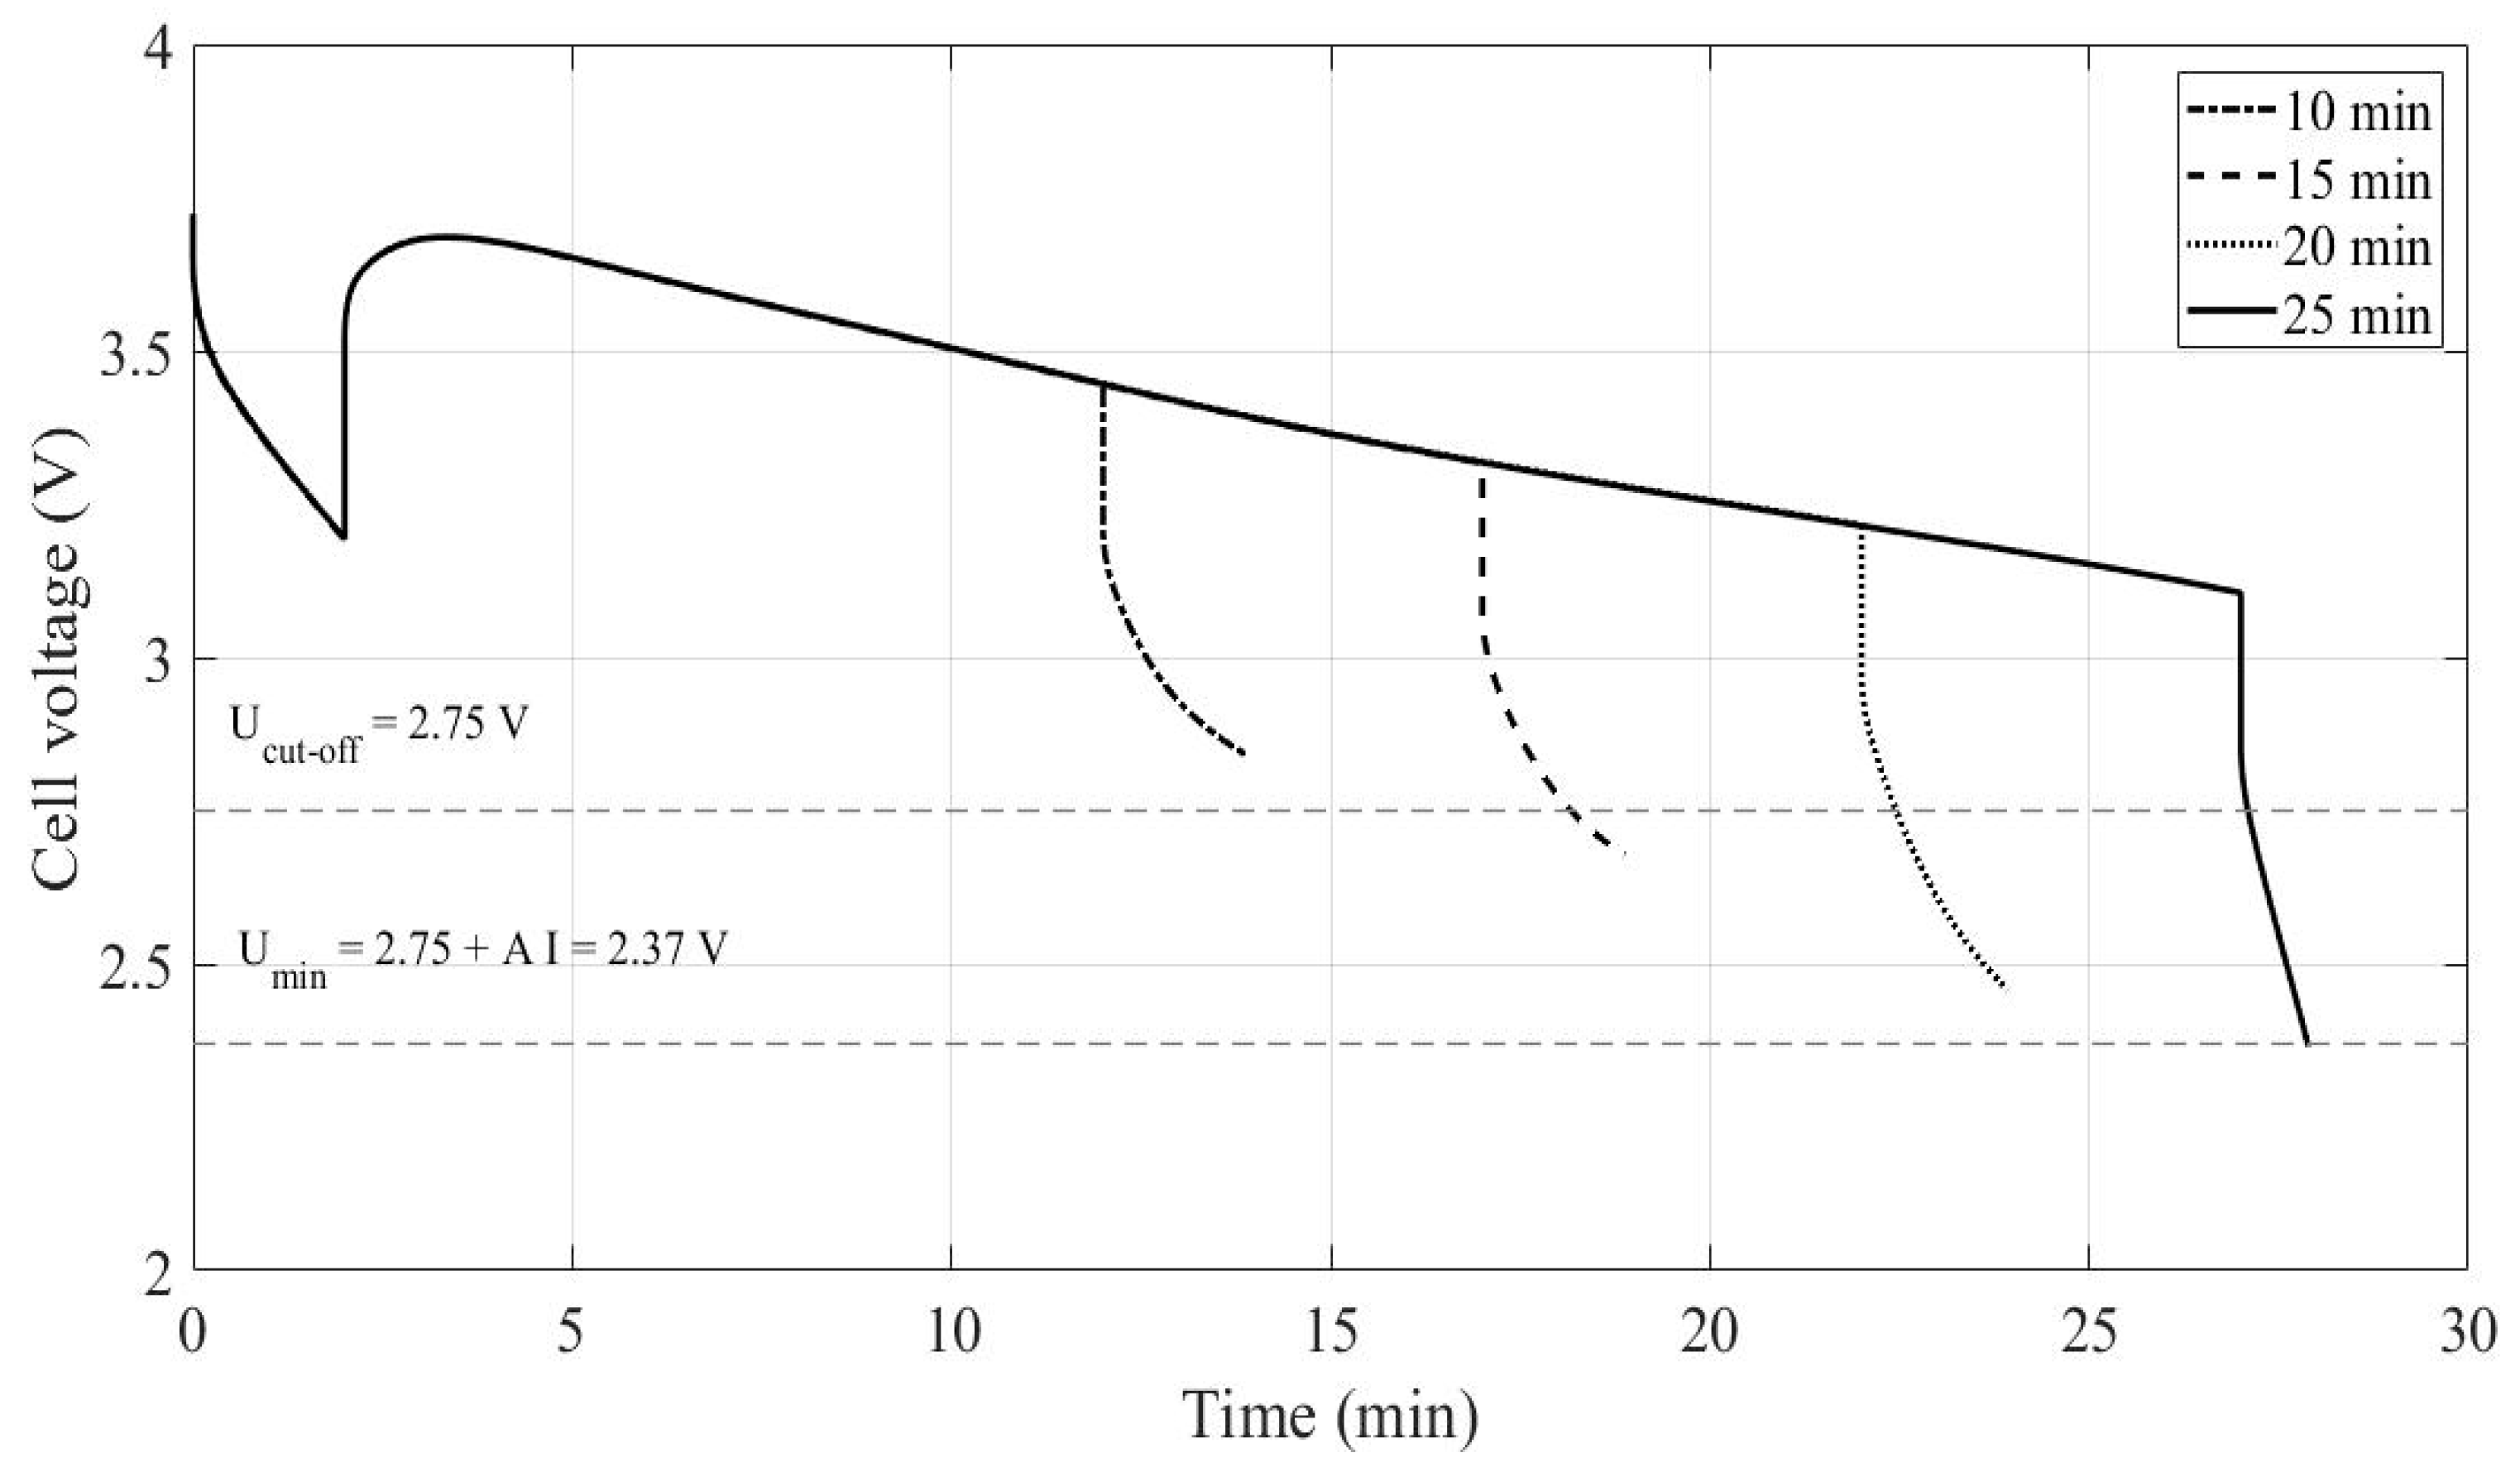
3.1. Constant Current Discharges Using Ohmic Drop Compensation

In the battery data sheets, the manufacturers sometimes give capacity values for different currents/rates. For Li-ion batteries, the discharges are stopped at a cut-off voltage given by the manufacturer: the battery management system (BMS) must prevent the battery from falling below this recommended value. In this work, discharge data are collected over a wide range of currents for the selected battery using the principle of ohmic drop compensation. Figure 2a,b respectively show voltage and temperature variations during discharges using ohmic drop compensation, as a function of discharged capacity, starting from a fully charged battery for the LE cell. Capacities are normalized by the nominal capacity claimed by the manufacturer (see Table 1). As detailed in the experimental section, the ohmic drop compensation technique applied to constant current discharges simply involves changing the minimum voltage. With compensation, the discharge continues to a lower voltage than the standard discharge: the higher the current, the lower the final voltage (e.g., Umin = 2.17 V instead of 2.75 V for a –6C discharge with ohmic drop compensation). In both figures, the data corresponding to the operating extension made possible by ohmic drop compensation are shown in dotted lines.
The very good reproducibility of the data for the same cell and the low dispersion between the different cells of the same production batch are illustrated by the superposition of the discharge voltage curves at three different rates, presented in Figure 3.
With the usual constant cut-off voltage protocol, the available capacity decreases rapidly at high rates for the LE cell: typically, 7% loss at –2C and 69% loss at –7C. The use of ohmic drop compensation clearly improved the available capacity at high rates. As an example, at –4C, the increase in available capacity is +21% of Qn with compensation. As far as temperature is concerned, it is no surprise that end-of-discharge temperatures are always higher when ohmic drop compensation is used, the higher the speed. However, even at –7.7C, the maximum temperature reached is equal to 51 °C, which remains well below the limit acceptable by the battery, according to the manufacturer.
The same procedure is applied to the other types of cells, SE, LP, and SP (see Table 1). Details of the voltage profiles for these cells are presented in Appendix A. Figure 4a,b gather all the data, without or with ohmic drop compensation, for the four types of cells through two complementary presentations: (a) evolution of available capacities (noted Qmax) with the applied discharge current and (b) the Ragone plot. For each rate, the total energy is calculated by integrating the instantaneous power using the voltage and current values at each instant of the discharge, and then the average power is deduced using the total discharge time at that rate, as detailed in the following equations where m is the cell weight:
S p e c i f i c   e n e r g y = 1 m × f u l l y   c h a r g e d f u l l y   d i s c h a r g e d U t . I t . d t
S p e c i f i c   a v e r a g e   p o w e r = S p e c i f i c   e n e r g y D i s c h a r g e   d u r a t i o n
Only the average values for the three cells tested are plotted. In Figure 4a, the colored vertical lines represent the highest current recommended by the manufacturer (see Table 1).
As expected and shown in Figure 3, high rates/powers (–8C or –10C) can be achieved with very little decrease in capacity/energy for power cells (SP, LP). Therefore, a possible improvement provided by ohmic drop compensation cannot really be discussed from these data in the tested discharge rate range. The two types of energy cells do not show the same behavior: ohmic drop compensation does not significantly change the available capacities of the SE cells, as was the case for the LE cells (see Figure 2a).
It should be mentioned that, except for the SE cells, using ohmic drop compensation provides almost full capacity at the highest current recommended by the manufacturer. For SE cells, at the highest current allowed by the manufacturer, this cell cannot deliver more than half of the capacity (this behavior is the same with or without ohmic drop compensation).
The decrease in performance at high current/high power is related, as for all electrochemical systems, to a combination of possible kinetic limitations linked to redox reactions at interfaces and those linked to mass transport kinetics. In the case of Li-ion batteries, the main phenomena are mass transport phenomena, namely, migration and diffusion. In terms of available capacity, the use of ohmic drop compensation allows the capacity losses only related to diffusion phenomena to be highlighted, while the usual data without compensation result in both coupled transport phenomena. The design of power batteries allows a decrease in internal resistance as well as a decrease in the diffusion time constant.
The Ragone plot (Figure 4b) sheds additional light on these results in that it highlights the fact that achieving high-power density levels goes hand in hand with a lower maximum energy density level: compare for example SP and SE. With the same trend, SE cells show a lower energy performance than LE cells but better behavior at high powers. The Ragone plot is a very good way to point out that even with identical chemistry, trade-offs have to be made between high energy and high power, which leads to a wide range of products.
Depending on the chemistry and design parameters or manufacturing conditions, the ohmic drop compensation method is a good way to characterize batteries and their ability to provide additional capacity. Since only LE cells show a significant impact of ohmic drop compensation on discharge performance, the remainder of this study on the use of ohmic drop compensation will focus only on LE cells.

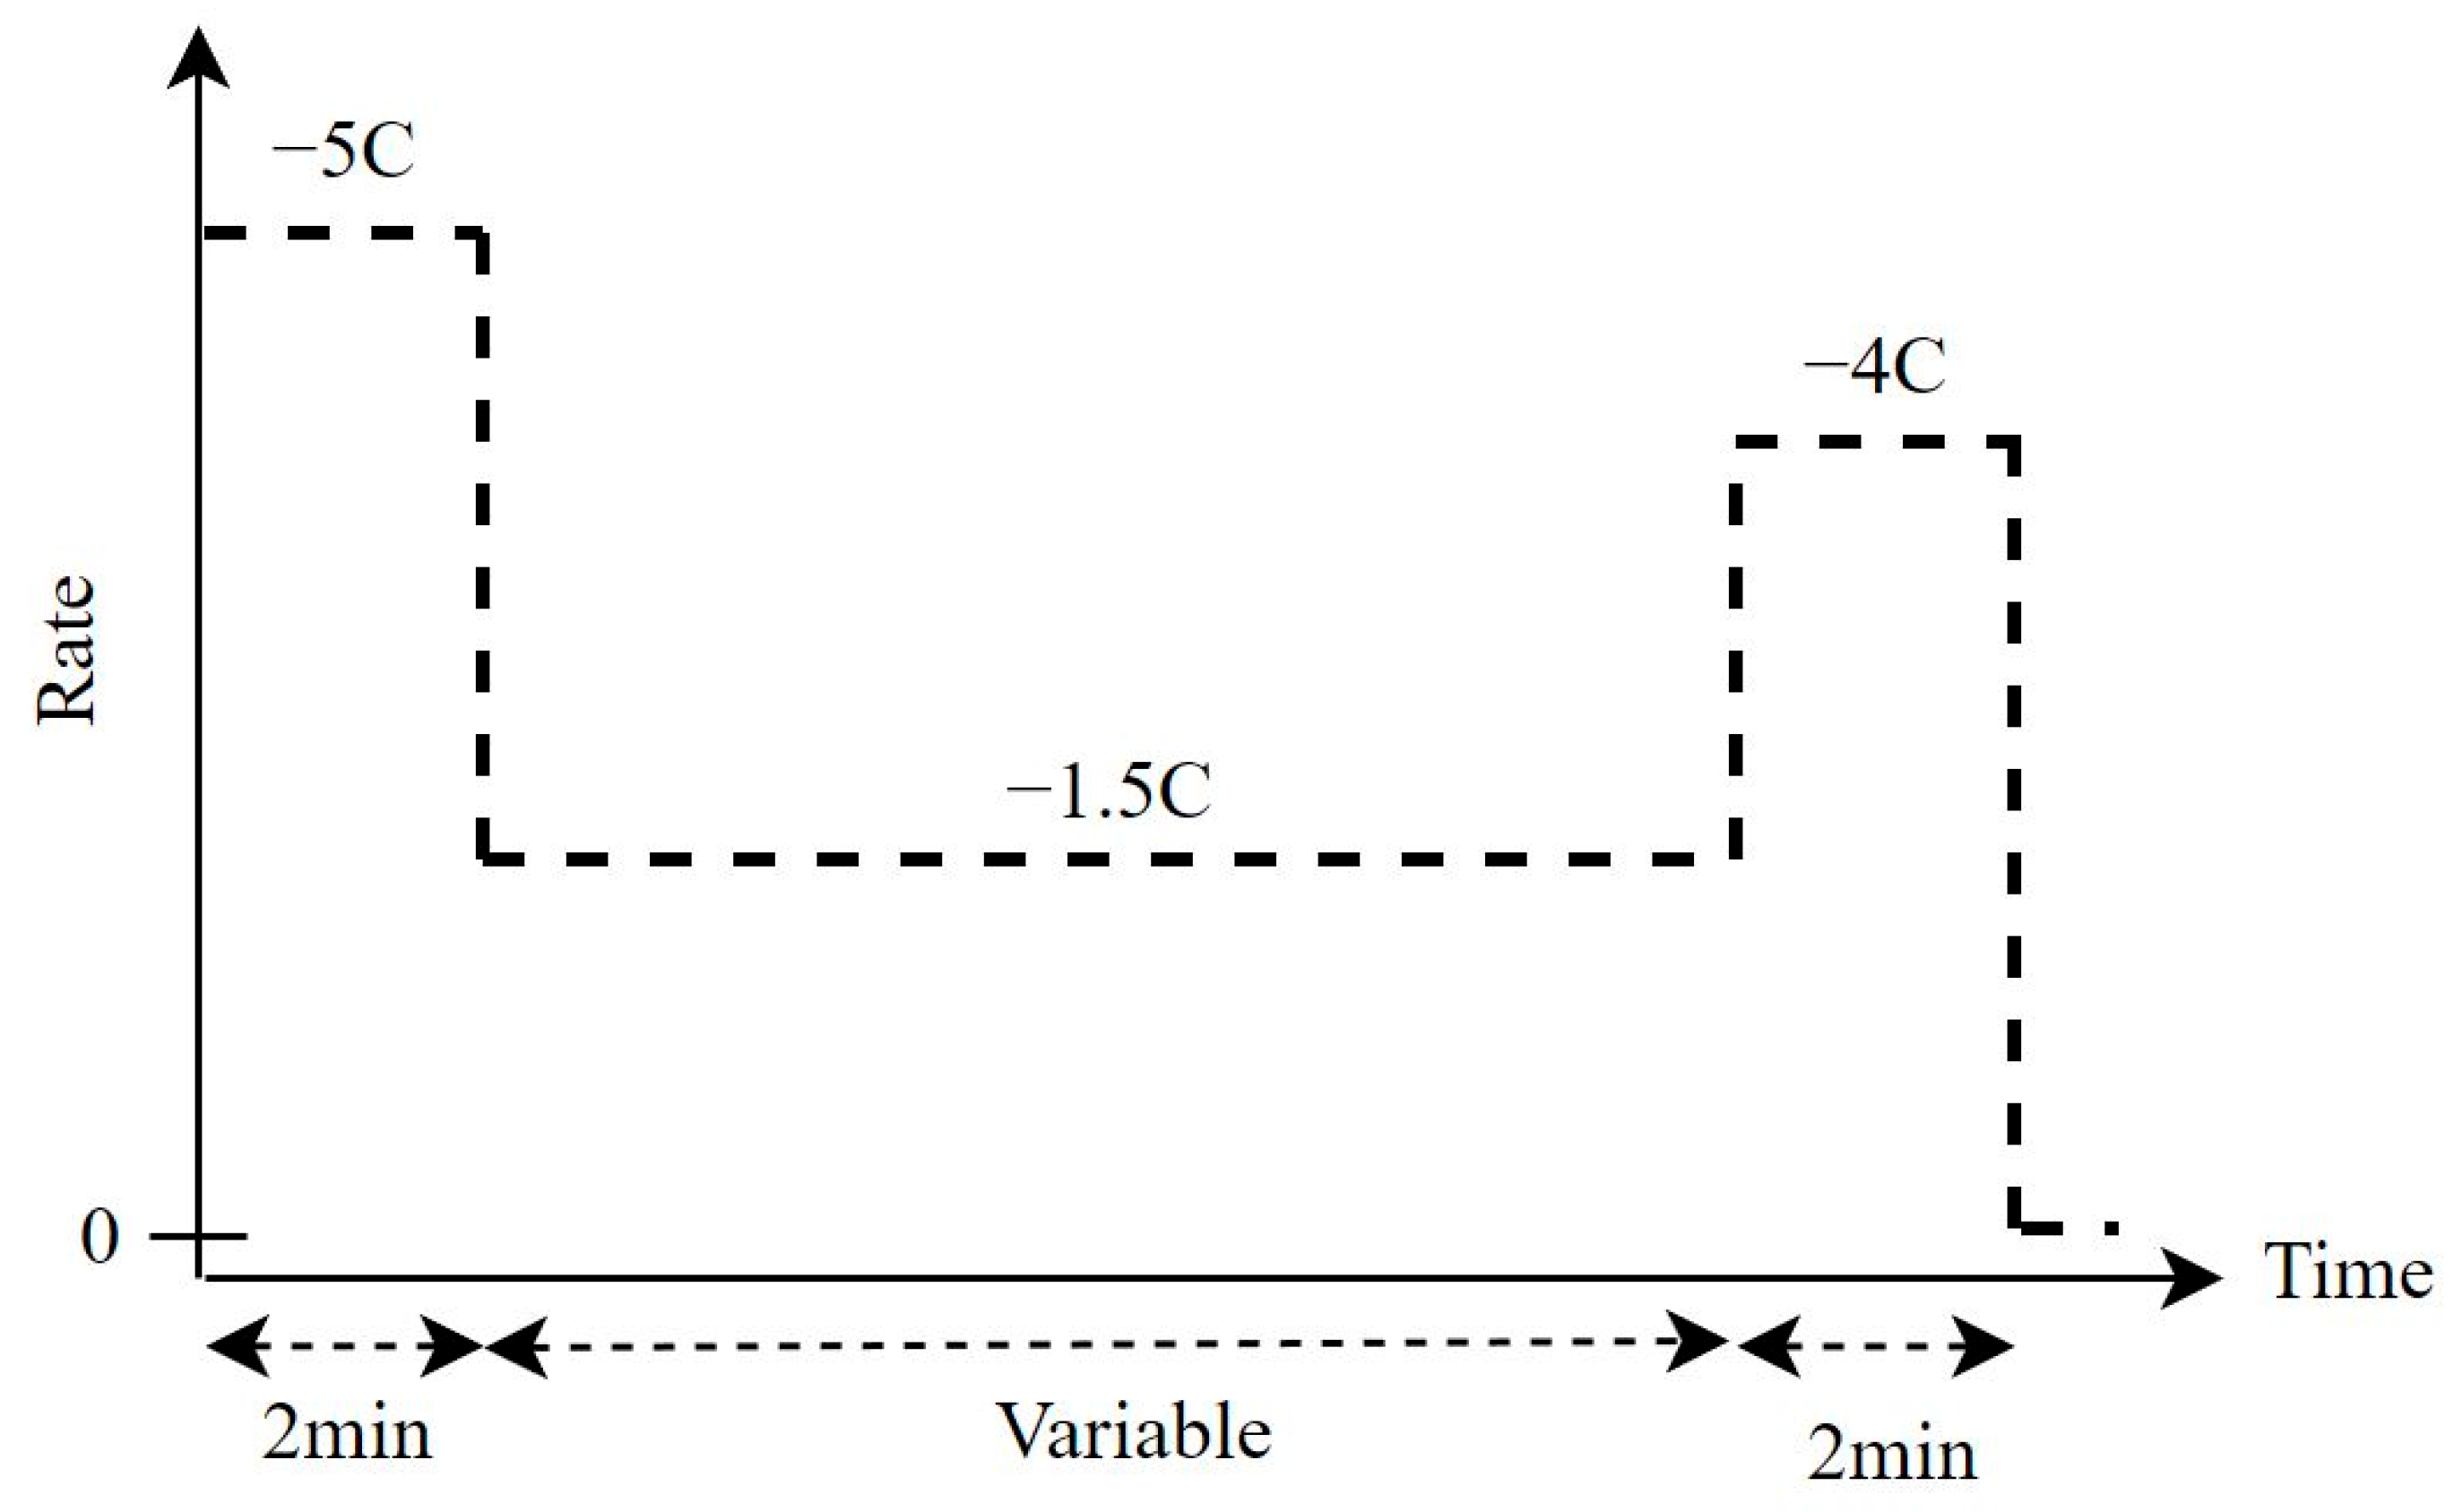
3.2. Extending the Flight Time of a Drone with Ohmic Drop Compensation

A simplified protocol illustrating drone-type use is chosen (see Figure 5) with a first step, corresponding to the take-off, at high power for a few minutes, a second step, corresponding to a hovering flight for several minutes at moderate power, and a third step, representative of landing, again with a high-power demand. Each step is performed at a constant current in this simplified profile.
Figure 6 gathers the results of four experiments following the previous profile with hover times of 10, 15, 20, and 25 min. The area above 2.75 V corresponds to the useful range for a drone equipped with a conventional Battery Management System (BMS) using the manufacturer’s cut-off voltage. The extension of the operating range that would be allowed by a BMS exploiting the ohmic drop compensation is illustrated by the lowering of the horizontal line, representing the minimum voltage with compensation during the landing phase of the drone (Umin = 2.37 V at –4C).
With this type of cell, only the 10 min hover time is safe with a conventional BMS, i.e., without ohmic drop compensation. In contrast, flight times of 15 and 20 min become achievable without incident if ohmic drop compensation is applied.
Another way to highlight these results is given by Table 3, which compares the capacity required to perform a complete flight, the capacity allowed by conventional BMS management, and the capacity allowed by management with ohmic drop compensation. The shaded boxes in Table 3 show the successful scenario cases.
These experiments clearly illustrate the benefit of using a BMS with ohmic drop compensation in this type of profile. However, this evidence must be balanced against a possible decrease in durability. A previous study using ohmic drop compensation during the charging process has indeed shown quite significant negative effects on cyclability [25]. The following section provides some preliminary answers on this issue.

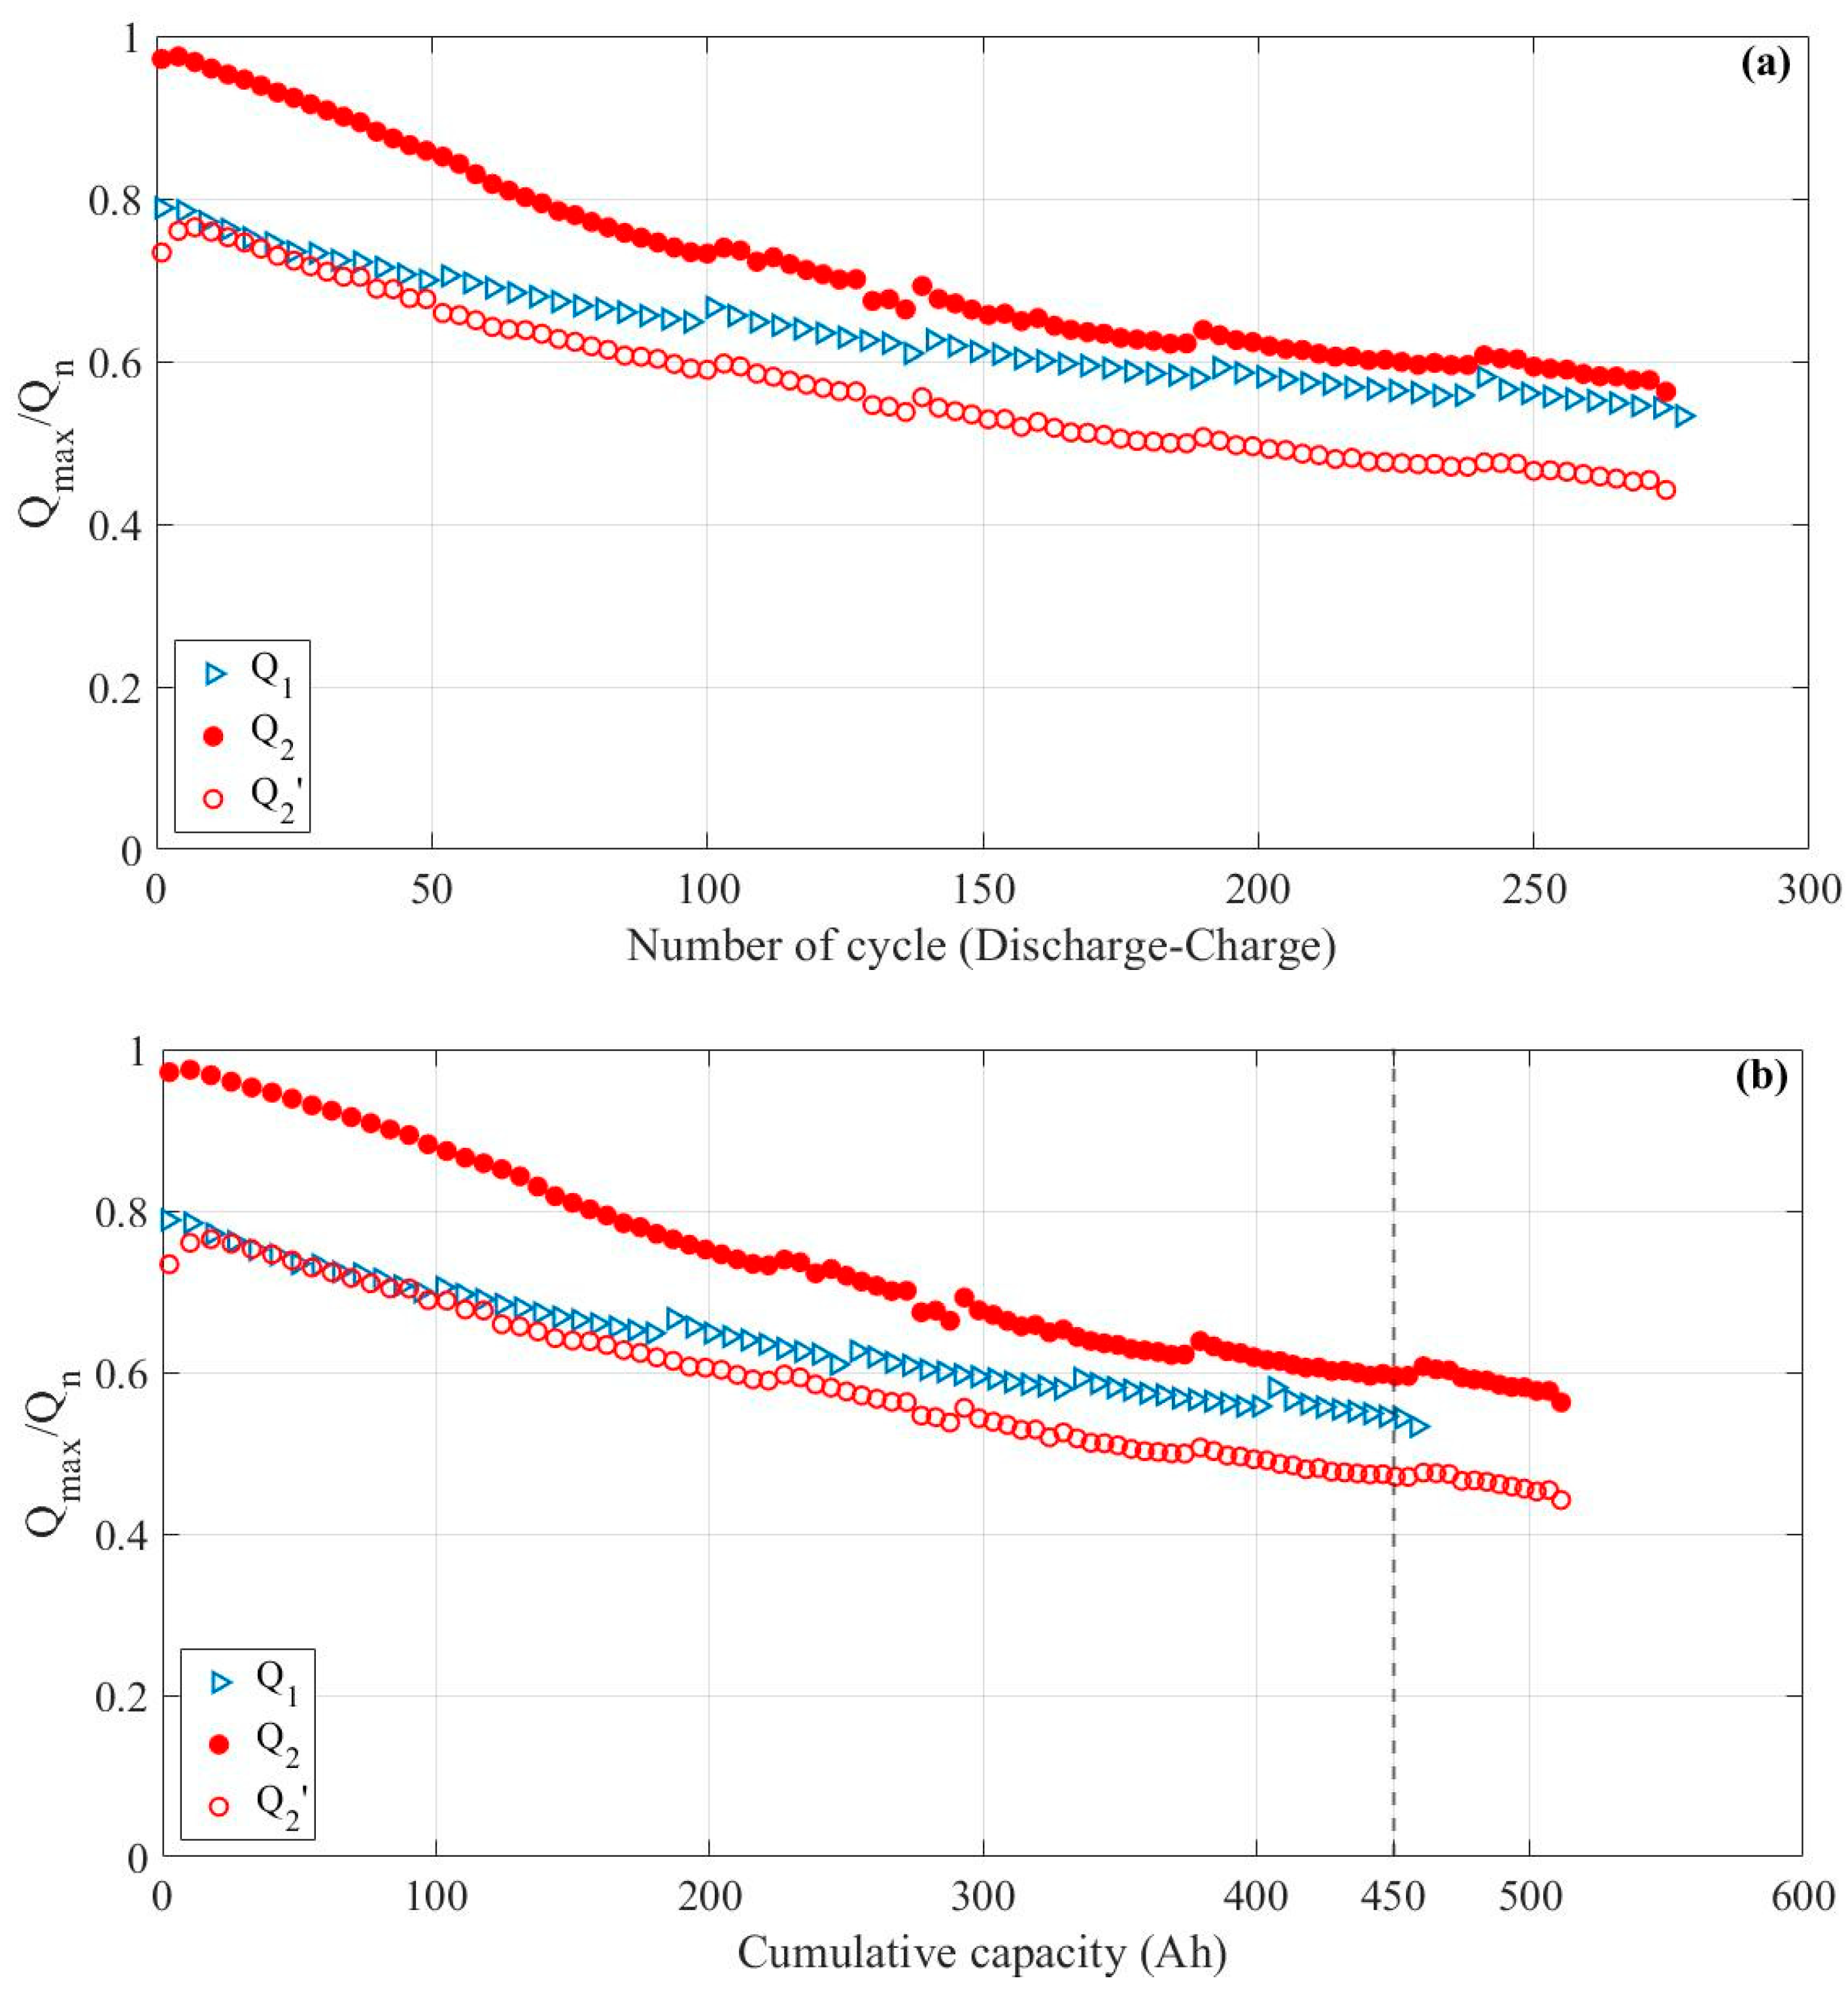
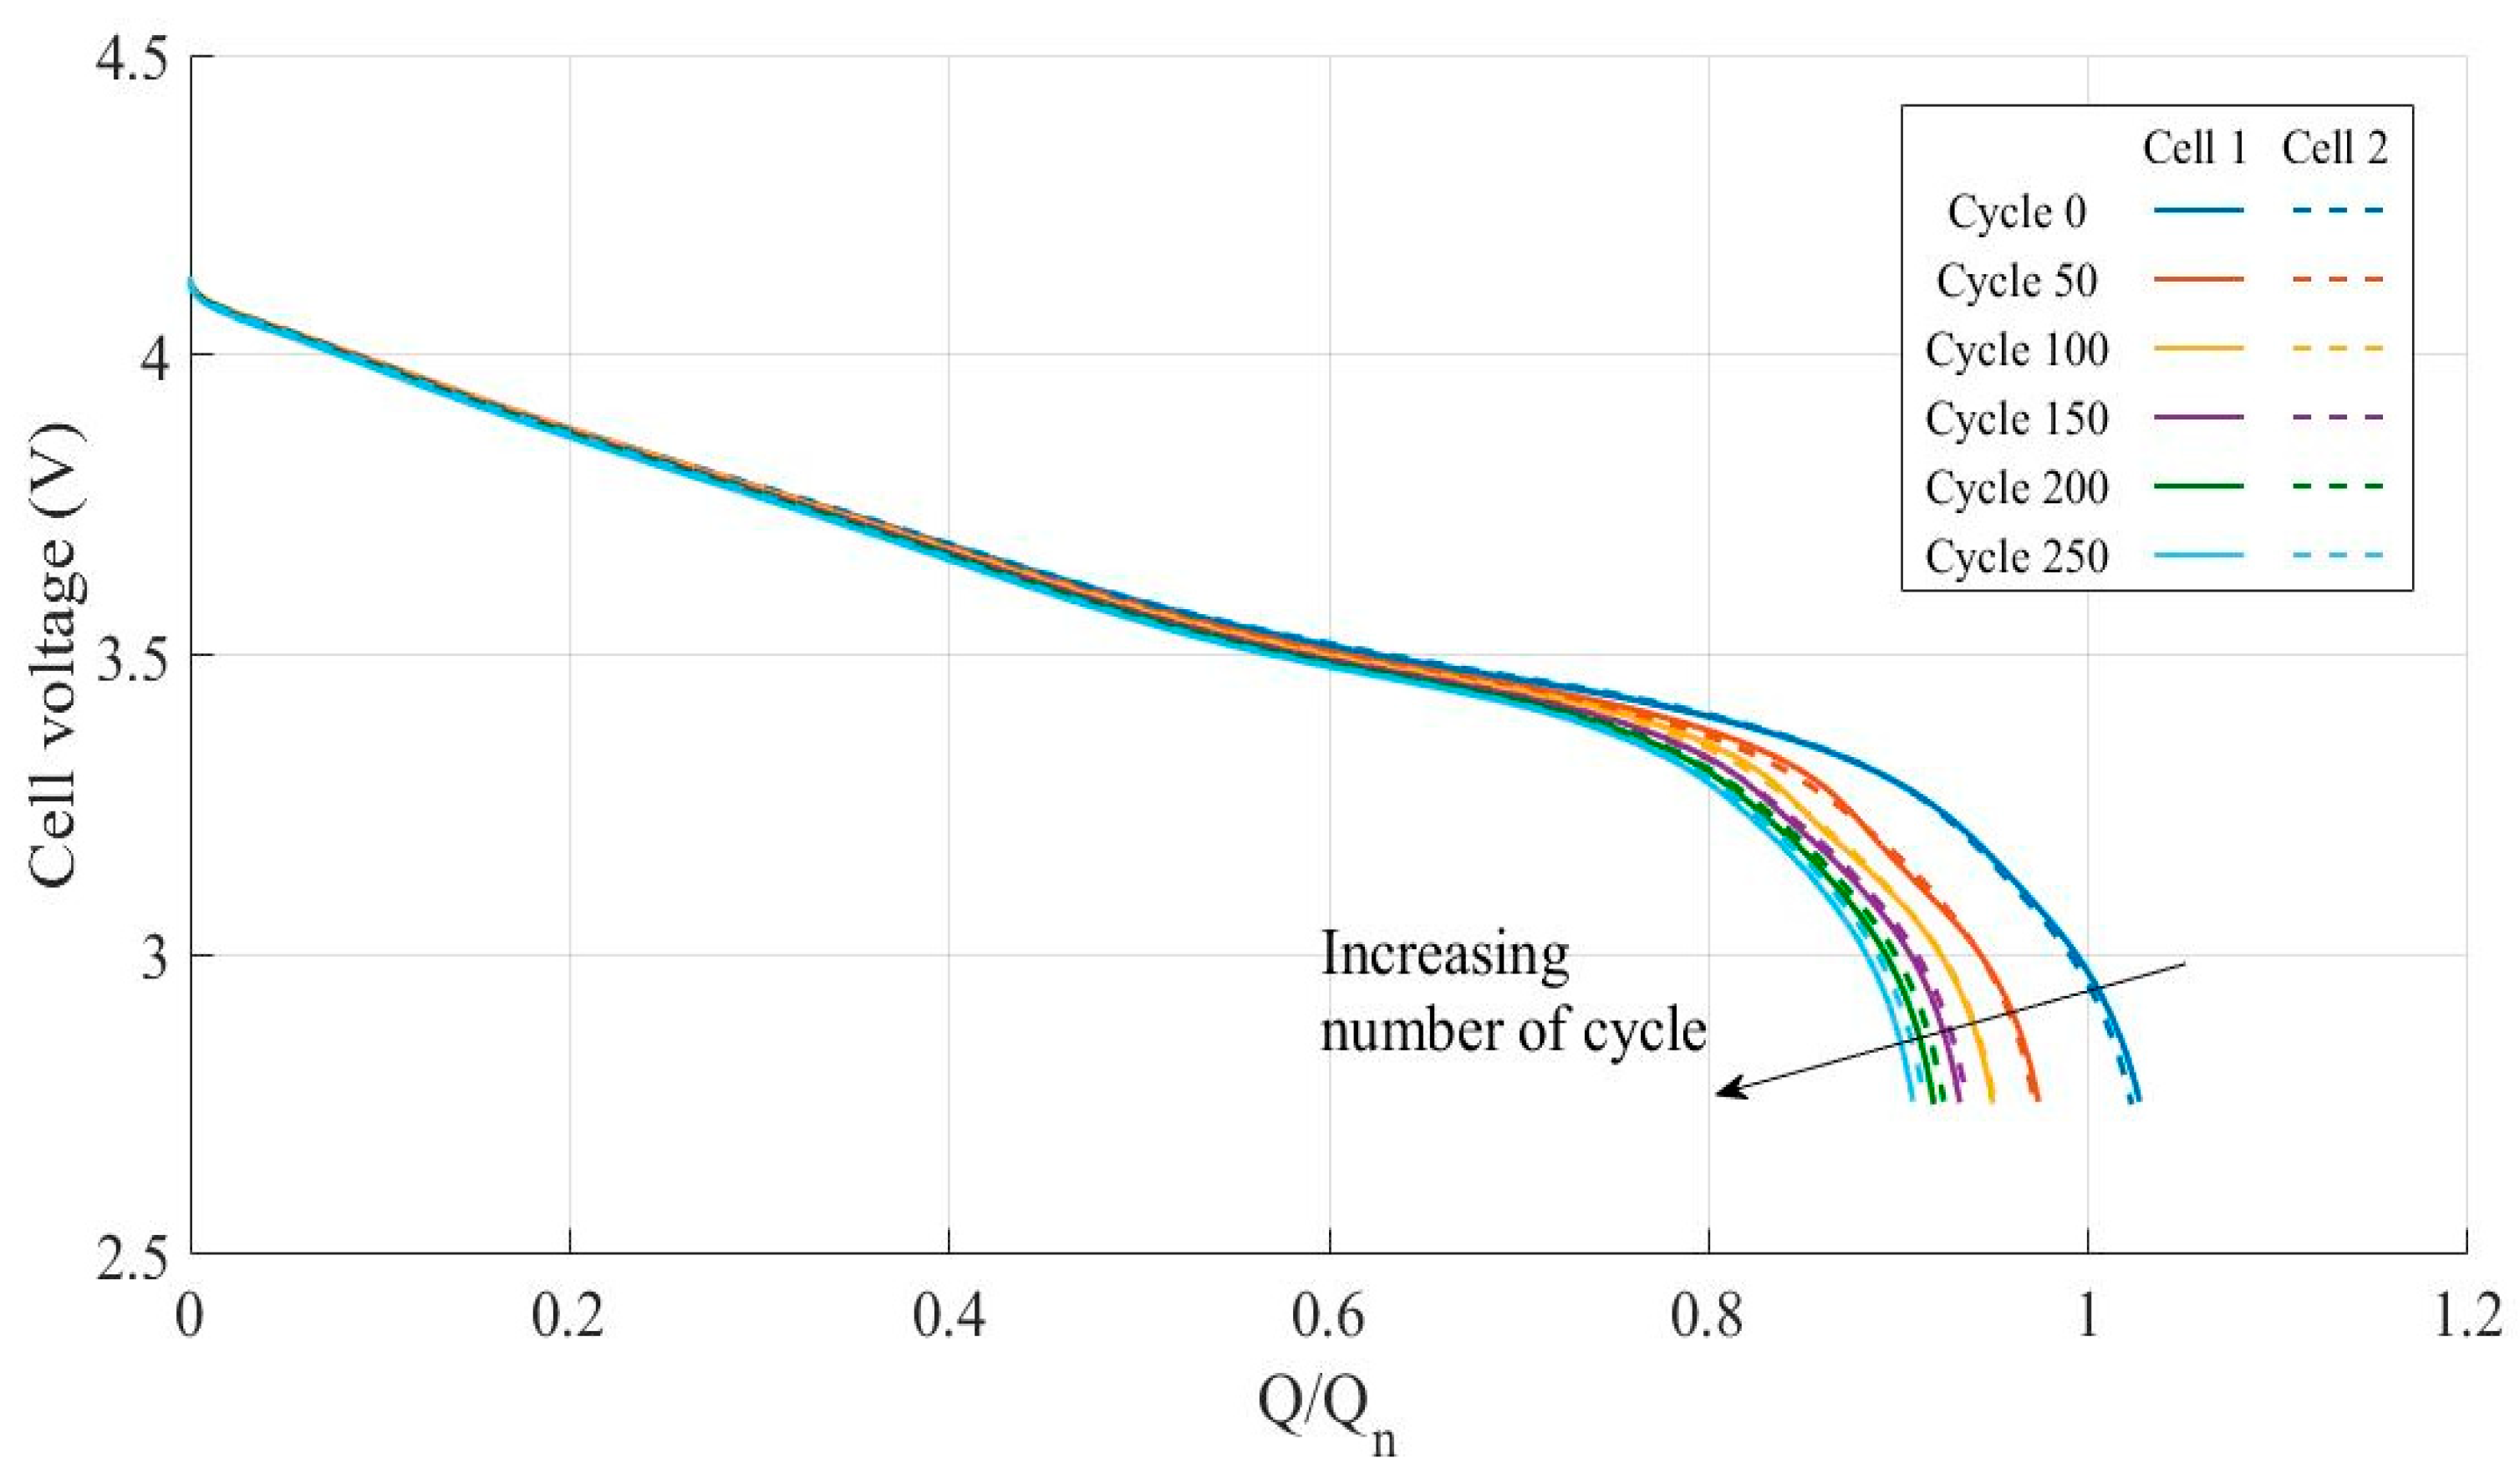
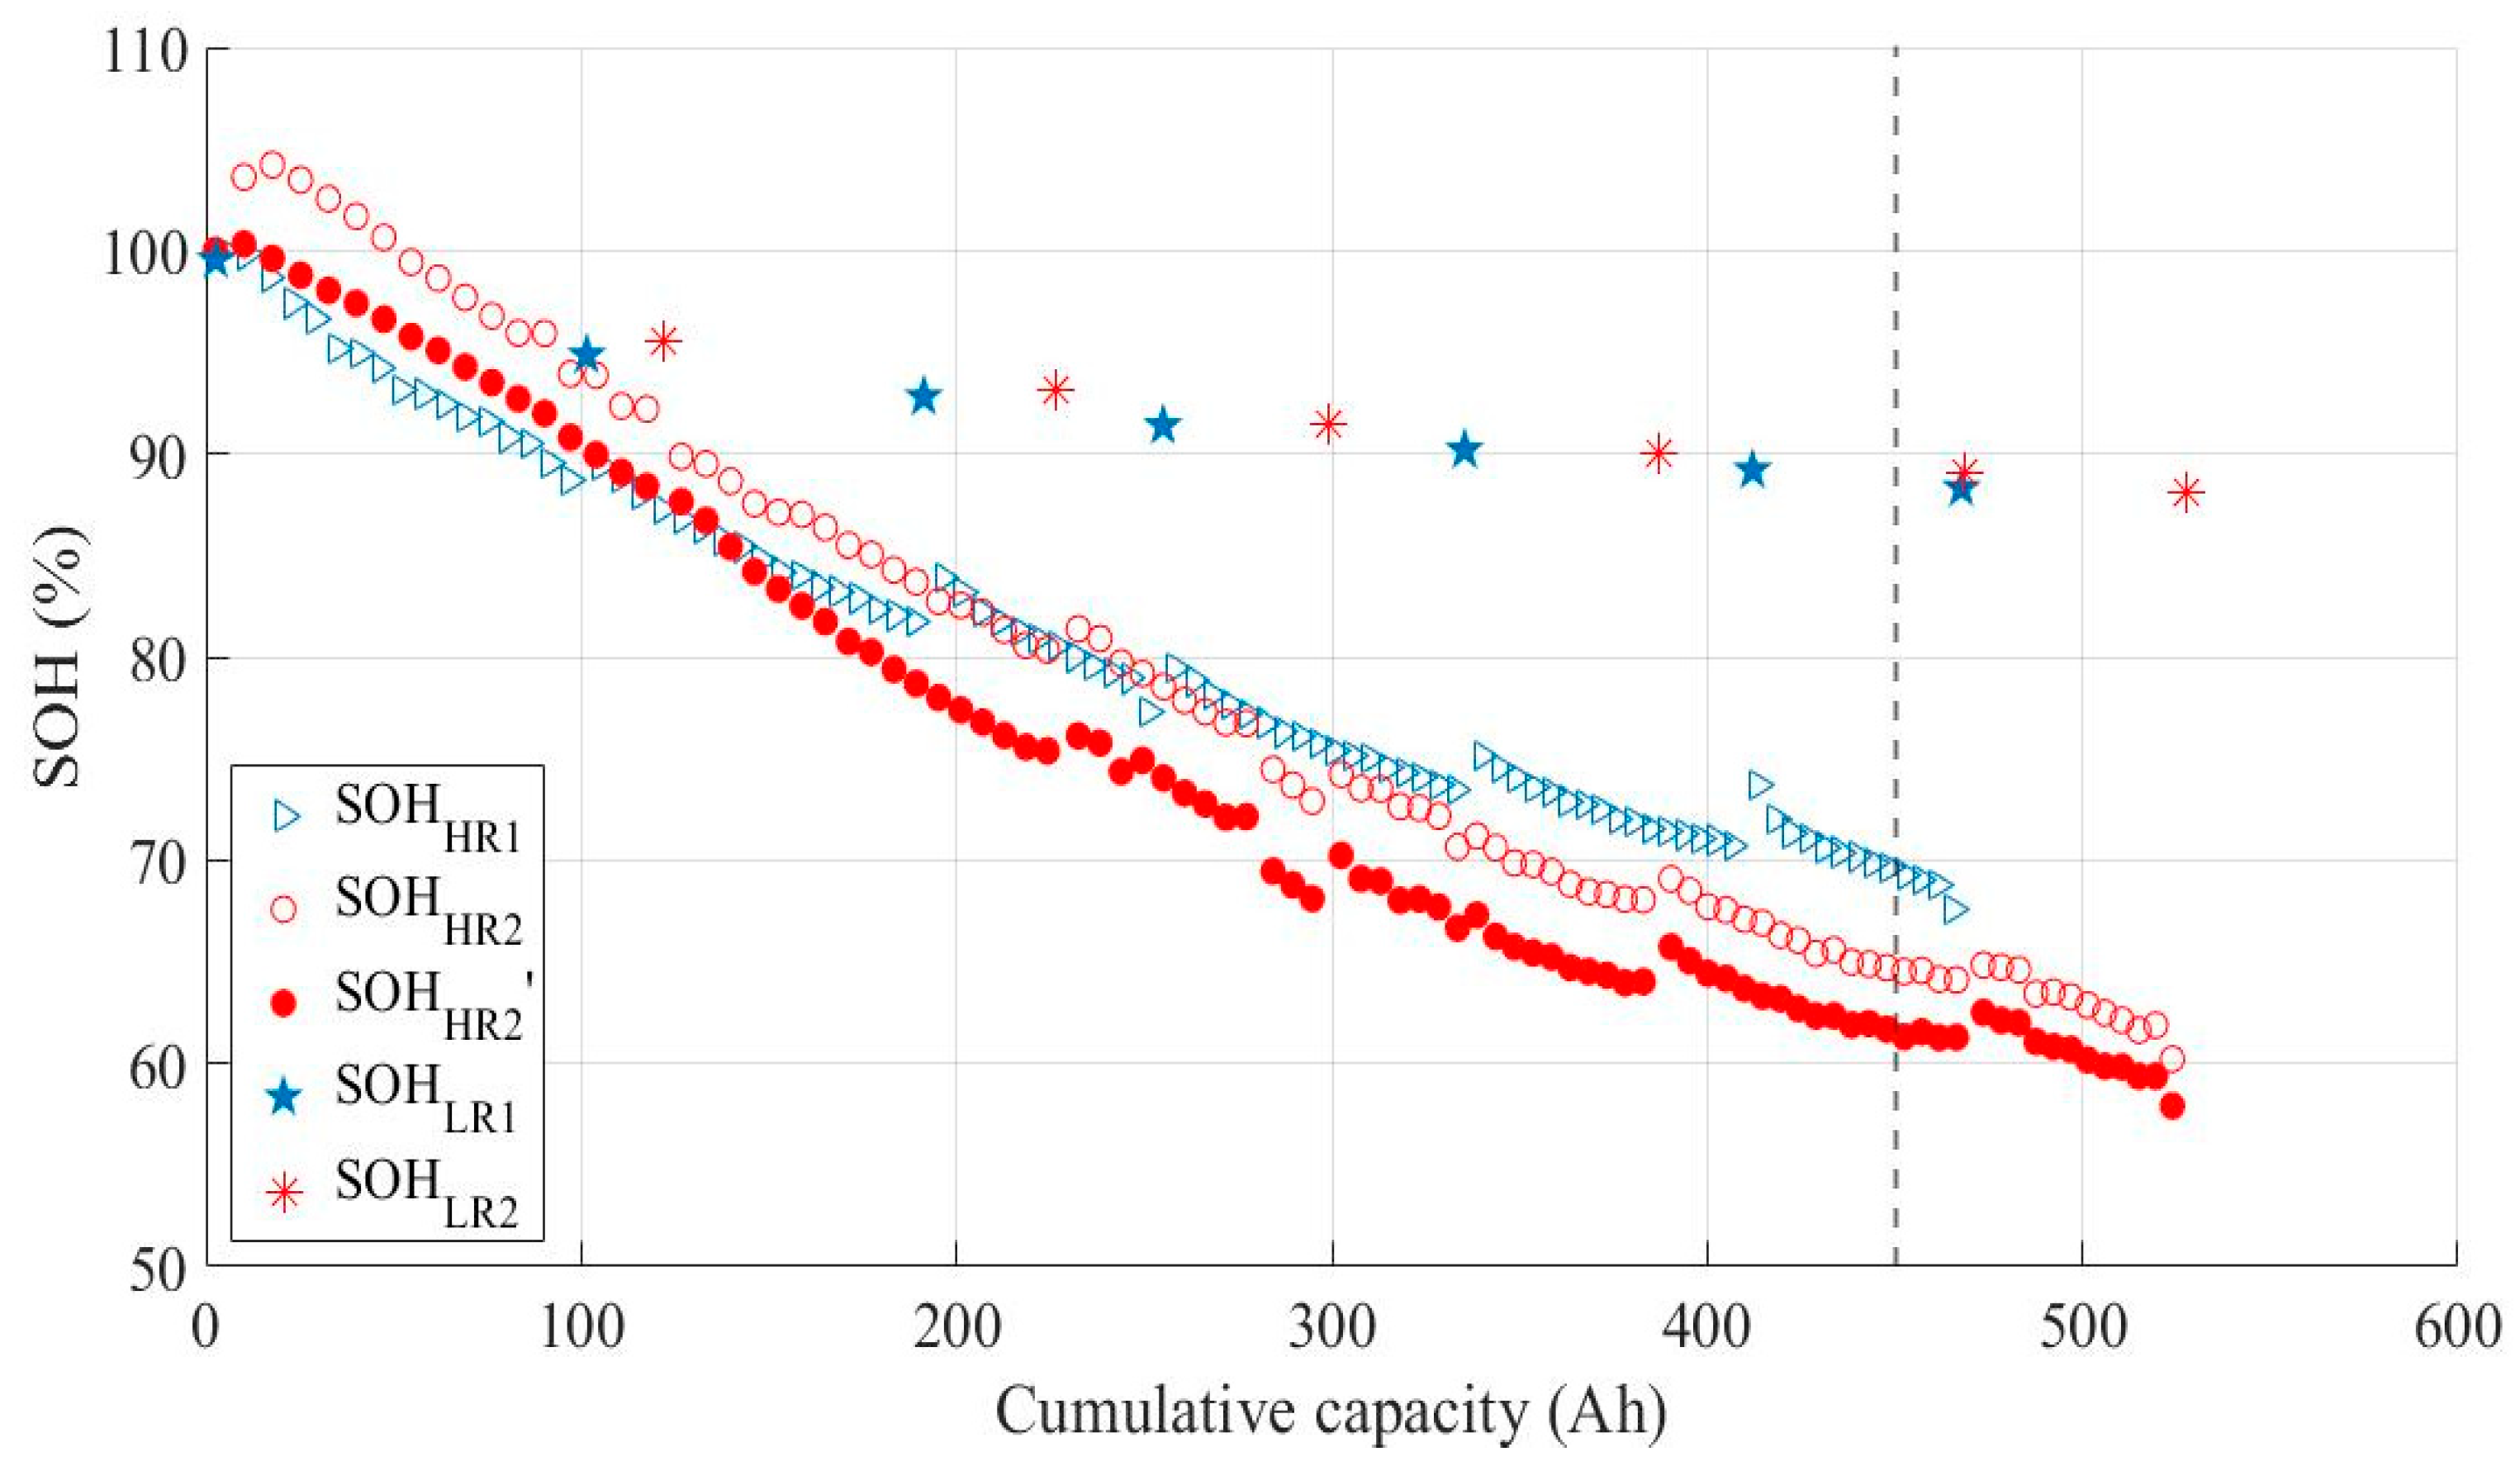
3.3. Impact of Ohmic Drop Compensation on Aging

As we have already pointed out, the study of cell aging is only worth exploring for cells showing a real positive impact from the use of ohmic drop compensation, i.e., LE-type cells. In order to explore the influence of ohmic drop compensation during discharge on cyclability, many consecutive cycles (nearly 300 cycles) with discharge at the highest current recommended by the manufacturer (–10 A, i.e., –3.8C) are performed with and without ohmic drop compensation for two LE cells. Three different capacities are extracted from this aging test:
  • For the LE cell aged without ohmic drop compensation (indexed 1, in blue), the capacity is measured when the voltage reaches Ucut-off = 2.75 V (Q1);
  • For the LE cell aged with ohmic drop compensation (indexed 2, in red), the capacity is measured when the voltage reaches 2.75 V (Q2) or Umin = 2.37 V (Q2′).
Since the capacities for each discharge are different under the two aging conditions, the capacity variations are shown in Figure 7 through two complementary presentations: as a function of cycle number (Figure 7a) and as a function of cumulative capacity in discharge (Figure 7b)
The first important conclusion is that the use of ohmic drop compensation during discharge has a moderate impact on aging. After nearly 300 cycles at maximum discharge current (–10 A for LE cells), a BMS with ohmic drop compensation still provides better performance than a conventional BMS. However, this performance improvement decreases with use: about + 20% of Qn with new cells and about + 5% of Qn with aged cells. The comparison between the capacities delivered at 2.75 V (Q1 and Q2) for the two cells shows that the use of ohmic drop compensation accelerates aging slightly; for example, for a cumulative discharge capacity of 450 Ah, conventional cycling results in a capacity loss of about 30%, whereas cycling with ohmic drop compensation results in a capacity loss of about 35%. It should be pointed out that a lifetime of between 200 and 300 cycles at the maximum discharge current recommended by the manufacturer (–10 A, i.e., –3.8C) is an expected performance, since the manufacturer’s data sheet only guarantees 500 cycles at –1C (with a limit at 70% SOH). In order to be more precise on the impact on aging of this new possible battery management, we also include in the experimental procedure, discharges at the standard rate (–C/2) every 50 cycles. The corresponding cell voltage curves are presented in Figure 8.
The aging of the two cells is very similar with respect to the data at the standard rate (–C/2). Only at high rates (–10 A) is a more pronounced difference in aging observed. In order to clarify this point, the State Of Health (SOH) data during cycling are reported in Figure 9 using two different types of parameters: the first SOH values (stars in Figure 9, called SOHLR) are calculated at the standard rate by comparing the capacity at –C/2 (Low Rate) against the value measured on the fresh cell at the beginning of the aging test; the second SOH values (circles in Figure 10, called SOHHR) are calculated at a high rate by comparing the capacity at –10 A against the value measured on the fresh cell:
SOH HR = Q i   cycle   n Q i   cycle   1
SOH LR = Q C / 2   cycle   n Q C / 2   cycle   0

4. Discussion

Often in the literature, the indicators of aging used are a capacity value at a moderate rate and a so-called internal resistance. A 70 or 80% decrease in capacity and a 50 or 100% increase in resistance are criteria often used to declare end of life. During this aging experiment, we can follow the evolution of a parameter that approximates the compensation factor determined by the current interrupt technique (ΔUI with a time step Δt close to 1 ms, see the experimental section), using the voltage values at the very beginning of each discharge. Figure 10a gives the variations of this resistance throughout the cycling aging for both cells, while Figure 10b shows the variations in the temperature at the end of each discharge.
As expected, since more charge passes through the cell discharged with ohmic drop compensation, the temperature at the end of the discharge is higher. Both parameters, ‘internal’ resistance and temperature, are almost stable during the aging test. It can therefore be emphasized that resistance is not a good indicator of aging under such cycling conditions. The very small reduction in maximum temperature (end of discharge) observed during the aging test for both cells can be linked to the concomitant reduction in capacity and therefore in discharge time. We can also assume that the 5 °C difference in maximum temperature between the two tests is the main cause of the slightly increased aging attributable to the use of ohmic drop compensation.
Using one of the representations used in Section 1 (Qmax/Qn versus rate, Figure 4a), it is interesting to examine how aging changes the pattern. In Figure 11, the values of the capacities (Q2 and Q2′) at the beginning and end of aging by cycling have been added for the cell cycled with ohmic drop compensation. In addition, the capacities at –C/2 (cycle 0 and cycle 250) are also shown. To complete this figure, the black solid and dotted line are taken from Figure 4a for the constant current discharges of LE cells with and without ohmic drop compensation. Finally, in order to facilitate discussion on the impact of aging, lines (dotted and solid) were added (in red) to materialize the approximate appearance of the pattern after aging.
As already illustrated in Figure 9, aging does not have the same impact depending on whether we are looking at low or high-rate characteristics; aging is more important for fast discharge characteristics. On the characteristic curves of the cell presented in Figure 11, this is reflected by a double shift downwards and to the left. Moreover, this shift is accompanied by a rapprochement of the characteristics with and without ohmic drop compensation.

5. Conclusions

A significant benefit of using ohmic drop compensation during the discharge of Li-ion batteries is demonstrated. However, this advantage is limited to certain technologies and is not universal. When this effect is marked, a substantial gain in capacity can be obtained at high rates.
Thus, this modification of the discharge cut-off voltage criterion can significantly extend performance in uses where power peaks are required, such as for a drone flight. When present, this improvement in discharge performance allows for finer adjustments of the level of battery oversizing in the design and may be relevant for uses where the weight of the storage systems is particularly critical.
This improvement is inevitably linked to an increase in thermal losses. The implementation of this technique must therefore be accompanied by the careful management of the system’s thermal dissipation, especially in packs, in order to limit the temperature of the cells and, therefore, their aging. When this is achieved, and temperature during discharge remains within an acceptable range, the use of ohmic drop compensation has been shown to only moderately accelerate aging during cycling. With the impact on aging being moderate, but still not zero, it is recommended that discharge protocols using ohmic drop compensation are implemented for emergencies and removed routinely.

6. Patents

Lefrou C., Decaux C., Thivel, P.-X., Magne-Tang N., Procédés de diagnostic d’une batterie et procédé de contrôle associé, FR3 125 922—A1.

Supplementary Materials

The following supporting information can be downloaded at https://www.mdpi.com/article/10.3390/batteries9090451/s1. Experimental procedure of corrections of the raw data taking into account the aging of the cells induced by the experiments.

Author Contributions

Conceptualization, C.L., C.D., and P.-X.T.; investigation, N.M.-T.; writing—original draft preparation, N.M.-T., C.L., C.D. and P.-X.T.; writing—review and editing, C.L., C.D. and P.-X.T.; supervision, C.L., C.D. and P.-X.T. All authors have read and agreed to the published version of the manuscript.

Funding

This research received no external funding.

Data Availability Statement

Data sharing does not apply to this article. However, if necessary, any additional information can be given on request from the corresponding author.

Conflicts of Interest

The authors declare no conflict of interest.

Appendix A

The following Figure A1 shows the discharge curves for the four types of cells after aging correction. Since nominal capacities are different, the maximum current (–20 A) does not correspond to the same rate for the four types of cells (LE—7.7C, SE—6C, LP—10C, and SP—7.7C).
Figure A1. Cell voltage variations at different rates (see caption) of LE (a), LP (c), SE (b), and SP (d) cells as a function of the discharged capacity, starting from a fully charged battery, with different Umin values calculated with the ohmic drop compensation factor (ALE = 36.9 mΩ; ALP = 18.2 mΩ; ASE = 35.7 mΩ; ASP = 16.1 mΩ). QnLE = 2.6 Ah; QnLP = 2.6 Ah; QnSE = 3.35 Ah; QnSE = 2.0 Ah. Climatic chamber temperature: 25 °C.
Batteries 09 00451 g0a1

References

  1. Luo, X.; Wang, J.; Dooner, M.; Clarke, J. Overview of current development in electrical energy storage technologies and the application potential in power system operation. Appl. Energy 2015, 137, 511–536. [Google Scholar] [CrossRef]
  2. Yoshio, M.; Brodd, R.J.; Kozawa, A. Lithium-Ion Batteries; Springer: Berlin/Heidelberg, Germany, 2009. [Google Scholar]
  3. Olabi, A.G.; Abbas, Q.; Shinde, P.A.; Abdelkareem, M.A. Rechargeable batteries: Technological advancement; challenge, current and emerging applications. Energy 2023, 266, 126408. [Google Scholar] [CrossRef]
  4. Lu, L.; Han, X.; Li, J.; Hua, J.; Ouyang, M. A review on the key issues for lithium-ion battery management in electric vehicles. J. Power Sources 2013, 226, 272–288. [Google Scholar] [CrossRef]
  5. Schmidt, O.; Hawkes, A.; Gambhir, A.; Staffell, I. The future cost of electrical energy storage based on experience rates. Nat. Energy 2017, 2, 17110. [Google Scholar] [CrossRef]
  6. Thackeray, M.; Wolverton, C.; Isaacs, E.D. Electrical energy storage for transportation—Approaching the limits of, and going beyond, lithium-ion batteries. Energy Environ. Sci. 2012, 5, 7854–7863. [Google Scholar] [CrossRef]
  7. Saldaña, G.; Martín, J.I.S.; Zamora, I.; Asensio, F.J.; Oñederra, O. Analysis of the current electric battery models for electric vehicle simulation. Energies 2019, 12, 2750. [Google Scholar] [CrossRef]
  8. Peters, J.F.; Baumann, M.; Zimmermann, B.; Braun, J.; Weil, M. The environmental impact of Li-Ion batteries and the role of key parameters—A review. Renew. Sustain. Energy Rev. 2017, 67, 491–506. [Google Scholar] [CrossRef]
  9. Catenaro, E.; Rizzo, D.M.; Onori, S. Experimental analysis and analytical modeling of Enhanced-Ragone plot. Appl. Energy 2021, 291, 116473. [Google Scholar] [CrossRef]
  10. Catenaro, E.; Rizzo, D.M.; Onori, S. Framework for energy storage selection to design the next generation of electrified military vehicles. Energy 2021, 231, 120695. [Google Scholar] [CrossRef]
  11. Ragone, D. Review of Battery Systems for Electrically Powered Vehicles. SAE Tech. Pap. 1968, 680453. [Google Scholar] [CrossRef]
  12. Gao, J.; Shi, S.-Q.; Li, H. Brief overview of electrochemical potential in lithium ion batteries. Chin. Phys. B 2016, 25, 018210. [Google Scholar] [CrossRef]
  13. Lefrou, C.; Fabry, P.; Poignet, J.-C. Electrochemistry: The Basics, With Examples; Springer: Berlin/Heidelberg, Germany, 2012; pp. 208–209. [Google Scholar]
  14. Rao, L.; Newman, J. Heat-generation rate and general energy balance for insertion battery systems. J. Electrochem. Soc. 1997, 144, 2697–2704. [Google Scholar] [CrossRef]
  15. Lin, X.; Perez, H.E.; Mohan, S.; Siegel, J.B.; Stefanopoulou, A.G.; Ding, Y.; Castanier, M.P. A lumped-parameter electro-thermal model for cylindrical batteries. J. Power Sources 2014, 257, 1–11. [Google Scholar] [CrossRef]
  16. BioLogic. Ohmic Drop Part I: Effect on Measurements (Ohmic Drop Effect on Measurements). 2021. Available online: https://www.biologic.net/documents/ohmic-drop-effect-on-measurements-electrochemistry-battery-corrosion-application (accessed on 7 July 2021).
  17. BioLogic. Ohmic Drop Part II: Intro. To Ohmic Drop Measurement Techniques (Ohmic Drop Measurement). 2021. Available online: https://www.biologic.net/documents/ohmic-drop-measurement-techniques-electrochemistry-battery-application-note-28/ (accessed on 7 July 2021).
  18. Bard, A.J.; Faulkner, L.R. Electrochemical Methods: Fundamentals and Applications; Wiley: Hoboken, NJ, USA, 2022. [Google Scholar]
  19. Huang, T.-C.; Peng, R.-H.; Tsai, T.-W.; Chen, K.-H.; Wey, C.-L. Fast charging and high efficiency switching-based charger with continuous built-in resistance detection and automatic energy deliver control for portable electronics. IEEE J. Solid-State Circuits 2014, 49, 1580–1594. [Google Scholar] [CrossRef]
  20. Lin, C.-H.; Chen, C.-L.; Lee, Y.-H.; Wang, S.-J.; Hsieh, C.-Y.; Huang, H.-W.; Chen, K.-H. Fast Charging Technique for Li-Ion Battery Charger. In Proceedings of the 15th IEEE International Conference on Electronics, Circuits and Systems (2008), Saint Julian’s, Malta, 31 August–3 September 2008; IEEE: Piscataway, NJ, USA, 2008; pp. 618–621. [Google Scholar] [CrossRef]
  21. Lin, C.-H.; Hsieh, C.-Y.; Chen, K.-H. A li-ion battery charger with smooth control circuit and built-in resistance compensator for achieving stable and fast charging. IEEE Trans. Circuits Syst. I Regul. Pap. 2009, 57, 506–517. [Google Scholar] [CrossRef]
  22. Noh, M.H.; Thivel, P.-X.; Lefrou, C.; Bultel, Y. Fast-charging of lithium iron phosphate battery with ohmic-drop compensation method. J. Energy Storage 2016, 8, 160–167. [Google Scholar] [CrossRef]
  23. Peng, R.-H.; Tsai, T.-W.; Chen, K.-H.; Tai, Z.H.; Cheng, Y.H.; Tsai, C.C.; Luo, H.-Y.; Wang, S.-M.; Chen, L.-D.; Yang, C.-C.; et al. Switching-Based Charger with Continuously Built-in Resistor Detector and Analog Multiplication Division Unit for Fast Charging in Li-Ion Battery. In Proceedings of the ESSCIRC (ESSCIRC) (2013), Bucharest, Romania, 16–20 September 2013; IEEE: Piscataway, NJ, USA, 2013; pp. 157–160. [Google Scholar] [CrossRef]
  24. Saint-Pierre, R. A Dynamic Voltage-Compensation Technique for Reducing Charge Time in Lithium-Ion Batteries. In Proceedings of the Fifteenth Annual Battery Conference on Applications and Advances (Cat. No. 00TH8490) (2000), Long Beach, CA, USA, 11–14 January 2000; IEEE: Piscataway, NJ, USA, 2000; pp. 179–184. [Google Scholar] [CrossRef]
  25. Fleury, X.; Noh, M.H.; Genies, S.; Thivel, P.-X.; Lefrou, C.; Bultel, Y. Fast-charging of lithium iron phosphate battery with ohmic drop compensation method: Ageing study. J. Energy Storage 2018, 16, 21–36. [Google Scholar] [CrossRef]
  26. Lain, M.J.; Brandon, J.; Kendrick, E. Design Strategies for High Power vs. High Energy Lithium Ion Cells. Batteries 2019, 5, 64. [Google Scholar] [CrossRef]
  27. Chang, C.-K. Factors Affecting Capacity Design of Lithium-Ion Stationary Batteries. Batteries 2019, 5, 58. [Google Scholar] [CrossRef]
Figure 1. Experimental arrangement of cells (a) schematic representation, (b) picture of the experimental setup.
Batteries 09 00451 g001
Figure 2. Cell voltage and temperature variations of one LE cell as a function of the discharged capacity, during discharges at different rates: –0.05C to –7.7C (see caption) starting from a fully charged battery: (a) Voltage, (b) Temperature. Qn = 2.6 Ah. Climatic chamber temperature: 25 °C. The different Umin values are calculated with an ohmic drop compensation factor A = 36.9 mΩ.
Batteries 09 00451 g002
Figure 3. Cell voltage variations of three LE cells (dashed line/dot-dashed line/pointed line) as a function of the discharged capacity, starting from a fully charged battery, with ohmic drop compensation at three different rates: –C/2 in blue, –2C in red, –4C in purple. Qn = 2.6 Ah. Climatic chamber temperature: 25 °C.
Batteries 09 00451 g003
Figure 4. Constant current discharges characteristics of 4 types of cells without (empty symbols) or with (full symbols) ohmic drop compensation: (a) Mean values of battery available capacities Qmax as a function of current level, (b) Ragone plot: mean values of specific energy as a function of mean power density values. LE cells: blue; SE cells: yellow; LP cells: purple; SP cells: green. Climatic chamber temperature: 25 °C.
Batteries 09 00451 g004
Figure 5. Current profile of drone flight simulation: take-off (–5C for 2 min), stationary flight (–1.5C for variable time), and landing (–4C for 2 min).
Batteries 09 00451 g005
Figure 6. LE cell voltage variations during drone-type discharges with different hover times: 10 min; 15 min; 20 min; 25 min. Ohmic drop compensation factor A = 36.9 mΩ. Climatic chamber temperature: 25 °C.
Batteries 09 00451 g006
Figure 7. Discharge capacity evolution versus the cumulative discharge capacity for two aged LE cells at –10 A: (a) versus the cycle number, (b) versus the cumulative discharge capacity. Aging without (blue) or with (red) ohmic drop compensation. Q1 at 2.75 V; Q2 at 2.75 V; Q2’ at 2.37 V. Qn = 2.6 Ah. Climatic chamber temperature: 25°C.
Batteries 09 00451 g007
Figure 8. Cell voltage variations at –C/2 of two aged LE cells as a function of the discharged capacity. Aging without (solid line) or with (dotted line) ohmic drop compensation. Qn = 2.6 Ah. Climatic chamber temperature: 25 °C.
Batteries 09 00451 g008
Figure 9. SOH evolution during aging of two aged LE cells as a function of the cumulative discharge capacity during aging. SOHHR1 at 2.75 V; SOHHR2 at 2.75 V; SOHHR2’ at 2.37 V. SOHLR1; SOHLR2. Climatic chamber temperature: 25 °C.
Batteries 09 00451 g009
Figure 10. (a) Resistance (cell 1 ; cell 2 ) and (b) temperature (T1 at 2.75 V ; T2 at 2.75 V ; T2’ at 2.37 V ) evolution of both aged LE cells as a function of the cumulative capacity during aging. Climatic chamber temperature: 25 °C.
Batteries 09 00451 g010
Figure 11. Effects of aging on LE cells operating at high rate with ohmic drop compensation. available capacity at –C/2; available capacity at –10 A with Ucut-off = 2.75 V; available capacity at –10 A with Ucut-off = 2.37 V for fresh and aged cell. The lines are trend curves for discharge characteristics at constant current (Qmax, as a function of current level). Black: fresh cells; Red: aged cells; Continuous line: with ohmic drop compensation; Dotted line: without ohmic drop compensation. Qn = 2.6 Ah. Climatic chamber temperature: 25 °C.
Batteries 09 00451 g011
Table 1. Main cell characteristics at 25 °C provided by the manufacturers.
ManufacturerSamsungLG
Commercial name20S36GH26M26
Internal code 1SPSELPLE
Nominal voltage (V)3.63.63.73.65
Nominal capacity, Qn (Ah)2.03.352.62.6
Maximal discharge current (A)3082510
1 Internal code: SP: Samsung Power cell; SE: Samsung Energy cell; LP: LG Power cell; LE: LG Energy cell.
Table 2. Capacity and A factor used in ohmic drop compensation for the cells studied (3 cells of each type).
Internal CodeAvailable Capacity at –C/2 (Ah)Compensation Factor A
(mΩ)
LE2.65/2.64/2.6836.9/36.2/34.9
SE3.14/3.13/3.1535.7/34.5/35.5
LP2.49/2.50/2.4918.2/17.4/18.1
SP1.99/2.01/2.0016.1/15.8/15.7
Table 3. Drone flight performance comparison.
Hover Time
(min)
Capacity Needed for
a Complete Flight
Ah)
Capacity Allowed with Conventional BMS
(Ah)
Capacity Allowed with BMS Using Ohmic Drop Compensation (Ah)
151.431.431.43
151.761.611.76
202.081.812.08
252.412.082.32
Disclaimer/Publisher’s Note: The statements, opinions and data contained in all publications are solely those of the individual author(s) and contributor(s) and not of MDPI and/or the editor(s). MDPI and/or the editor(s) disclaim responsibility for any injury to people or property resulting from any ideas, methods, instructions or products referred to in the content.

