Article

Battery Impedance Spectroscopy Embedded Measurement System

by
Gabriele Cicioni
1,†,
Alessio De Angelis
1,†,
Fernando M. Janeiro
2,†,
Pedro M. Ramos
3,*,† and
Paolo Carbone
1,†
1
Department of Engineering, University of Perugia, 06125 Perugia, Italy
2
Instituto de Telecomunicações, Universidade de Évora, 7000-671 Évora, Portugal
3
Instituto de Telecomunicações, Instituto Superior Técnico, Universidade de Lisboa, 1049-001 Lisboa, Portugal
*
Author to whom correspondence should be addressed.
These authors contributed equally to this work.
Batteries 2023, 9(12), 577; https://doi.org/10.3390/batteries9120577
Submission received: 31 October 2023 / Revised: 17 November 2023 / Accepted: 24 November 2023 / Published: 28 November 2023
(This article belongs to the Section Battery Modelling, Simulation, Management and Application)

Abstract

:
The evolution of rechargeable battery characteristics have led to their use in almost every device in our everyday life. This importance has also increased the relevance of estimating the remaining battery charge (state of charge, SOC) and their health (state of health, SOH). One of the methods for the estimation of these parameters is based on the impedance spectroscopy obtained from the battery output impedance measured at multiple frequencies. This paper proposes an embedded measurement system capable of measuring the battery output impedance while in operation (either charging or supplying power to the intended device). The developed system generates a small amplitude stimulus that is added to the battery current. The system then measures the battery voltage and current to estimate the impedance at the stimulus frequencies. Three batteries were measured at different SOC levels, demonstrating the system principle of operation. Complementarily, a battery impedance equivalent circuit was used, together with genetic algorithms, to estimate the circuit parameters and assess their dependence on the battery SOC.

1. Introduction

The importance of rechargeable batteries in the current way of life cannot be understated. From mobile phones, to tablets, wireless phones, laptops, power tools, small appliances and electrical vehicles, all have unquestionably benefited from the development of batteries [1], namely their evolution in terms of capacity, capacity-to-weight ratio, and longevity (number of charge cycles). Additionally, in the inevitable transition to greener energy sources worldwide, batteries are one of the solutions to deal with the intermittent cycles of solar and wind power generation [2,3].
As most of the world population keeps track of the remaining battery capacity in their personal portable devices, the importance of obtaining reliable estimations of the battery state of charge (SOC) has increased and is now an important aspect of Battery Management Systems (BMSs). In complement, the deterioration of the batteries due to the repeated one-day cycles within mobile devices is also becoming a relevant battery feature, which is commonly described by the state of health (SOH) [4].
In particular, for portable devices with limited energy capacity, the measurement system that must estimate these two parameters (SOC and SOH) is a crucial subsystem in terms of reliability/accuracy, with a large number of potential systems for implementation.
Regarding electrical vehicles (EVs), the market is exhibiting exceptional growth, with 10 million vehicles sold in 2022 (14% of all new cars) [5]. For 2023, the early prediction was for 14 million units, representing nearly 40% growth. Specifically for the battery market in 2022, it increased 65% to reach 530 GWh, while battery demand is expected to reach 3 TWh by 2030, which will result in a rapid increase in battery manufacturing capacity for the near future.
Lithium-ion batteries are also being increasingly used as short-term energy storage within smart grids and microgrids, as detailed in [6,7], to address the intermittency of renewable energy sources and to support the implementation of off-grid systems.
The most common SOC and SOH method is the Coulomb counting method [4] that continuously measures the capacity charged into the battery (during the charging cycles) and discharged into the system powered by the battery (during the normal battery power system operation). Alternative methods include, for example, (i) the voltage method [8], which can use a look-up table, relating the SOC with the open-circuit voltage (OCV), and the battery temperature; (ii) Kalman filter-based methods [9,10,11], which are based on an accurate battery model and online estimation of the parameters of such a model; and (iii) SOC estimation using curve fitting on the battery voltage relaxation time [12].
The complex electrochemical process within rechargeable batteries means that simple measurements of the battery voltage, current and temperature are insufficient to estimate the critical battery parameters that influence its performance. It is in this context that impedance spectroscopy measurements can offer a more detailed insight and are being developed to use in BMSs [13,14]. By measuring the battery output impedance at multiple frequencies, impedance spectroscopy can describe the inner electrochemical workings of the battery to enable estimation of the battery SOC and SOH [14,15,16].
In this paper, an embedded measurement system for battery impedance measurements is designed, implemented, characterized, and used in the measurement of three different batteries. The proposed system is based on an 32-bit Arm Cortex-M4 microcontroller operating at 100 MHz. The system is capable of generating a multiharmonic stimulus that is added to the battery current, using an improved Howland current pump. The measurement of the battery current and its voltage enables the estimation of the battery output impedance at the frequencies of the stimulus signal with the acquisition of only one segment of equally spaced samples. The developed analog front-end includes multiple microcontroller-driven DC compensation steps to ensure that the ADC, included within the microcontroller, can use its full range to acquire the AC signals from the battery voltage and current. A preliminary analysis of the measured impedance profiles acquired at different SOC levels with parametric estimation of the equivalent circuit component values is performed.
This paper is divided into six sections, including the introduction and a final section with the discussion, conclusions and future work. Section 2 describes the embedded measurement system based on a low-cost STM 32 development kit, along with the signal conditioning hardware for signal generation and impedance measurements. Section 3 presents details of the PWM-based signal generation and the system calibration using reference impedances. In Section 4, the measurement results of three different batteries, for the full range of their SOC, are presented. Finally, Section 5 presents the results of the fitting of the measured impedance response to a commonly used battery equivalent circuit. The evolution of the individual circuit parameters is also presented as a function of the SOC.

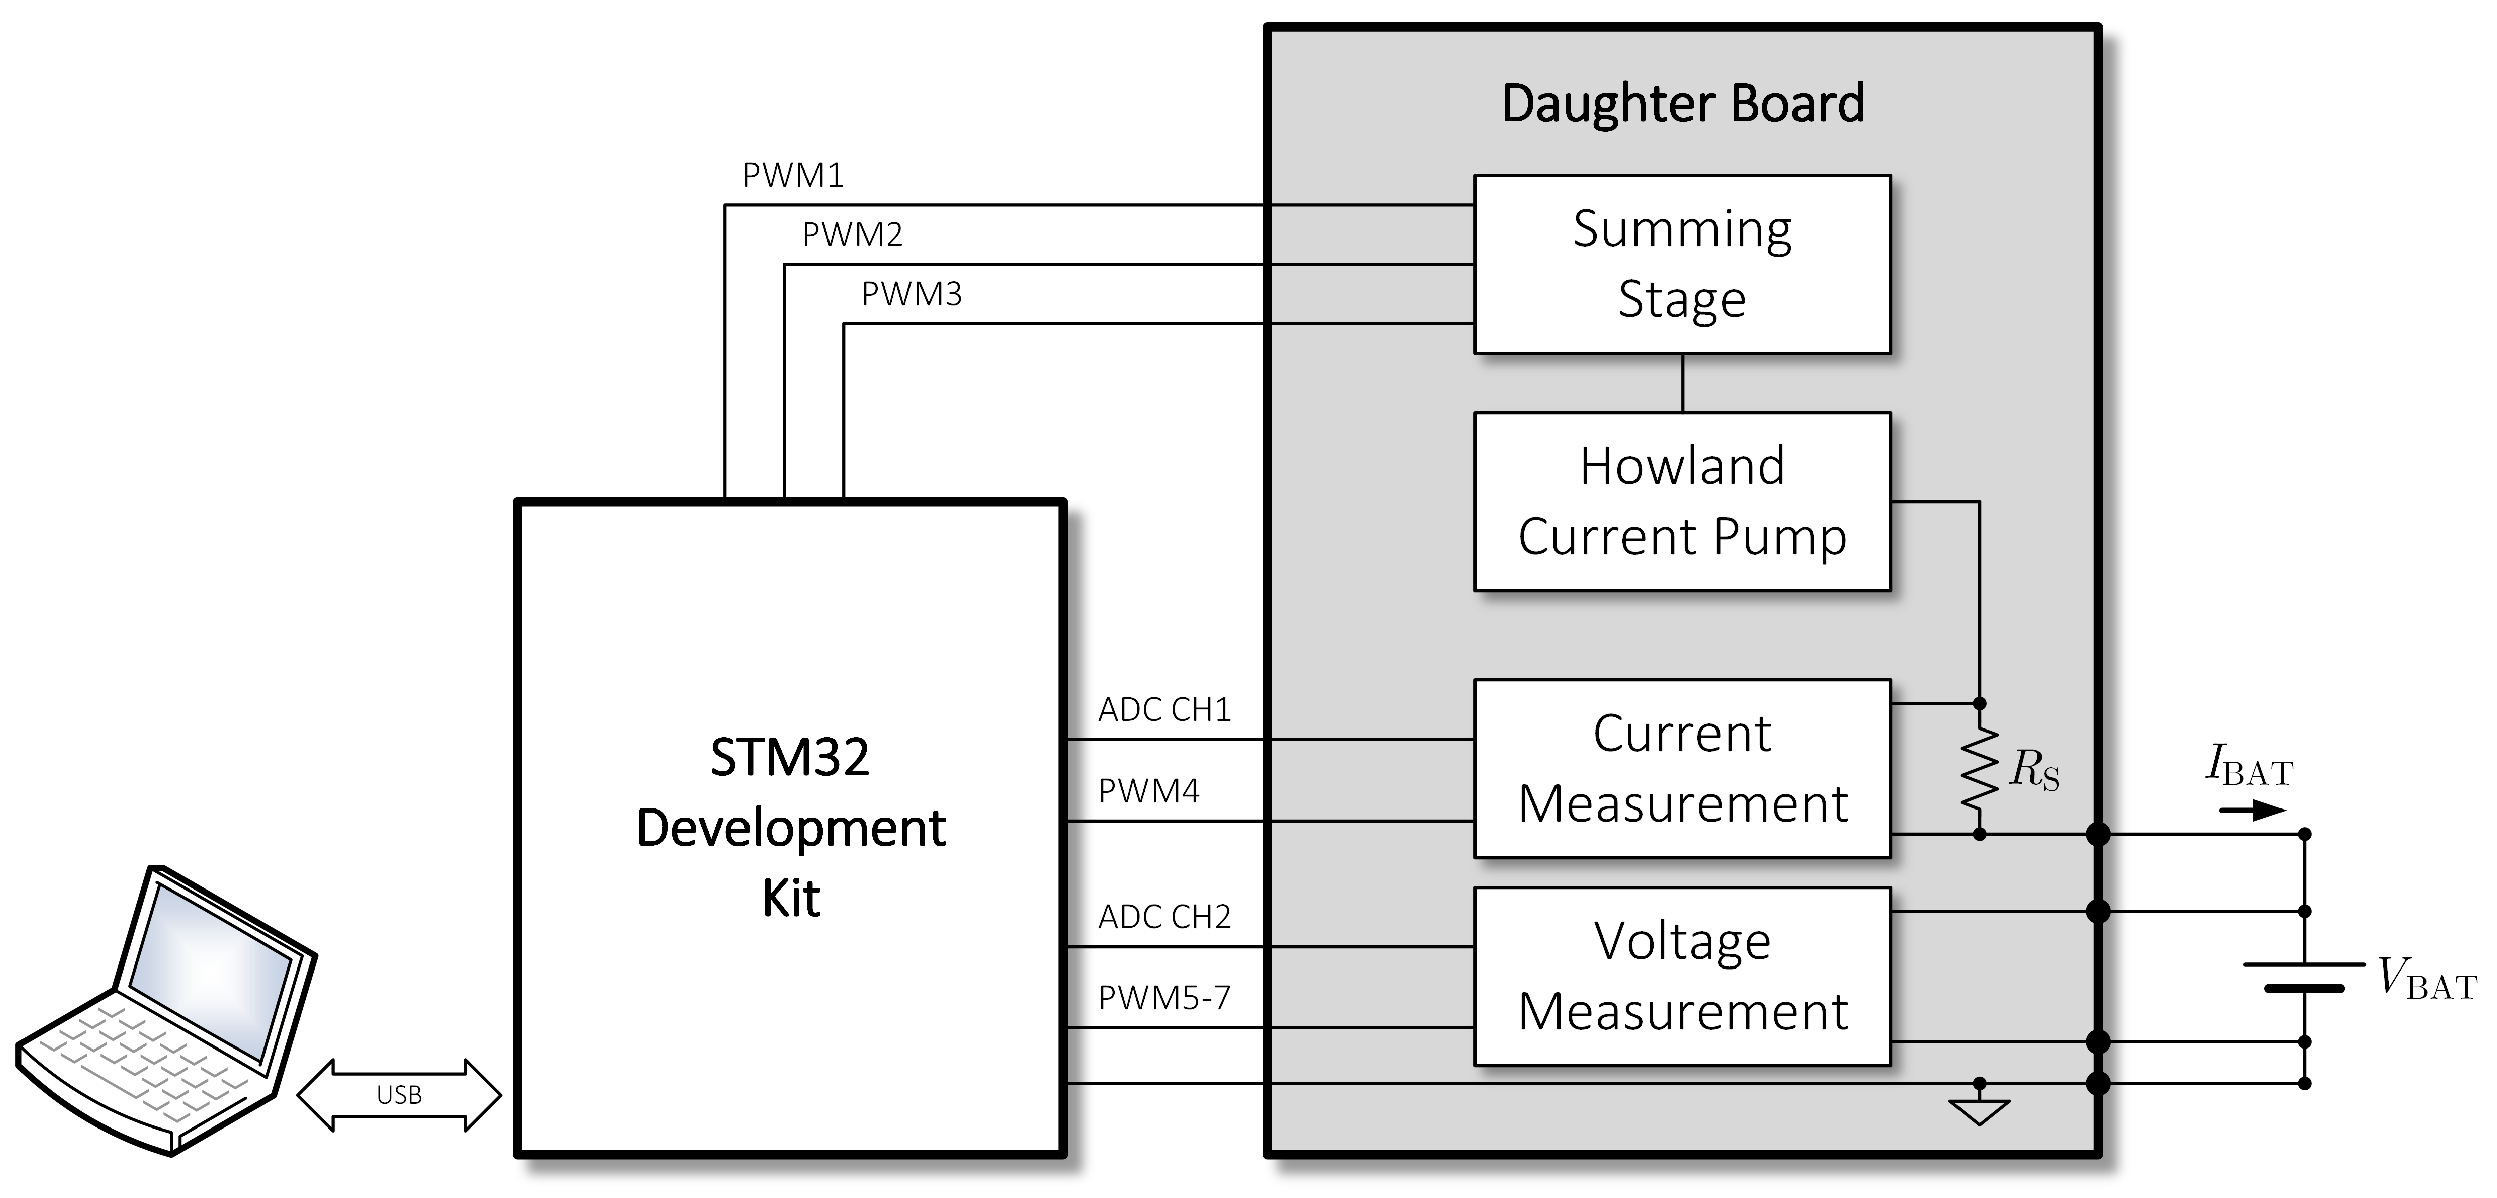
2. Embedded Measurement System

The developed embedded measurement system is based on a STM32F411VE-Discovery Development Board [17] with the addition of a daughter board specifically developed and designed with an analog front-end for battery impedance measurements. This daughter board also includes a power management system to supply the analog circuits from the 5 V available from the USB (Universal Serial Bus)-powered Discovery Board. This section presents the details of the complete measurement system with emphasis on the four developed analog blocks that implement the signal generation and measurement procedure. Figure 1 shows the block diagram of the measurement system. The daughter board includes the summing circuit, the Howland current pump and the voltage and current measurement circuits. The power management module that generates the bipolar ± 15 V DC power supply voltages ( V CC = 15 V ) for the analog circuits from the development kit 5 V uses an Analog Devices ADP5070 DC-to-DC Switching Regulator [18]. The USB computer connection is used for configuration of the measurement procedure and to retrieve the final measurement results.
To speed up the measurement process, a multiharmonic stimulus signal is used so that only one segment acquisition of the battery current and voltage is required. To generate the multihamornic stimulus, two PWM (pulse width modulation) signals are used that cover the complementary frequency ranges, which are added in the analog domain in the summing stage. An improved Howland current pump [19] is used to convert the multiharmonic voltage into a multiharmonic current that is added to the battery current. The battery voltage is measured in the voltage measurement circuit, while the battery current that flows through the reference resistor R S is measured in the current measurement circuit. The following subsections are focused on these major system building blocks, describing their objectives and how their functionality is achieved.

2.1. STM32 Development Kit
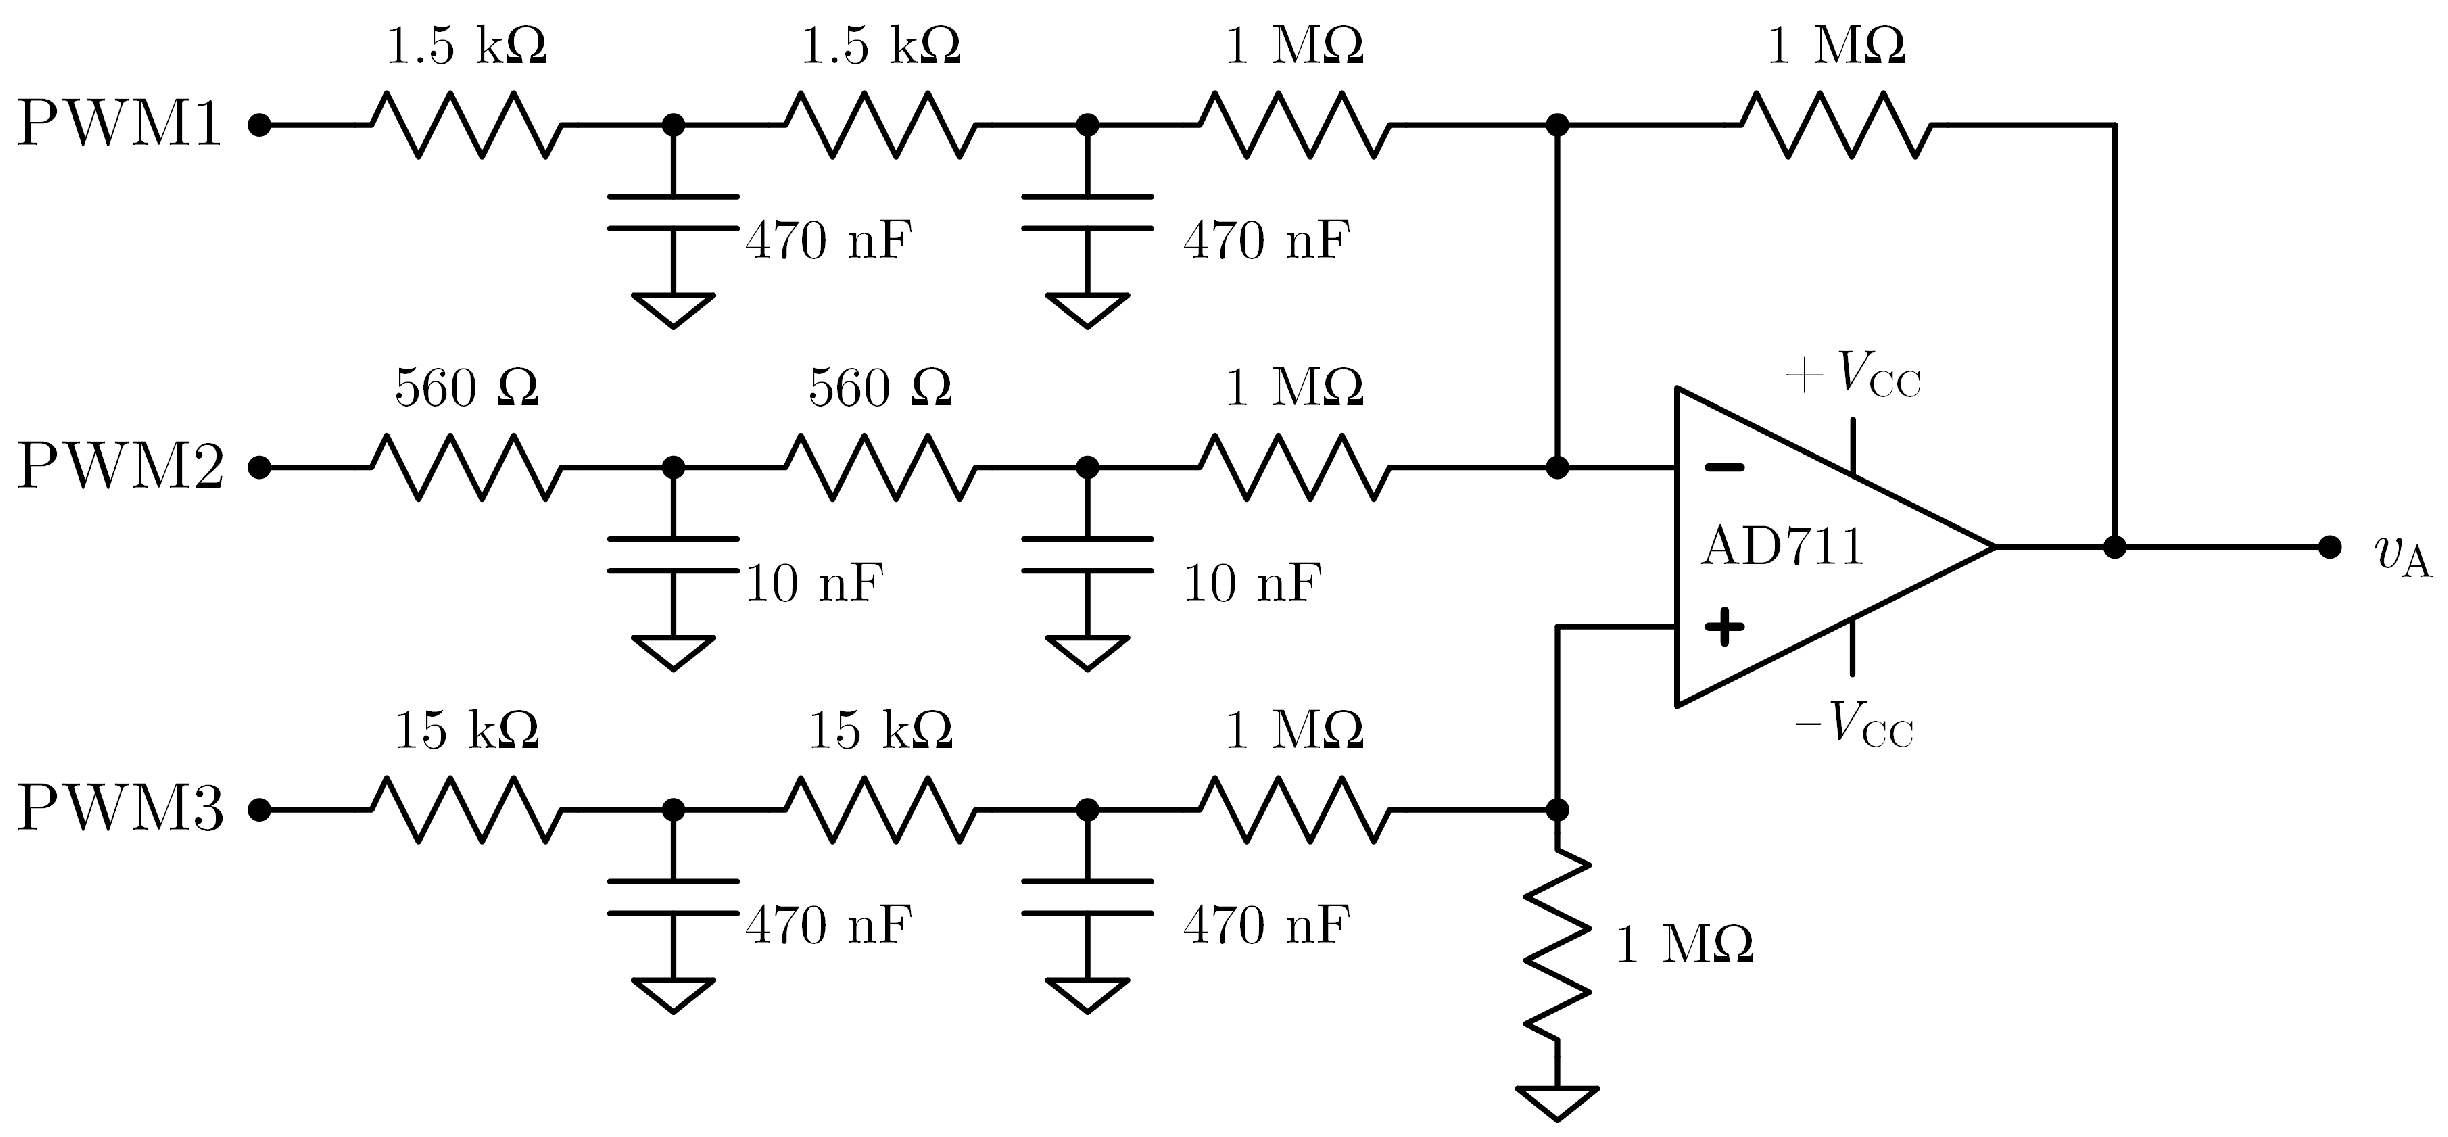
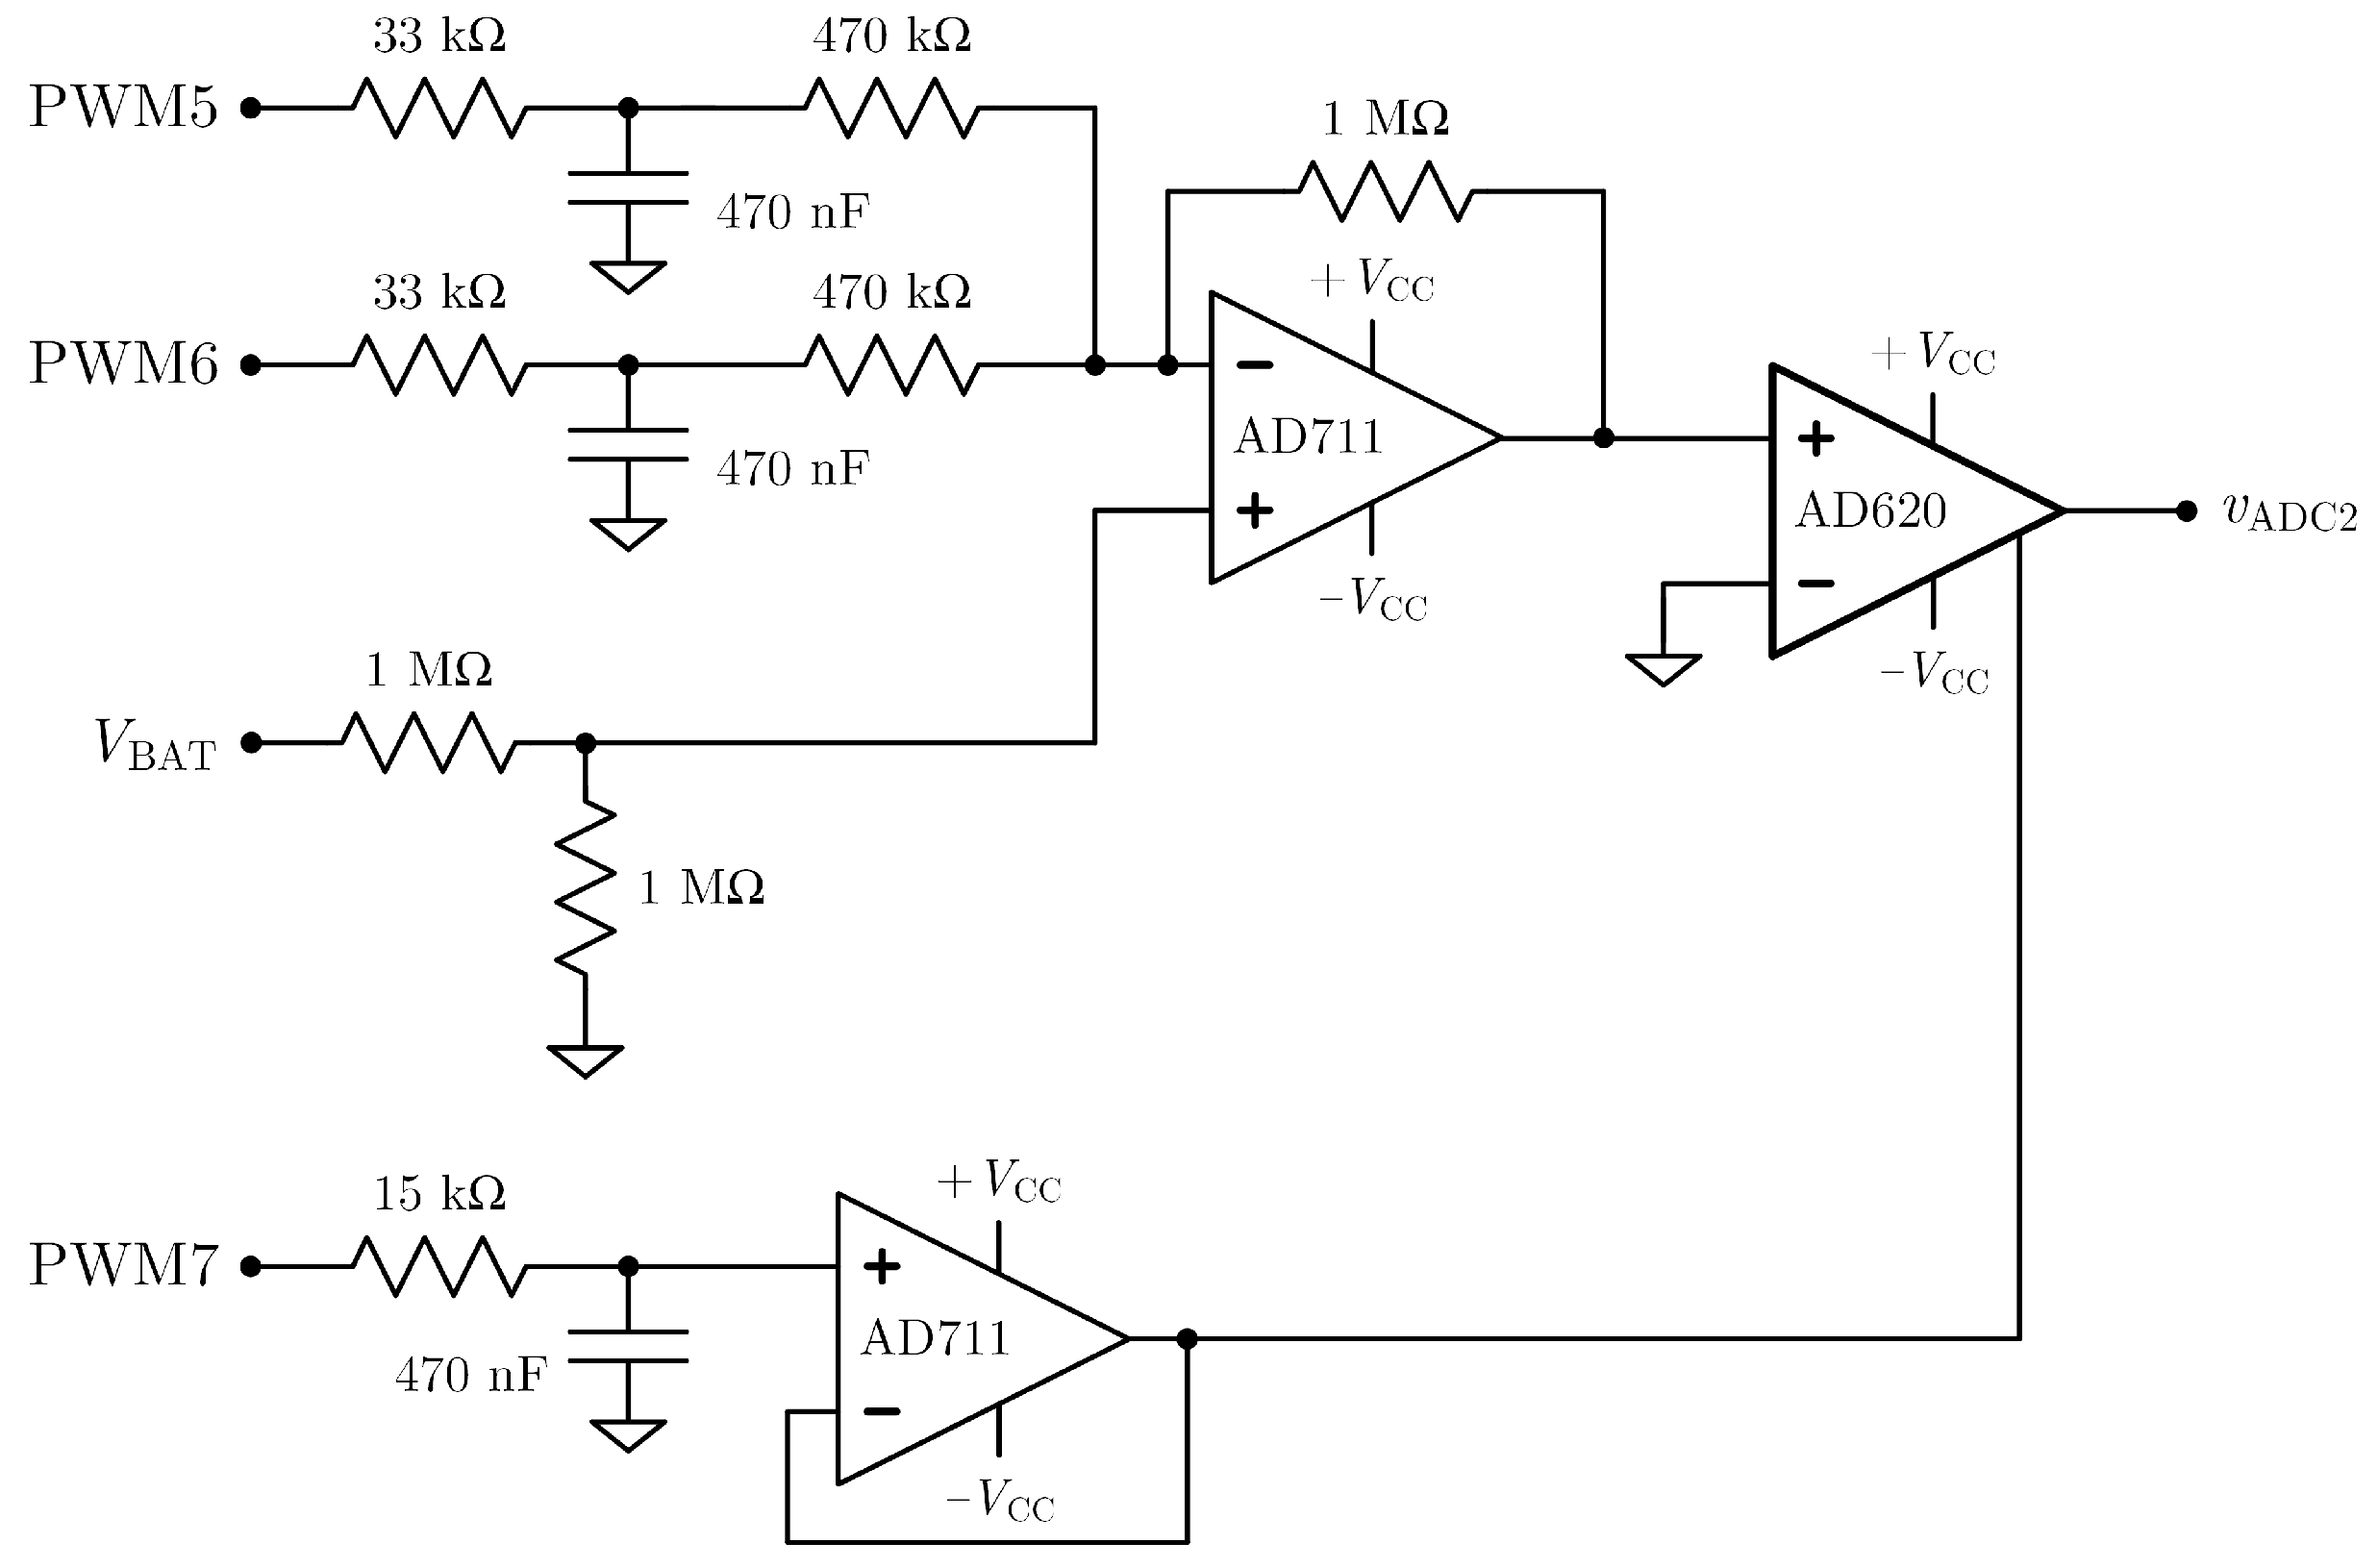
The STM32F411VE 32-bit Arm Cortex-M4 microcontroller has 512 Kbytes of Flash memory, 128 Kbytes of RAM and operates at 100 MHz. It includes eight independent programmable timers with four channels each. Each timer is driven by the main programmable board clock signal and has a 16-bit prescaler register for the clock and a 16-bit or 32-bit auto-reload counter register, common for all the channels. Every channel has one capture/compare register of 16 or 32 bits. Timers can be used for a variety of purposes, including generating output waveforms with PWM, which is used to generate the multiharmonic voltage and DC compensation voltages.
The microcontroller has one multi-channel 12-bit, 0–3 V range, 2.4 MSPS analog-to-digital converter (ADC) which is used to acquire the voltage corresponding to the battery voltage and the battery current after it is converted to a voltage using R S and the current measurement circuit.

2.2. Summing Stage

Instead of using a dedicated direct-digital synthesizer (DDS), the option was to use the existing PWM generating capabilities of the processor to generate the multihamonic stimulus voltage. This multiharmonic voltage should include frequency tones that cover, as much as possible, the relevant frequency range of the battery impedance. The PWM signal is analog low-pass filtered to obtain the multiharmonic signal. For multiharmonic signal generation, a look-up-table with the time-domain discrete sequence amplitudes of one signal period must be stored in the memory of the processor. However, the wide range of frequencies would require a very large look-up table that would be unsuitable for implementation in the processor memory. By splitting the desired multiharmonic signal into two with complementary frequency ranges, the resulting two look-up tables are much smaller and thus implementable in the processor RAM. The first signal, generated in PWM1 covers the 0.5–45 Hz range with components at the frequencies 0.5, 1, 1.5, 2, 3, 4, 5, 6, 7, 8, 10, 12, 15, 20, 25, 30, 35, 40 and 45 Hz. The second signal covers the 50 Hz–5 kHz frequency range with tones at 50, 100, 150, 200, 300, 400, 500, 600, 700, 800, 1000, 1200, 1500, 2000, 2500, 3000, 3500, 4000, 4500 and 5000 Hz. To combine these two signals, an analog summing stage, whose circuit is shown in Figure 2, is implemented in the daughter board. The two PWM multiharmonic signals (PWM1 and PWM2) are low-pass filtered using second-order RC filters with the 3 dB cutoff frequency set to 84 Hz for PWM1 and 10.6 kHz for PWM2. The OPAMP is an Analog Devices AD711 with a 16 V/μs slew rate and 3 MHz unity gain bandwidth.
Since the PWM1 and PWM2 signals have DC components, these DC components are still present after the filters. To remove the combined DC component, PWM3 is low-pass filtered with a cutoff frequency of 8.4 Hz and subtracted from the resulting addition of PWM1 and PWM2. The use of a processor-controlled PWM3 signal enables a calibration step, where the output of the summing circuit can be measured, while the processor adjusts the PWM3 signal to remove the output DC component. Notice that the circuit gain for PWM1 and PWM2 is set to 1 , while the gain for PWM3 is set to 1.5 .

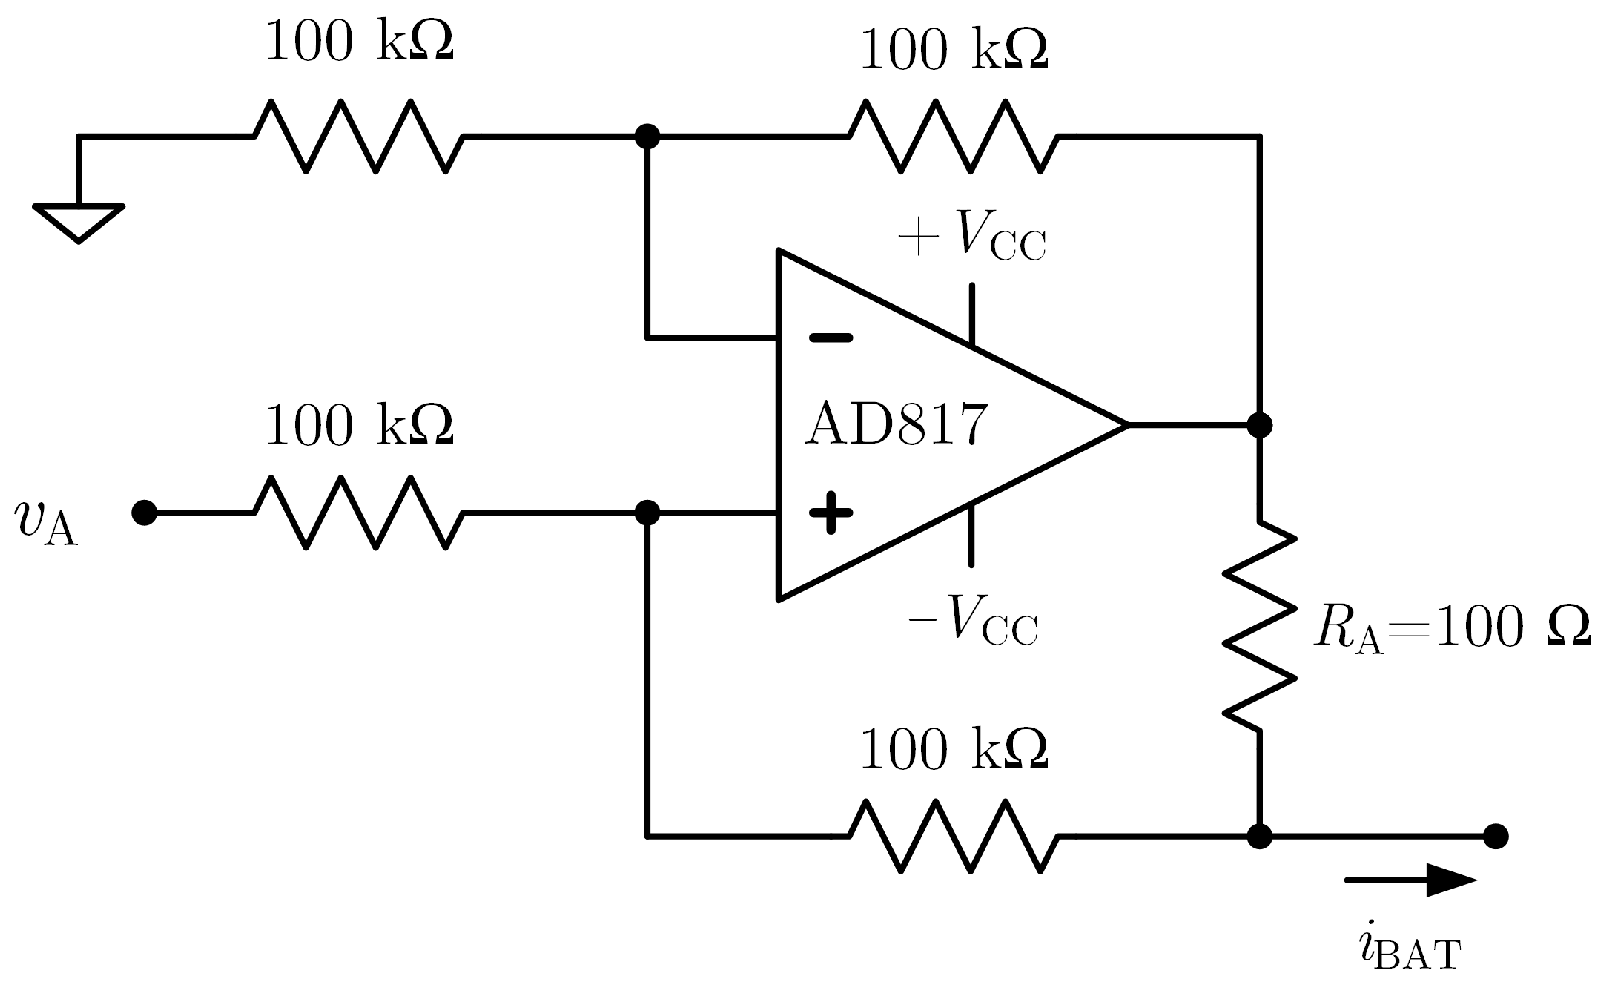
2.3. Improved Howland Current Pump

The multiharmonic signal generated at the output of the summing stage circuit v A is applied to an Improved Howland current pump [19], depicted in Figure 3, which converts the voltage signal into a current i BAT that is applied to R S and the battery. The OPAMP is an Analog Devices AD817 with a 350 V/μs slew rate and a 50 MHz unity gain bandwidth, and is capable of outputting a 50 mA current.
The Howland pump transconductance gain A = i BAT / v A is defined by the R A = 100 Ω resistor since all the other resistors have the same value and therefore A = 1 / 100 = 10 mA / V . The output of this current pump is applied to the resistor R S used to measure the battery current, which in turn is connected in series with the battery.

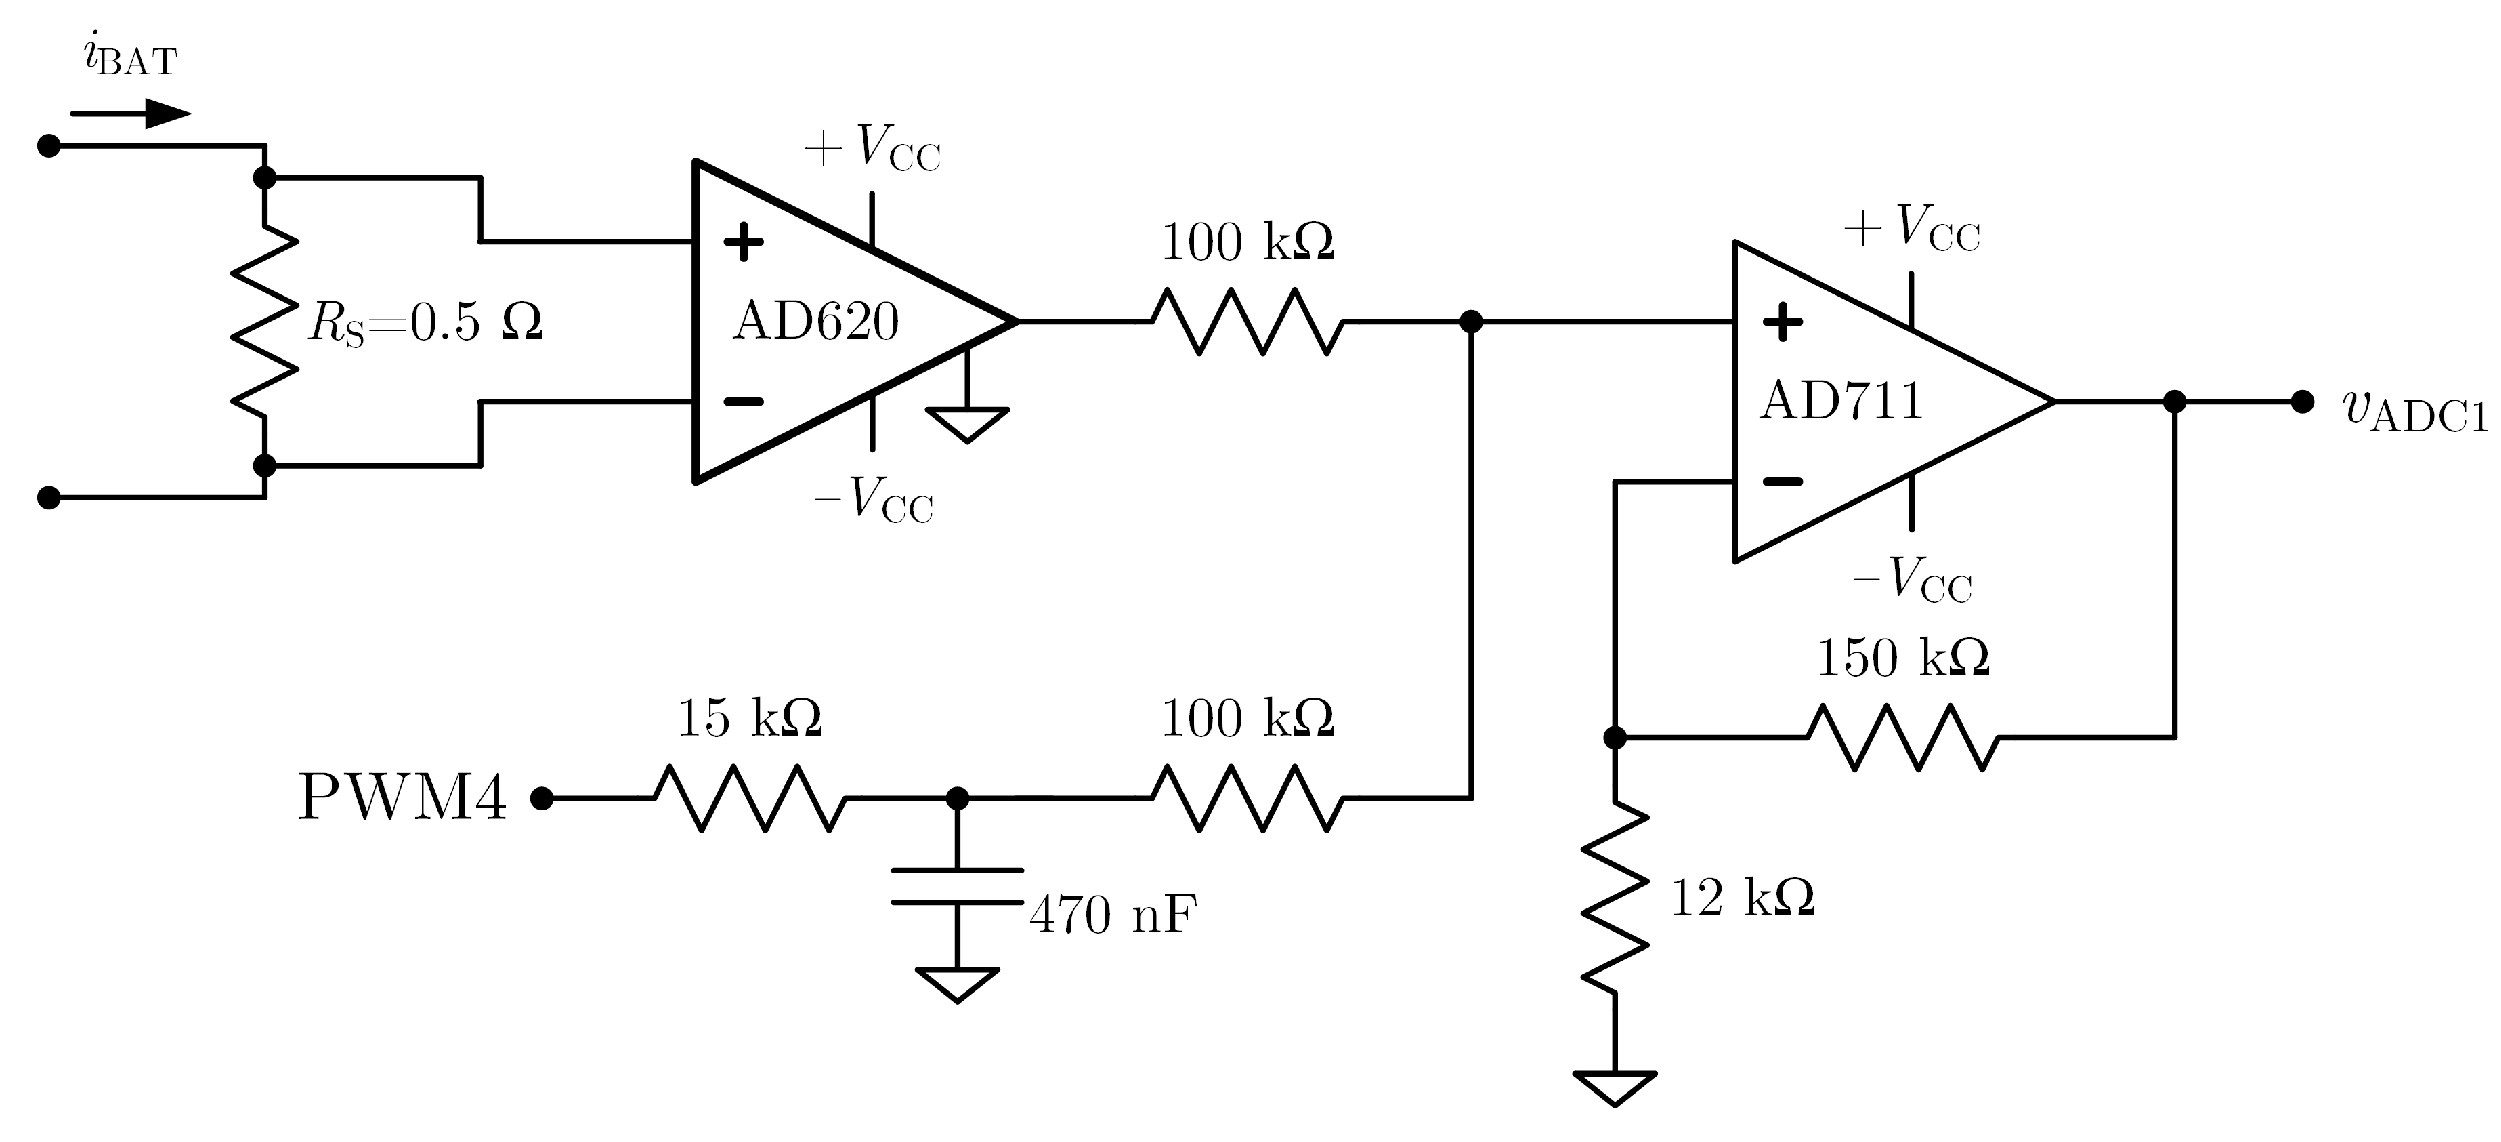
2.4. Battery Current Measurement Circuit

The battery current measurement circuit is represented in Figure 4. The battery current flows through resistor R S , and the voltage drop across this resistor is amplified by the Analog Devices Instrumentation Amplifier AD620, whose gain can be set with an external resistor (not represented in the diagram). PWM4 and the following low-pass filter with a 22.5 Hz cutoff is used to add a DC component because the processor ADC is unipolar (0–3 V). The last OPAMP is a AD711 used in a non-inverting configuration with gain 13.5. Notice that the DC adding circuit with the two 100 k Ω resistors introduces a 0.5 gain to both inputs. It should be added that all of these gains were adjusted to prevent the circuits from saturating and the exact values are compensated for in the calibration stage, which removes any strict constraints on the accuracy of the individual resistor values.

2.5. Battery Voltage Measurement Circuit

The last analog circuit is the battery voltage measurement circuit shown in Figure 5. The battery voltage includes a large DC component, along with multiharmonic components, caused by the imposed current. The relation between the voltage and current multiharmonic components corresponds to the battery impedance at the frequencies stimulated by the current.
The measurement circuit is a subtractor circuit, using an AD711, where a DC component produced by the processor using two PWM signals, PWM5 and PWM6, is subtracted from half of the battery voltage ( V BAT / 2 ). These two PWM signals are dynamically adjusted by the processor to compensate for the DC component of the battery, which does not contain information about the battery impedance at the desired frequencies. The dynamic adjustment is required because during normal battery operation with a load, the battery voltage will change as the battery is discharged by the load. Using two PWM signals enables a more accurate fine-tuning of the DC component and also to reach a higher DC compensation voltage. The resulting voltage is amplified by an AD620 instrumentation amplifier, whose reference input is also a DC component adjusted by the processor, using PWM7, to adapt the measurement voltage to the unipolar ADC range. Similarly to the process used in the other instrumentation amplifier of the battery current measurement circuit, the gain is defined by an external swappable resistor.

3. Stimulus Generation and System Calibration

This section describes the stimulus generation process and validation as well as the overall system calibration. These two steps are essential to implement the proposed measurement device.

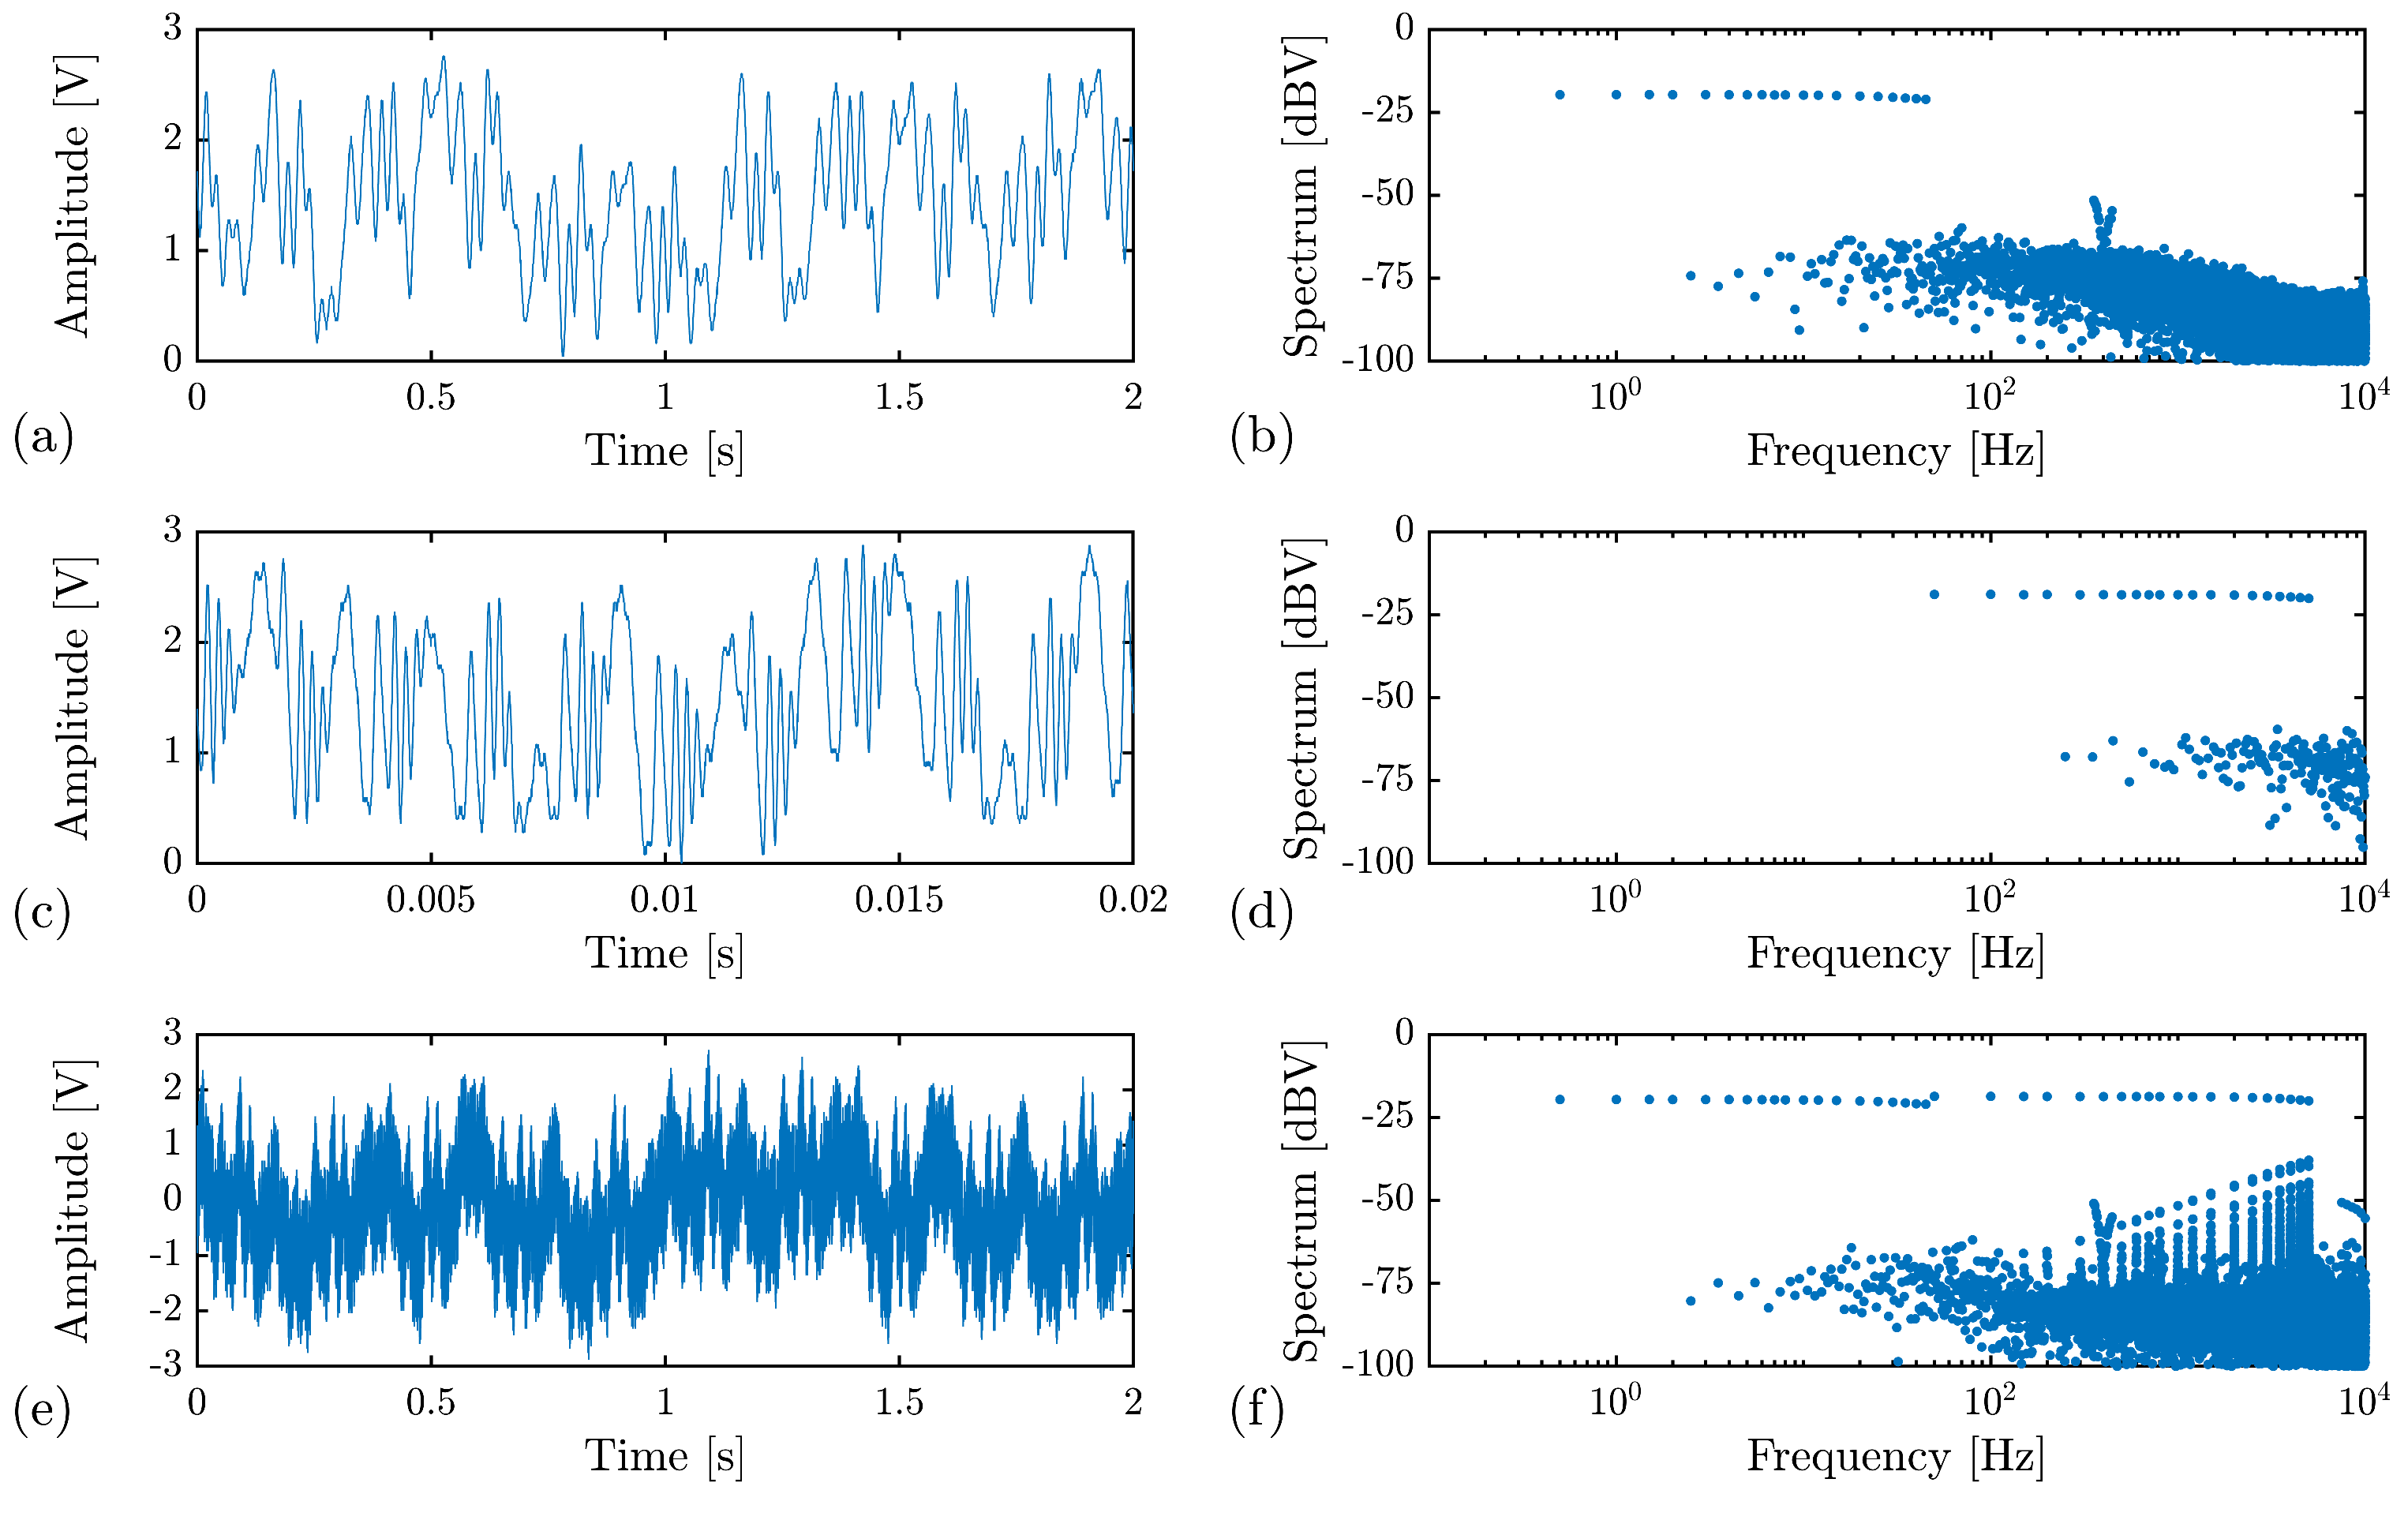
3.1. Stimulus Generation

The objective of this subsection is to describe the procedure to optimize the two multiharmonic signals that will be PWM generated and to present the measurement results of the individual generated multiharmonic signals as well as the final result of the combination of the two signals.
The crest factor (CF) of the voltage is, by definition, the relation between the time-domain voltage amplitude range and its RMS value. The objective of the optimization procedure is to, starting from the desired amplitude spectrum (tone frequencies and amplitudes), determine the optimal phases of those frequency components that minimize the crest factor. Since the voltage RMS value is defined solely by the amplitudes of the frequency components, the optimization procedure aims basically to optimize the phase of the frequency components to reduce the peak-to-peak value of the final voltage.
Specifically for the battery impedance measurement application, it is desired that the frequency components have the same amplitude at the frequencies defined for PWM1 and PWM2. The selected procedure was based on the Clipping algorithm [20], which is an iterative procedure that starts from arbitrary phase values for every tone in the frequency spectrum. The iterative part consists of (i) generating a one period time representation of the spectrum components (amplitude and phase) and calculating its crest factor; (ii) clipping the time-domain signal so that its absolute value is limited to a percentage of the present value; (iii) determining the DFT (Discrete Fourier Transform using the FFT—Fast Fourier Transform) of the clipped time-domain signal from (ii); (iv) retaining the phases obtained by the FFT and resetting the amplitudes to the desired values; and (v) repeating the process until the crest factor has reached the desired target value or there is no significant improvement in the crest factor. The clipping percentage is gradually increased over the iterations from 70% to 95%.
It should be noted that there are alternative methods that can be used in this process, namely, for example, the infinity norm algorithm [21], which was recently improved in [22], and the particle swarm optimization algorithm using artificial bee colony (ABC) [23].
Once the optimization process is concluded, a one-period time-domain signal is computer generated with the number of samples adjusted to the desired size of the look-up table. The look-up table values are then converted into 8-bit integers (the resolution required by the PWM generation process), and these tables are uploaded into the processor RAM to generate the two PWM signals.
The results of these procedures, measured after the PWM filters of the summing stage and the voltage output of the summing stage v A , are shown in Figure 6. In Figure 6a, the one-period (2 s) time domain of the multiharmonic 0.5–45 Hz voltage is shown, and the corresponding spectrum is depicted in Figure 6b. It can be seen that the tones have, as designed, very similar amplitudes. Notice that any deviation from the ideal equal amplitudes is not significant because the battery impedance measurement procedure will measure the actual tone amplitudes for the current and voltage.
The results in Figure 6c,d correspond to the 50 Hz–5 kHz multiharmonic voltage, which has a period of 20 ms. Figure 6e,f are representations of the output of the summing stage, and the spectrum shows the presence of the tones of the two original voltages now combined in the voltage at the circuit output ( v A ).
To increase system flexibility, a look-up table with a sine signal was also added. This enables simpler initial system debugging and also impedance battery measurements in the single-tone sequential sweep mode.

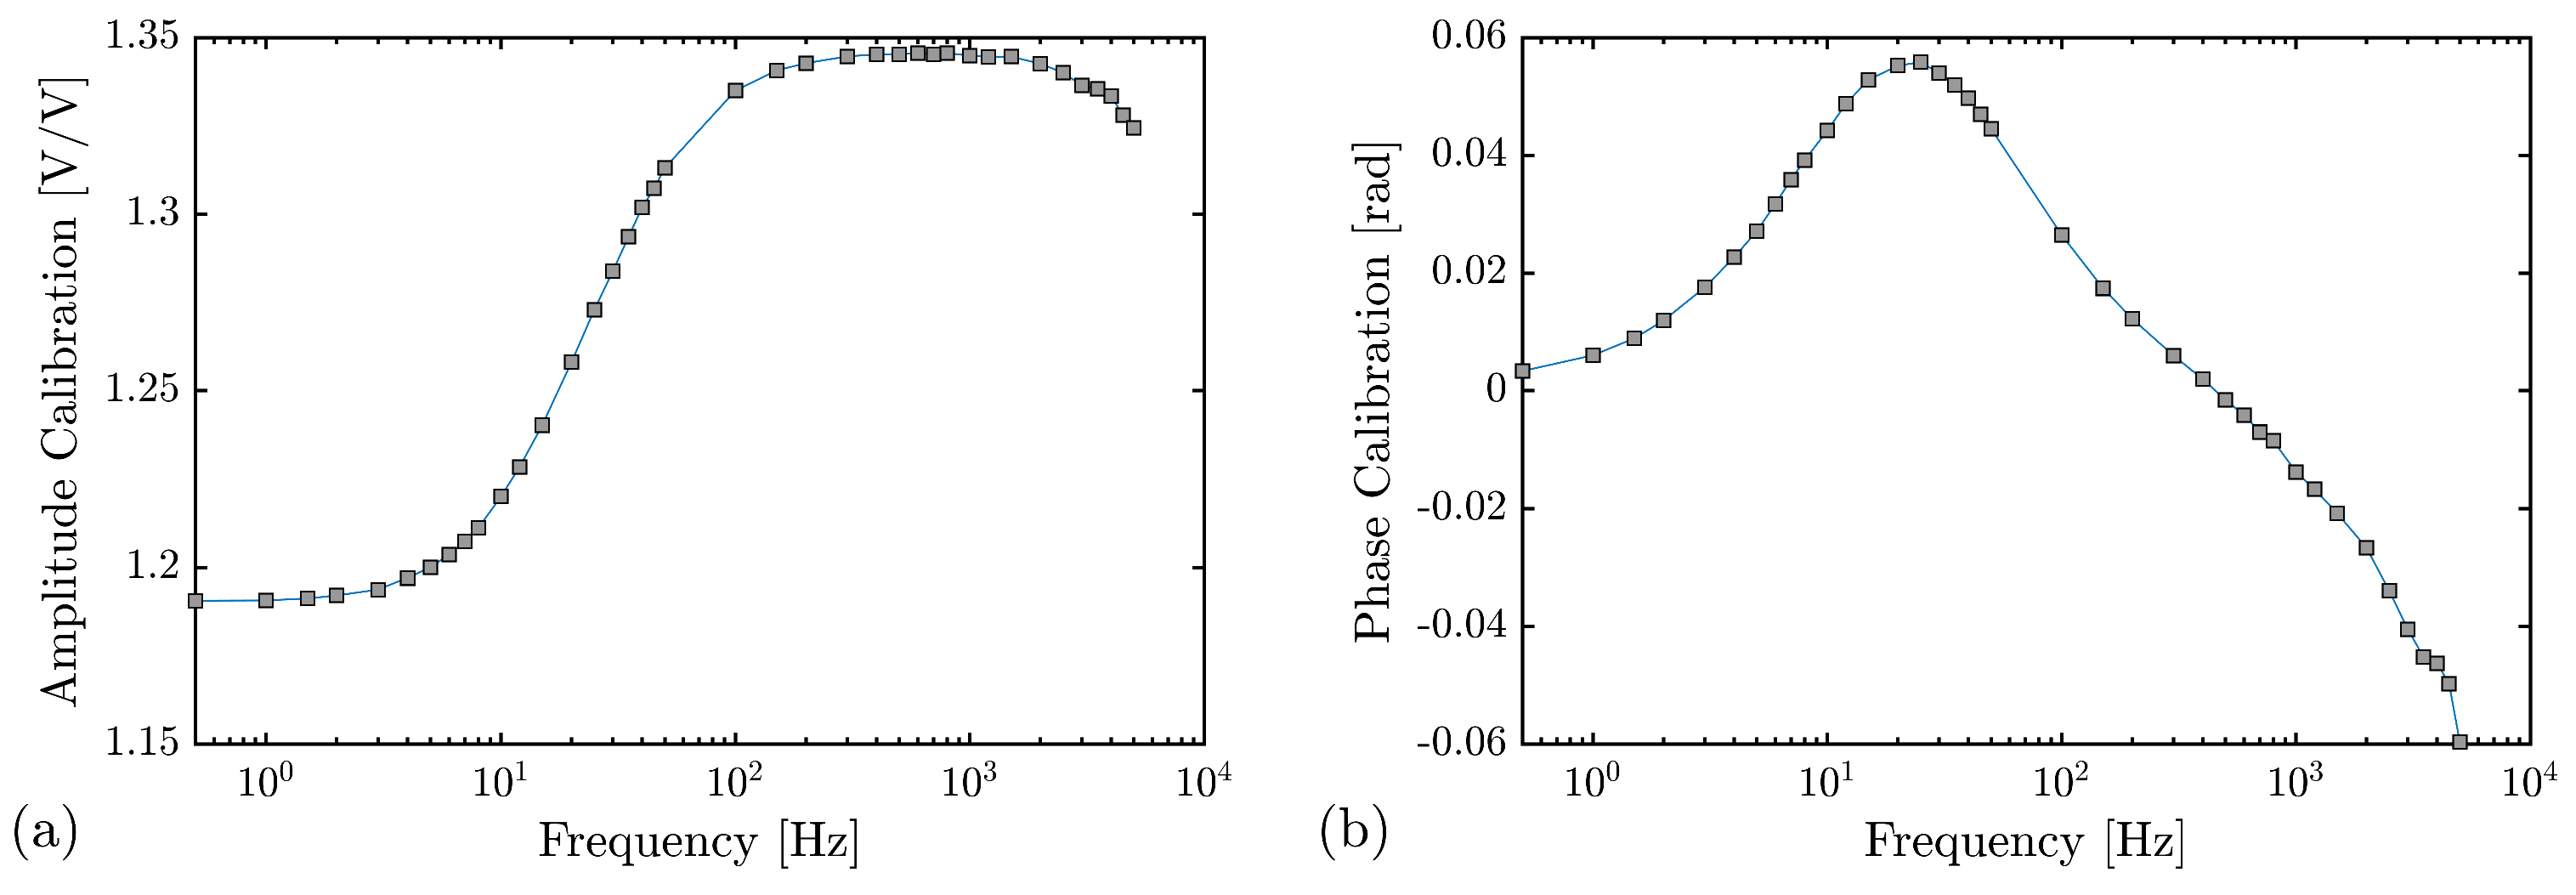
3.2. System Calibration

The calibration of the measurement system is performed to take into account the actual gains of the two measurement channels as well as their frequency dependence. Notice that the gains of the multiharmonic generation circuit (Figure 2) and of the Howland current pump (Figure 3) do not require calibration since the measurement circuits measure the actual current and voltage of the battery. Any deviations of those gains will impact the current and voltage values, but the impedance (their ratio) will remain unaltered.
A set of 20 low-value resistors ( 1 Ω to 20 Ω ) was measured with a commercial impedance measurement device (a Hioki 3522-50 LCR meter) at the 39 frequency tones used in the developed measurement circuit. The results were used together with the resistors impedance measurements from the embedded measurement circuit to obtain the frequency-dependent amplitude and phase calibration coefficients.
The resulting amplitude calibration coefficients are shown in Figure 7a with the phase calibration coefficients plotted in Figure 7b. These calibration results are used after each measurement with the amplitude coefficient correcting the estimated impedance magnitude and the phase calibration coefficient adjusting the estimated impedance phase. Additionally, a zero compensation step is also performed to take into account the impedance of the connection wires.
To validate the calibration procedure, a basic impedance circuit with a 15 Ω resistor in parallel with a 10 μ F capacitor was measured with the Hioki impedance reference instrument and with the developed measurement system. The uncalibrated measurement results and the final calibrated values are plotted in Figure 8, validating the calibration procedure.

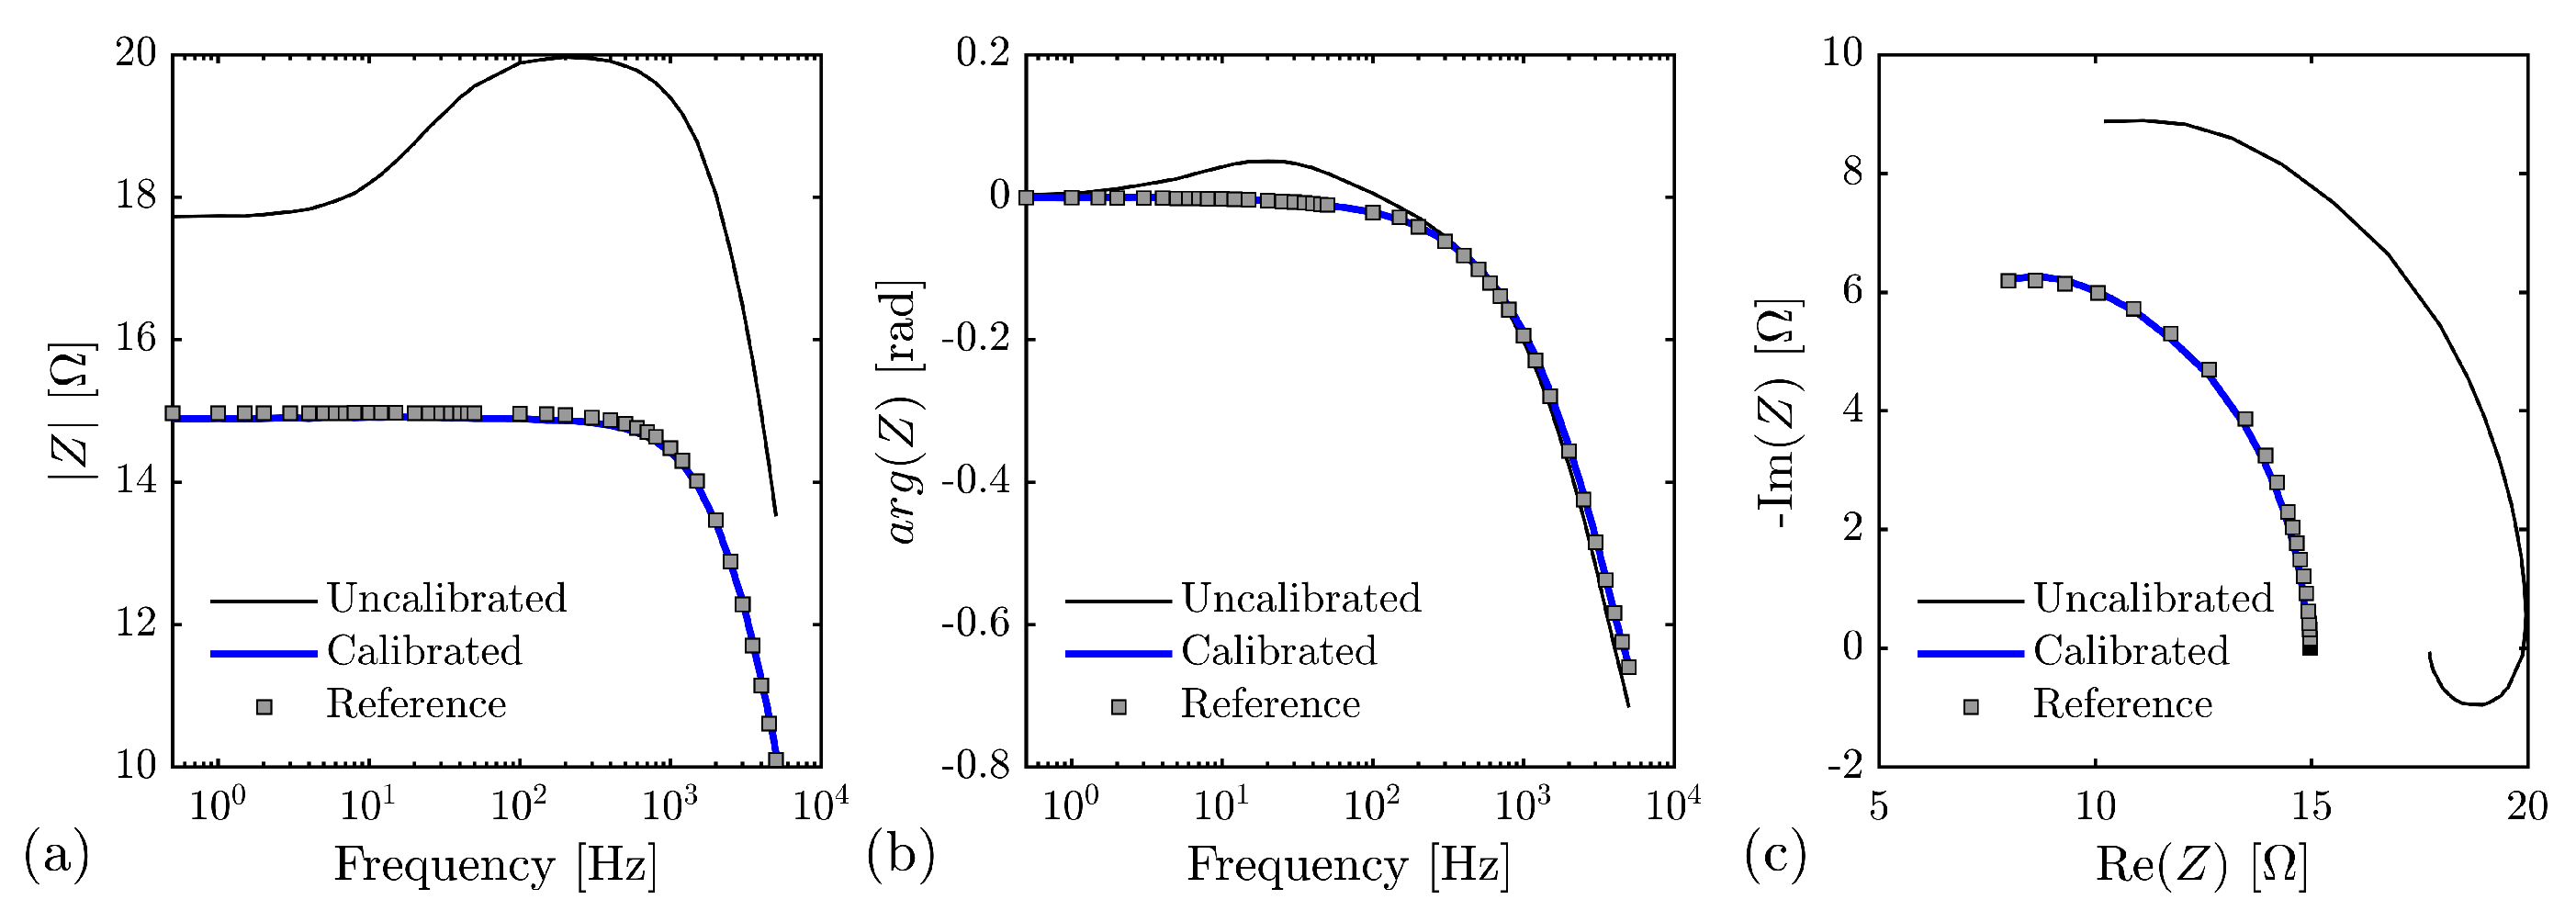
4. Battery Impedance Measurement Results

The first battery that was measured was a Cellevia LP502248, polymer lithium-ion (Li-Po) battery 3.7 V with a 450 mAh capacity. The measurement procedure, identical for all batteries, consists of the following:
(i)
Fully charge the battery and stop the charge process when the battery charging current is below 10 mA.
(ii)
Wait for the battery open voltage to stabilize, setting a threshold of | d V BAT / d t | to terminate the stabilization period (this threshold was set to 0.1 mV / min ).
(iii)
Perform the impedance measurement procedure, repeating the process 10 times.
(iv)
Discharge the battery using a small resistor and end the discharge process when the discharge reaches 25 mAh.
(v)
If the battery is fully discharged (detected by the battery internal protection circuit), the procedure ends; otherwise, go back to step (ii).
For the LP502248 battery, the process resulted in 17 impedance measurement steps that correspond to different battery charge levels. Figure 9 depicts the measurement results with error bars to represent the measurement uncertainty using a coverage factor of 1.96 to define an interval estimated to have a level of confidence of 95%, for three of the measured cycles, corresponding to SOC values of 10.4%, 43.9% and 94.1%. In Figure 9a, the battery impedance magnitude as a function of the measurement frequency is shown, while the corresponding phase measured values/uncertainty intervals are represented in Figure 9b. Figure 9c shows the corresponding Nyquist plots for the average results.
The SOC values are estimated using 0% for the battery discharged state and calculated backwards using the absolute discharge values in each step and the battery rated capacity. These three SOC values were selected to show the influence of the SOC on the impedance measured values. The complete results from the 17 cycles (that correspond to different SOC values) are represented in Figure 10 with the impedance magnitude in Figure 10a, the impedance phase in Figure 10b, and the Nyquist plots in Figure 10c.
The second battery measured was a Canon CA4L photo camera battery Li-ion 3.7 V with 750 mAh capacity. For this battery, the only change was the discharge step capacity that was changed to 50 mAh, which resulted in a total of 12 different SOC values with roughly 7% difference. The complete measurement results are depicted in Figure 11, separately showing the impedance magnitude, the impedance phase and the Nyquist plots for the different SOC levels. The evolutions of these parameters are similar to the ones obtained for the Li-Po battery with some slight differences in the baseline values.
The third and final battery is a Li-ion CGAS007 Panasonic camera battery with 1000 mAh capacity. Each discharge cycle was adjusted for 50 mAh, and the results are presented in Figure 12 for the different SOC levels with approximately 5% steps.

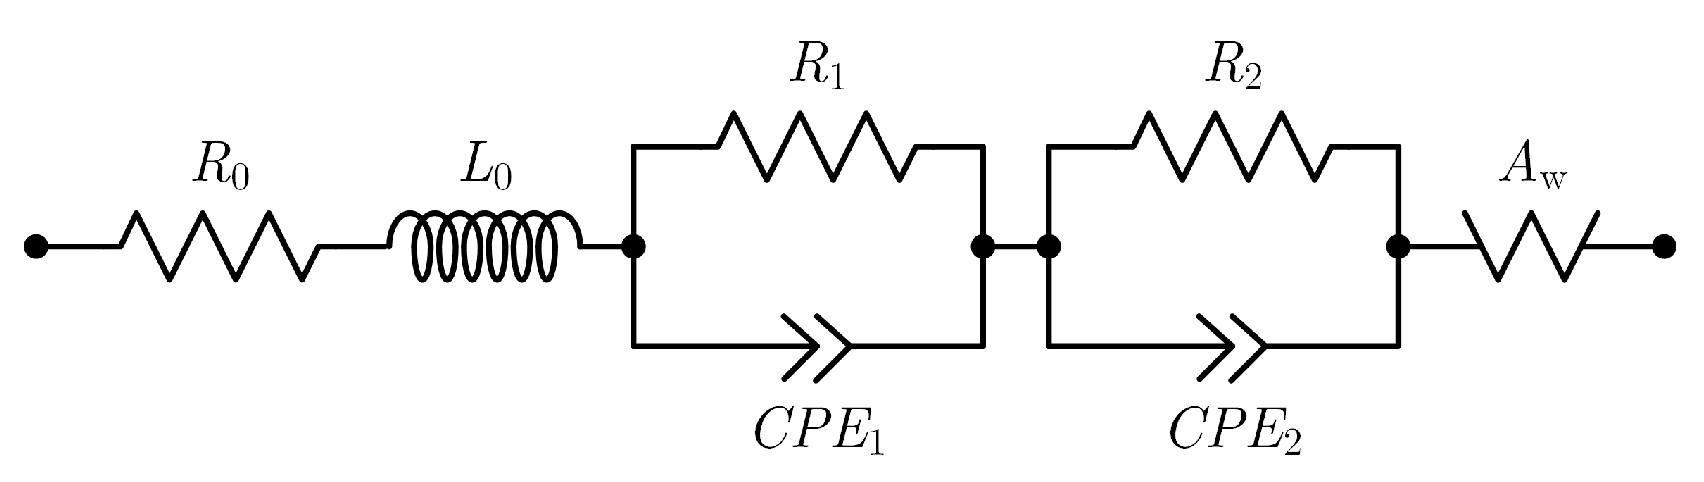
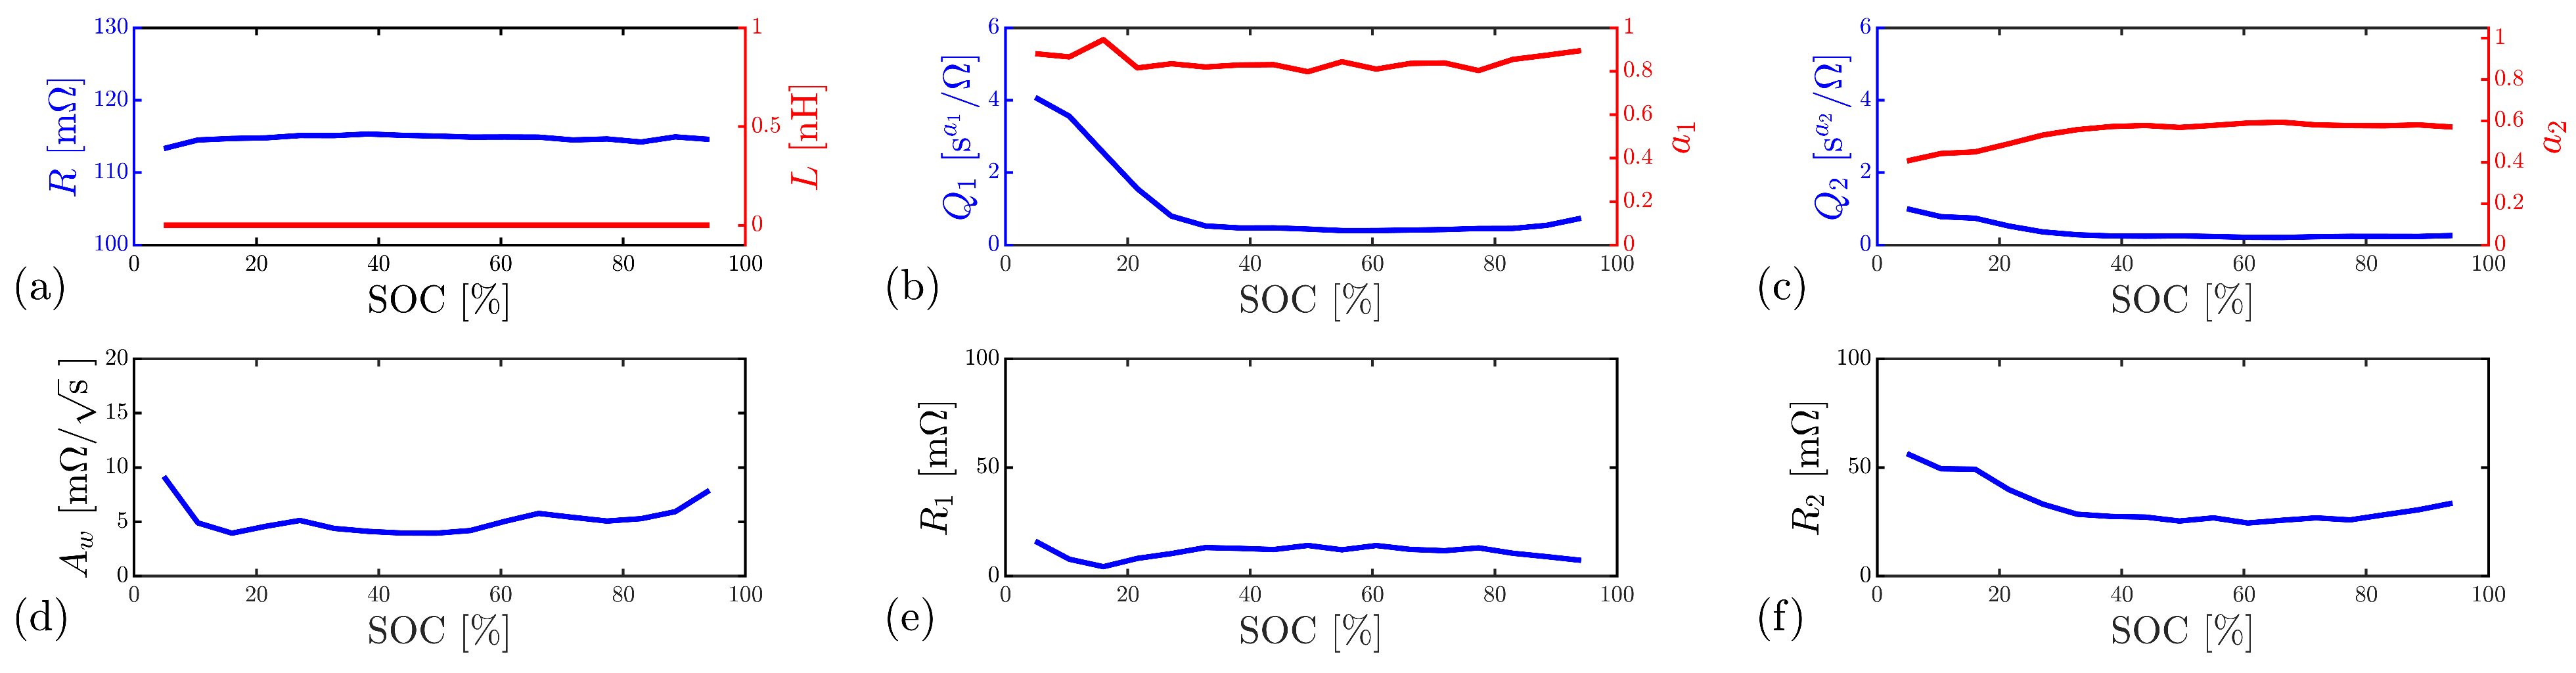
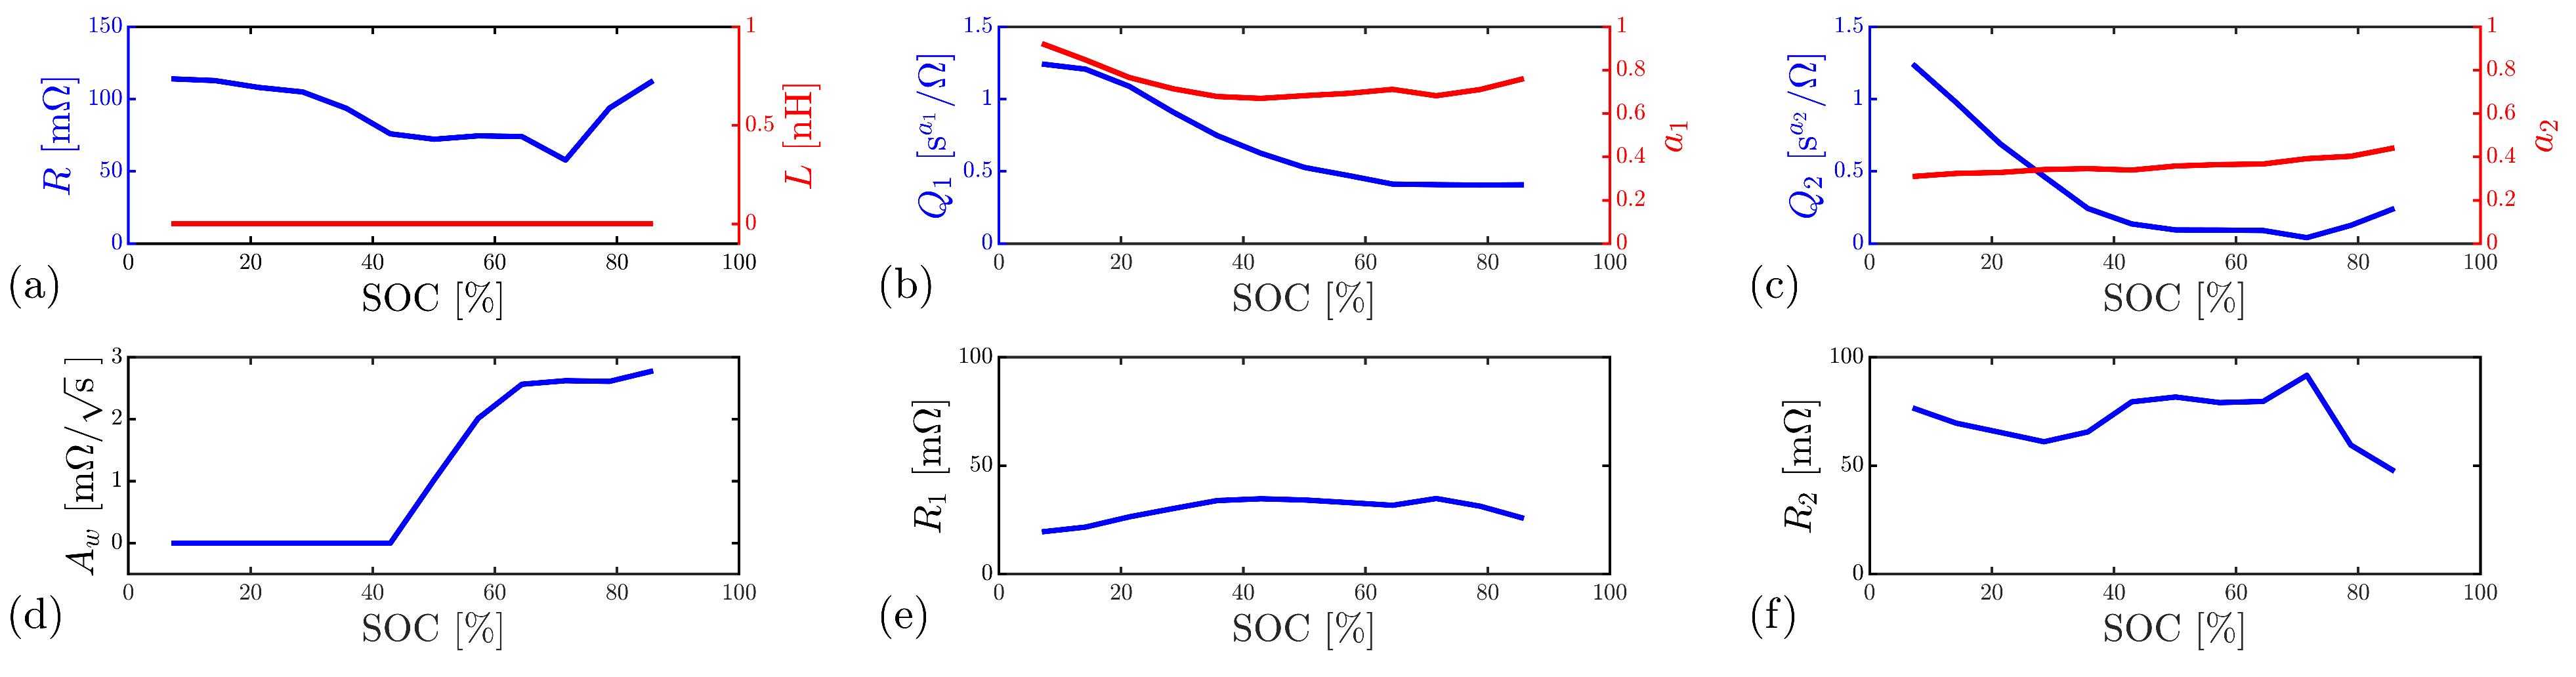
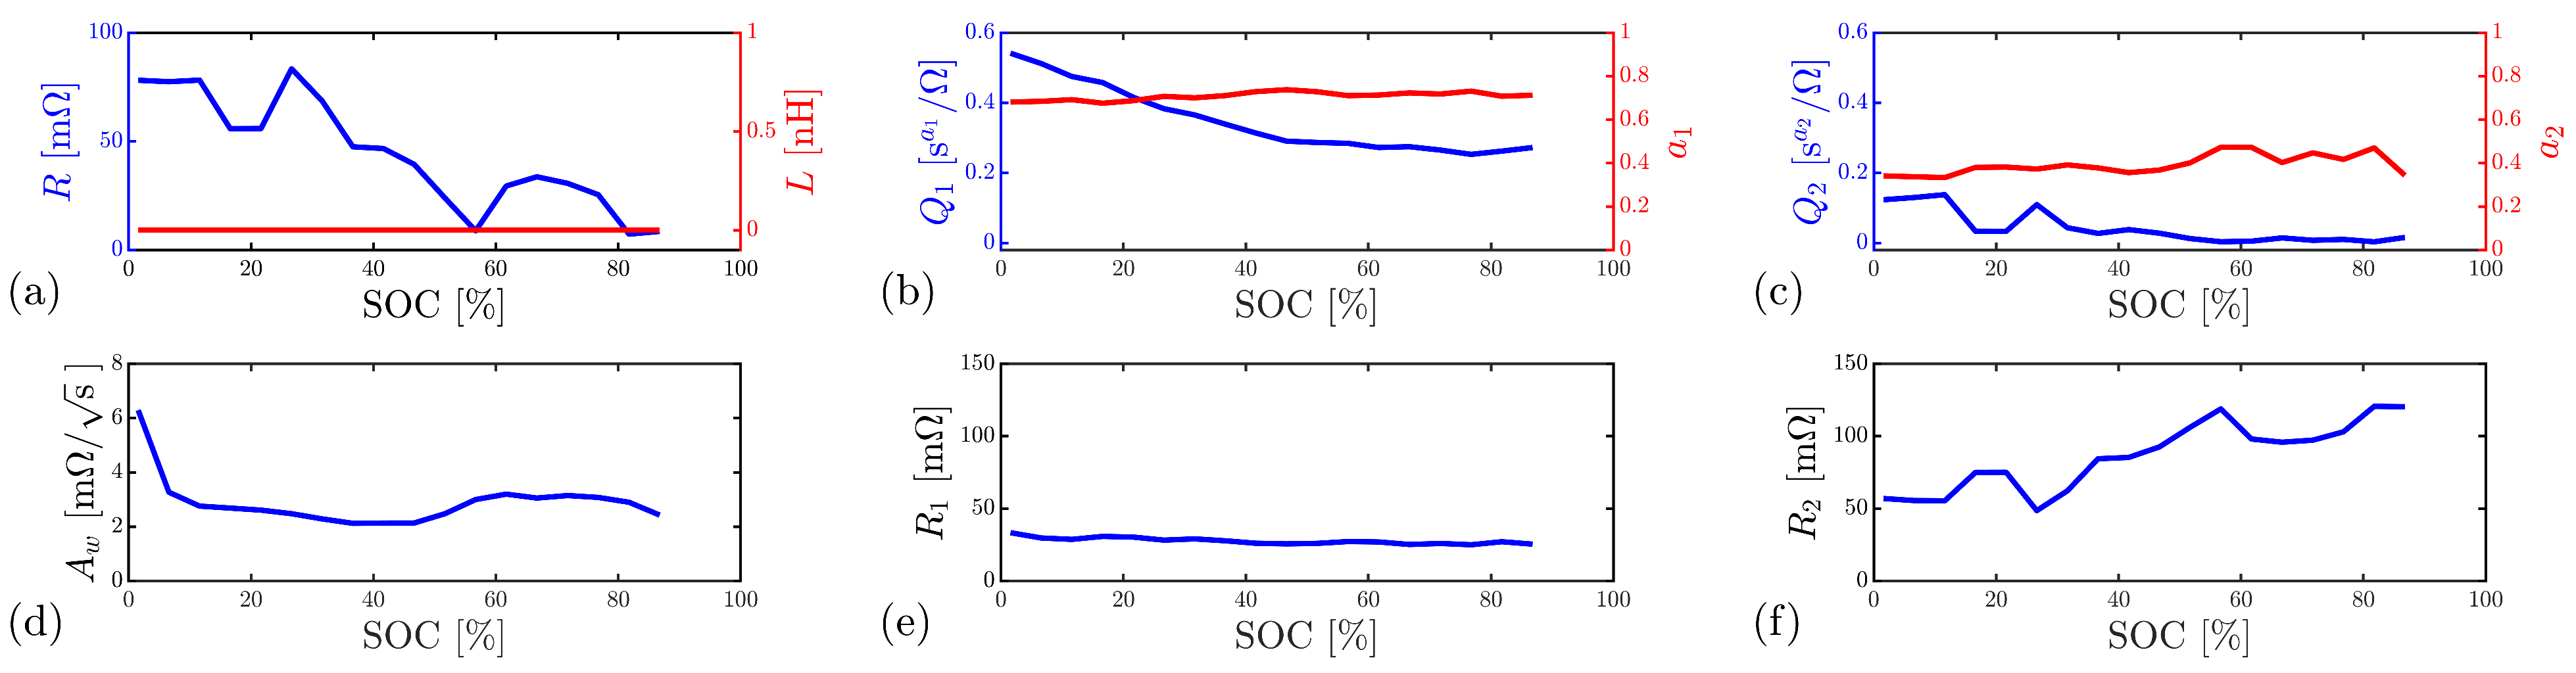
5. Battery Impedance Equivalent Circuit

Figure 13 represents one of the most common equivalent circuit model (ECMs) used to model the impedance of a battery [24]. The Randles circuit model [25], or one of its variants, is traditionally used to model the battery output impedance. To account for the battery cell geometry, a serial inductance is usually added that can also account for the wiring inductance. However, for small batteries, the effect of this inductance is only significant for frequencies above 1 kHz. A w corresponds to a Warburg element to model the ion transport across an ideal semi-infinite electrolyte layer, and its significance to the battery impedance can also be limited. Nevertheless, these two elements are considered in the model, and their actual contribution to the battery impedance is reflected in their values. The two R and C P E (constant-phase elements) parallel circuits model the midfrequency behavior of the charge transfer and appear as semi-circles in the Nyquist plot.
The estimation of the circuit parameters depends on the specific characteristics of the battery and eventually on the battery SOC and SOH. In this preliminary analysis, only the SOC is considered because in order to also consider the state of health, long-run measurements must be performed with tens or hundreds of complete charge/discharge cycles. The circuit contains two constant phase elements ( C P E s) [26] which are characterized by two parameters (Q and α ). The impedance of these elements is given by Z CPE = 1 Q × ( i ω ) α , where the value of α is limited between 0 and 1 and defines the impedance phase of the C P E . The phase of the C P E is π α / 2 ; therefore, for α = 0 , the C P E is a resistor, and for α = 1 , the C P E is a capacitor.
Additionally, the circuit also contains a Warburg element represented by A w . This element has one parameter, the Warburg constant or coefficient, and the element impedance is Z w = A w ( 1 i ) ω . Notice that the Warburg element is also a constant phase element but with a fixed phase defined by α = 0.5 , i.e., its phase is π / 4 .
To extract the equivalent circuit parameters, several methods are available [27,28,29]. The genetic algorithm (GA)-based method described in [28] was the selected option to obtain an initial estimate of the parameters for a given SOC value. This option enables the assessment of a large parameter space while trying to avoid local minima in an efficient process. Once these initial parameters were obtained, a traditional minimization algorithm based on the Nelder–Mead Simplex Method [30], was used to estimate the parameters for all the SOC measured values. It should be noted that the algorithms that estimate the circuit model parameters have an identical good solution by exchanging the two C P E s and corresponding resistor parallel circuit. To avoid this switch, the final solution changes the sets if a 2 > a 1 to ensure that a 1 > a 2 . An alternative circuit was used in [31], which is also suitable for modeling the battery impedance of Li-ion batteries.
Figure 14 presents the results obtained from the LP502248 battery measurements. Figure 14a includes the values for R and L, while Figure 14b,c represent the parameters of C P E 1 and C P E 2 . The Warburg parameter is depicted in (Figure 14d), and R 1 and R 2 are shown in (Figure 14e,f) respectively. From these results, and common to the results obtained for the other two batteries, it is clear that the zero impedance compensation step eliminated the series inductance represented by L, which is always below 1 pH (at the highest measured frequency of 5 kHz, the inductor impedance magnitude is below 0.04 μ Ω ). Specifically for this battery, the parameter that exhibits the most significant variation with the SOC is Q 1 , which shows a significant variation for the lower SOC values. All the other parameters are almost unaltered by the state-of-charge variation.
The equivalent results for the Li-ion CA4L battery are represented in Figure 15. In this case, the C P E 2 Q 2 parameter also exhibits a significant variation with the SOC change. Finally, in Figure 16, the results from the Li-ion CGAS007 are shown. In this battery, relevant parameter variation is observable only in Q 1 from C P E 1 .

6. Discussion, Conclusions and Future Work

An embedded impedance battery measurement system was designed, implemented, calibrated and shown to be able to measure the impedance of different rechargeable batteries. The system is centered on an STM32F411 Arm Cortex-M4 core operating at 100 MHz. Starting from the development board, an analog front-end expansion board was specifically designed to interface the battery, including an improved Howland pump circuit driven by PWM signals. These PWM signals can be used to generate single-tone stimuli for step-by-step individual frequency impedance measurements or multiharmonic (also called multisine) signals to increase measurement speed.
The cost of the prototype, around EUR 50, is adequate for laboratory measurements to build a significant database of battery impedance responses but should be considerably reduced for implementation in embedded measurements systems powered by rechargeable batteries. It should be noted that the system includes a high level of flexibility to suit different measurement requirements, including other measurement frequencies and repetitions for each SOC/SOH measurement situation.
The proposed system can be compared to other published implementations that describe systems for EIS measurement suitable for online and onboard scenarios. In Ref. [32], a circuit based on a Howland current pump is described and characterized. The circuit is intended to be used within a complete EIS measurement system that includes also a DAQ, providing the excitation signal and the digitization capabilities. Compared to [32], the present paper proposes a self-contained and compact system that implements all the required components, thus avoiding the need for an external DAQ. In Ref. [33], an online EIS measurement system is realized by the proper excitation of an electric motor controller. This approach has limited applicability because it can only be used with specific power electronics and experiences a ripple in the output voltage.
Therefore, compared to [33], the proposed system is of more general applicability since it is not dependent on a specific power electronic circuit. Furthermore, in [34], an EIS method suitable for online application is presented, based on a single-sine approach using a smooth cell excitation current and a simple MOSFET circuit. Compared to [34], this work has the feature of employing a multiharmonic, broadband excitation signal, which reduces the time required for completing an EIS measurement by simultaneously exciting the battery over a wide bandwidth. Finally, compared to the measurement system in [35] that employs a DAC for the generation of the stimulus signal, the proposed system is less complex and less power consuming since the PWM excitation signal is provided by the microcontroller directly.
The obtained measurement results validate the approach and methodology used to measure the three different batteries that were analyzed under multiple state-of-charge conditions. A commonly used equivalent circuit was used to model the measured impedance response for each SOC. The equivalent circuit is composed of C P E s, resistors, an inductor and a Warburg element. For the three batteries, the Q parameters of the circuit C P E s were found to be the most sensitive to the SOC.
Further work will be centered on refining the measurement system by enabling the measurement of a wider frequency range and the eventual implementation of a SOC and SOH estimation algorithm within the embedded measurement system.
Additionally, a database where all the impedance measurements will be stored is under development. This database will be available for all that wish to use the impedance data. Another improvement that will added to future system versions is the control of the discharge rate. The existing setup uses a low-value resistor, which does not enable accurate setting of the C rate.

Author Contributions

Conceptualization, G.C. and P.M.R.; methodology, G.C., A.D.A., F.M.J., P.M.R. and P.C.; software, G.C., F.M.J. and P.M.R.; writing, G.C., A.D.A., F.M.J., P.M.R. and P.C. All authors have read and agreed to the published version of the manuscript.

Funding

This work is partially funded by FCT/MCTES through national funds and when applicable co-funded EU funds under the project UIDB/EEA/50008/2020 and by the Italian Ministry of University and Research (MUR) under Grant PRIN 2022KB2HZM.

Data Availability Statement

Data are contained within the article.

Conflicts of Interest

The authors declare no conflict of interest.

References

  1. Hu, X.; Zou, C.; Zhang, C.; Li, Y. Technological Developments in Batteries: A Survey of Principal Roles, Types, and Management Needs. IEEE Power Energy Mag. 2017, 15, 20–31. [Google Scholar] [CrossRef]
  2. Luo, X.; Wang, J.; Donner, M.; Clarke, J. Overview of current development in electrical energy storage technologies and the application potential in power system operation. Appl. Energy 2015, 137, 511–536. [Google Scholar] [CrossRef]
  3. Mohamad, F.; Teh, J.; Lai, C.-M.; Chen, L.-R. Development of Energy Storage Systems for Power Network Reliability: A Review. Energies 2018, 11, 2278. [Google Scholar] [CrossRef]
  4. Murnane, M.; Ghazel, A. A Closer Look at State of Charge (SOC) and State of Health (SOH) Estimation Techniques for Batteries. Analog Devices Technical Note. 2017. Available online: https://www.analog.com/media/en/technical-documentation/tech-articles/a-closer-look-at-state-of-charge-and-state-health-estimation-tech.pdf (accessed on 25 October 2023).
  5. International Energy Agency. Global EV Outlook. 2023. Available online: http://www.iea.org (accessed on 25 October 2023).
  6. Moncecchi, M.; Brivio, C.; Mandelli, S.; Merlo, M. Battery Energy Storage Systems in Microgrids: Modeling and Design Criteria. Energies 2006, 13, 2006. [Google Scholar] [CrossRef]
  7. González, I.; Calderón, A.J.; Folgado, F.J. IoT real time system for monitoring lithium-ion battery long-term operation in microgrid. J. Energy Storage 2022, 52, 104596. [Google Scholar] [CrossRef]
  8. Xing, Y.; He, W.; Pecht, M.; Tsui, K.L. State of charge estimation of lithium-ion batteries using the open-circuit voltage at various ambient temperatures. Appl. Energy 2014, 113, 106–115. [Google Scholar] [CrossRef]
  9. Shrivastava, P.; Soon, T.K.; Idris, M.; Mekhilef, S. Overview of model-based online state-of-charge estimation using Kalman filter family for lithium-ion batteries. Renew. Sust. Energ. Rev. 2019, 113, 109233. [Google Scholar] [CrossRef]
  10. Hossain, M.; Haque, M.E.; Arif, M.T. Kalman filtering techniques for the online model parameters and state of charge estimation of the Li-ion batteries: A comparative analysis. J. Energy Storage 2022, 51, 104174. [Google Scholar] [CrossRef]
  11. Guo, Y.; Tian, J.; Li, X.; Song, B.; Tian, Y. State of Charge Estimation of Lithium-Ion Batteries Based on Vector Forgetting Factor Recursive Least Square and Improved Adaptive Cubature Kalman Filter. Batteries 2023, 9, 499. [Google Scholar] [CrossRef]
  12. Lee, S.; Lee, D. A Novel Battery State of Charge Estimation Based on Voltage Relaxation Curve. Batteries 2023, 9, 517. [Google Scholar] [CrossRef]
  13. Berecibar, M.; Gandiaga, I.; Villarreal, I.; Omar, N.; Van Mierlo, J.; Van den Bossche, P. Critical review of state of health estimation methods of Li-ion batteries for real applications. Renew. Sust. Energ. Rev. 2016, 56, 572–587. [Google Scholar] [CrossRef]
  14. Mc Carthy, K.; Gullapalli, H.; Ryan, K.M.; Kennedy, T. Review—Use of Impedance Spectroscopy for the Estimation of Li-ion Battery State of Charge, State of Health and Internal Temperature. J. Electrochem. Soc. 2021, 168, 080517. [Google Scholar] [CrossRef]
  15. Galeotti, M.; Cinà, L.; Giammanco, C.; Cordiner, S.; Di Carlo, A. Performance analysis and SOH (state of health) evaluation of lithium polymer batteries through electrochemical impedance spectroscopy. Energies 2015, 89, 678–686. [Google Scholar] [CrossRef]
  16. Kallel, A.Y.; Hu, Z.; Kanoun, O. Comparative Study of AC Signal Analysis Methods for Impedance Spectroscopy Implementation in Embedded Systems. Appl. Sci. 2022, 12, 591. [Google Scholar] [CrossRef]
  17. STMicroelectronics NV. UM1842, User Manual, Discovery Kit with STM32F411VE MCU, Rev. 2. 2020. Available online: https://www.st.com/resource/en/user_manual/um1842-discovery-kit-with-stm32f411ve-mcu-stmicroelectronics.pdf (accessed on 25 October 2023).
  18. ADP5070, Data Sheet, Rev. E. Analog Devices. 2020. Available online: https://www.analog.com/media/en/technical-documentation/data-sheets/ADP5070.pdf (accessed on 25 October 2023).
  19. Lam, I.V. Analysis of Improved Howland Current Pump, Texas Instruments Application Note, SBOA437A. 2023. Available online: https://www.ti.com/lit/pdf/sboa437 (accessed on 25 October 2023).
  20. Pintelon, R.; Schoukens, J. System Identification—A Frequency Domain Approach; John Wiley & Sons: Hoboken, NJ, USA, 2001; pp. 137–138. [Google Scholar]
  21. Guillaume, P.; Schoukens, J.; Pintellon, R.; Kollár, I. Crest-factor minimization using nonlinear chebyshev approximation methods. IEEE Trans. Instrum. Meas. 1991, 40, 982–989. [Google Scholar] [CrossRef]
  22. Retzler, A.; Cseppentő, B.; Swevers, J.; Gillis, J.; Leitold, L.; Kollár, Z. Improved crest factor minimization of multisine excitation signals using nonlinear optimization. Automatica 2022, 140, 110654. [Google Scholar] [CrossRef]
  23. Janeiro, F.M.; Hu, Y.; Ramos, P.M. Peak factor optimization of multi-harmonic signals using artificial bee colony algorithm. Measurement 2020, 150, 107040. [Google Scholar] [CrossRef]
  24. Crescentini, M.; De Angelis, A.; Ramilli, R.; De Angelis, G.; Tartagni, M.; Moschitta, A.; Traverso, A.; Carbone, P. Online EIS and Diagnostics on Lithium-Ion Batteries by Means of Low-Power Integrated Sensing and Parametric Modeling. IEEE Trans. Instrumen. Meas. 2021, 70, 2001711. [Google Scholar] [CrossRef]
  25. Alavi, S.M.M.; Birkl, C.R.; Howey, D.A. Time-domain fitting of battery electrochemical impedance models. J. Power Sources 2015, 288, 345–351. [Google Scholar] [CrossRef]
  26. Orazem, M.E.; Tribollet, B. Electrochemical Impedance Spectroscopy, Chapter 14, 2nd ed.; John Wiley & Sons: Hoboken, NJ, USA, 2017; ISBN 978-1-118-52739-9. [Google Scholar]
  27. Macdonald, R. LEVM/LEVMW, Version 8.13. 2015. Available online: http://jrossmacdonald.com/levmlevmw/ (accessed on 25 October 2023).
  28. Janeiro, F.M.; Ramos, P.M. Application of genetic algorithms for estimation of impedance parameters of two-terminal networks. In Proceedings of the 2009 IEEE Instrumentation and Measurement Technology Conference, Singapore, 5–7 May 2009; pp. 602–606. [Google Scholar] [CrossRef]
  29. Janeiro, F.M.; Ramos, P.M. Threshold estimation for least-squares fitting in impedance spectroscopy. Measurement 2018, 124, 479–485. [Google Scholar] [CrossRef]
  30. Lagarias, J.C.; Reeds, J.A.; Wright, M.H.; Wright, P.E. Convergence Properties of the Nelder-Mead Simplex Method in Low Dimensions. SIAM J. Optim. 1998, 9, 112–147. [Google Scholar] [CrossRef]
  31. Buchicchio, E.; De Angelis, A.; Santoni, F.; Carbone, P.; Bianconi, F.; Smeraldi, F. Battery SOC estimation from EIS data based on machine learning and equivalent circuit model. Energy 2023, 283, 128461. [Google Scholar] [CrossRef]
  32. De Angelis, A.; Buchicchio, E.; Santoni, F.; Moschitta, A.; Carbone, P. Uncertainty Characterization of a Practical System for Broadband Measurement of Battery EIS. IEEE Trans. Instrumen. Meas. 2022, 71, 1002609. [Google Scholar] [CrossRef]
  33. Howey, D.A.; Mitcheson, P.D.; Yufit, V.; Offer, G.J.; Brandon, N.P. Online Measurement of Battery Impedance Using Motor Controller Excitation. IEEE Trans. Veh. Tech. 2014, 633, 2557–2566. [Google Scholar] [CrossRef]
  34. Koseoglou, M.; Tsioumas, E.; Papagiannis, D.; Jabbour, N.; Mademlis, C. A Novel On-Board Electrochemical Impedance Spectroscopy System for Real-Time Battery Impedance Estimation. IEEE Trans. Power Electron. 2021, 36, 10776–10787. [Google Scholar] [CrossRef]
  35. Zhang, F.; Teng, Z.; Rutkove, S.; Yang, Y.; Li, J. A simplified time-domain fitting method based on fractional operational matrix for Cole parameter estimation. IEEE Trans. Instrumen. Meas. 2019, 69, 1566–1575. [Google Scholar] [CrossRef]
Figure 1. Block diagram of the embedded measurement system. The developed daughter board includes, besides the shown four main blocks, a power management unit that generates the bipolar DC supply voltage for the analog circuitry.
Batteries 09 00577 g001
Figure 2. Summing stage circuit. The PWM signals are generated in the STM32 processor, with PWM1 containing the lower-tone frequencies (from 0.5 Hz to 45 Hz) and PWM2 with the higher-tone frequencies (from 50 Hz to 5 kHz). PWM3 is used to generate a DC signal to be subtracted from the other two so that the summing stage output voltage v A does not have a DC component.
Batteries 09 00577 g002
Figure 3. The improved Howland current pump circuit to convert the multiharmonic processor-generated voltage v A into the current i BAT that is imposed to the battery.
Batteries 09 00577 g003
Figure 4. Battery current measurement circuit. The AD620 is an instrumentation amplifier whose gain is set with an external swappable resistor. PWM4 is used to add a DC component necessary because of the unipolar range of processor ADC.
Batteries 09 00577 g004
Figure 5. Battery voltage measurement circuit, where the DC battery voltage is subtracted by the processor adjusted PWM5 and PWM6 signals. The resulting AC component is amplified by the instrumentation amplifier AD620, which is also used to add a DC component (adjust by PWM7) to account for the ADC unipolar range.
Batteries 09 00577 g005
Figure 6. Measurements of the multiharmonic voltages and corresponding spectrums. (a,b) are the lower-frequency multiharmonic voltage with frequency tones in the 0.5 Hz to 45 Hz range. (c,d) correspond to the higher-range frequency multiharmonic voltage with tones in the 50 Hz to 5 kHz range. The results presented in (e,f) are from the voltage output of the summing stage v A , with the complete multiharmonic voltage tones in the 0.5 Hz to 5 kHz range as desired.
Batteries 09 00577 g006
Figure 7. The calibration coefficients obtained from a set of low-value resistors measured with a reference impedance analyzer (Hioki 3522-50) and with the developed embedded measurement system at the tones that are used to measure the impedance battery. (a) shows the frequency dependence of the amplitude calibration coefficient, and (b) depicts the phase calibration coefficient as a function of the measurement tone frequency.
Batteries 09 00577 g007
Figure 8. Validation of the calibration procedure using a basic RC parallel circuit, showing the uncalibrated measurement results (thin black lines), the results of the calibration process (thick blue lines) and the reference values (square markers) obtained from the Hioki instrument. (a) represents the impedance magnitude | Z | as a function of the tone frequency. In (b) the impedance phases are plotted, while in (c) the traditional Nyquist plot, also called the Cole–Cole plot or diagram, shows Im ( Z ) as a function of Re ( Z ) .
Batteries 09 00577 g008
Figure 9. Impedance measurement results of the LP502248 450 mAh Li-Po battery for three values of the SOC. In (a) the impedance magnitude is plotted as a function of the measurement frequency, while in (b) the impedance phase is depicted. The represented results are the average values obtained from 10 repeated measurements together with uncertainty intervals obtained with a 1.96 coverage factor. The corresponding average Nyquist plots are represented in (c).
Batteries 09 00577 g009
Figure 10. Average impedance measurement results of the LP502248 450 mAh Li-Po battery for 17 values of the SOC. In (a,b) the impedance magnitude and phase are respectively shown as a function of the SOC and measurement frequency. The corresponding Nyquist plots are shown in (c).
Batteries 09 00577 g010
Figure 11. Average impedance measurement results of the CA4L 750 mAh Li-ion Canon camera battery for 12 values of the SOC. The impedance magnitude is plotted in (a), while the impedance phase is shown in (b), both as a function of the SOC and measurement frequency. The corresponding Nyquist plots are represented in (c).
Batteries 09 00577 g011
Figure 12. Average impedance measurement results of the CGAS007 1000 mAh Li-ion Panasonic camera battery for 18 values of the SOC. (a) depicts the impedance magnitude as a function of the SOC and measurement frequency, while (b) is identical for the impedance phase. The results shown in (c) correspond to the Nyquist plots.
Batteries 09 00577 g012
Figure 13. Battery impedance equivalent circuit. C P E are constant-phase elements whose impedance is defined by two parameters Q and α . A w is a Warburg element, and its impedance is defined by parameter A w .
Batteries 09 00577 g013
Figure 14. Equivalent circuit model parameters as a function of the SOC for the Li-Po LP502248 battery. (a) shows the series resistance R and inductance L. (b) depicts the C P E 1 parameters, while (c) includes the C P E 2 values. (d) represents the Warburg parameter, (e) corresponds to the resistor R 1 , which is in parallel with C P E 1 , and R 2 (in parallel with C P E 2 ) is represented in (f).
Batteries 09 00577 g014
Figure 15. Equivalent circuit model parameters as a function of the SOC for the Li-ion CA4L battery. (a) shows the series resistance R and inductance L. (b) depicts the C P E 1 parameters, while (c) includes the C P E 2 values. (d) represents the Warburg parameter, (e) corresponds to the resistor R 1 , which is in parallel with C P E 1 , and R 2 (in parallel with C P E 2 ) is represented in (f).
Batteries 09 00577 g015
Figure 16. Equivalent circuit model parameters as a function of the SOC for the Li-io CGAS007 battery. (a) shows the series resistance R and inductance L. (b) depicts the C P E 1 parameters while (c) includes the C P E 2 values. (d) represents the Warburg parameter, (e) corresponds to the resistor R 1 , which is in parallel with C P E 1 , and R 2 (in parallel with C P E 2 ) is represented in (f).
Batteries 09 00577 g016
Disclaimer/Publisher’s Note: The statements, opinions and data contained in all publications are solely those of the individual author(s) and contributor(s) and not of MDPI and/or the editor(s). MDPI and/or the editor(s) disclaim responsibility for any injury to people or property resulting from any ideas, methods, instructions or products referred to in the content.

