
Stress Distribution Inside a Lithium-Ion Battery Cell during Fast Charging and Its Effect on Degradation of Separator


Abstract
:1. Introduction
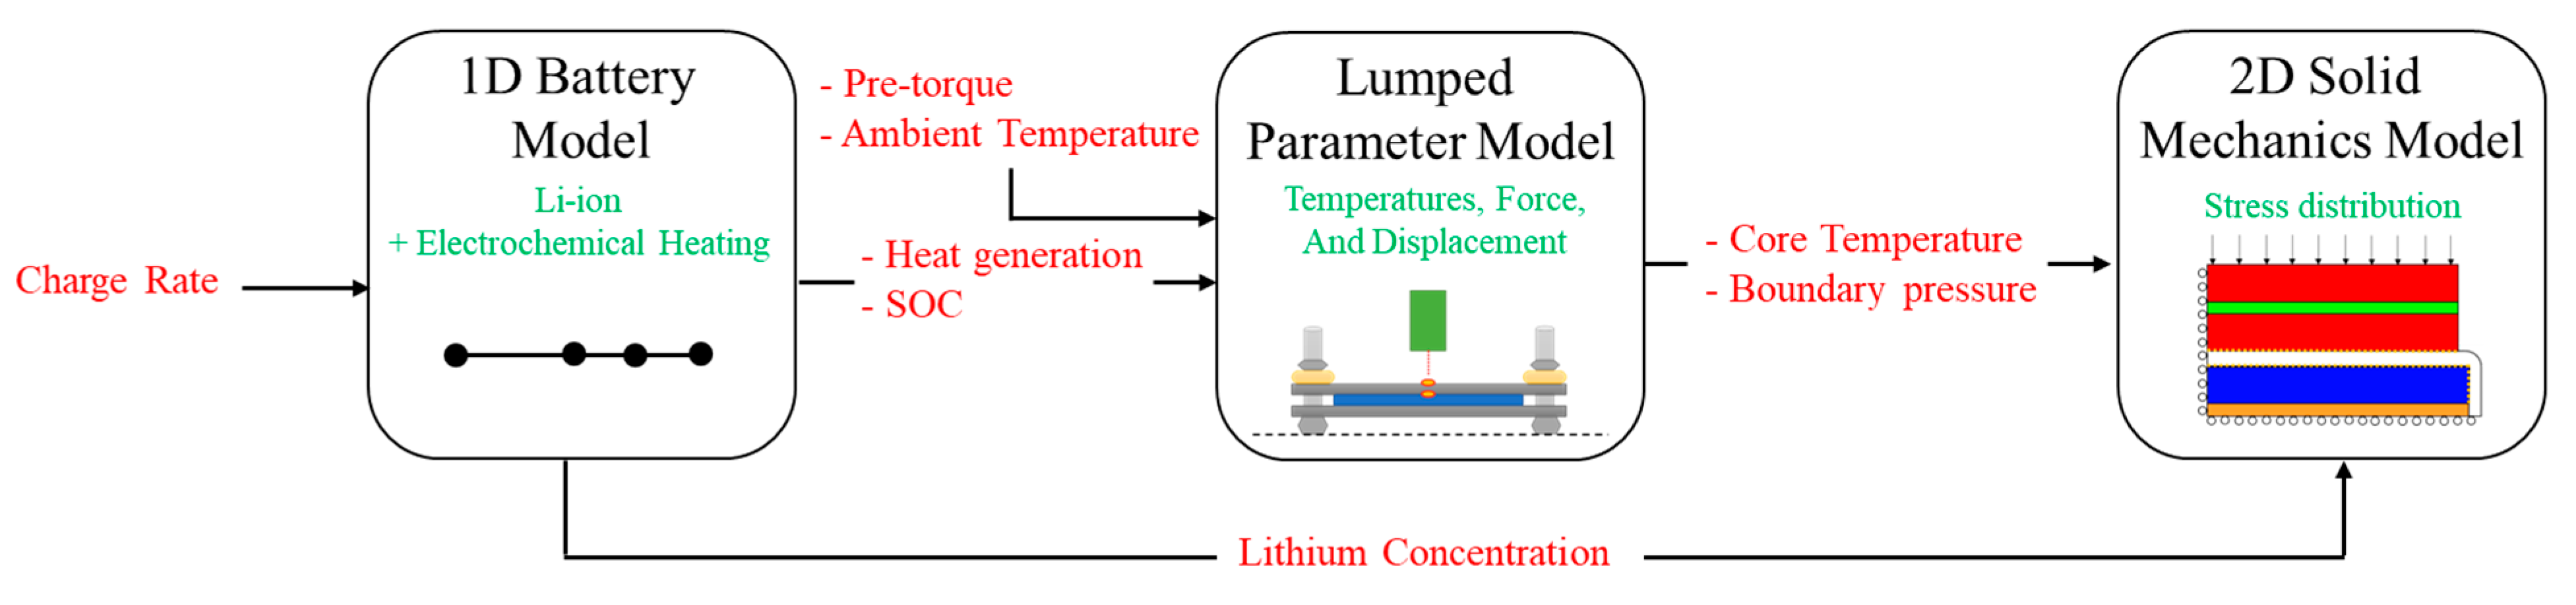
2. Hybrid Model
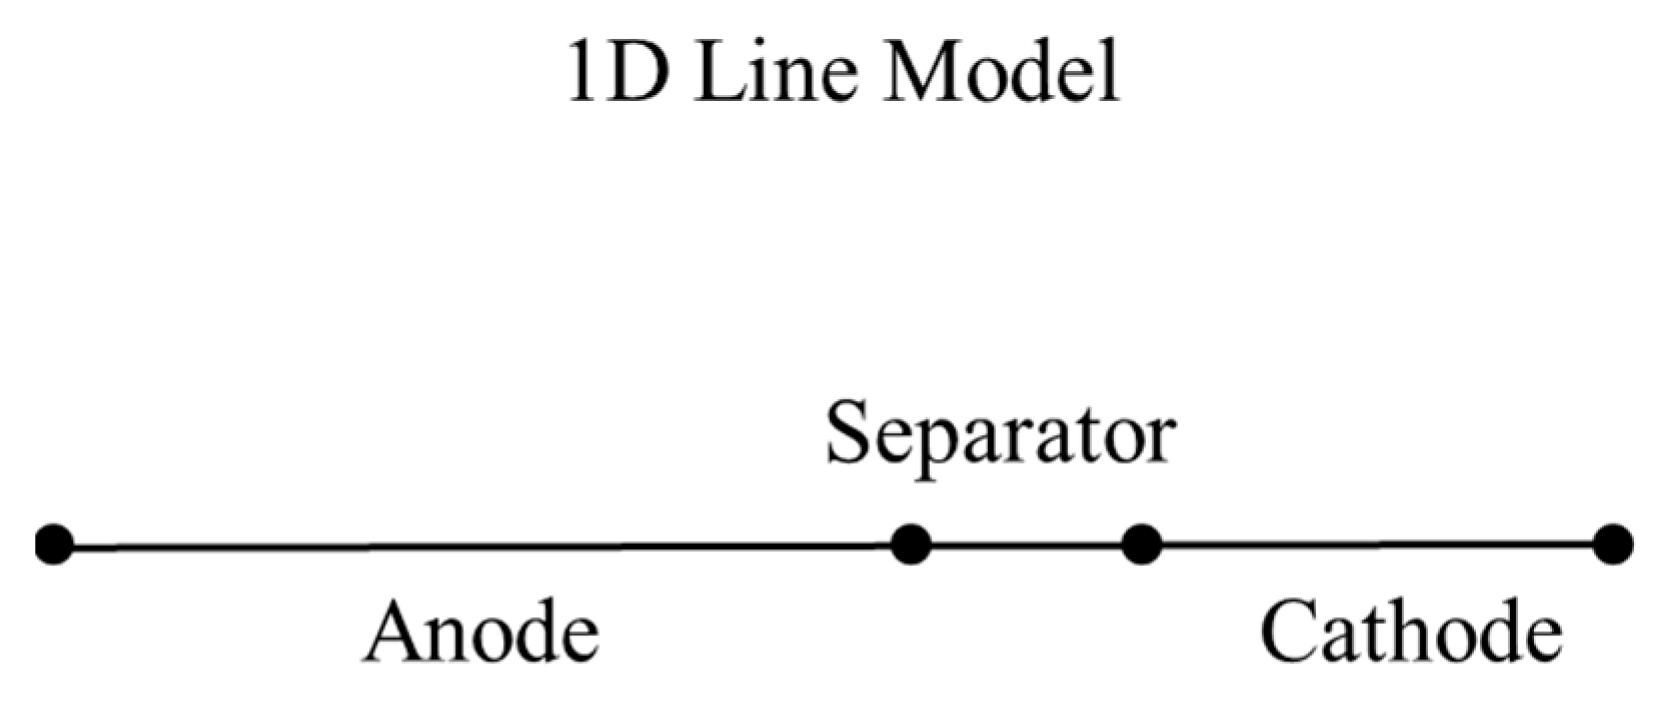
2.1. One-Dimensional (1-D) Battery Model
2.1.1. Solid Phase
2.1.2. Liquid Phase
2.1.3. Charge Transfer
2.1.4. Heat Generation
2.2. Lumped-Parameter Model
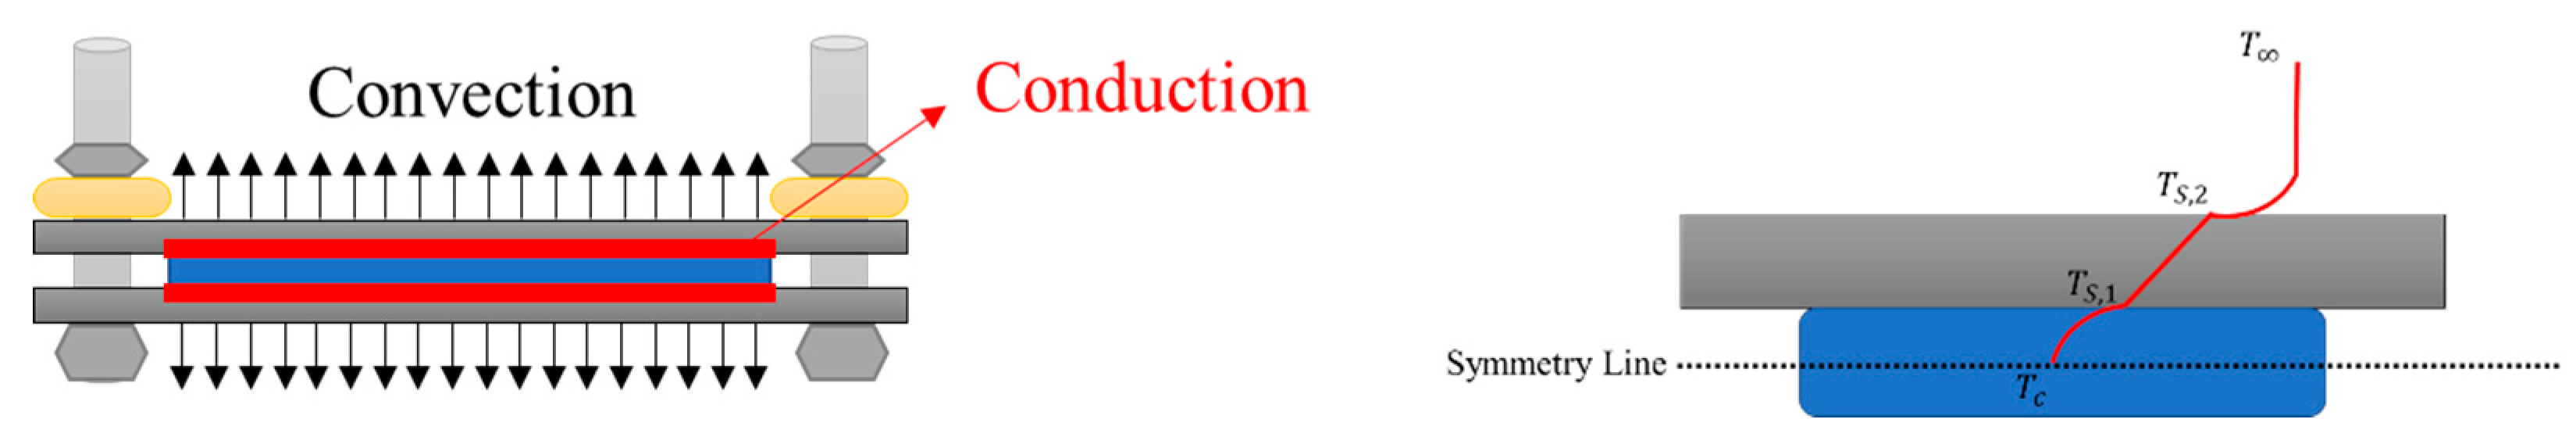
2.2.1. Thermal Model
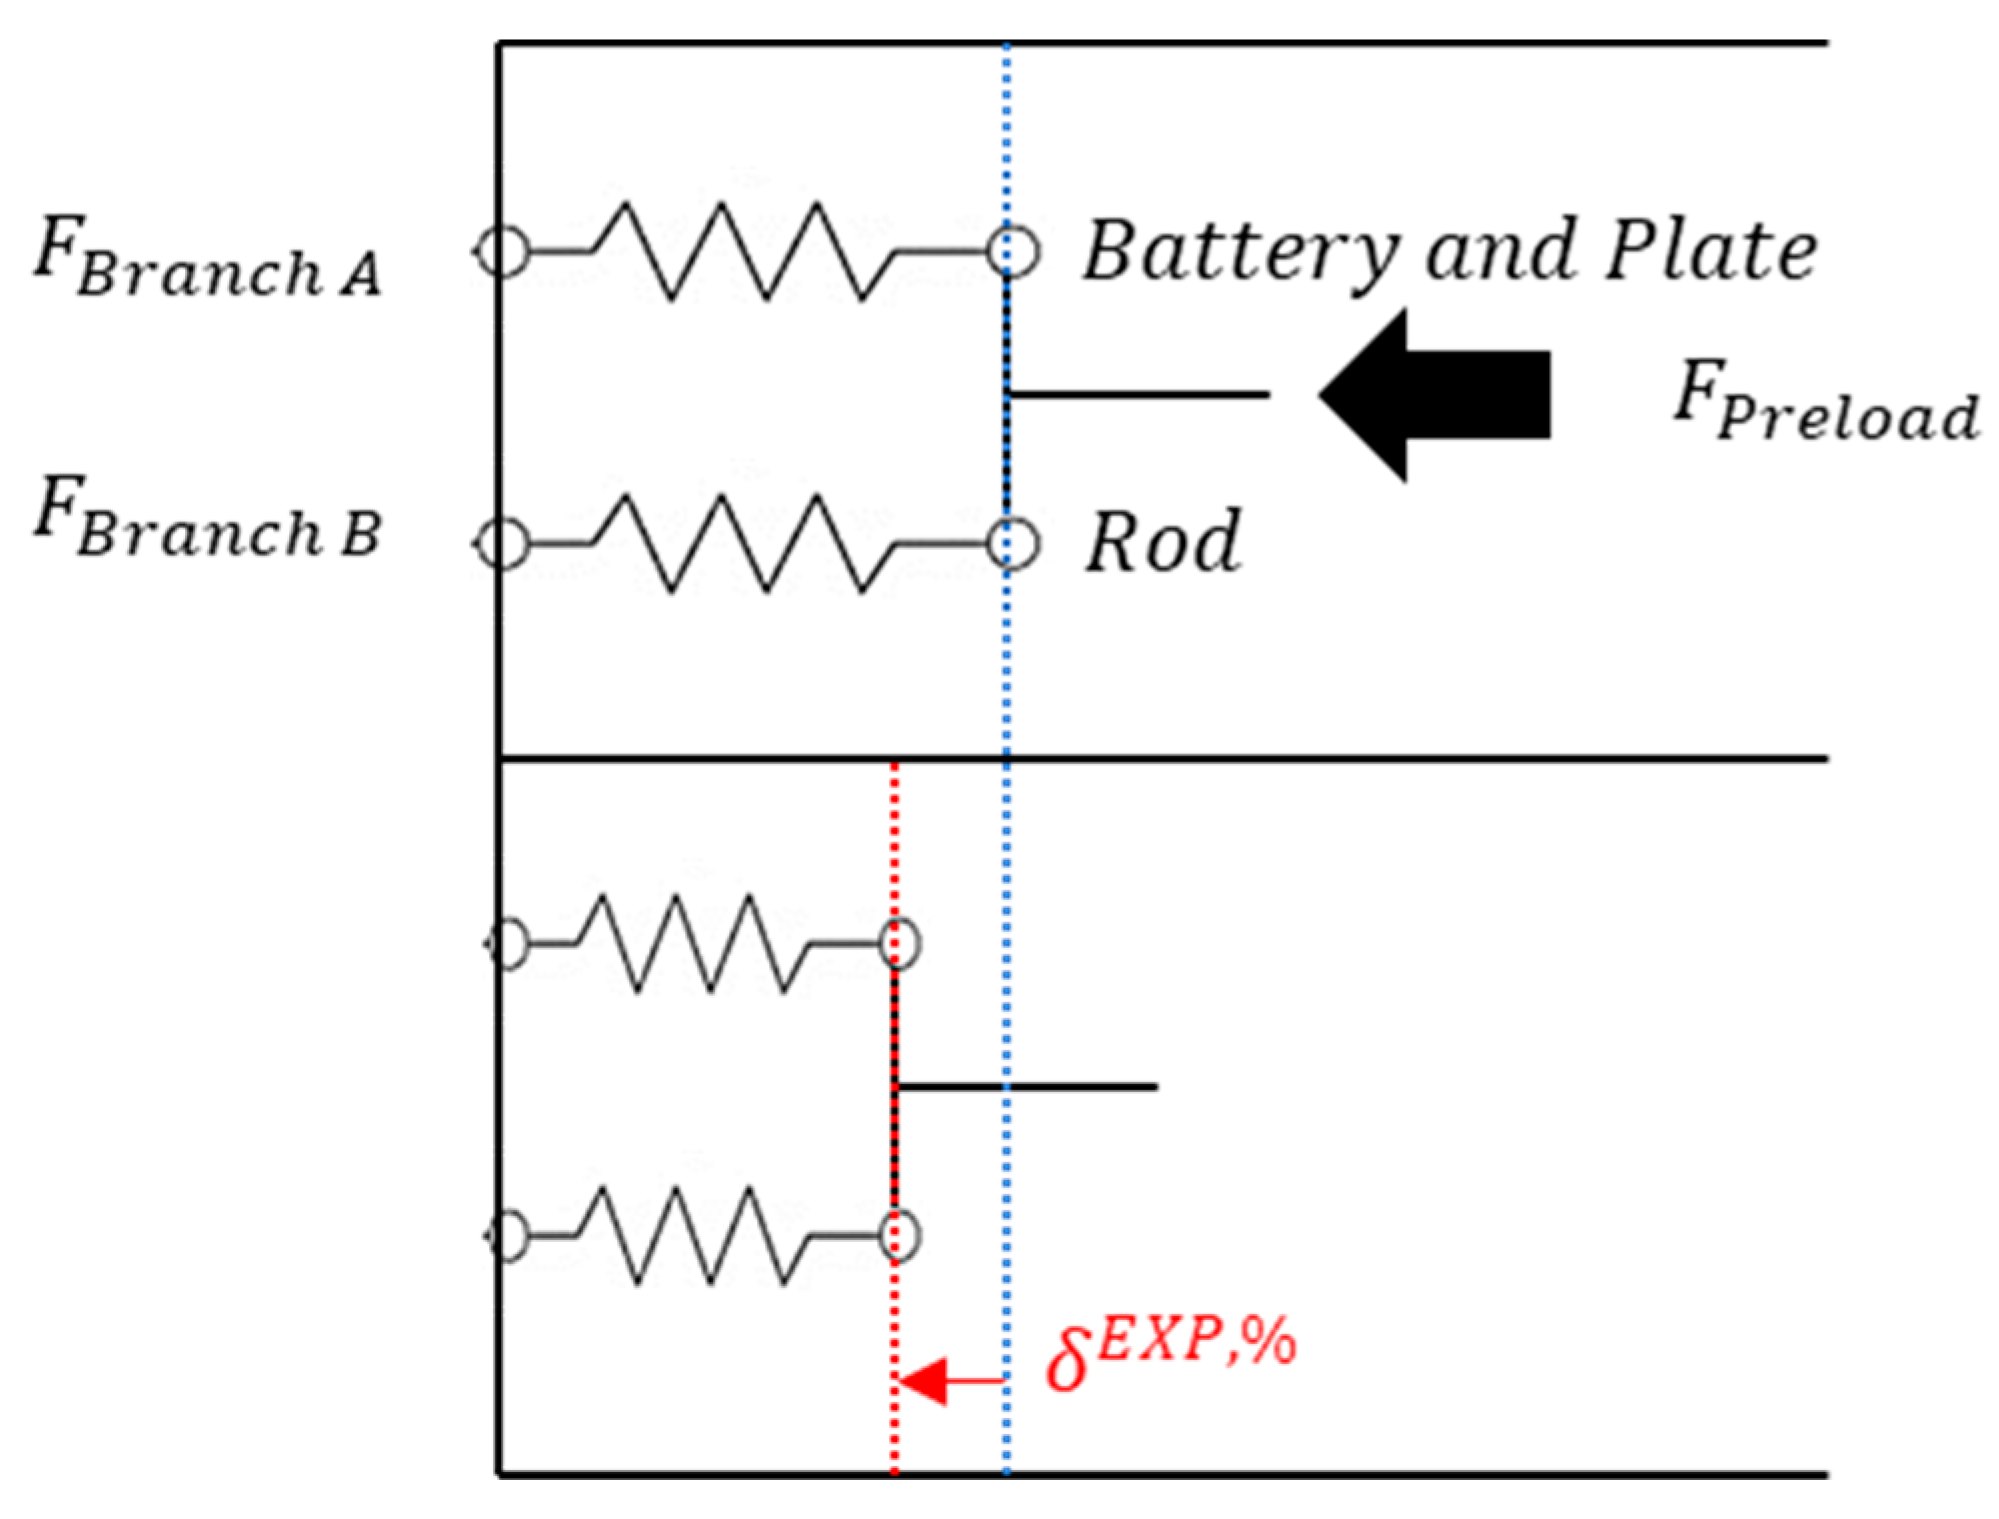
2.2.2. Spring Model
2.2.3. Coupling between Thermal and Mechanical Models
2.3. Solid Mechanics Model
3. Experimental Setup
3.1. Battery Cell
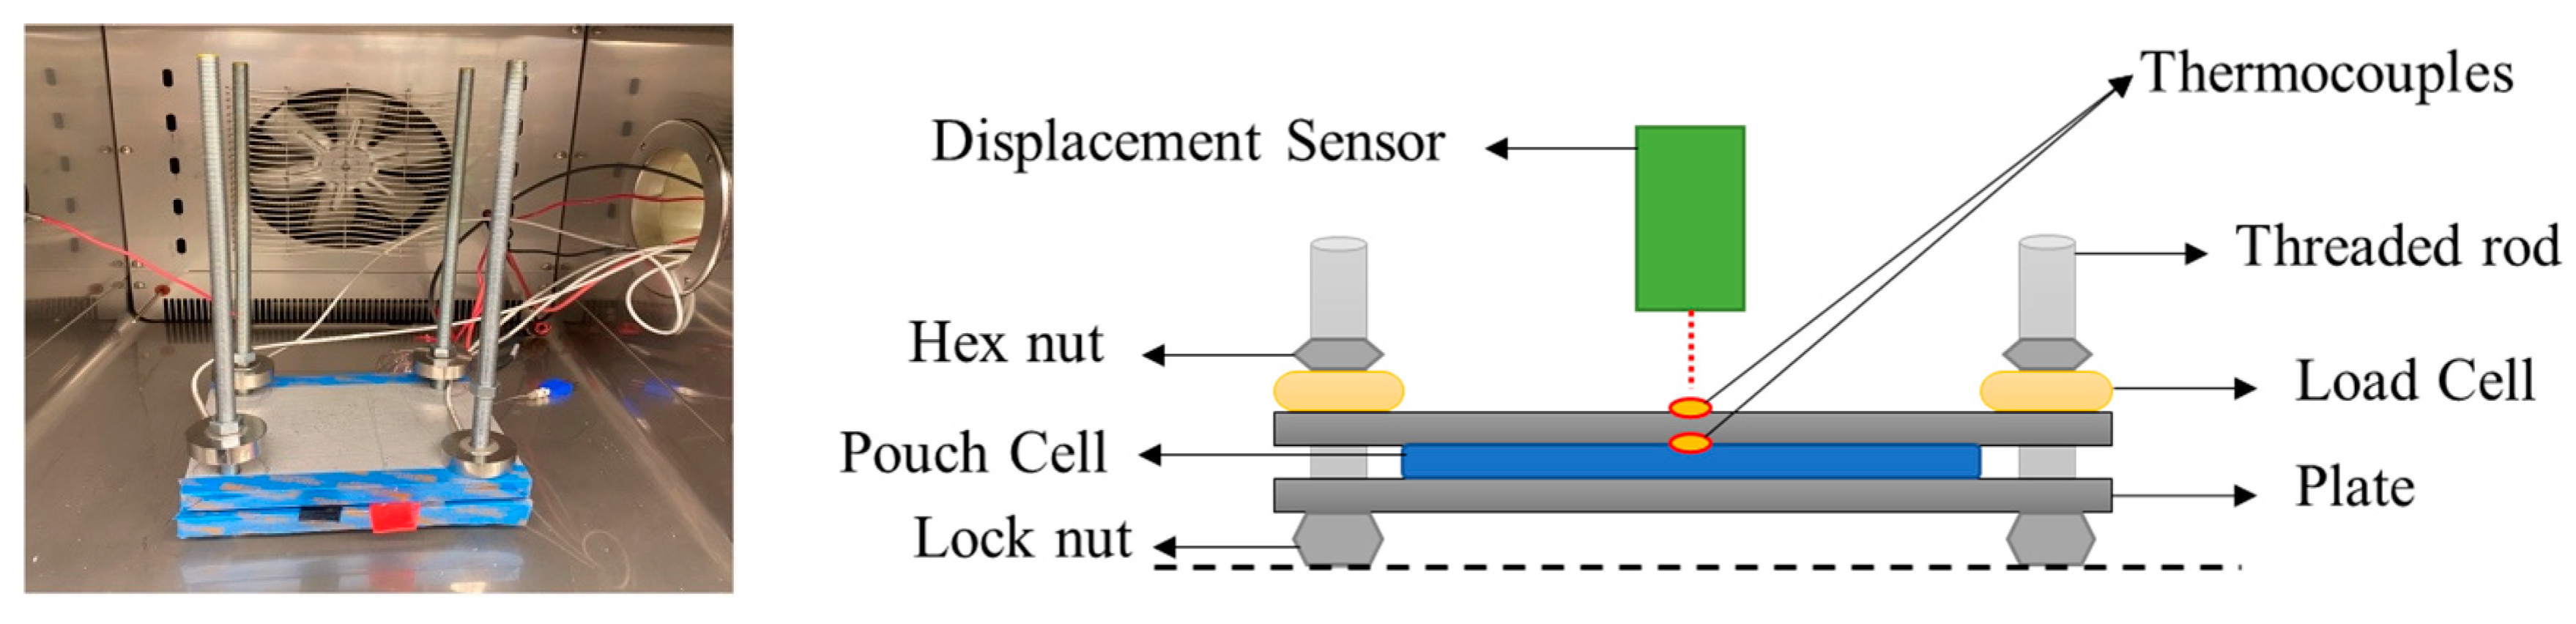
3.2. Cell Fixture and Instrumentation
4. Identification of LPM Parameters
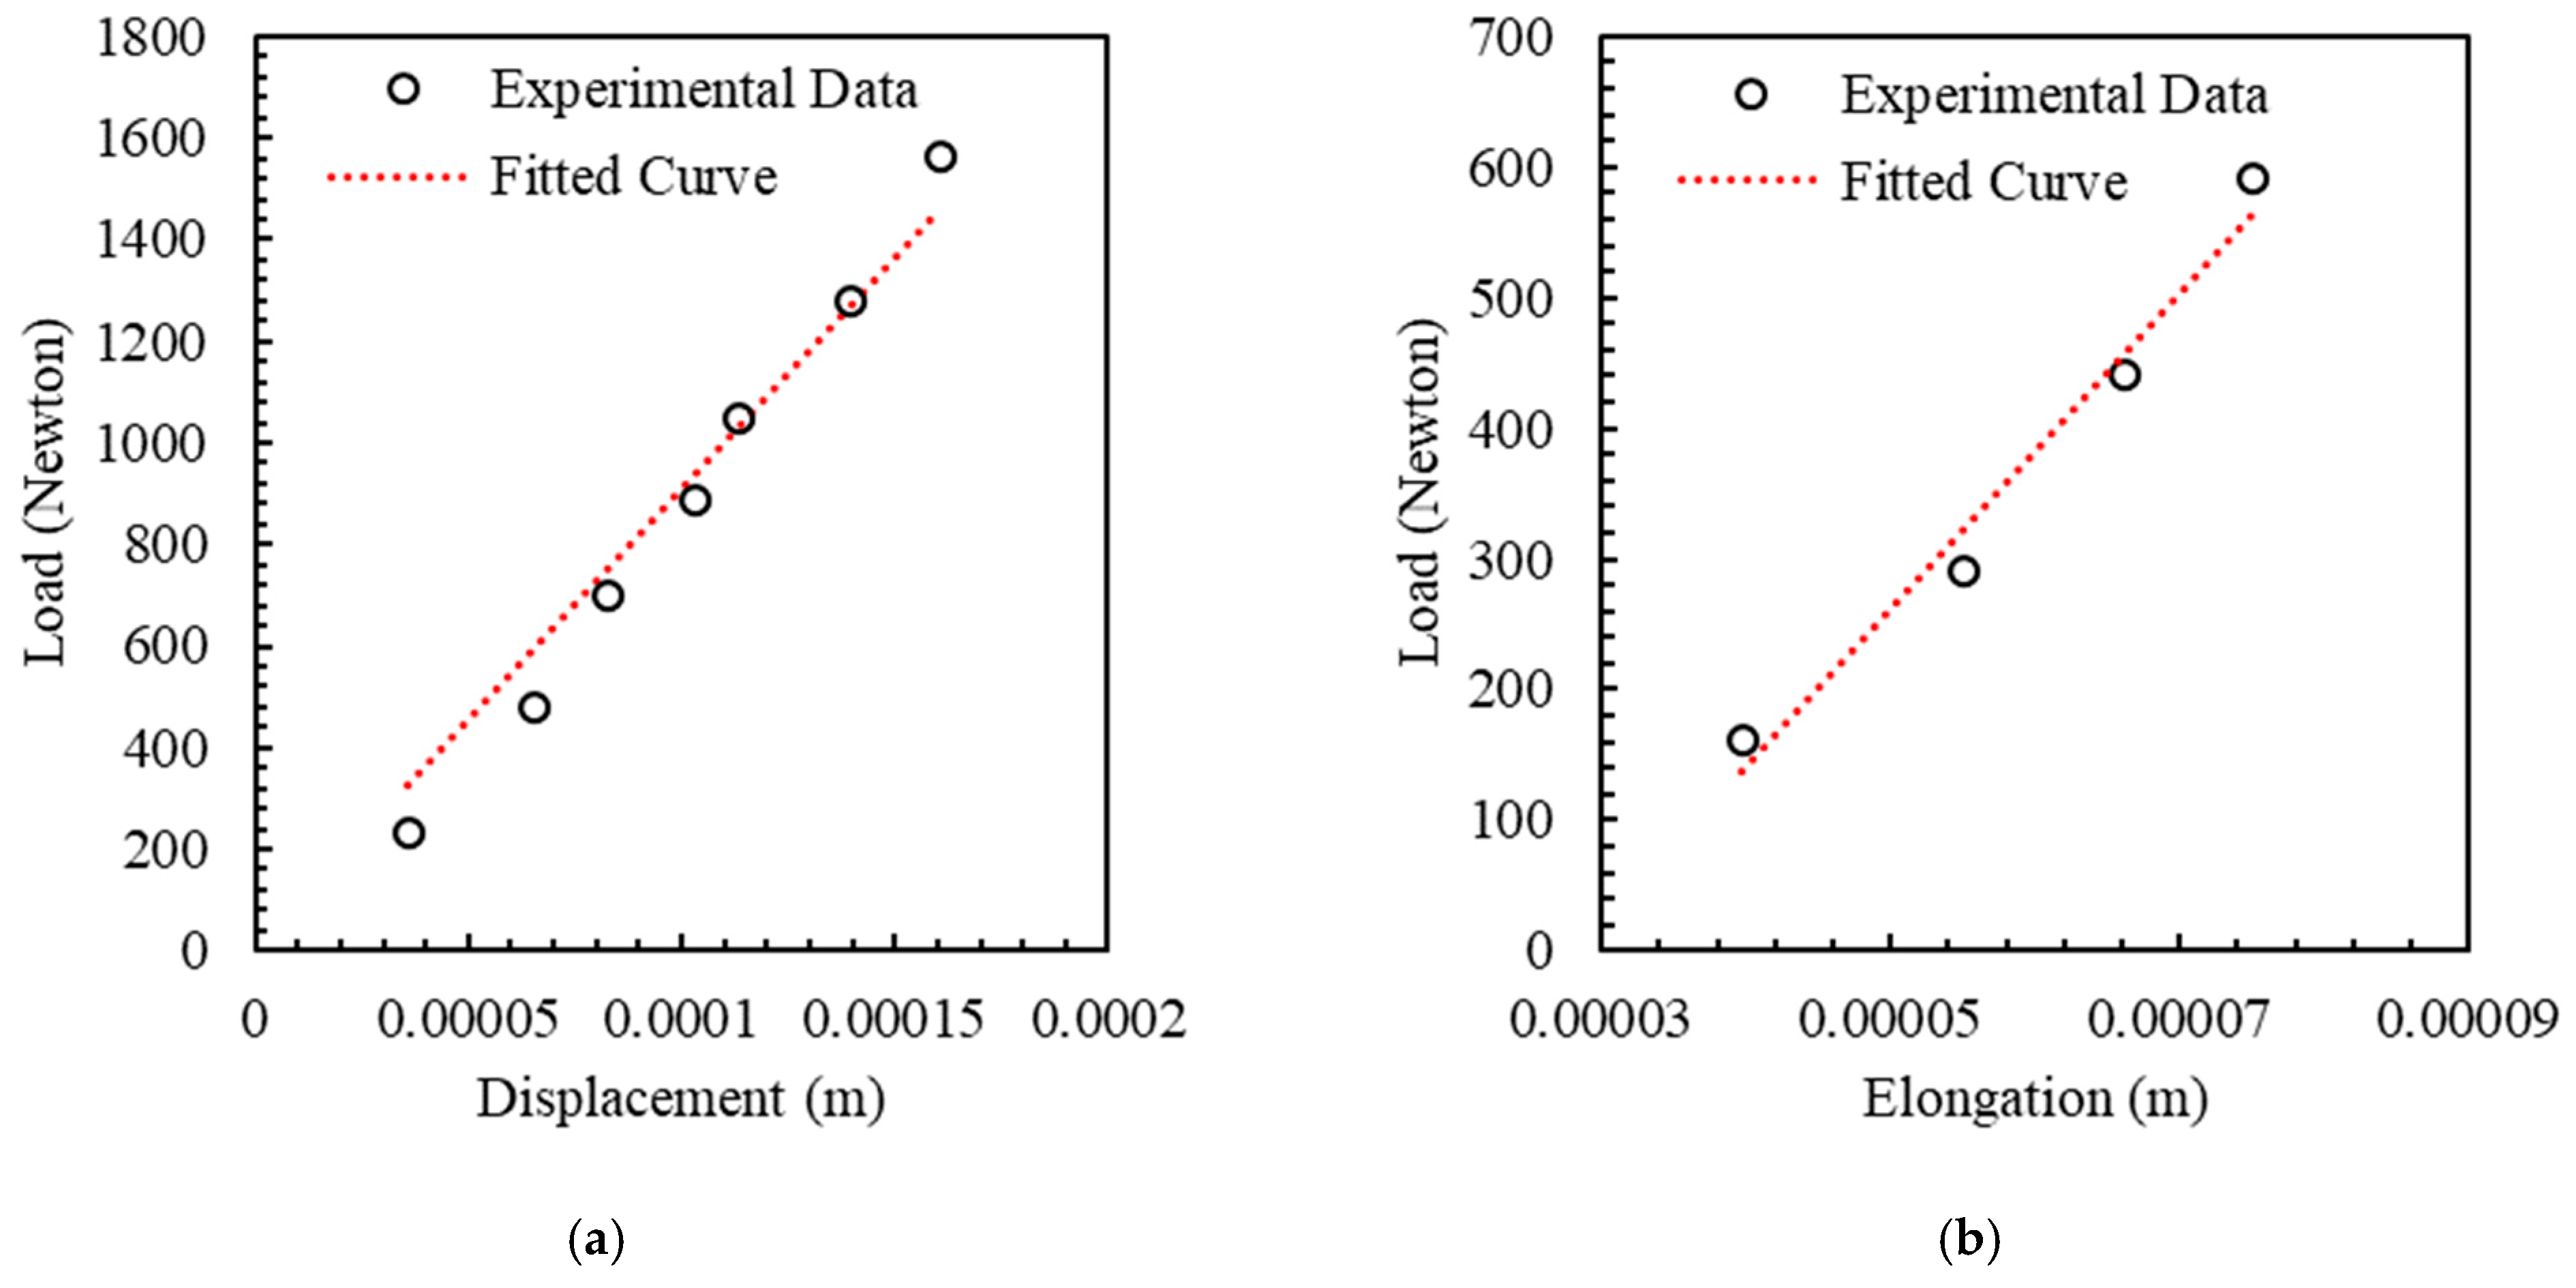
4.1. Experiments for Measurement of Stiffness
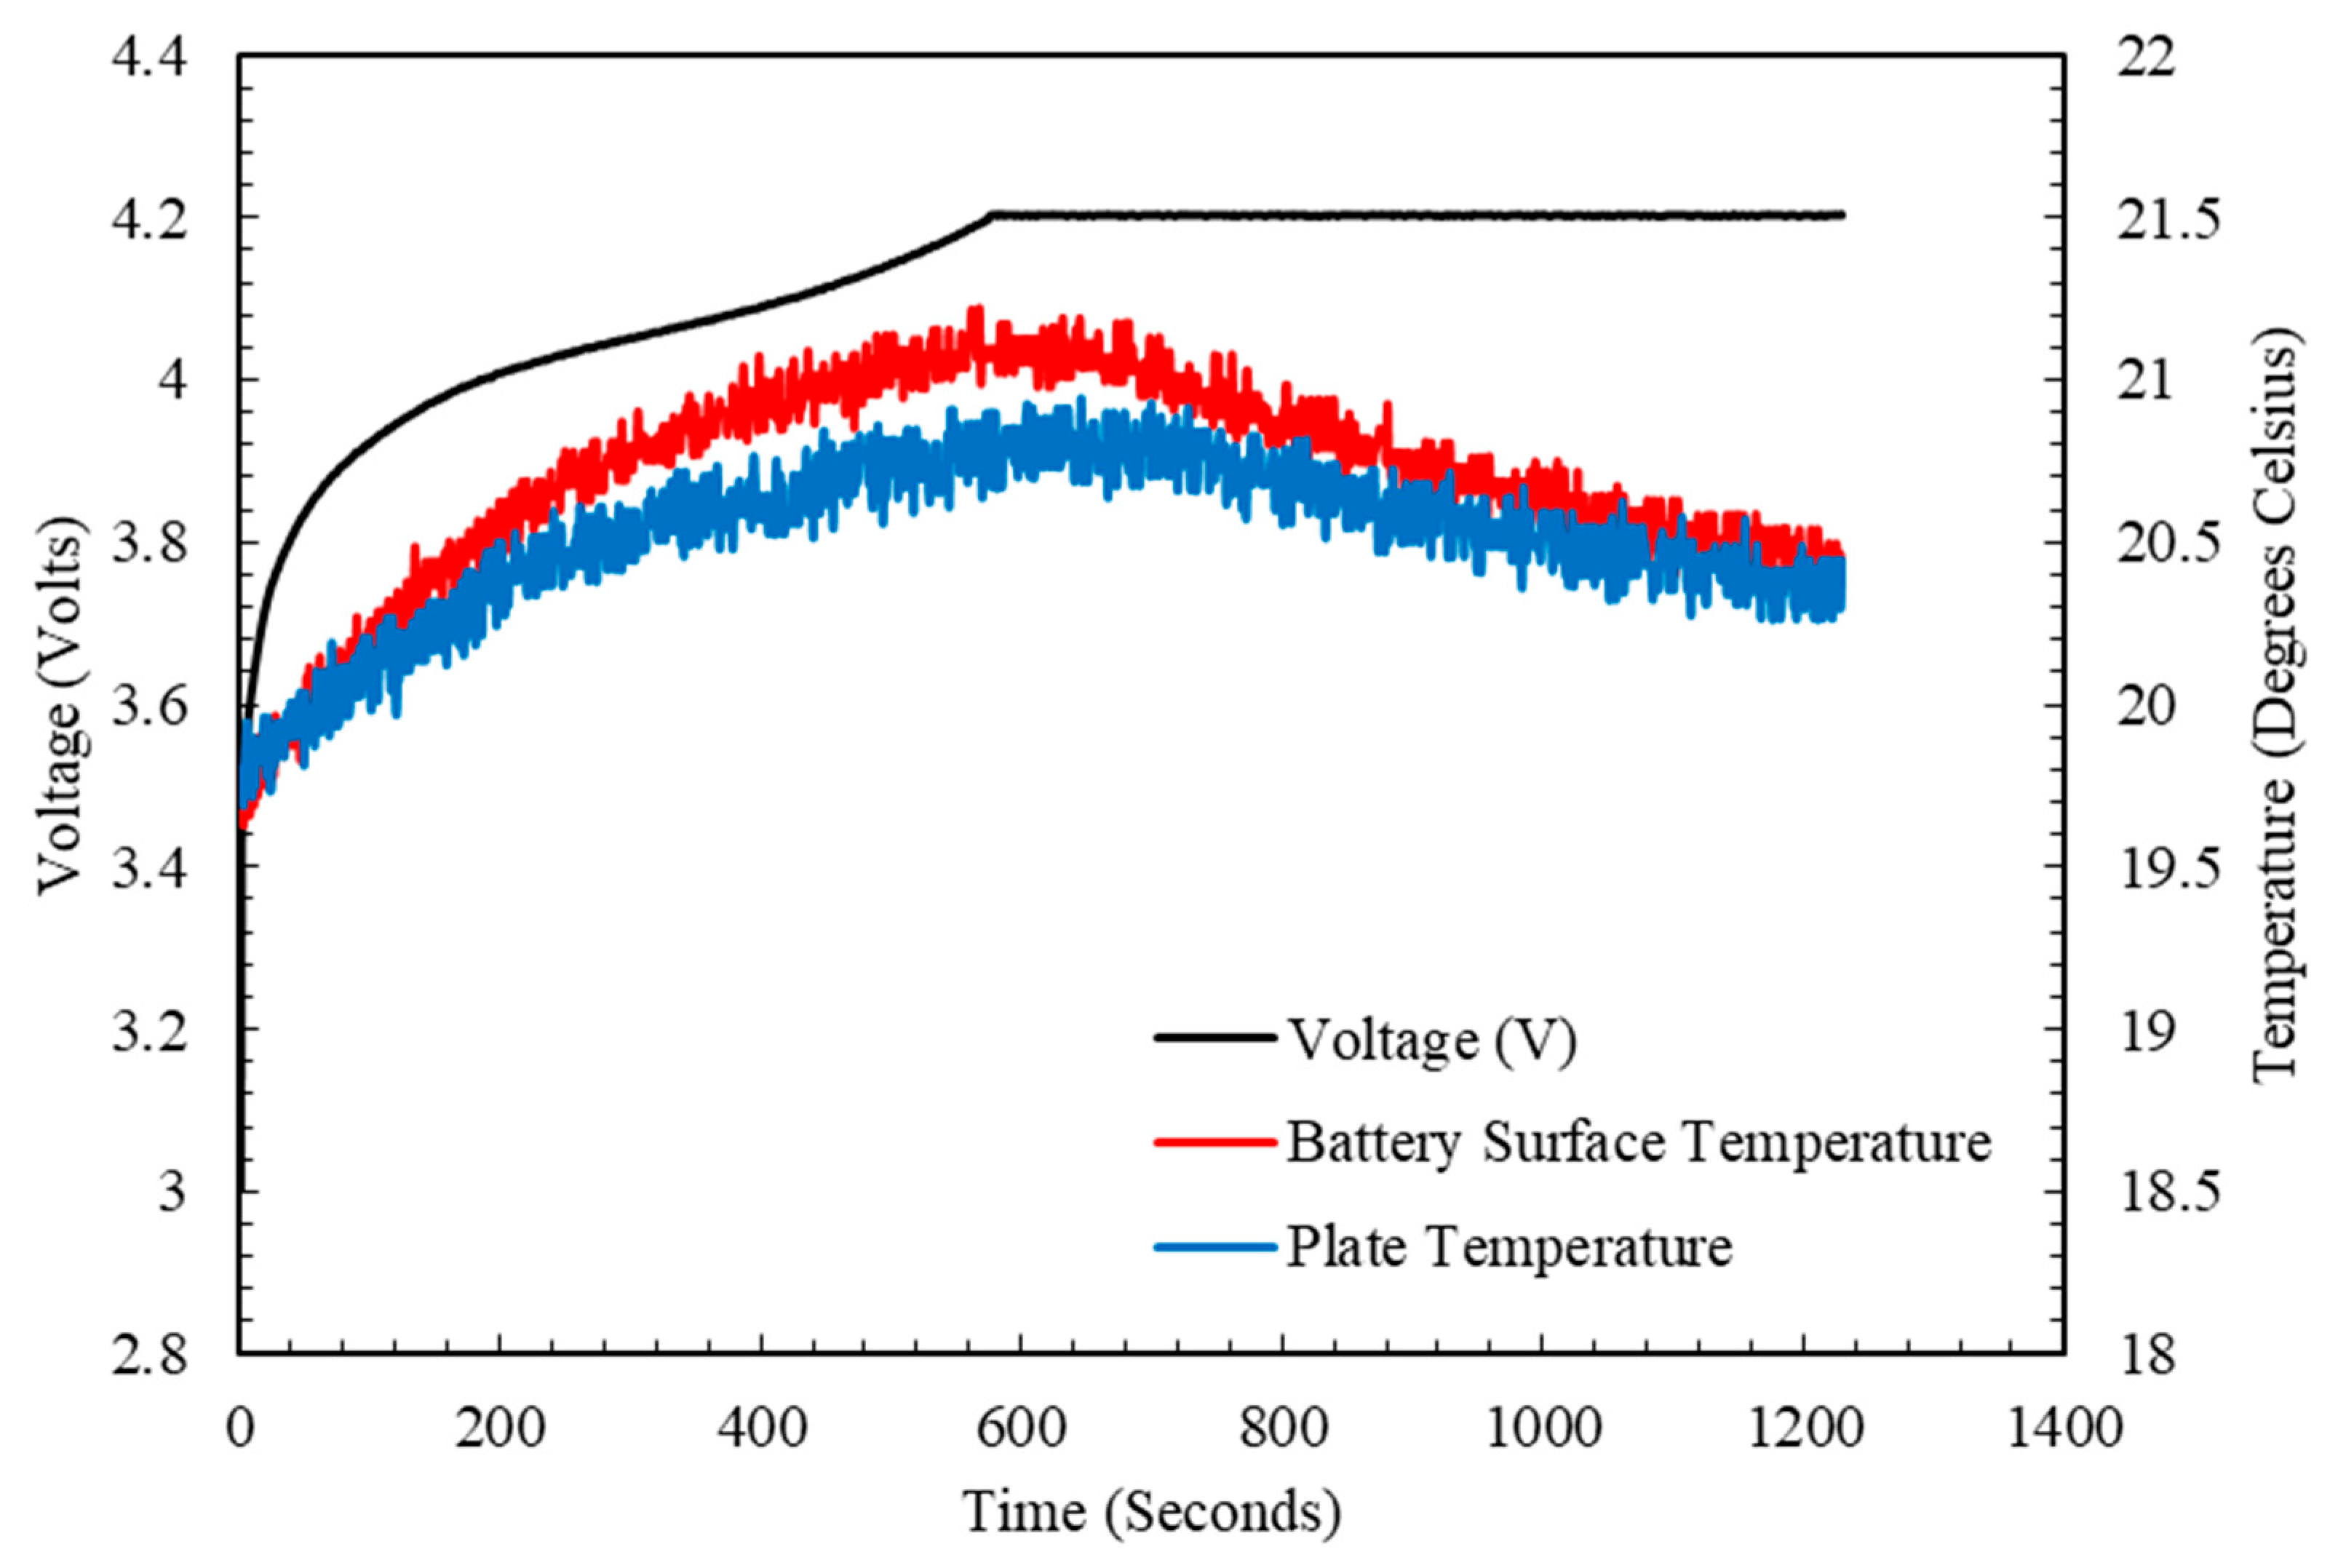
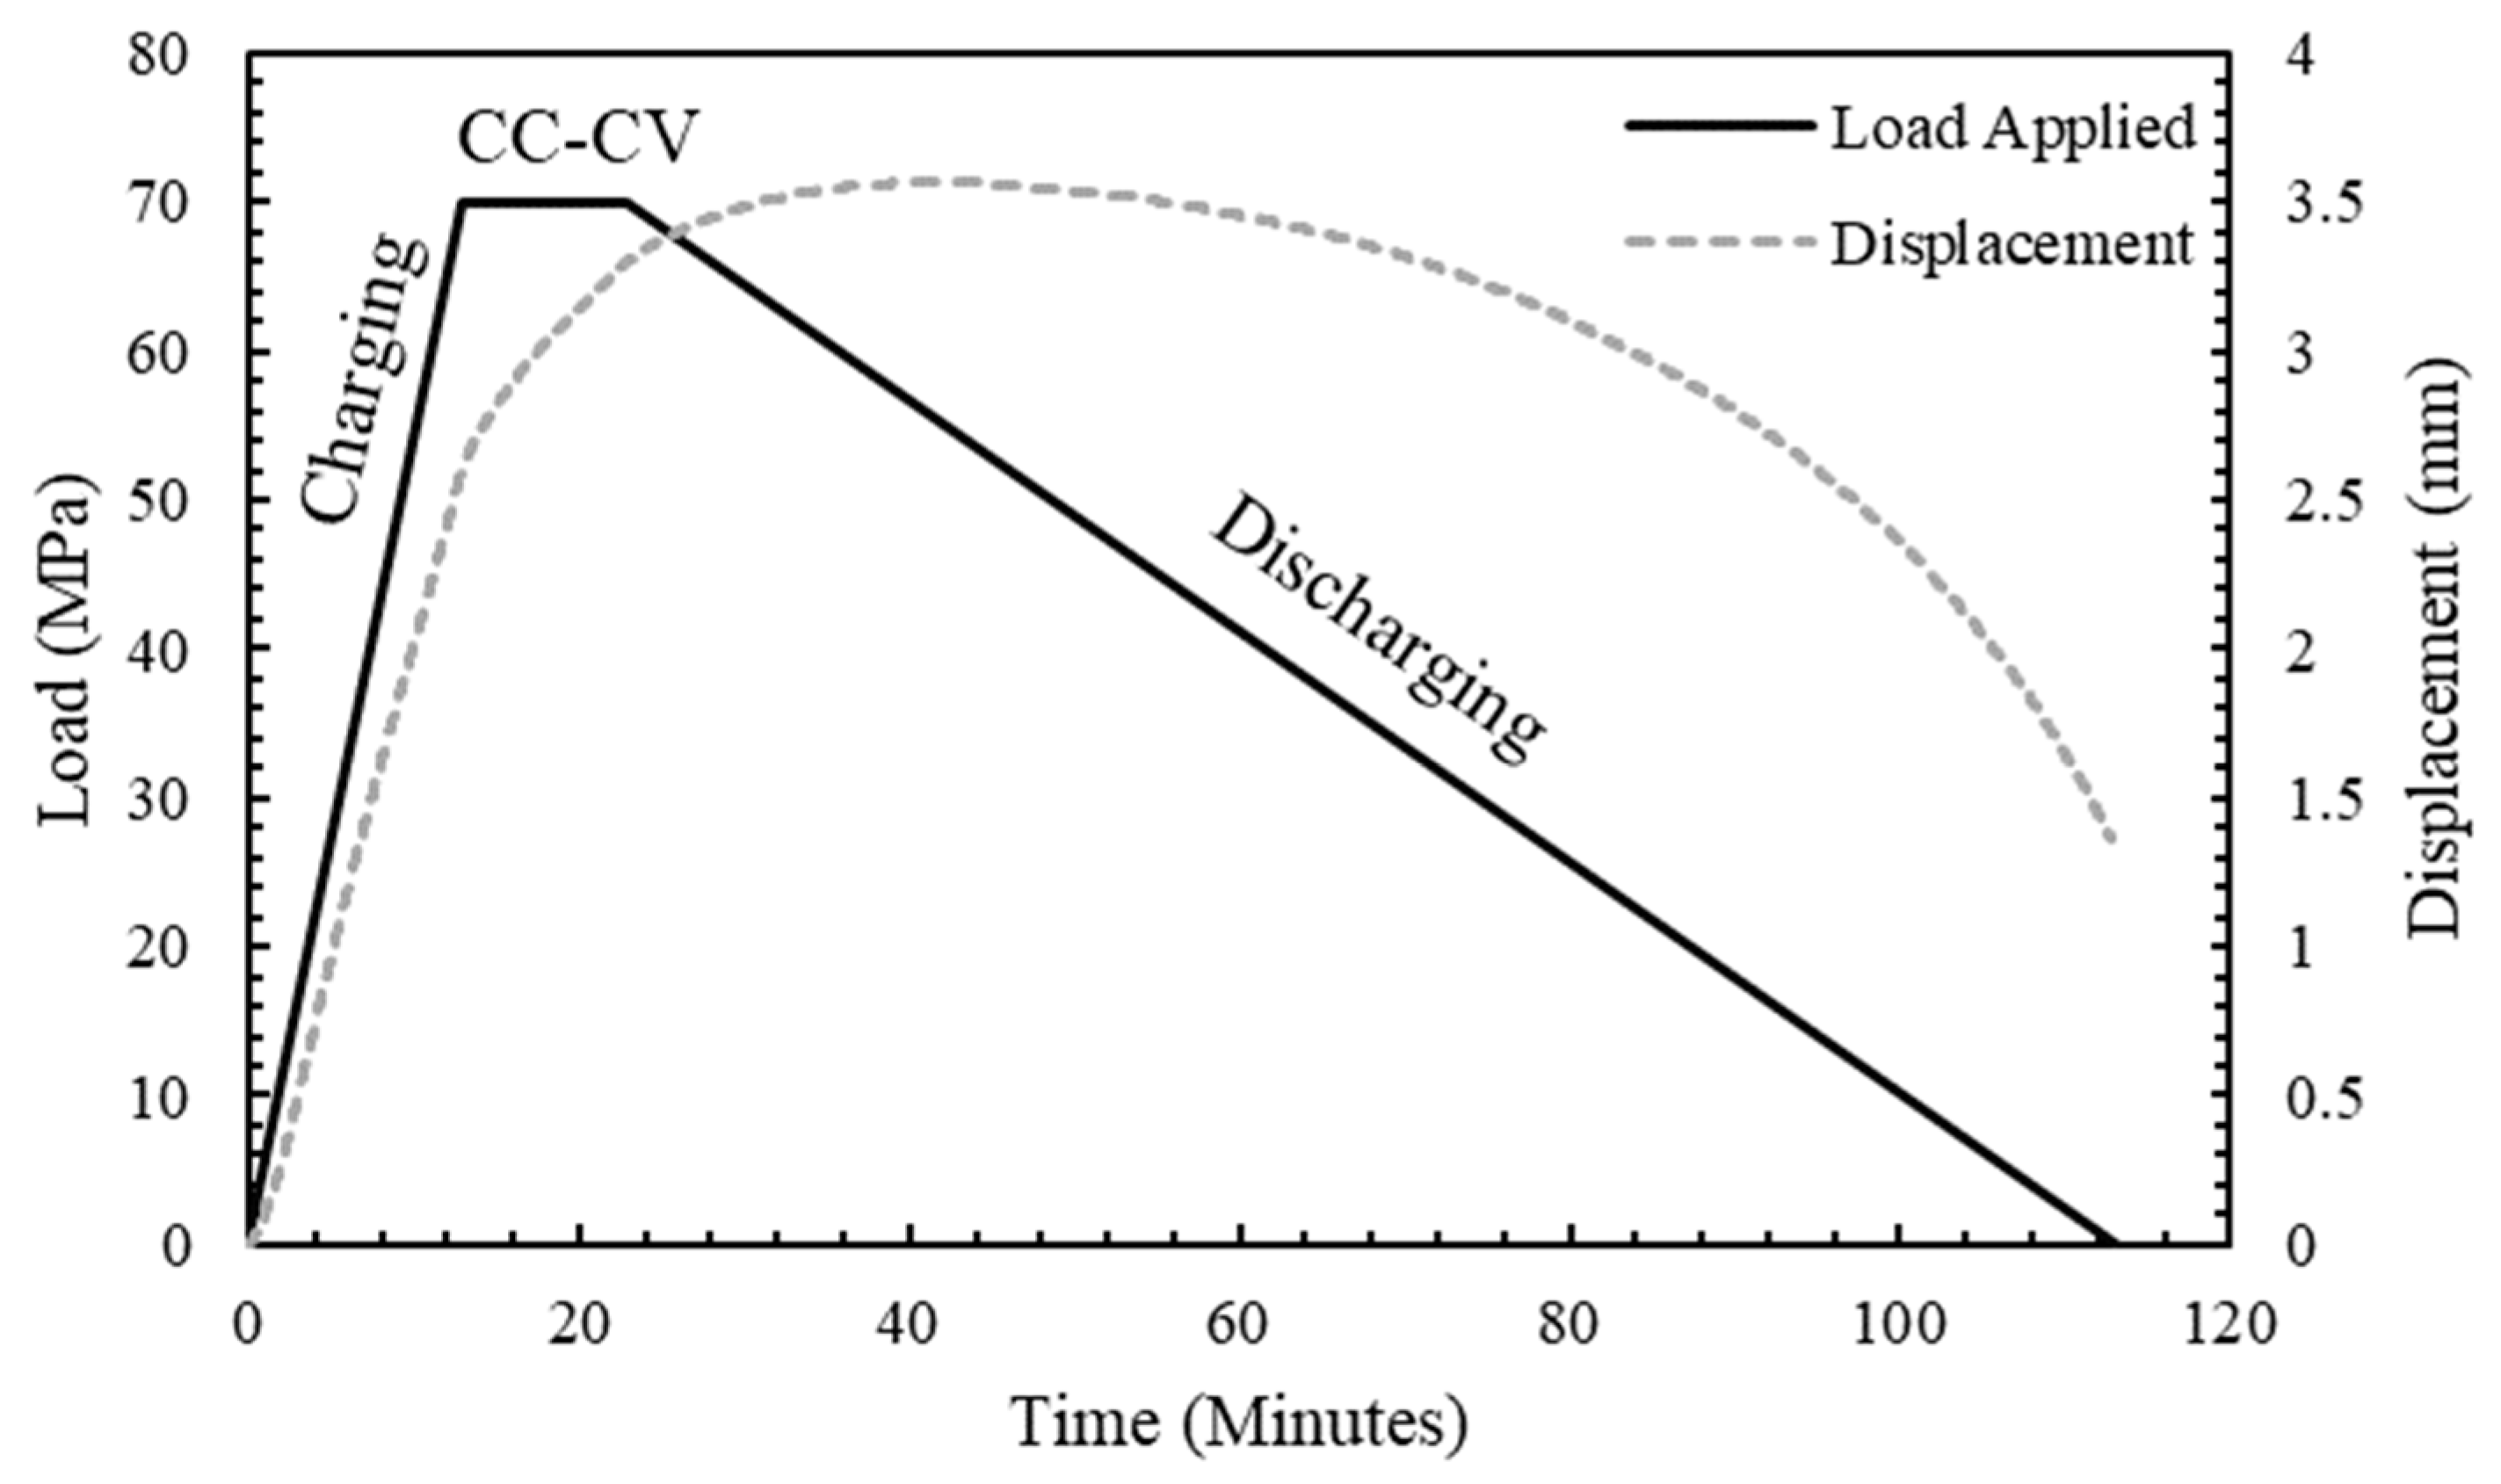
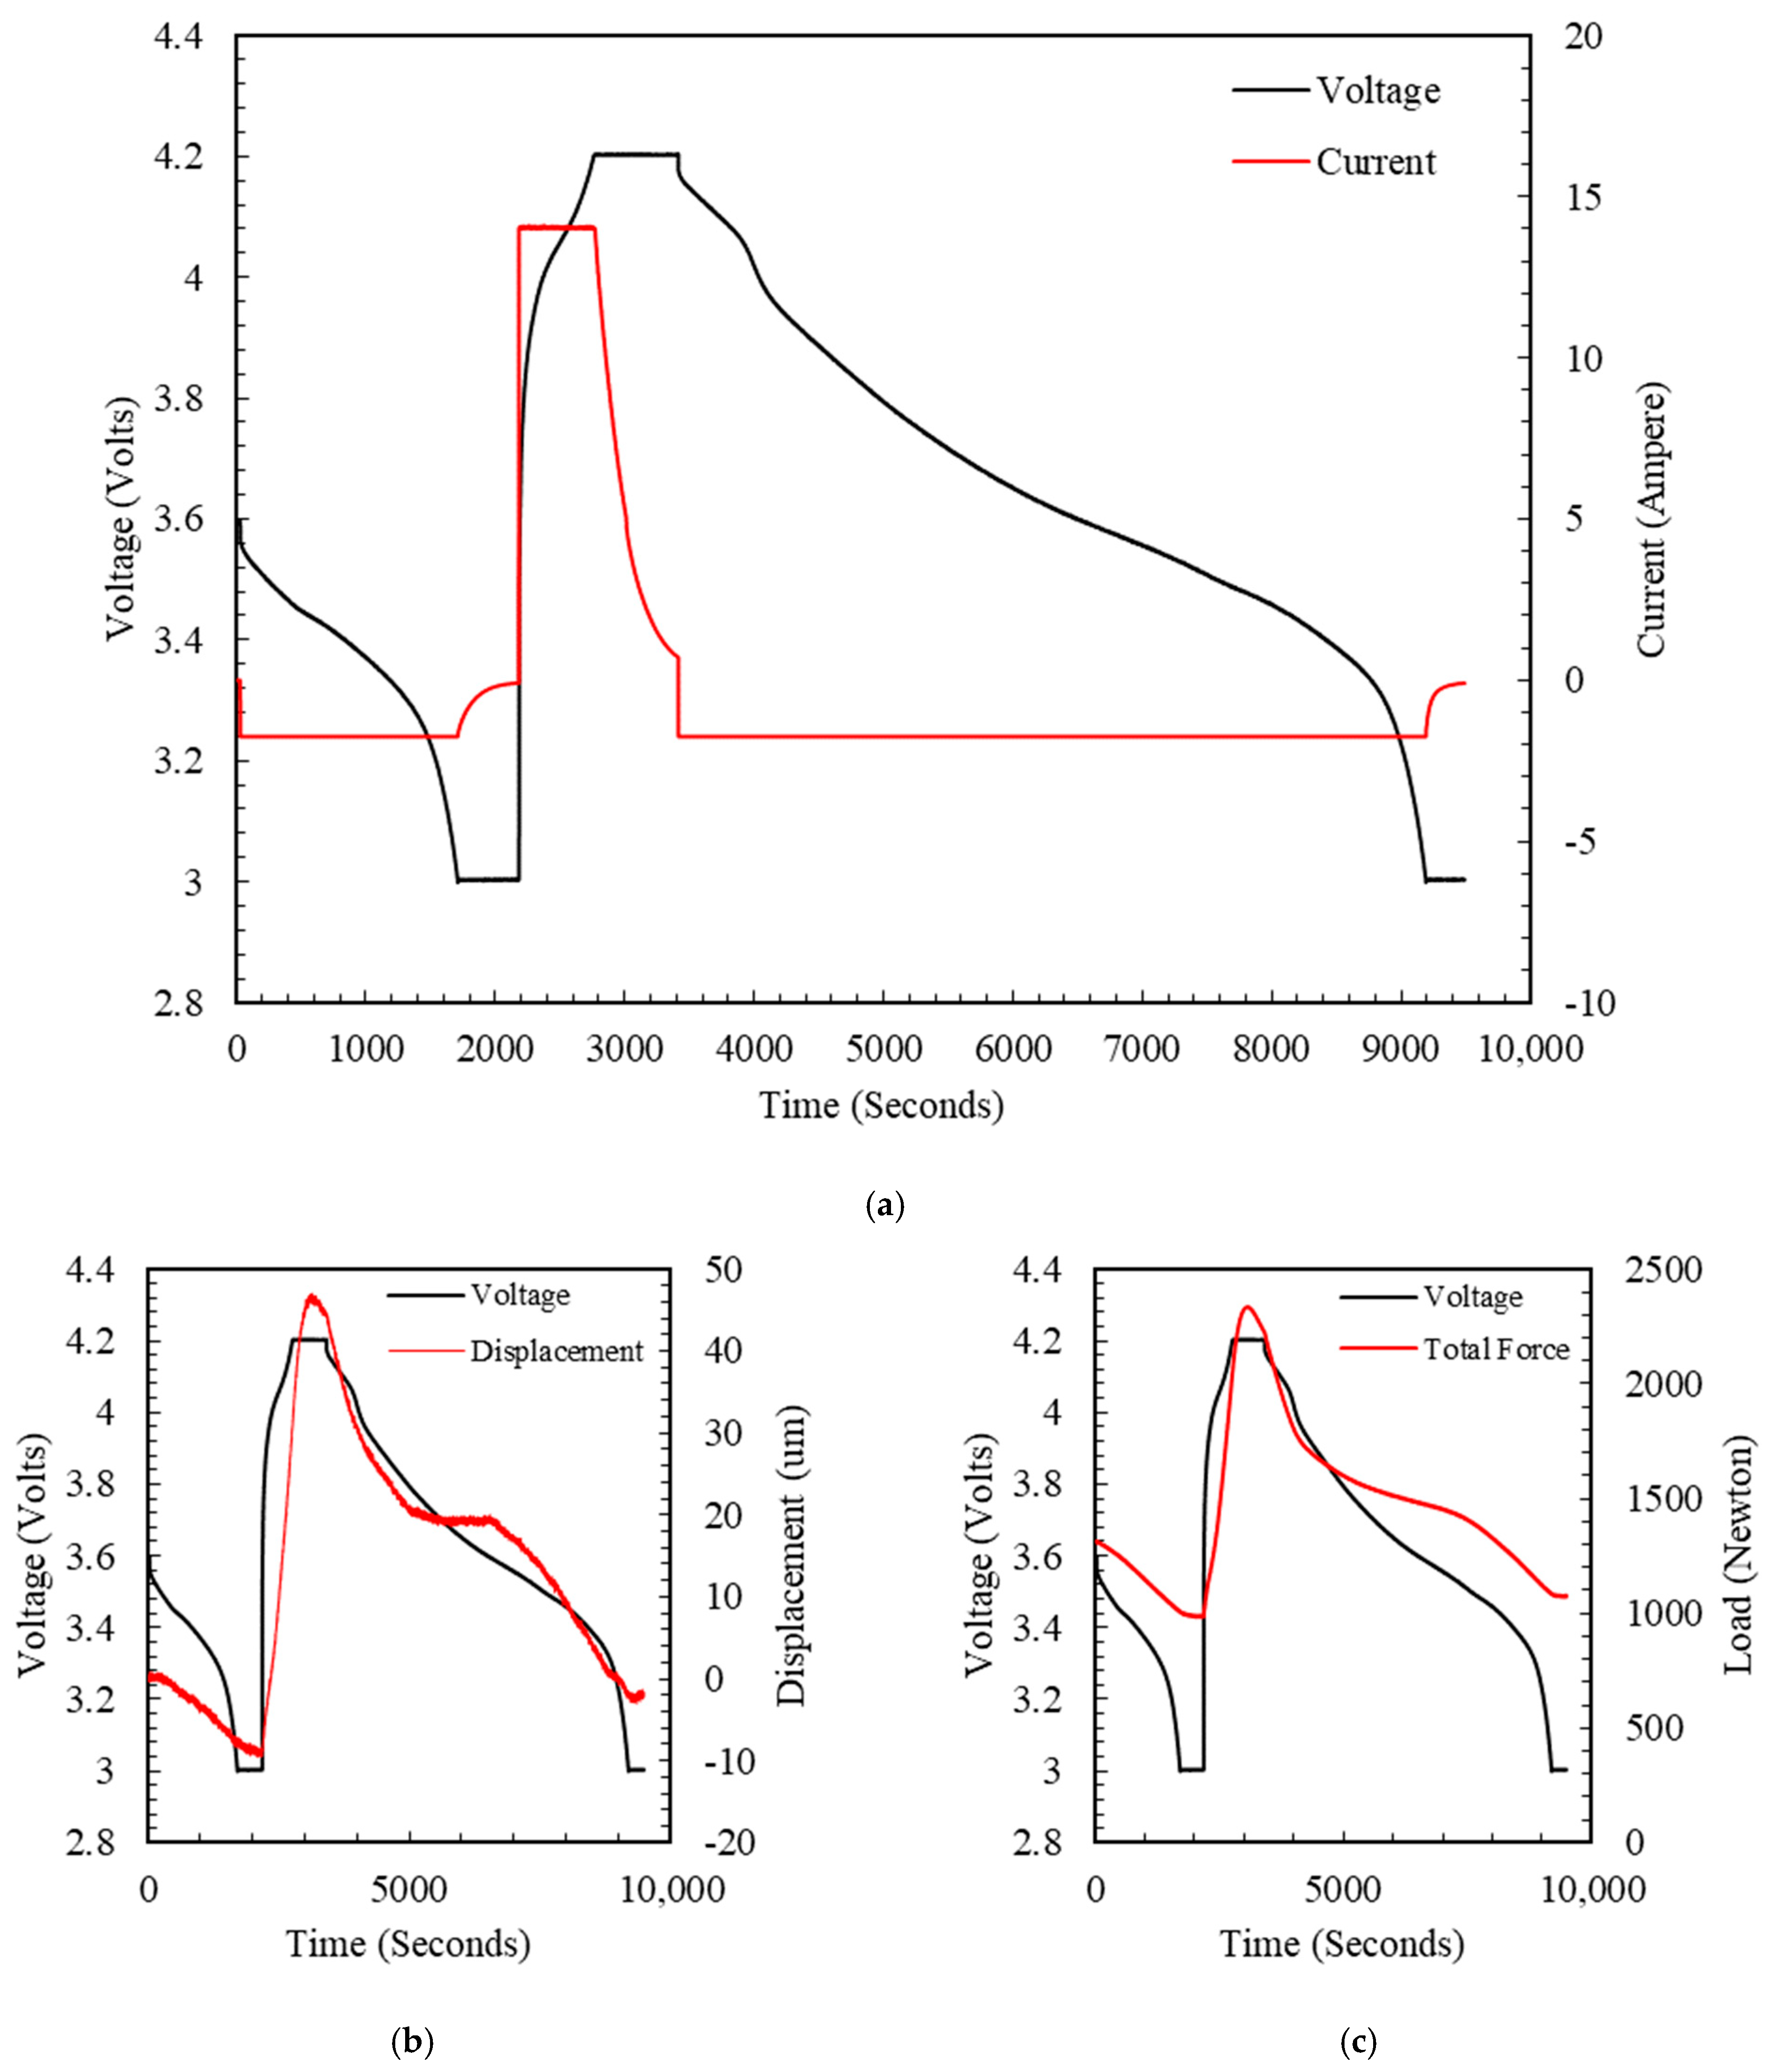
4.2. Charging and Discharging Test
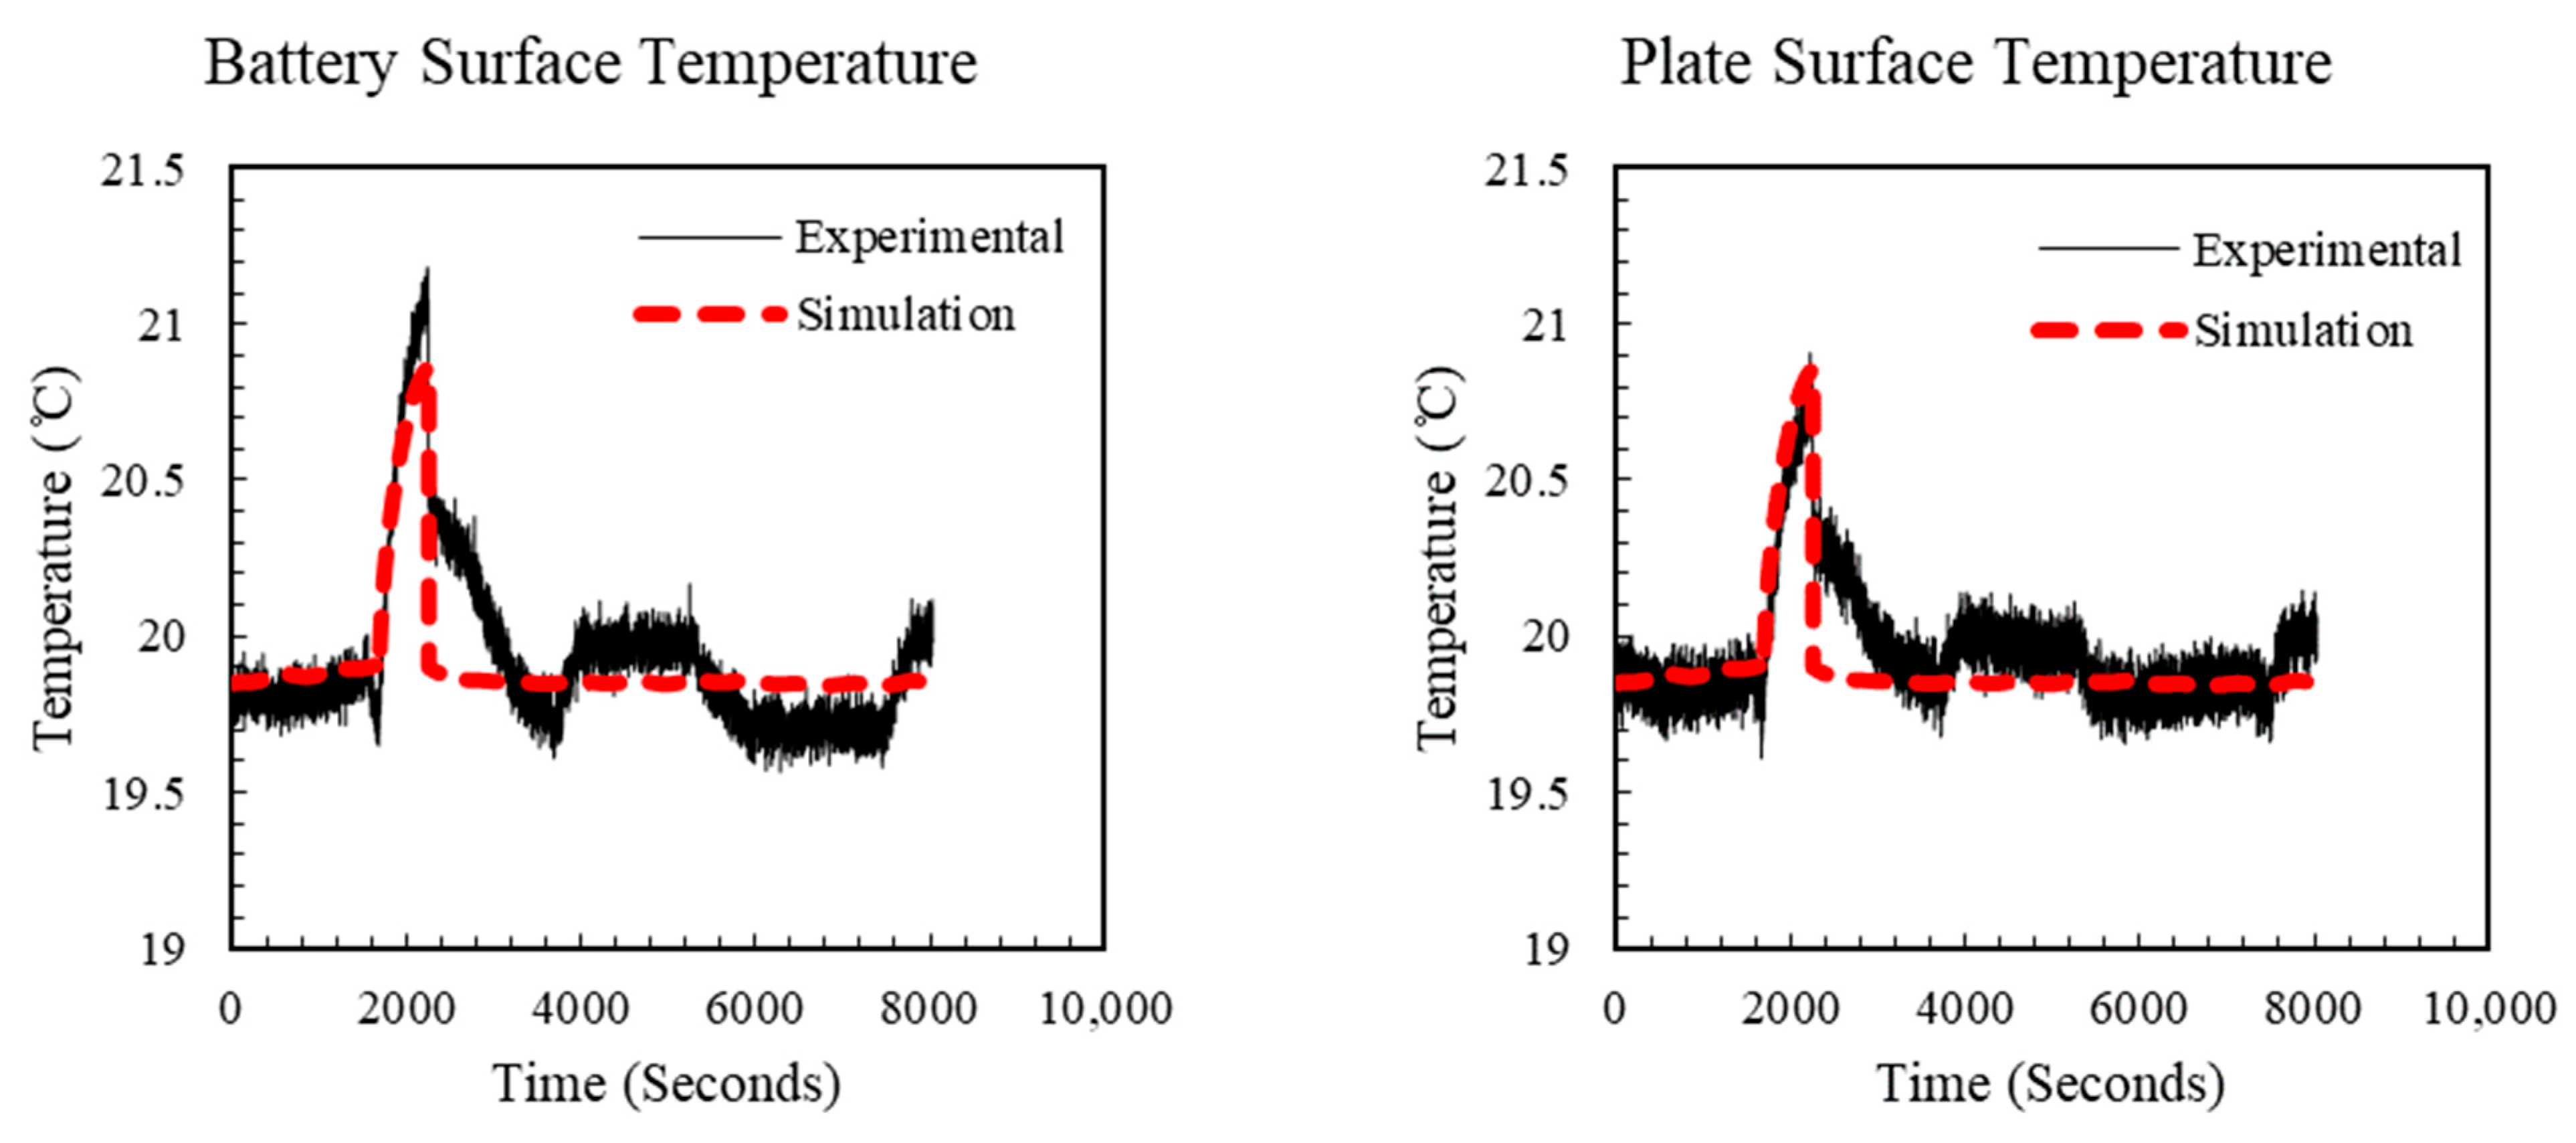
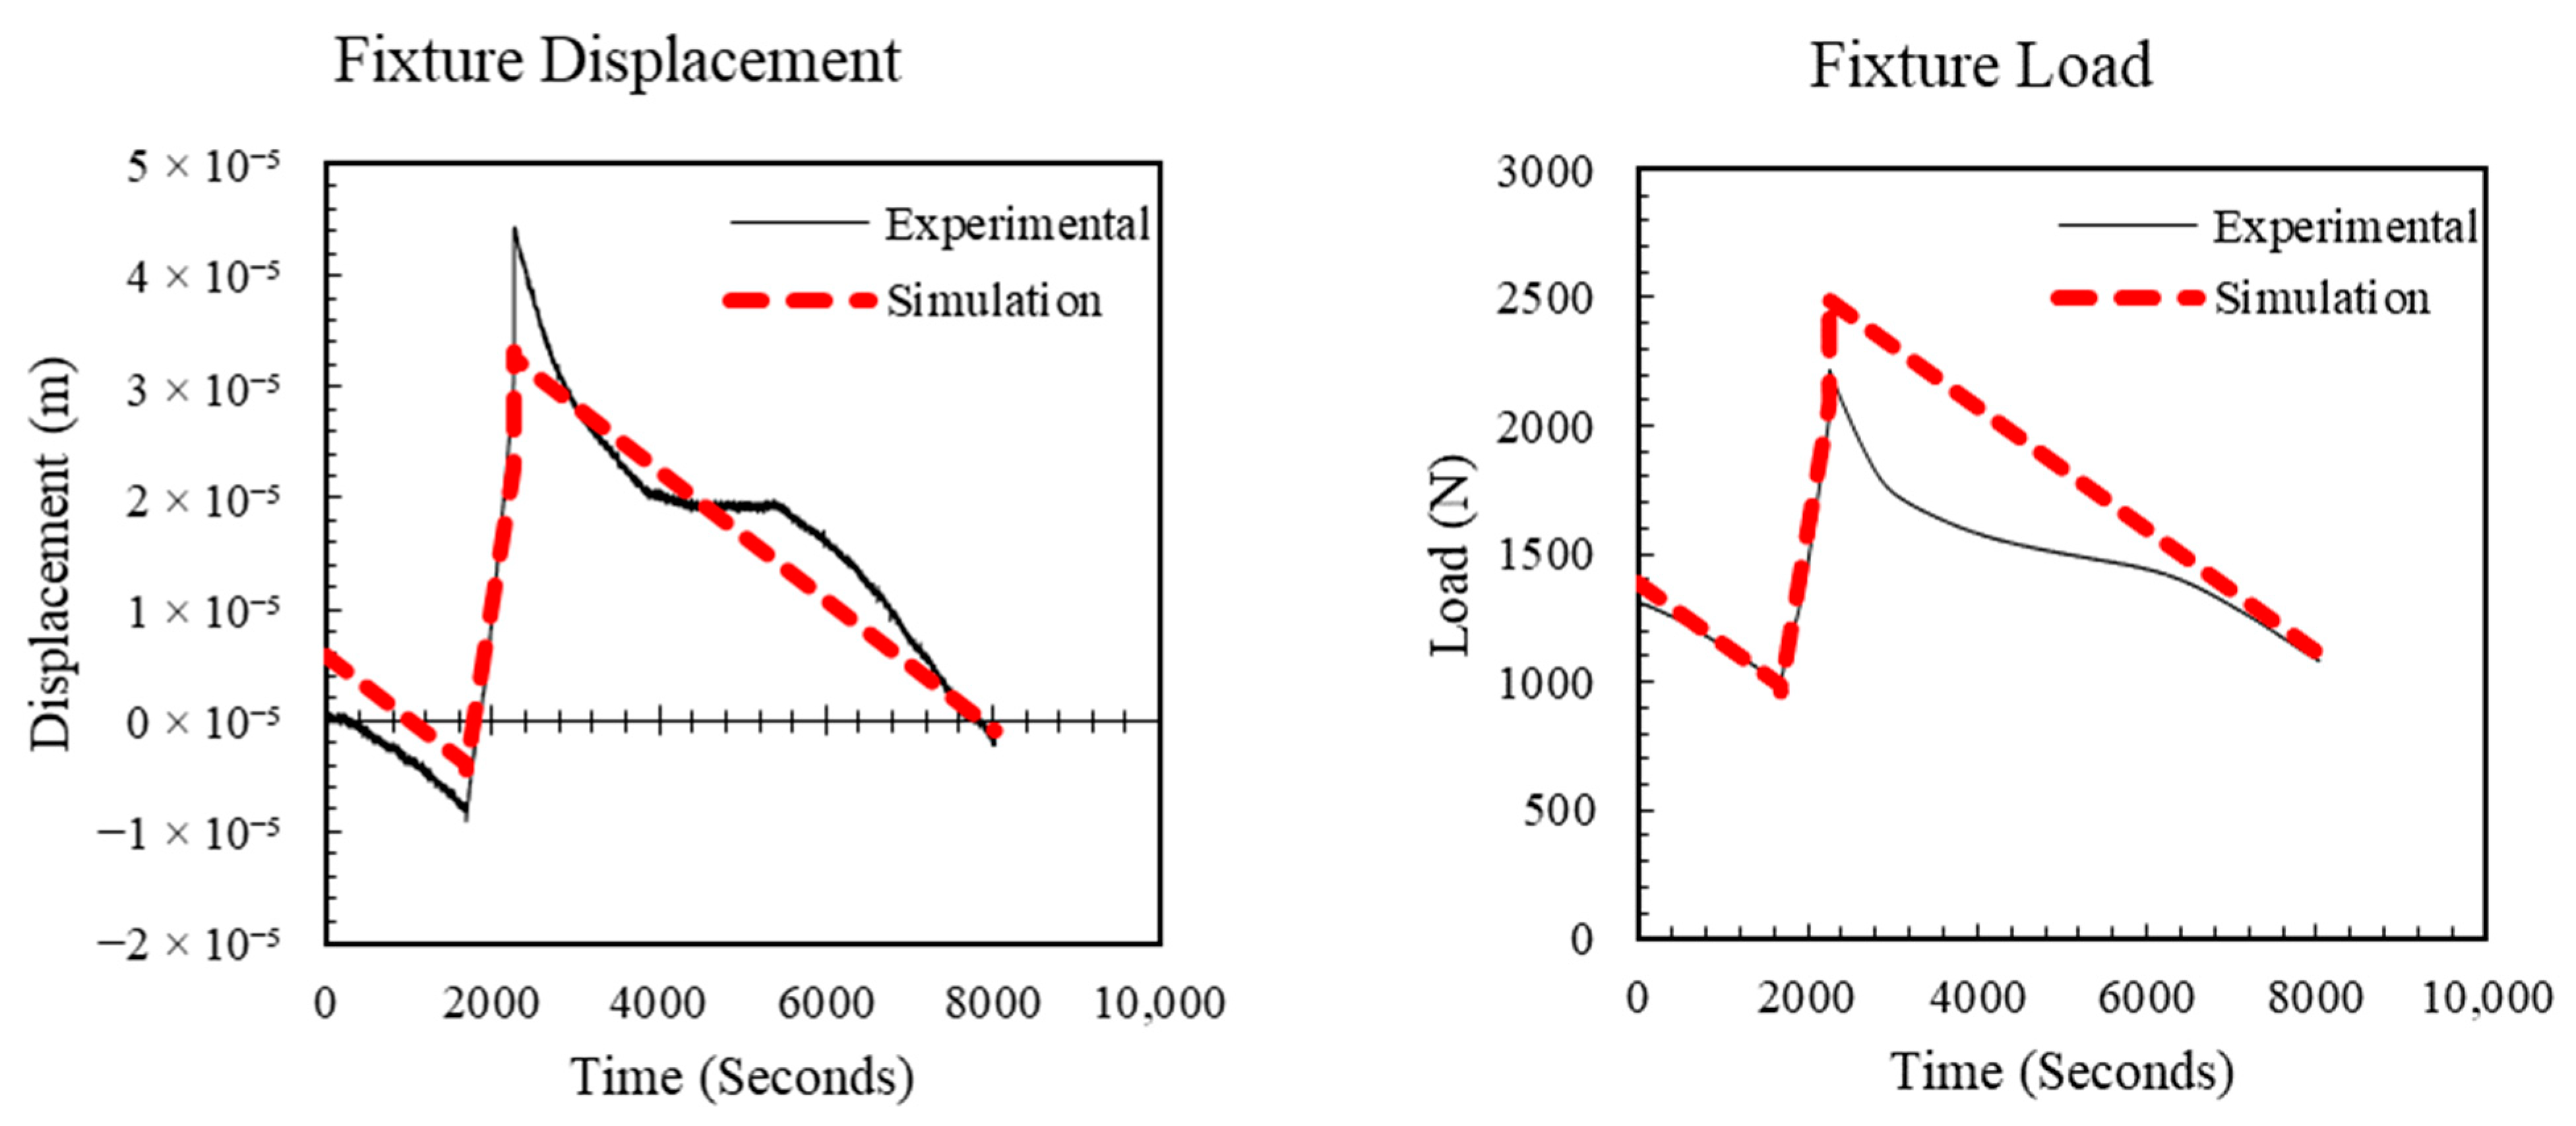
4.3. LPM Parameters
5. Simulation Study
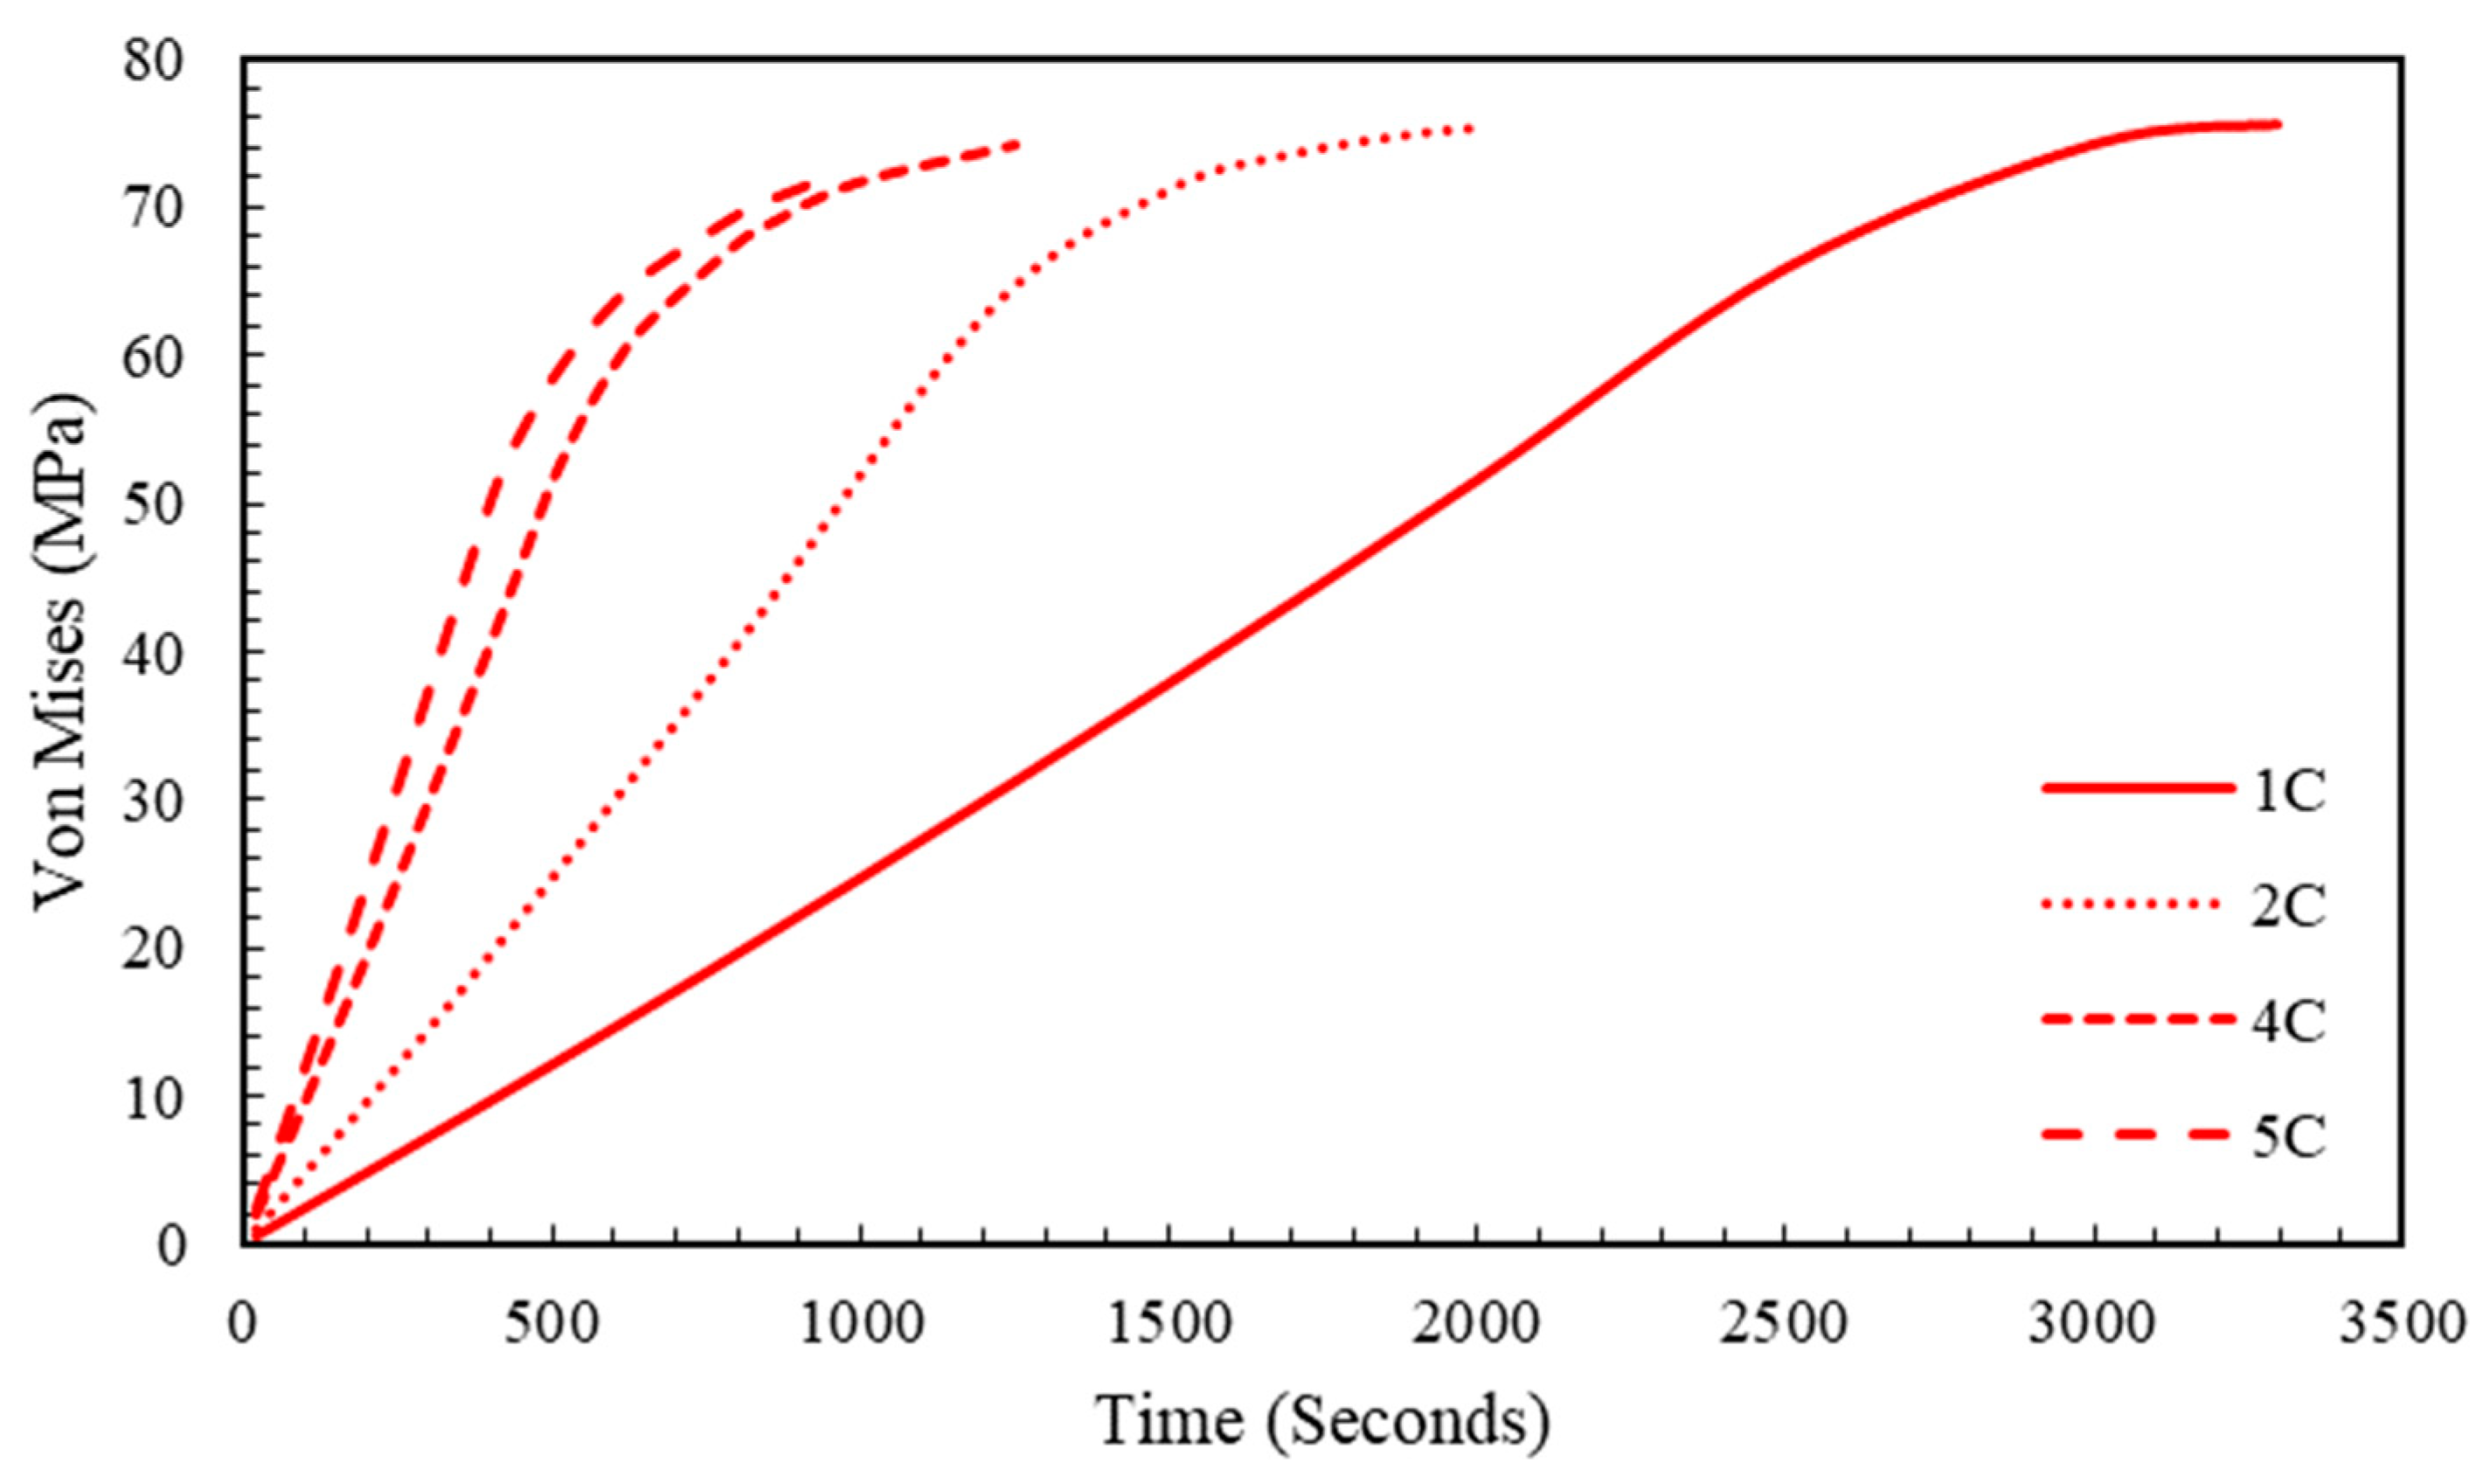
5.1. Estimated Stress in the Separator
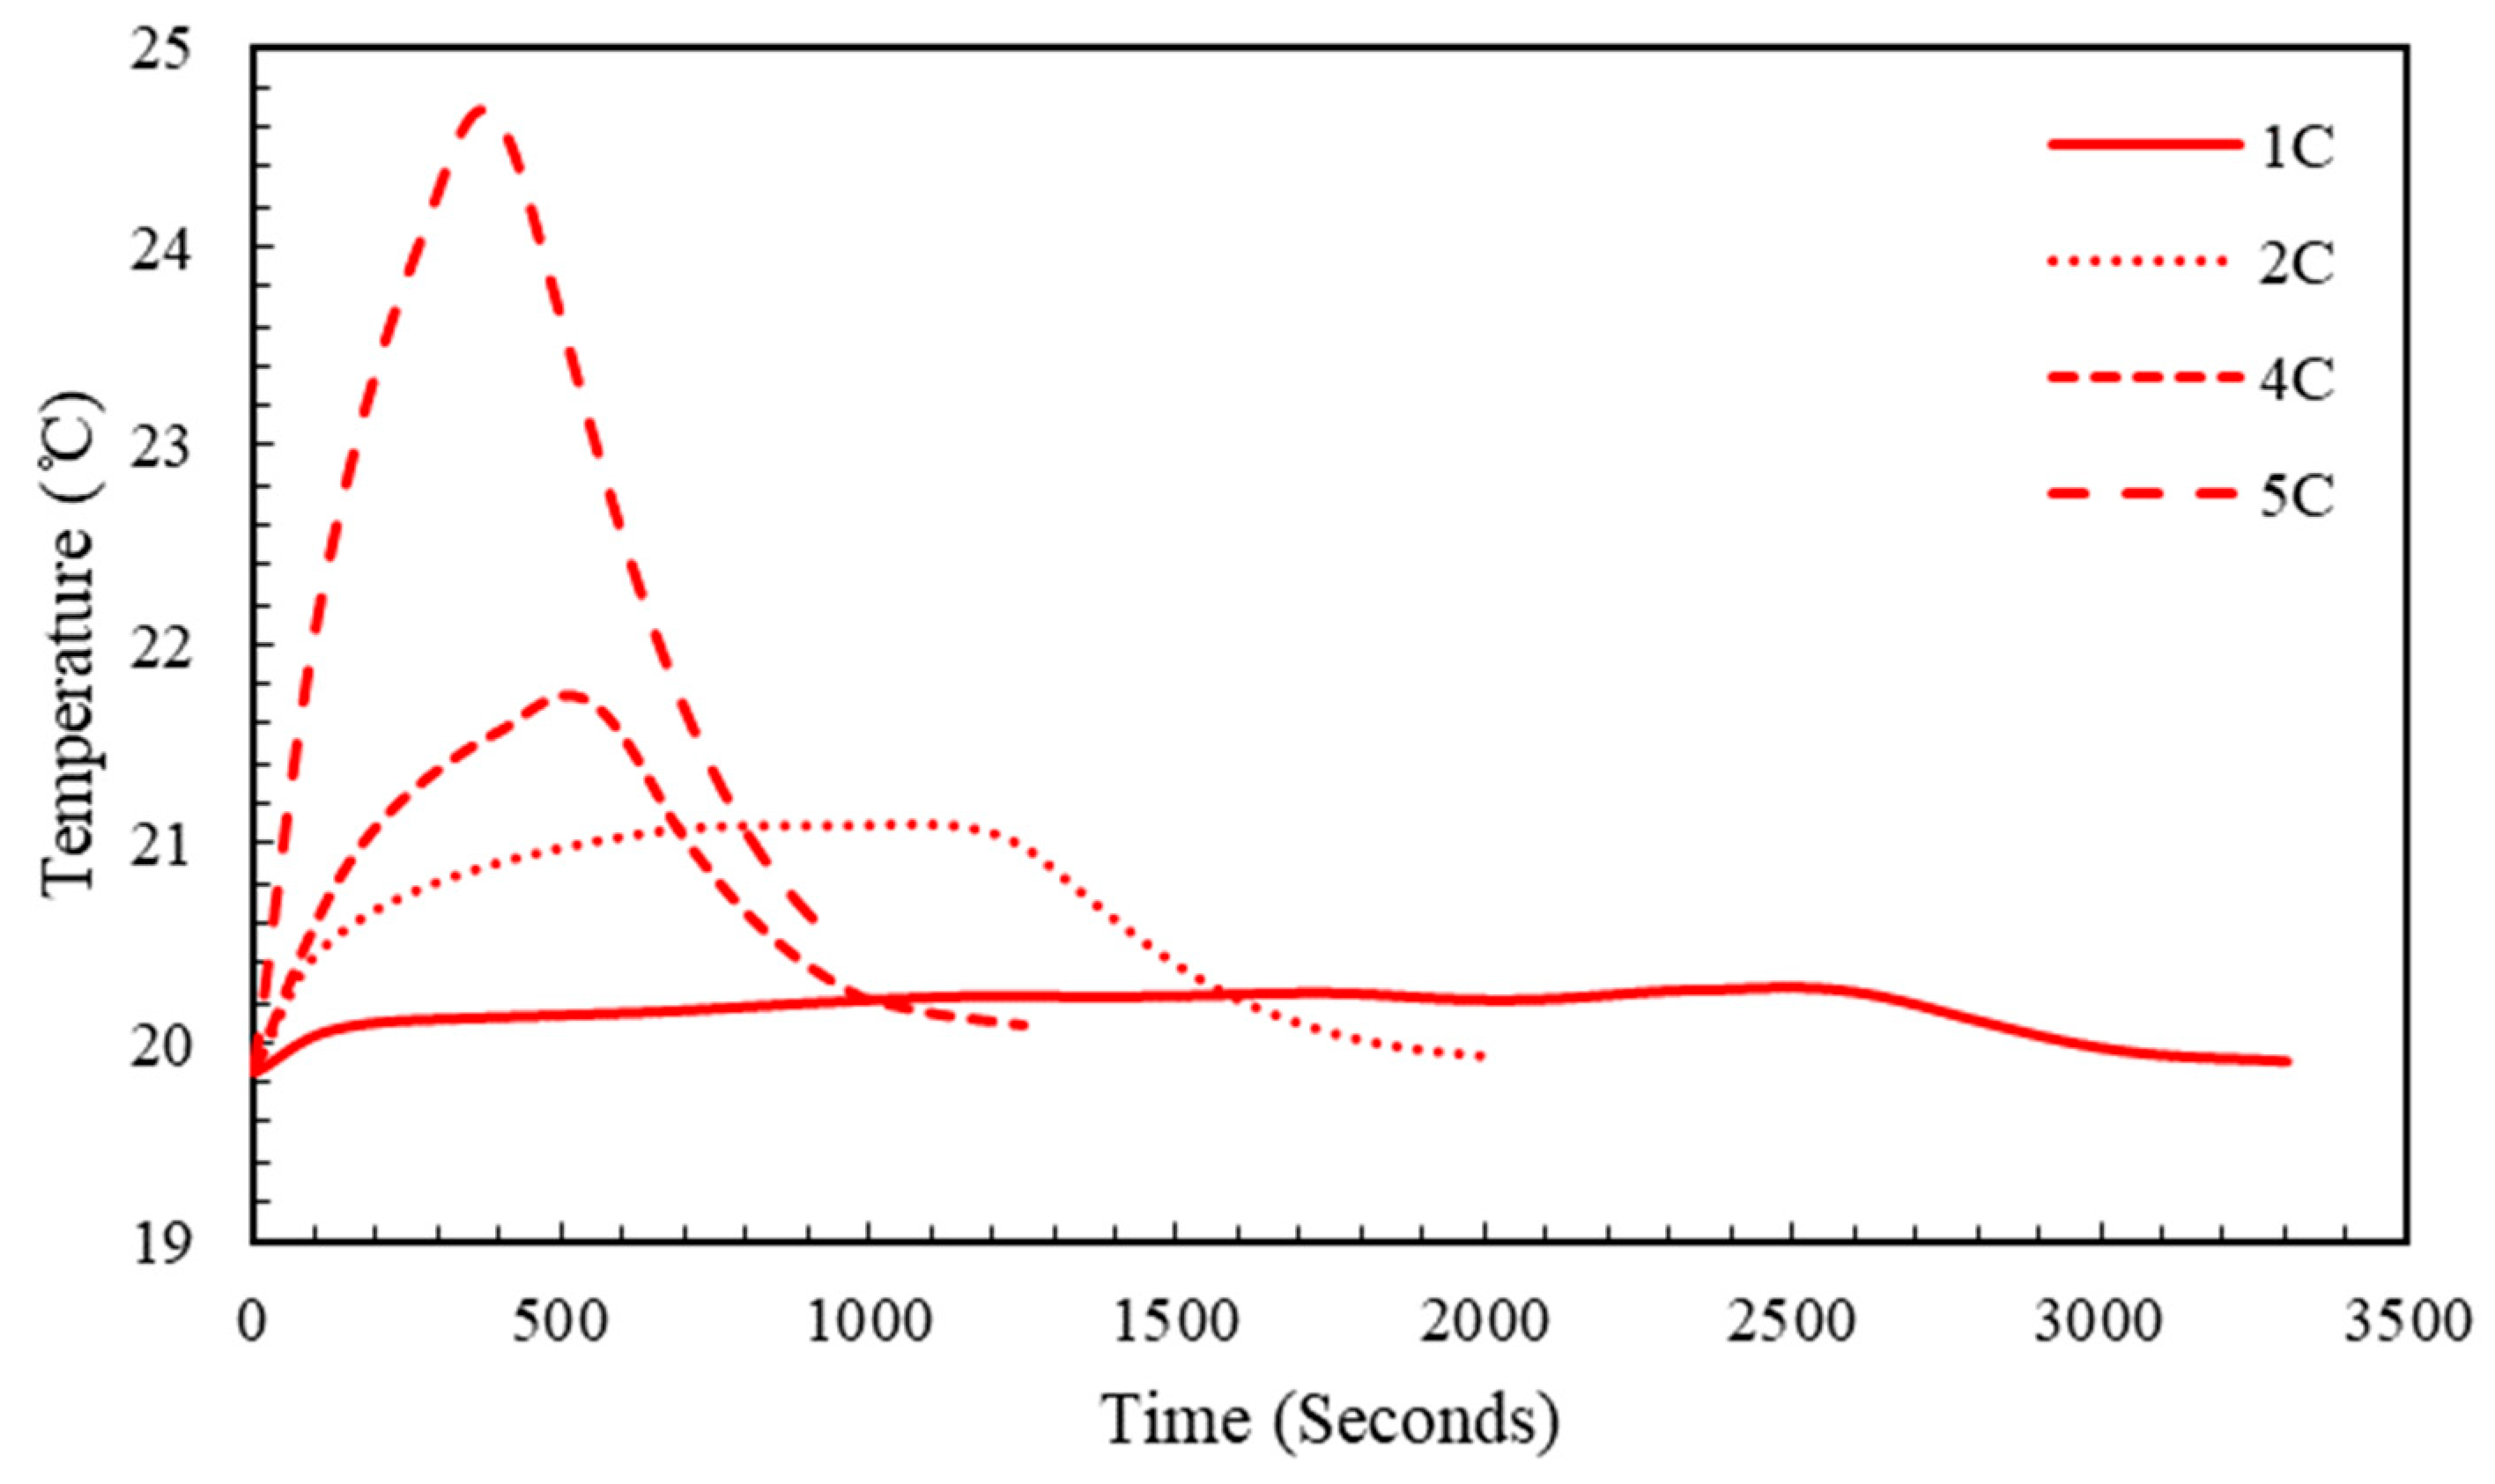
5.2. Effect of Charging Rate
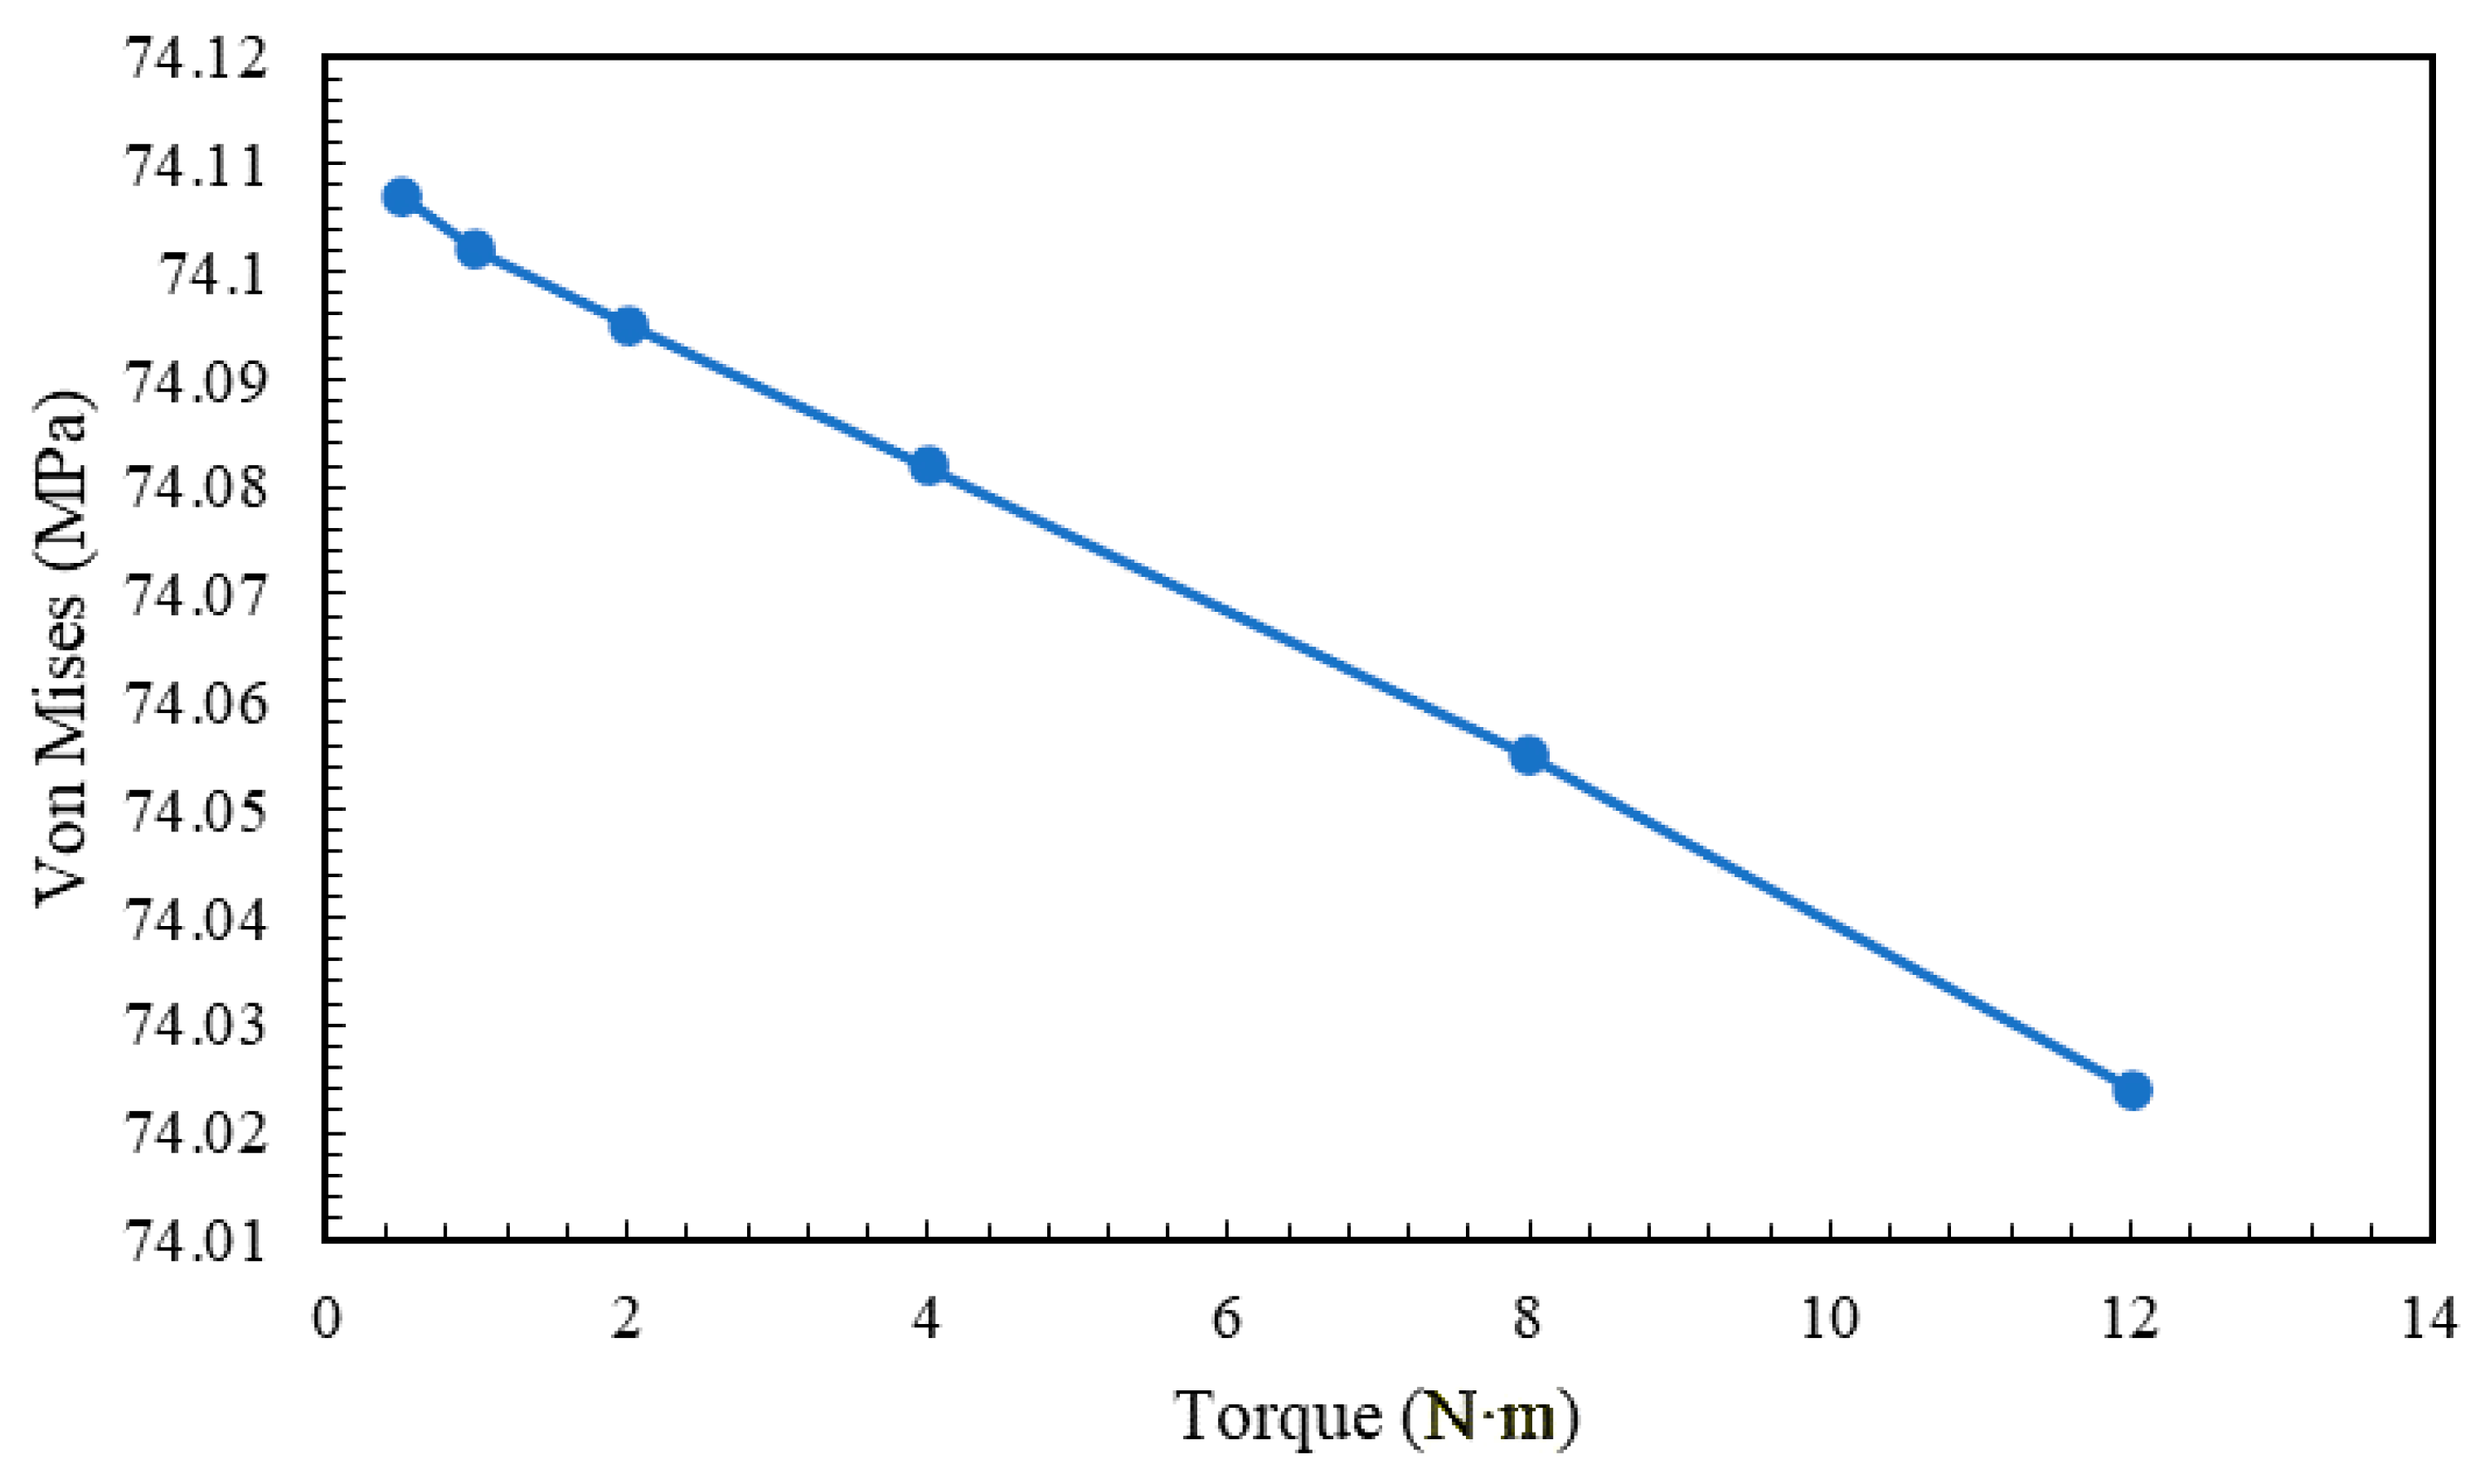
5.3. Effect of Pre-Torque
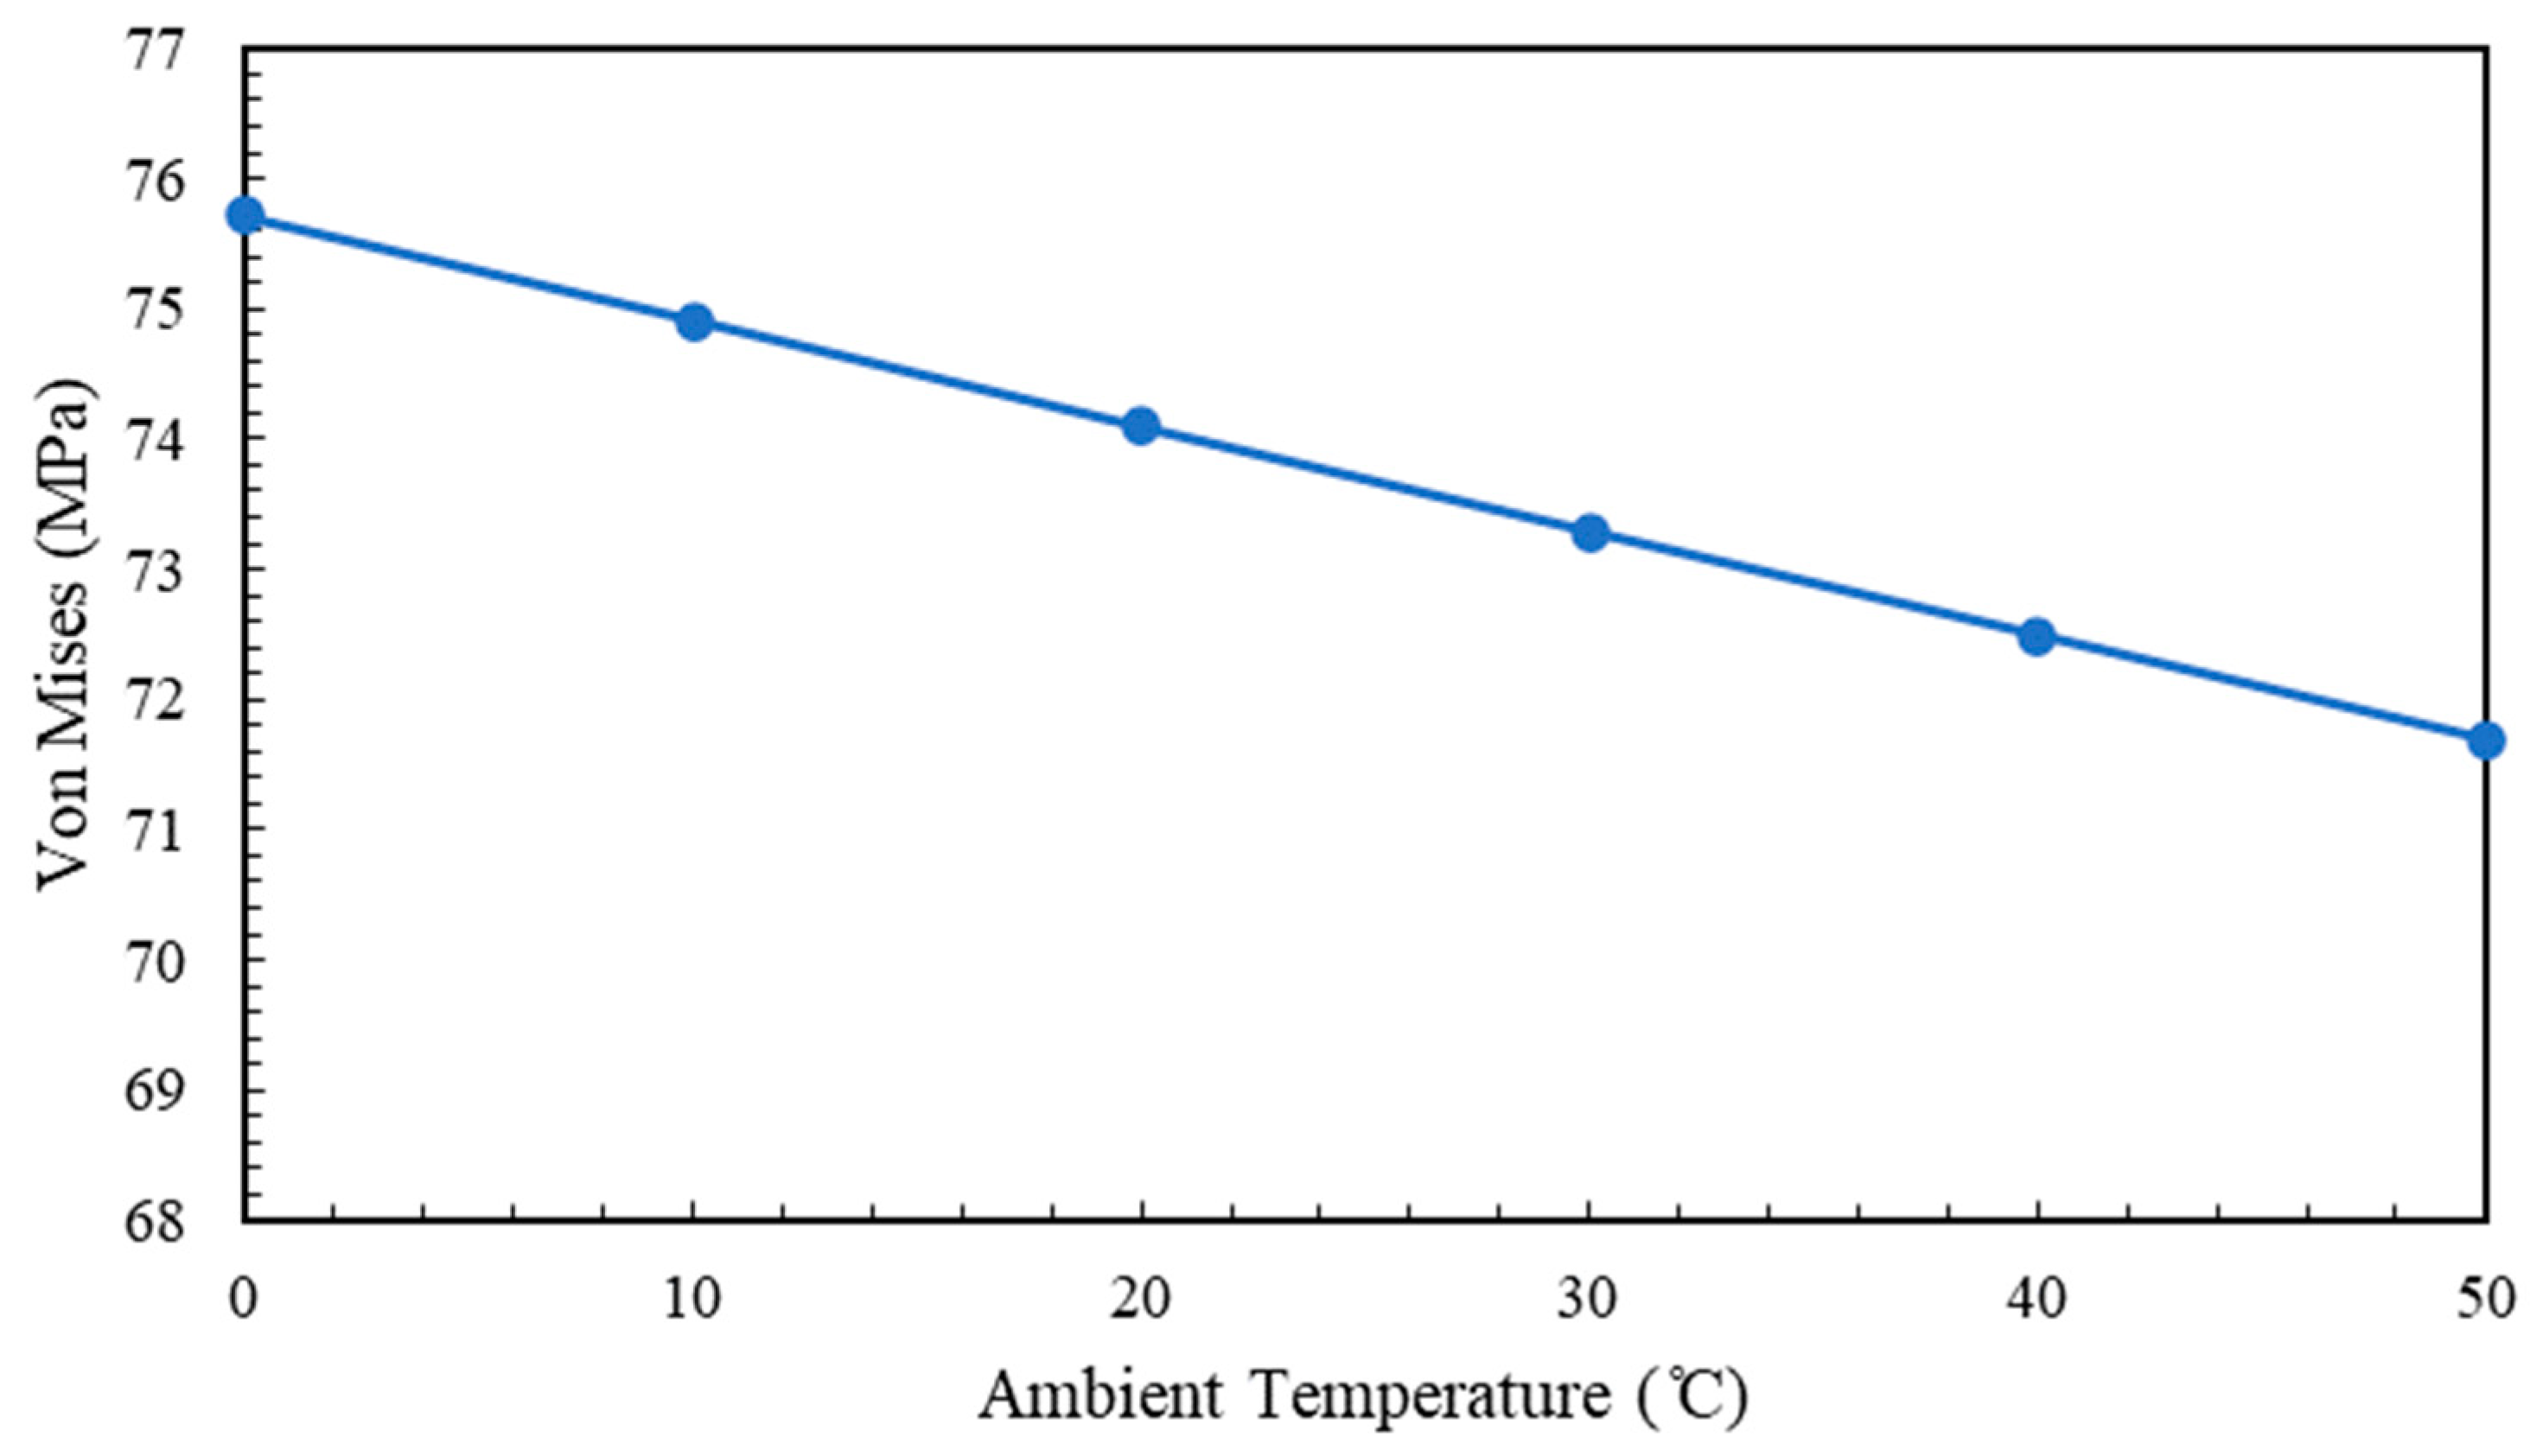
5.4. Effect of Ambient Temperature
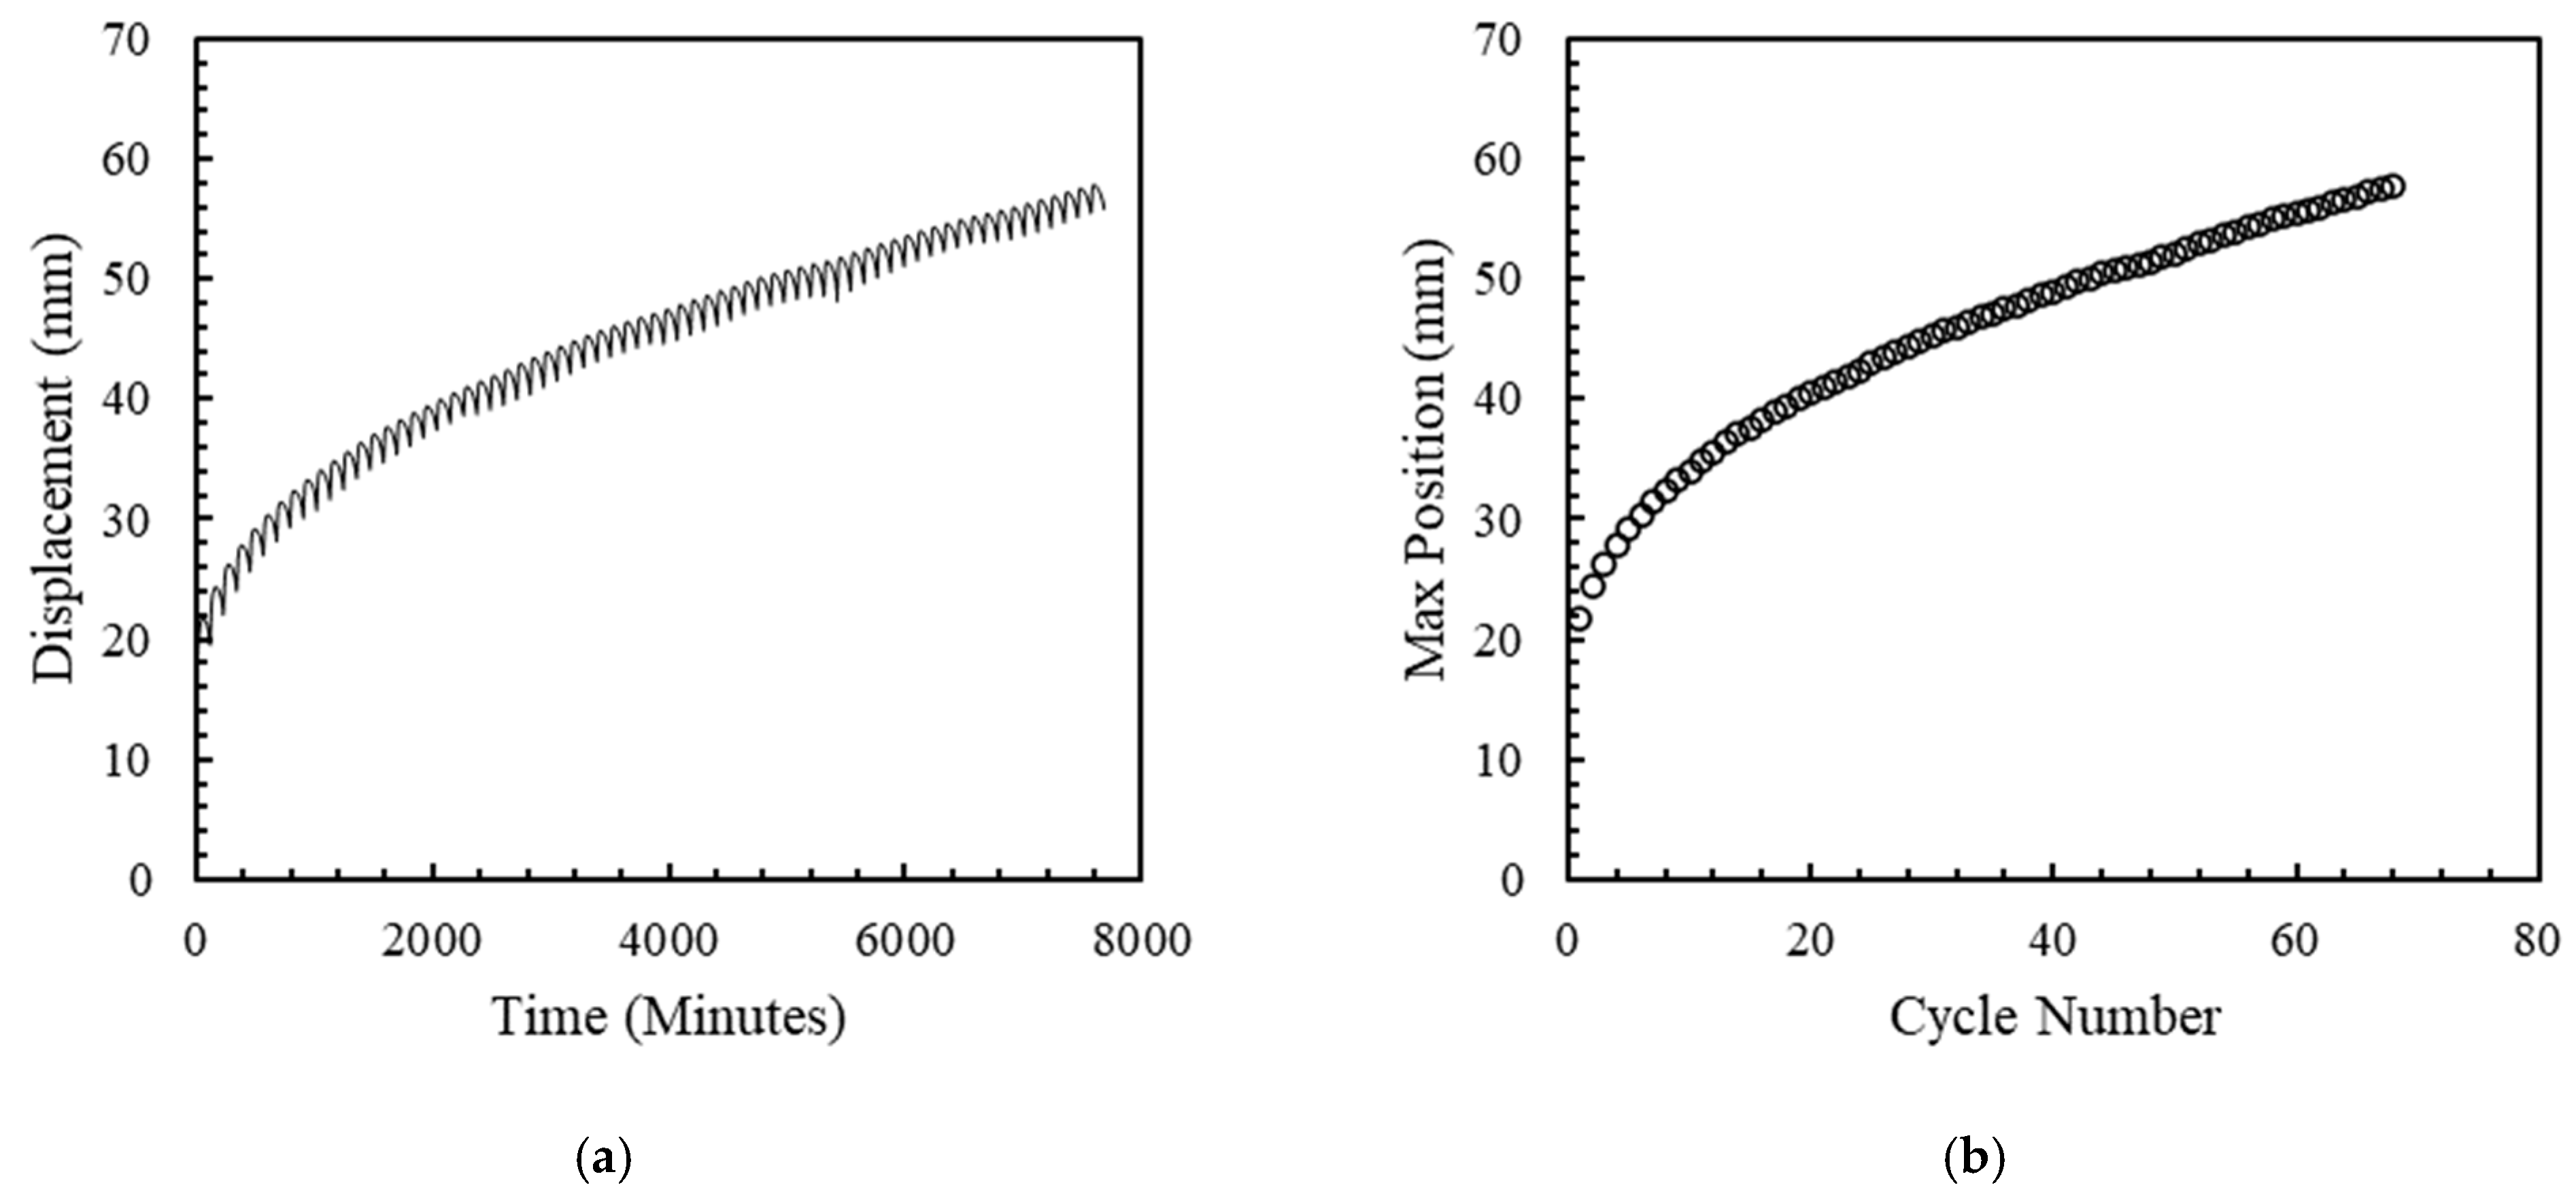
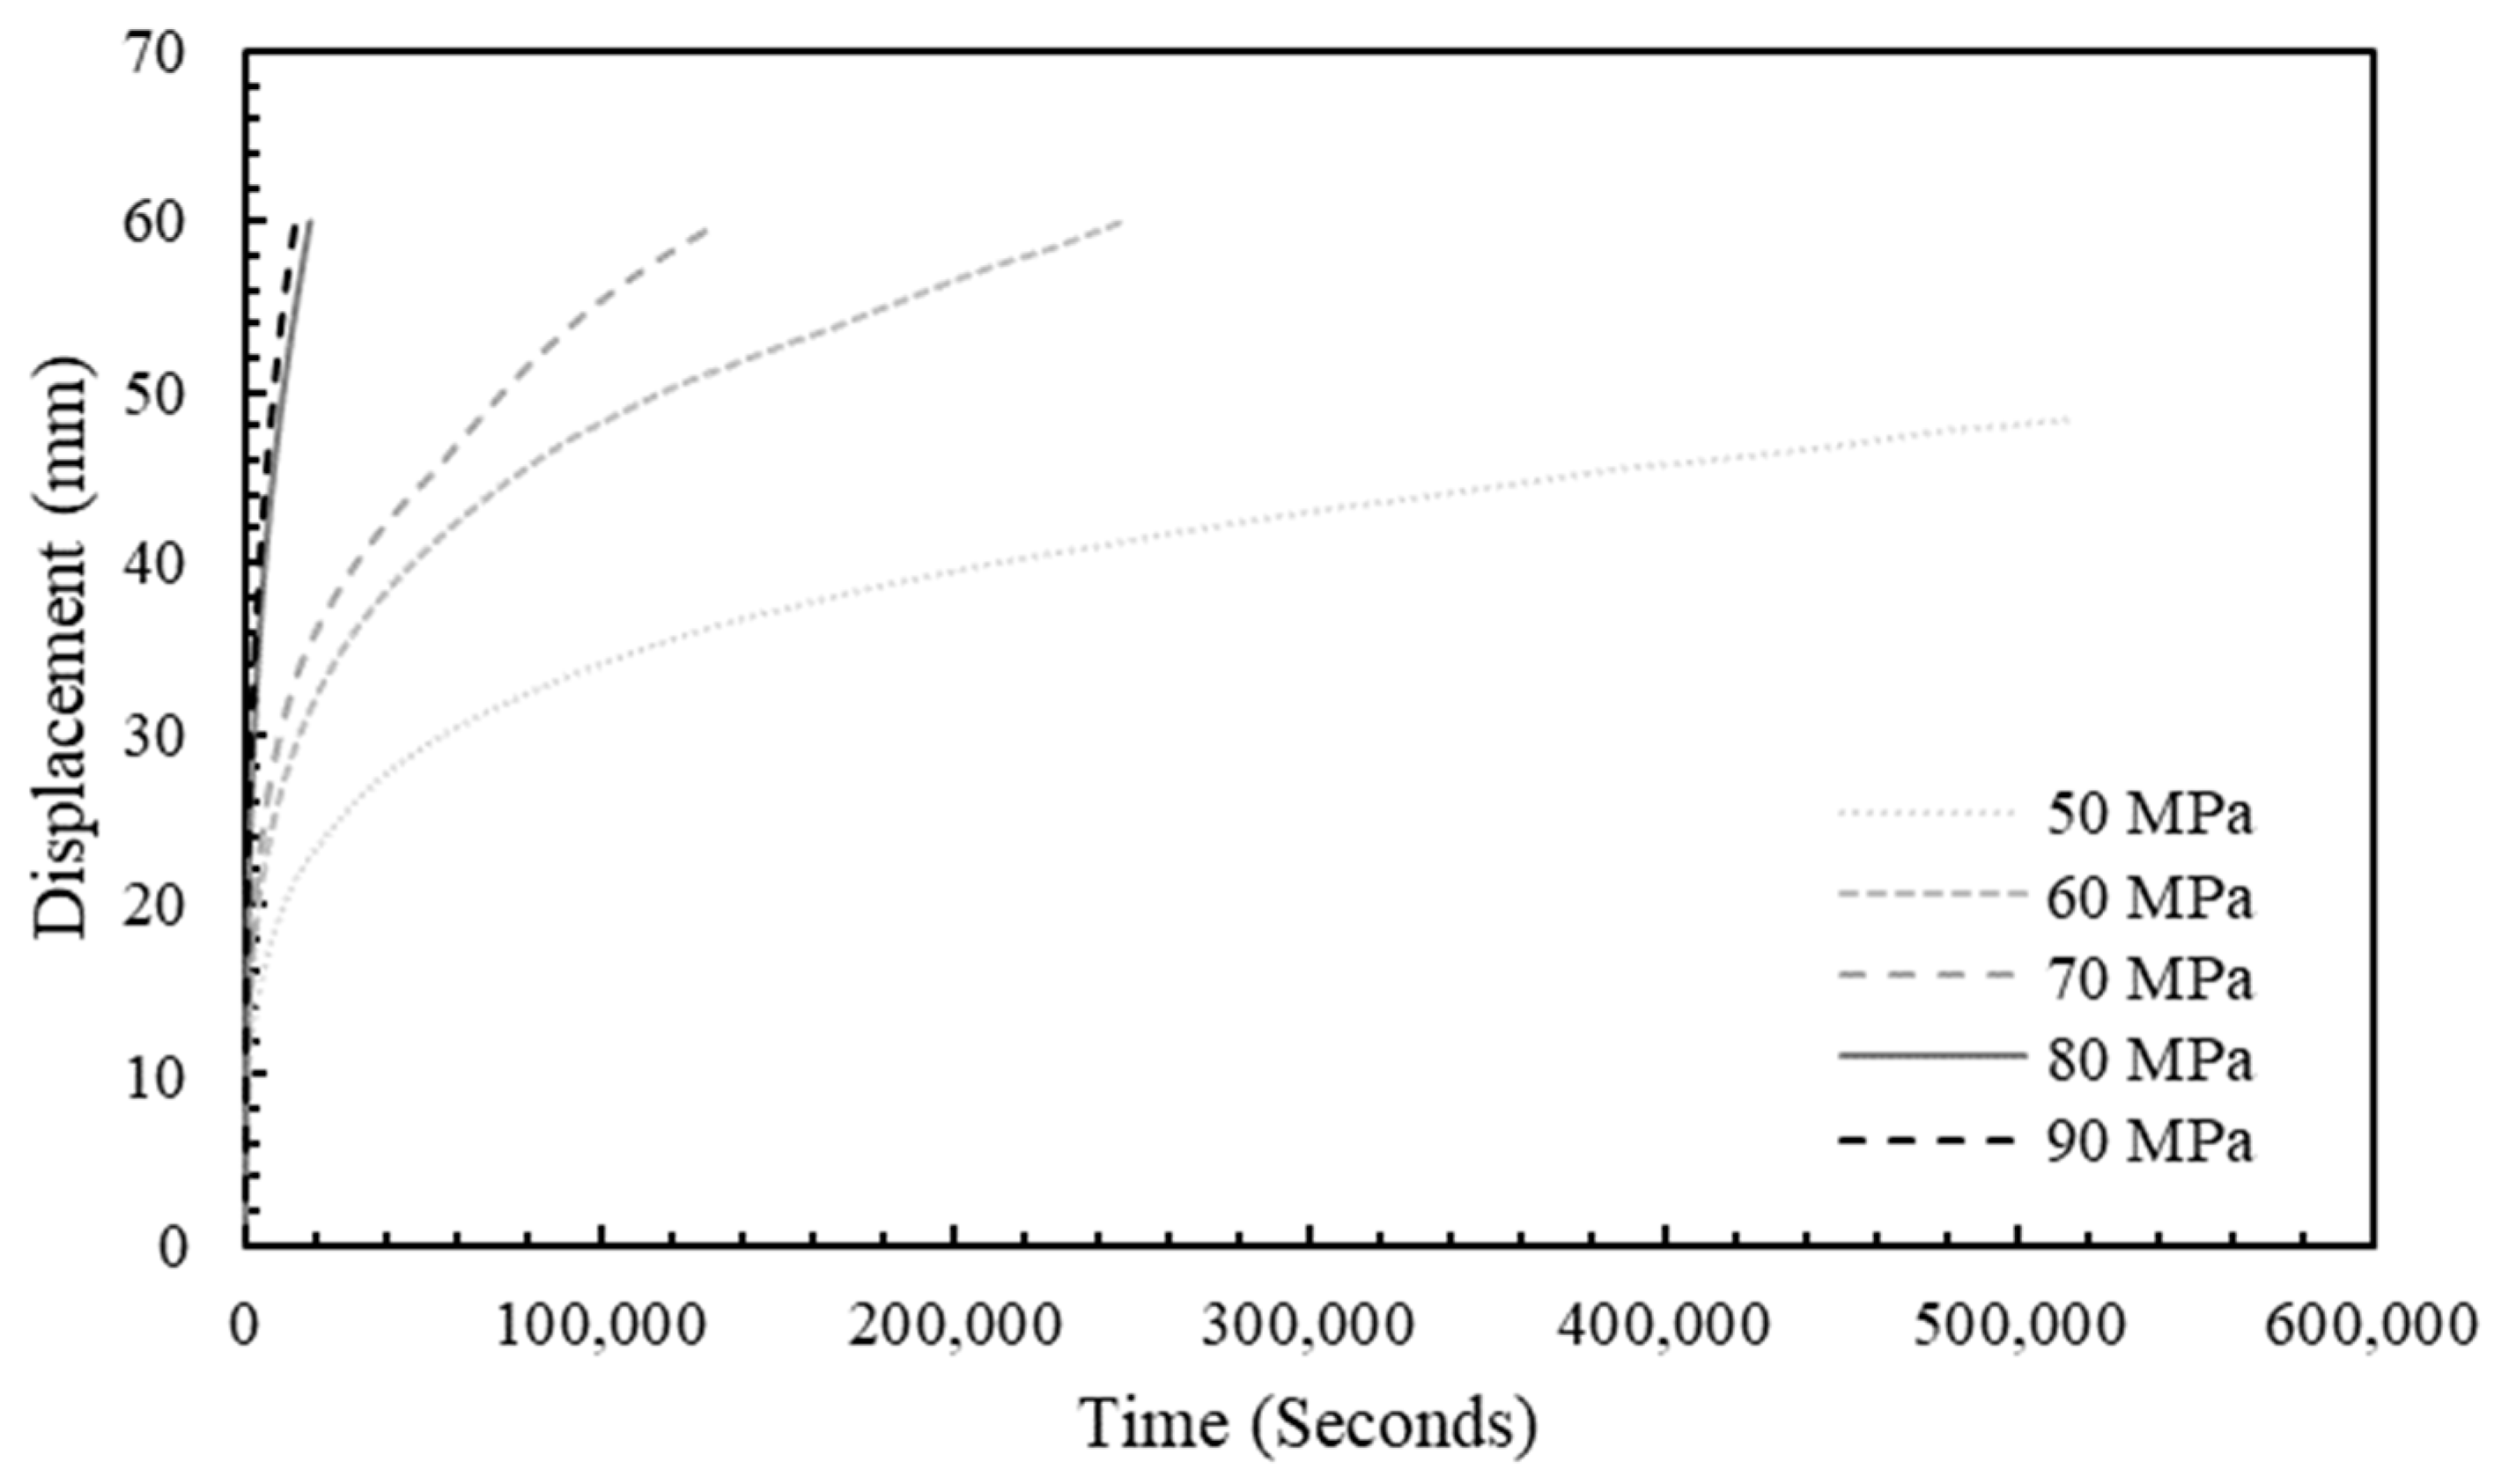
6. Creep and Fatigue Testing
7. Conclusions
Author Contributions
Funding
Data Availability Statement
Acknowledgments
Conflicts of Interest
Nomenclature
| A | Area |
| a | Particle specific surface area |
| Cell heat capacity | |
| Lithium concentration | |
| D | Diffusion coefficient |
| E | Young’s modulus |
| F | Force |
| Faraday’s constant | |
| Convection heat transfer coefficient of air | |
| Current density | |
| Exchange current density | |
| J | Pore wall flux |
| Reaction rate constant | |
| K | Thermal conductivity |
| L | Thickness |
| Convective heat transfer | |
| Heat generation rate | |
| R | Ideal gas constant |
| Particle radius coordinate | |
| Particle radius | |
| s | Spring constant |
| T | Temperature |
| t | Time |
| Transport number | |
| U | Open circuit potential |
| V | Volume |
| α | Thermal expansion coefficient |
| Charge transfer coefficient for oxidation | |
| Charge transfer coefficient for reduction | |
| δ | Displacement |
| Kronecker delta | |
| Volume fraction | |
| Mechanical strain | |
| η | Overpotential of the intercalation reaction |
| κ | Electrolyte ionic conductivity |
| ν | Poisson’s ratio |
| ξ | Coefficient of expansion for state-of-charge |
| σ | Mechanical stress |
| τeff | Effective conductivity |
| ϕ | Potential |
| Δ | Displacement due to bolt |
| ΔL | Swelling |
| Ω | Partial molar volume |
| Superscripts | |
| i | Electrode under consideration ( for positive electrode and for negative electrode) |
| n | Negative electrode |
| p | Positive electrode |
| sep | Separator |
| v | Component under consideration ( for cathode, for anode, and for separator) |
| Subscripts | |
| eff | Effective |
| filler | Binder and fillers |
| l | Liquid phase |
| s | Solid phase |
| surf | On the surface |
References
- Bandhauer, T.M.; Soc, J.E.; Bandhauer, T.M.; Garimella, S.; Fuller, T.F. A Critical Review of Thermal Issues in Lithium-Ion Batteries. J. Electrochem. Soc. 2011, 158, R1. [Google Scholar] [CrossRef]
- Lukic, S.M.; Cao, J.; Bansal, R.C.; Rodriguez, F.; Emadi, A. Energy Storage Systems for Automotive Applications. IEEE Trans. Ind. Electron. 2008, 55, 2258–2267. [Google Scholar] [CrossRef]
- Arora, P.; Zhang, Z. Battery Separators. Chem. Rev. 2004, 104, 4419–4462. [Google Scholar] [CrossRef]
- Lee, H.; Yanilmaz, M.; Toprakci, O.; Fu, K.; Zhang, X. A Review of Recent Developments in Membrane Separators for Rechargeable Lithium-Ion Batteries. Energy Environ. Sci. 2014, 7, 3857–3886. [Google Scholar] [CrossRef]
- Baldwin, R.S.; Bennet, W.R.; Wong, E.K.; Lewton, M.R.; Harris, M.K. Battery Separator Characterization and Evaluation Procedures for NASA’s Advanced Lithium-Ion Batteries; National Aeronautics and Space Administration: Cleveland, OH, USA, 2010.
- Zhou, W. Effects of External Mechanical Loading on Stress Generation during Lithiation in Li-Ion Battery Electrodes. Electrochim. Acta 2015, 185, 28–33. [Google Scholar] [CrossRef]
- Huang, X. Separator Technologies for Lithium-Ion Batteries. J. Solid State Electrochem. 2011, 15, 649–662. [Google Scholar] [CrossRef]
- Makki, M.; Ayoub, G.; Lee, C.W.; Bae, C.; Colin, X. Effect of Battery Fast Cyclic Charging on the Mechanical and Fracture Behavior of the Lithium-Ion Battery Separator. Polym. Degrad. Stab. 2023, 216, 110469. [Google Scholar] [CrossRef]
- Liu, B.; Jia, Y.; Yuan, C.; Wang, L.; Gao, X.; Yin, S.; Xu, J. Safety Issues and Mechanisms of Lithium-Ion Battery Cell upon Mechanical Abusive Loading: A Review. Energy Storage Mater. 2020, 24, 85–112. [Google Scholar] [CrossRef]
- Christensen, J.; Newman, J. Stress Generation and Fracture in Lithium Insertion Materials. J. Solid State Electrochem. 2006, 10, 293–319. [Google Scholar] [CrossRef]
- Gor, G.Y.; Cannarella, J.; Prévost, J.H.; Arnold, C.B. A Model for the Behavior of Battery Separators in Compression at Different Strain/Charge Rates. J. Electrochem. Soc. 2014, 161, F3065–F3071. [Google Scholar] [CrossRef]
- Peabody, C.; Arnold, C.B. The Role of Mechanically Induced Separator Creep in Lithium-Ion Battery Capacity Fade. J. Power Sources 2011, 196, 8147–8153. [Google Scholar] [CrossRef]
- Xiao, X.; Wu, W.; Huang, X. A Multi-Scale Approach for the Stress Analysis of Polymeric Separators in a Lithium-Ion Battery. J. Power Sources 2010, 195, 7649–7660. [Google Scholar] [CrossRef]
- Shi, D.; Xiao, X.; Huang, X.; Kia, H. Modeling Stresses in the Separator of a Pouch Lithium-Ion Cell. J. Power Sources 2011, 196, 8129–8139. [Google Scholar] [CrossRef]
- Oh, K.Y.; Epureanu, B.I. A Novel Thermal Swelling Model for a Rechargeable Lithium-Ion Battery Cell. J. Power Sources 2016, 303, 86–96. [Google Scholar] [CrossRef]
- Oh, K.Y.; Epureanu, B.I.; Siegel, J.B.; Stefanopoulou, A.G. Phenomenological Force and Swelling Models for Rechargeable Lithium-Ion Battery Cells. J. Power Sources 2016, 310, 118–129. [Google Scholar] [CrossRef]
- Xu, J.; Wang, L.; Guan, J.; Yin, S. Coupled Effect of Strain Rate and Solvent on Dynamic Mechanical Behaviors of Separators in Lithium Ion Batteries. Mater. Des. 2016, 95, 319–328. [Google Scholar] [CrossRef]
- Xu, J.; Liu, B.; Wang, X.; Hu, D. Computational Model of 18650 Lithium-Ion Battery with Coupled Strain Rate and SOC Dependencies. Appl. Energy 2016, 172, 180–189. [Google Scholar] [CrossRef]
- Liu, B.; Zhao, H.; Yu, H.; Li, J.; Xu, J. Multiphysics Computational Framework for Cylindrical Lithium-Ion Batteries under Mechanical Abusive Loading. Electrochim. Acta 2017, 256, 172–184. [Google Scholar] [CrossRef]
- Duan, X.; Wang, H.; Jia, Y.; Wang, L.; Liu, B.; Xu, J. A Multiphysics Understanding of Internal Short Circuit Mechanisms in Lithium-Ion Batteries upon Mechanical Stress Abuse. Energy Storage Mater. 2022, 45, 667–679. [Google Scholar] [CrossRef]
- Yuan, C.; Wang, L.; Yin, S.; Xu, J. Generalized Separator Failure Criteria for Internal Short Circuit of Lithium-Ion Battery. J. Power Sources 2020, 467, 228360. [Google Scholar] [CrossRef]
- Doyle, M.; Fuller, T.F.; Newman, J. Modeling of Galvanostatic Charge and Discharge of the Lithium / Polymer / Insertion Cell. J. Electrochem. Soc. 1993, 140, 1526–1533. [Google Scholar] [CrossRef]
- Doyle, M.; Newman, J. Comparison of Modeling Predictions with Experimental Data from Plastic Lithium Ion Cells Comparison of Modeling Predictions with Experimental Data from Plastic Lithium Ion Cells. J. Electrochem. Soc. 1996, 143, 1890. [Google Scholar] [CrossRef]
- Smith, K.A.; Rahn, C.D.; Wang, C. Model Order Reduction of 1D. J. Dyn. Syst. Meas. Control 2008, 130, 1–8. [Google Scholar] [CrossRef]
- Smith, K.A.; Rahn, C.D.; Wang, C. Control Oriented 1D Electrochemical Model of Lithium Ion Battery. Energy Convers. Manag. 2007, 48, 2565–2578. [Google Scholar] [CrossRef]
- Lin, X.; Perez, H.E.; Siegel, J.B.; Stefanopoulou, A.G.; Li, Y.; Anderson, R.D.; Ding, Y.; Castanier, M.P. On-Line Parameterization of Lumped Thermal Dynamics in Cylindrical Lithium Ion Batteries for Core Temperature Estimation and Health Monitoring. IEEE Trans. Control Syst. Technol. 2012, 21, 1745–1755. [Google Scholar]
- Lin, X.; Perez, H.E.; Mohan, S.; Siegel, J.B.; Stefanopoulou, A.G.; Ding, Y.; Castanier, M.P. A Lumped-Parameter Electro-Thermal Model for Cylindrical Batteries. J. Power Sources 2014, 257, 1–11. [Google Scholar] [CrossRef]
- Kim, Y.; Siegel, J.B.; Stefanopoulou, A.G. A Computationally Efficient Thermal Model of Cylindrical Battery Cells for the Estimation of Radially Distributed Temperatures. In Proceedings of the 2013 American Control Conference, Washington, DC, USA, 17–19 June 2013; IEEE: Piscataway, NJ, USA; pp. 698–703. [Google Scholar]
- Bernardi, D.; Pawlikowski, E.; Newman, J. A General Energy Balance for Battery Systems. J. Electrochem. Soc. 1985, 132, 5. [Google Scholar] [CrossRef]
- Chen, S.C.; Wan, C.C.; Wang, Y.Y. Thermal Analysis of Lithium-Ion Batteries. J. Power Sources 2005, 140, 111–124. [Google Scholar] [CrossRef]
- Zhang, X.; Shyy, W.; Marie Sastry, A. Numerical Simulation of Intercalation-Induced Stress in Li-Ion Battery Electrode Particles. J. Electrochem. Soc. 2007, 154, A910. [Google Scholar] [CrossRef]
- Zhang, X.; Sastry, A.M.; Shyy, W. Intercalation-Induced Stress and Heat Generation within Single Lithium-Ion Battery Cathode Particles. J. Electrochem. Soc. 2008, 155, A542. [Google Scholar] [CrossRef]
- Bulla, M.; Kolling, S.; Sahraei, E. A Material Model for the Orthotropic and Viscous Behavior of Separators in Lithium-Ion Batteries under High Mechanical Loads. Energies 2021, 14, 4585. [Google Scholar] [CrossRef]
- Bulla, M.; Kolling, S.; Sahraei, E. An Experimental and Computational Study on the Orthotropic Failure of Separators for Lithium-Ion Batteries. Energies 2020, 13, 4399. [Google Scholar] [CrossRef]
- Makki, M.; Ayoub, G.; Lee, C.W. Modeling the Anisotropic Behavior of Highly Orthotropic Lithium-Ion Batteries Polymer Separators. Int. J. Solids Struct. 2023, 264, 112102. [Google Scholar] [CrossRef]
- Zhou, W.; Hao, F.; Fang, D. The Effects of Elastic Stiffening on the Evolution of the Stress Field within a Spherical Electrode Particle of Lithium-Ion Batteries. Int. J. Appl. Mech. 2013, 5, 1350040. [Google Scholar] [CrossRef]
- Drake, S.J.; Wetz, D.A.; Ostanek, J.K.; Miller, S.P.; Heinzel, J.M.; Jain, A. Measurement of Anisotropic Thermophysical Properties of Cylindrical Li-Ion Cells. J. Power Sources 2014, 252, 298–304. [Google Scholar] [CrossRef]
- Dieter, D.E. Mechanical Metallurgy, 3rd ed.; McGraw-Hill Publishing Company: New York, NY, USA, 1986. [Google Scholar]


| Thickness (μm) | Crystallinity (%) | Porosity (%) | Heat Shrinkage MD (% @105C, 8 h) | Heat Shrinkage TD (% @105C, 8 h) | Tensile Strength MD (MPa) | Tensile Strength TD (MPa) |
|---|---|---|---|---|---|---|
| 12 | 60–80 | 43 | 4.0 | 4.5 | 235 | 225 |
| Model Parameters | Units | Cu | Anode | Separator | Cathode | Al | Electrolyte |
|---|---|---|---|---|---|---|---|
| Dimensional Parameters | |||||||
| Thickness | μm | 10 | 71 | 12 | 48.5 | 20 | |
| Length | mm | 71 | 71 | 69 | 69 | ||
| Electrochemical Parameters | |||||||
| Density | 2230 | 900 | 4750 | 1210 | |||
| Active volume fraction | 0.5686 | 0.6698 | |||||
| Porosity | 0.37454 | 0.43 | 0.26322 | ||||
| Stochiometric maximum concentration | 49,000 | 31507 | |||||
| Diffusion coefficient | 1.4523 × 10⁻¹³ | 5 × 10⁻¹³ | |||||
| Particle radius | μm | 4 | 5 | ||||
| Partial molar volume | 4.4196 × 10⁻⁵ | 2.8418 × 10⁻⁵ | |||||
| Thermal Parameters | |||||||
| Thermal expansion coefficient | 1/K | 17 × 10−6 | 6.03 × 10⁻⁶ * | 82.5 × 10⁻⁶ * | 9.62 × 10⁻⁶ * | 23 × 10−6 | |
| Mechanical Parameters | |||||||
| Young’s modulus | 110 | 6.82 * | 0.645 * | 6.69 * | 70 | ||
| Poisson’s ratio | 0.35 | 0.3 | 0.45 | 0.3 | 0.33 | 0.25 | |
| Responses | Symbol |
|---|---|
| Battery surface temperature | |
| Plate surface temperature | |
| Total force | |
| Displacement of the fixture | |
| Predictors | Symbol |
| Heat generated from the battery | |
| Diffusion swelling | |
| Time | Time |
| Ambient temperature |
| Parameters | Optimization Solution |
|---|---|
| 451.62 | |
| 95.743 | |
| 4.39 × 10⁻⁴ | |
| 1.03 × 10⁻⁴ |
| Responses | Maximum Error | RMSE | RMSE/ Range | RMSE/ Average |
|---|---|---|---|---|
| 0.1262 | 0.0066 | |||
| 0.1142 | 0.0060 | |||
| 0.0968 | 0.2960 | |||
| 0.1922 | 0.1800 |
Disclaimer/Publisher’s Note: The statements, opinions and data contained in all publications are solely those of the individual author(s) and contributor(s) and not of MDPI and/or the editor(s). MDPI and/or the editor(s) disclaim responsibility for any injury to people or property resulting from any ideas, methods, instructions or products referred to in the content. |
© 2023 by the authors. Licensee MDPI, Basel, Switzerland. This article is an open access article distributed under the terms and conditions of the Creative Commons Attribution (CC BY) license (https://creativecommons.org/licenses/by/4.0/).
Share and Cite
Makki, M.; Lee, C.W.; Ayoub, G. Stress Distribution Inside a Lithium-Ion Battery Cell during Fast Charging and Its Effect on Degradation of Separator. Batteries 2023, 9, 502. https://doi.org/10.3390/batteries9100502
Makki M, Lee CW, Ayoub G. Stress Distribution Inside a Lithium-Ion Battery Cell during Fast Charging and Its Effect on Degradation of Separator. Batteries. 2023; 9(10):502. https://doi.org/10.3390/batteries9100502
Chicago/Turabian StyleMakki, Mustapha, Cheol W. Lee, and Georges Ayoub. 2023. "Stress Distribution Inside a Lithium-Ion Battery Cell during Fast Charging and Its Effect on Degradation of Separator" Batteries 9, no. 10: 502. https://doi.org/10.3390/batteries9100502
APA StyleMakki, M., Lee, C. W., & Ayoub, G. (2023). Stress Distribution Inside a Lithium-Ion Battery Cell during Fast Charging and Its Effect on Degradation of Separator. Batteries, 9(10), 502. https://doi.org/10.3390/batteries9100502