Abstract
Degradation and heat generation are among the major concerns when treating Lithium-ion batteries’ health and performance parameters. Due to the high correlation between the battery’s degradation, autonomy and heat generation to the cell’s operational temperature, the Battery Thermal Management System plays a key role in maximizing the battery’s health. Given the fact that the ideal temperature for degradation minimization usually does not match the ideal temperature for heat generation minimization, the BTMS must manage these phenomena in order to maximize the battery’s lifespan. This work presents a new definition of the discharge operation point of a lithium-ion battery based on degradation, autonomy and heat generation. Two cells of different electrodes formulation were modeled and evaluated in a case study. The results demonstrated a 50% improvement on total useful battery cycles in best-case scenarios.
1. Introduction
Electric and hybrid vehicles are becoming more popular in modern days due to their less environmental impact, competitive values and higher energy efficiency. This fact has a strong relation to the use of Lithium-ion Batteries (LiBs) as the power storage device [,]. The use of LiBs in electrified vehicles guarantees great improvement in autonomy and lifespan, but these parameters are still one of the main barriers to the popularization of this type of segment.
There are three conventional ways to enhance autonomy and lifespan, being the easiest one the addition of more cells to the battery pack, which will also increase the vehicle weight and the battery pack volume. The second one stands for the cell’s technological development, demanding great financial support. The last path is based on the improvement of the battery’s operational parameters, which requires more sophisticated embedded systems. The improvement of the battery’s operational parameters requires less financial effort and does not impact on vehicle’s total mass and volume.
The operational parameters optimization demands a better understanding of the main phenomena associated with efficiency loss. During cycle operation, the autonomy is directly impacted by the energy loss since a voltage drop on cell poles is converted into heat []. According to [,,], this effect is intrinsic to each cell and can be described as the battery’s internal resistance. Experimental results presented in [,,] indicate a strong correlation between the cell’s internal resistance value and temperature, leading to the conclusion that temperature directly affects the vehicle’s autonomy. Because of the cell’s heat generation, the cooling system controlled by the Battery Thermal Management System (BTMS) will require energy to maintain the cell temperature.
Among the main agents responsible for the decrease in battery life, degradation stands out. The cell’s degradation translates into the maximum capacity loss overcharge and discharge cycles. Considering the analysis proposed in [,], it is possible to conclude that degradation is essentially a consequence of electrochemical reactions and, according to results presented in [,,], the magnitude of these reactions is directly affected by the cell’s temperature. The results shown in [] indicate that degradation has a side effect in the increase of the cell’s energy loss after each cycle, leading to an increase of heat generation during operation with the cell’s aging.
BTMS plays a key role in maximizing the device’s life and vehicle’s autonomy. However, the ideal operating temperature for maximization of autonomy does not match the ideal temperature for battery life maximization. That fact creates a dilemma for the BTMS control strategy since these parameters are not, at first sight, relatable mathematically.
Throughout the years, much research has aimed to extend the life and/or autonomy of LiBs through modifications to their operational variables []. However, most of these studies focus only on the improvement of one of these parameters, ignoring any side effects that occur to the other one, as seen in [,,,]. On the other hand, the majority of studies that takes both negative phenomena, degradation and heat generation take only the charge regime into account [,]. Despite all this charge regime research sharing the same objectives as the ones that focus on discharge regimes, these studies are naturally distinct from each other. This distinction occurs because, in discharge, the current must be treated as an input variable, i.e., not controllable.
The minor part of research focusing on the improvement of battery efficiency during discharge concentrates efforts on the device’s operation at very low temperatures, where the heat generation and degradation are more accentuated [,]. The operational strategy at low temperatures usually is not suitable to the average temperature’s operation regimes, in which the cooling system has a higher contribution to the BTMS. Finally, most part of the studies cited uses oversimplified equations to calculate the cooling system’s heat exchange, which generates optimistic results in this case.
In this paper, a new BTMS control strategy is presented. There are three major contributions of this paper:
- 1. a new BTMS mathematical control model is presented;
- 2. a more accurate heat exchange calculation that fits any liquid-cooled-based system is presented;
- 3. a case study for an off-highway hybrid vehicle based on liquid-cooled BTMS is discussed.
Two cells of different electrodes formulation were modeled and evaluated in a case study. The results demonstrated a 50% improvement in total useful battery cycles in best-case scenarios.
2. BTMS Strategy Methodology
2.1. Degradation Modeling
The loss of maximum charge capacity directly influences the vehicle’s autonomy, lowering the distance range between discharges. For that reason, the regulation about battery health states that, for vehicular applications, when a fully charged storage device reaches 80% of its maximum capacity, the device no longer has any use []. The degradation phenomena, an intrinsic mechanism to the storage device’s operation, represents the main contributor to the battery’s loss of capacity.
A validated degradation model does not exist because the electrochemical reactions associated and multiple existent variables in the process make it a complex task. A common approach is the creation of empirical and semi-empirical degradation models with experimental data, as presented in studies [,]. That path requires an understanding of the main operational parameters linked to the phenomena itself. Given the fact that empirical models rely on experimental results, the use of this model type guarantees valid results in the range in which data was provided.
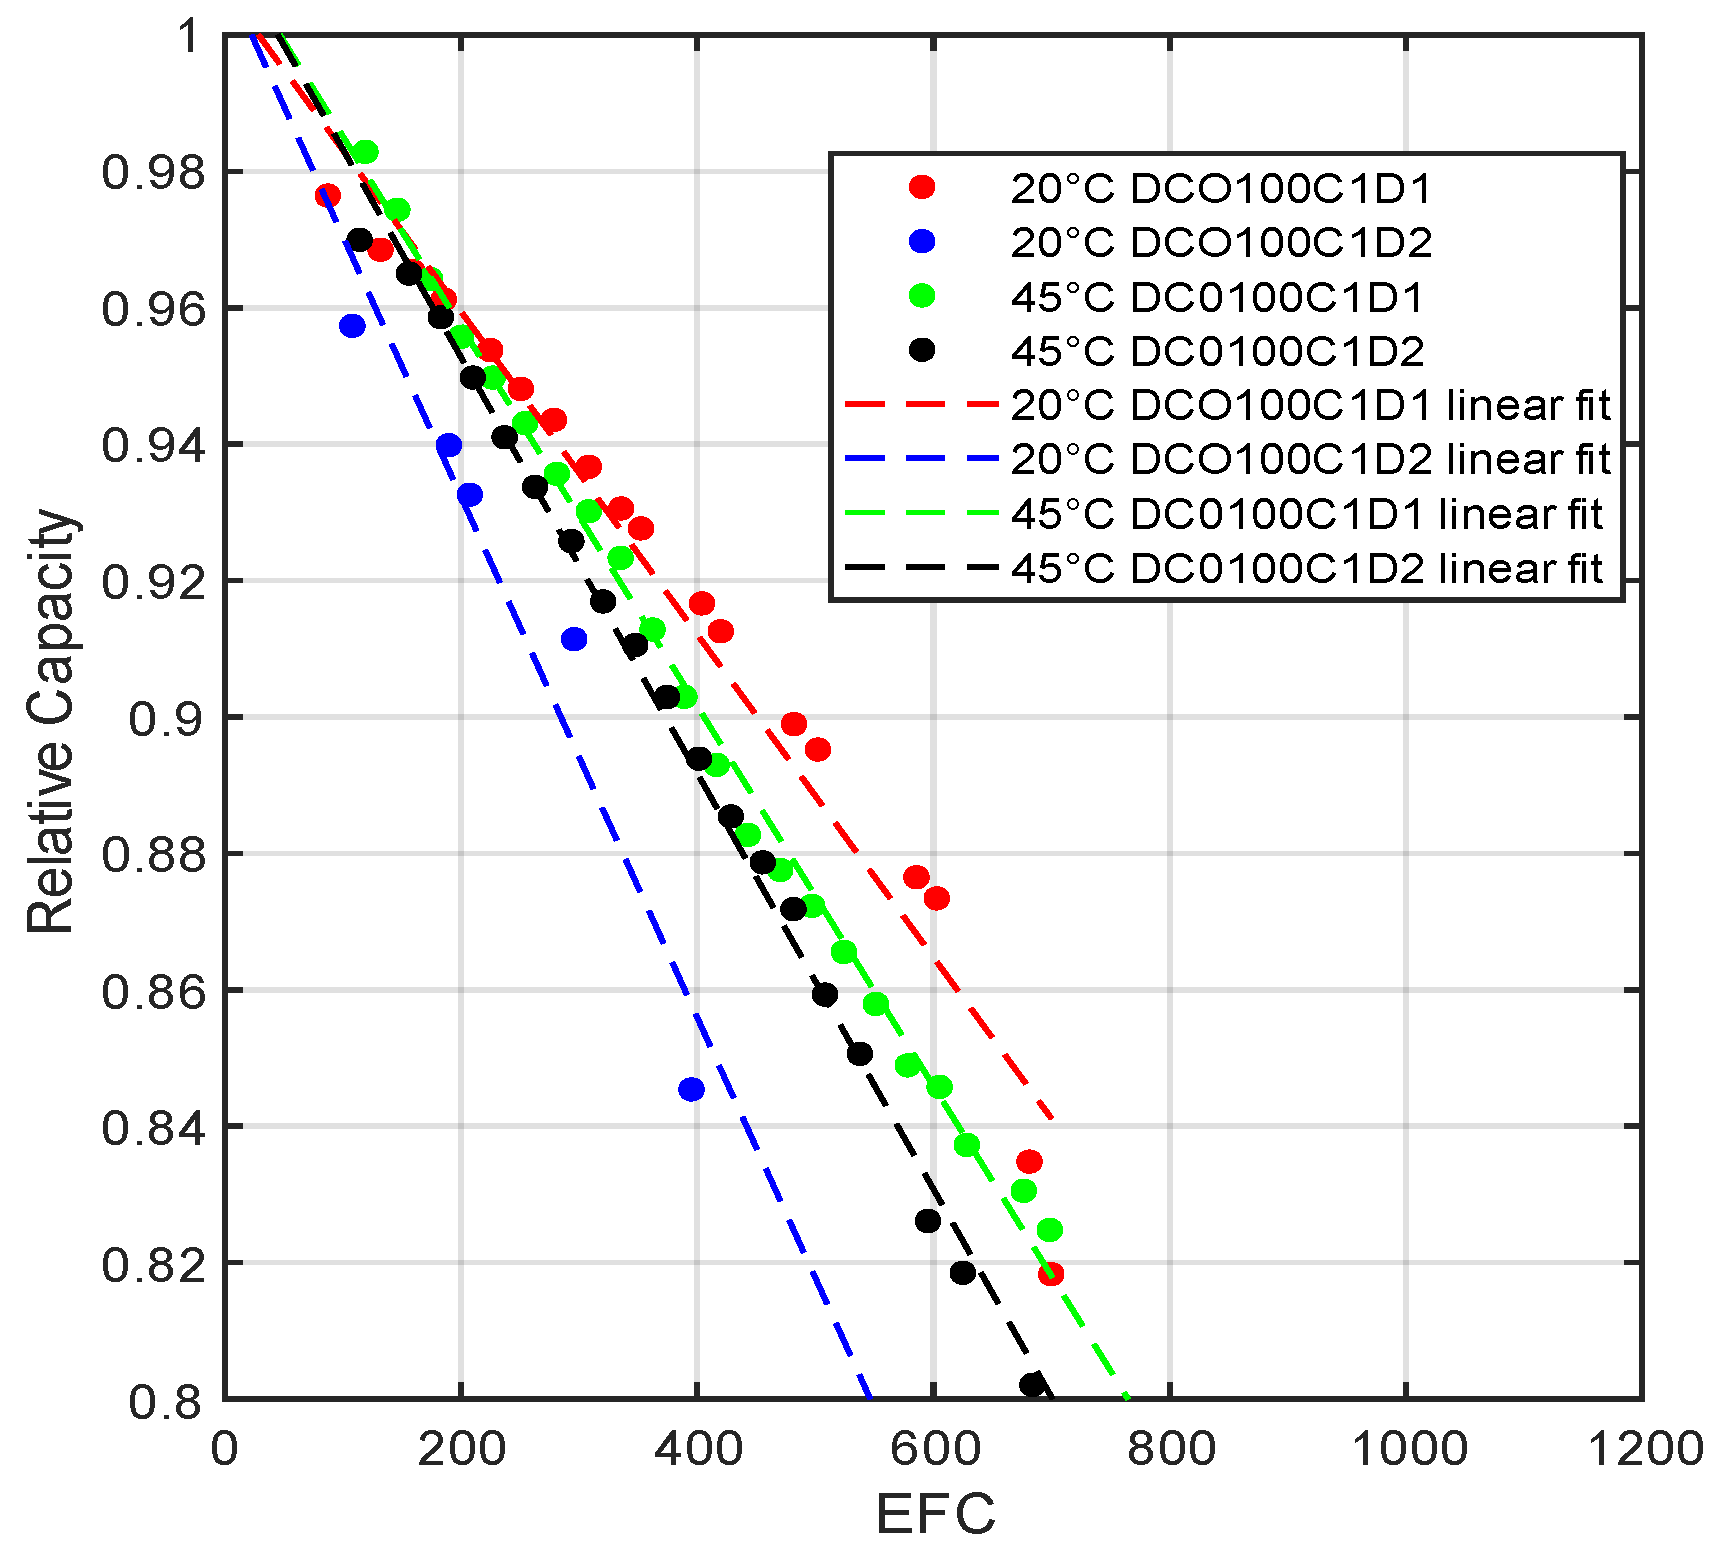
By the analysis of the references [,,,,], the degradation, as a rate of loss of capacity, can be modeled as a nonlinear function of temperature, charge/discharge current rate and depth of discharge (DoD). Tests conducted in [] point to a high correlation between the degradation rate and State of Health (SoH) regulation range, 100% to 80%, with a linear fitting, as presented in Figure 1. Considering the degradation versus SoH linear, it is possible to assume that SoH does not affect the degradation phenomena itself. For simplification, the DoD is usually eliminated from degradation models by keeping its value constant.

Figure 1.
Degradation phenomena as the loss of capacity per cycle [] (DCO stands for Depth of discharge, C is the charge rate and D is the discharge rate).
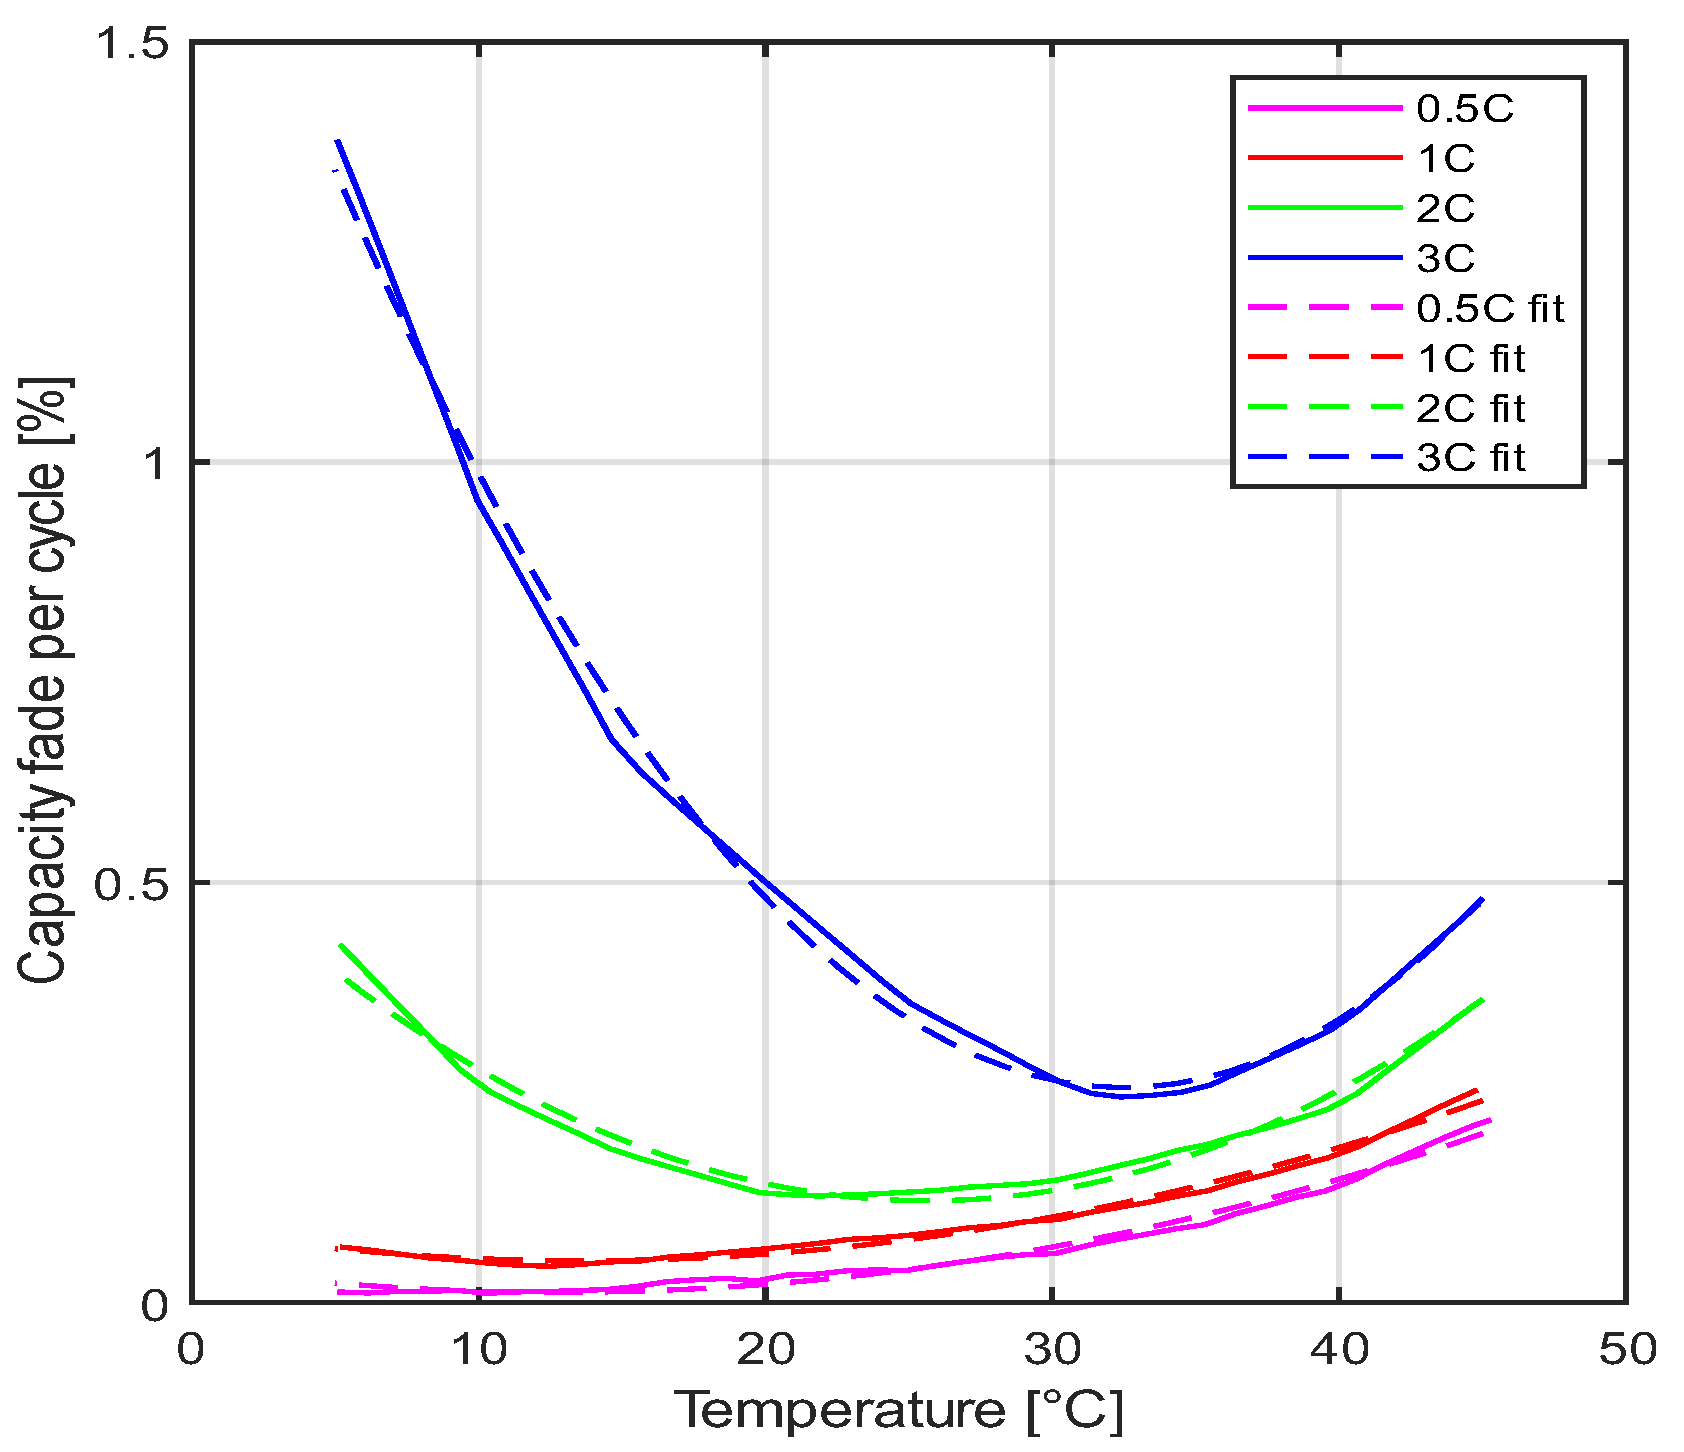
According to the experimental results seen in [], for a fixed discharge current value, varying only the temperature, the degradation rate behaves similarly to a second-order polynomial equation. As presented in Figure 2, the degradation rate reaches a minimum value for a certain temperature, and from that point, it tends to increase with any temperature variation. That behavior can be approximated to a second-order polynomial function with high correlation. In the same way, experimental results shown in [] point to similar behavior of degradation for fixed temperatures, varying only the discharge current rate.

Figure 2.
Influence of discharge rate and temperature on degradation.
In that way, the proposed degradation modeling for a full DoD can be approximated by a biparametric equation with temperature and discharge as variables. A biparametric model is a well-known model in the automotive industry, with common use on internal combustion brake-specific fuel consumption (BSFC) models []. In the case of degradation modeling, the degradation rate (Drate) data, as a percentage of loss of capacity, and the variables, temperature (Tbat), °C, and discharge current (I), A, must be collected. As with any empirical method, the extraction of data occurs by experimental tests on the target cell. The model assertiveness relies on the amount of data provided in all strategy range operations. The use of insufficient data will produce disparity in experimental values, mainly in the regions where there is no data available. Following the same steps presented in [], changing the target function and variables, the degradation rate equation is described as presented in Equation (1).
The degradation model presented is based on the assumption that the battery respects all considerations made in this section. Although LiBs share the same major degradation mechanisms, it cannot be stated that the model is suitable for all existent LiBs. This is due to the insufficient literature material about different battery’s degradation behavior.
Finally, degradation, in addition to decreasing battery life, also generates an increase in energy losses during operation, which become prominent with the decrease of SoH []. That means that an older cell generates more heat than a new one in the same operating conditions. That effect will be discussed further in the internal resistance modeling section.
2.2. Cell Heat Generation Modeling
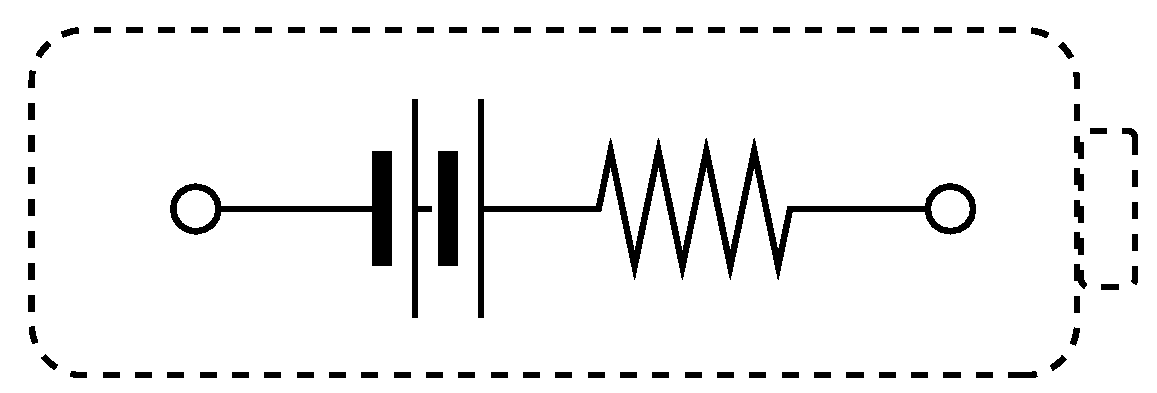
The operation of any battery produces energy loss, which is converted mainly into heat due to different mechanisms []. This phenomenon must be treated correctly by the BTMS, guaranteeing a secure temperature operation. The correct operation of the BTMS requires knowledge of the amount of heat produced by the battery. According to results pointed out in [,,], heat generation is directly influenced by the discharge current, the cell’s temperature and the State of Charge (SoC). Given the direct influence of the discharge current, the energy loss is usually treated as internal resistance, as presented in Figure 3.

Figure 3.
Cell’s internal resistance simplified model.
The cell’s heat generation () equation, presented in Equation (2), is related to the Joule effect, given the modeled internal resistance, and heat due to entropy generation rate [].
The internal resistance (Ri) is considered by the voltage drop across the battery terminals when a load is applied (VT), compared to the voltage applied in the no-load situation, the Open Circuit Voltage (OCV), as shown in Equation (4). The VT parameter, usually given by the cell’s manufacturer, is modeled as a function of SoC and temperature [,]. This way of modeling the heat generation has a high correlation to experimental results, as presented in []. As introduced previously, the degradation mechanism increases the battery’s internal resistance. Since the degradation mechanisms result in the loss of capacity, the increase of internal resistance can be described as a function of the cell’s SoH. Results presented in [] indicate that the increase of resistance (Rincrease (%)) in relation to SoH has a high correlation to a linear function for the lithium-ion cell tested. Assuming similar behavior, the increase of resistance equation can be described as Equation (3). The slope value (Sinc) is obtained through experimental tests.
Through the variables that directly influence its value, the internal resistance calculation is presented in Equation (4).
The entropy generation, the second part of the heat generation equation, can be achieved experimentally as a function of SoC [,]. It is worth mentioning that for some applications, like hybrid vehicles, the entropy generation rate is often neglected because, at high charge/discharge rates, irreversible Joule heating becomes more dominant than reversible entropic heating [].
2.3. Cooling System
Degradation and energy losses during operation are inevitable, but these mechanisms must be controlled to guarantee battery safety, health and performance. As seen previously, these mechanisms are directly linked to the cell’s temperature, having the BTMS play a key role in controlling the temperature. The cooling system can be designed as air-cooling or as liquid cooling, having the last one better heat exchange capacity. The cooling system operation is based on the premise in which the amount of heat produced by the hot source will be absorbed and rejected by another source, usually the environment. That means that the total heat produced by the entire system () is null. Considering only the battery temperature maintenance, the governing equation of heat is described as presented in Equation (5). The amount of heat produced by the battery pack () is equal to the sum of the heat produced by the cell’s heat () times the number of cells ().
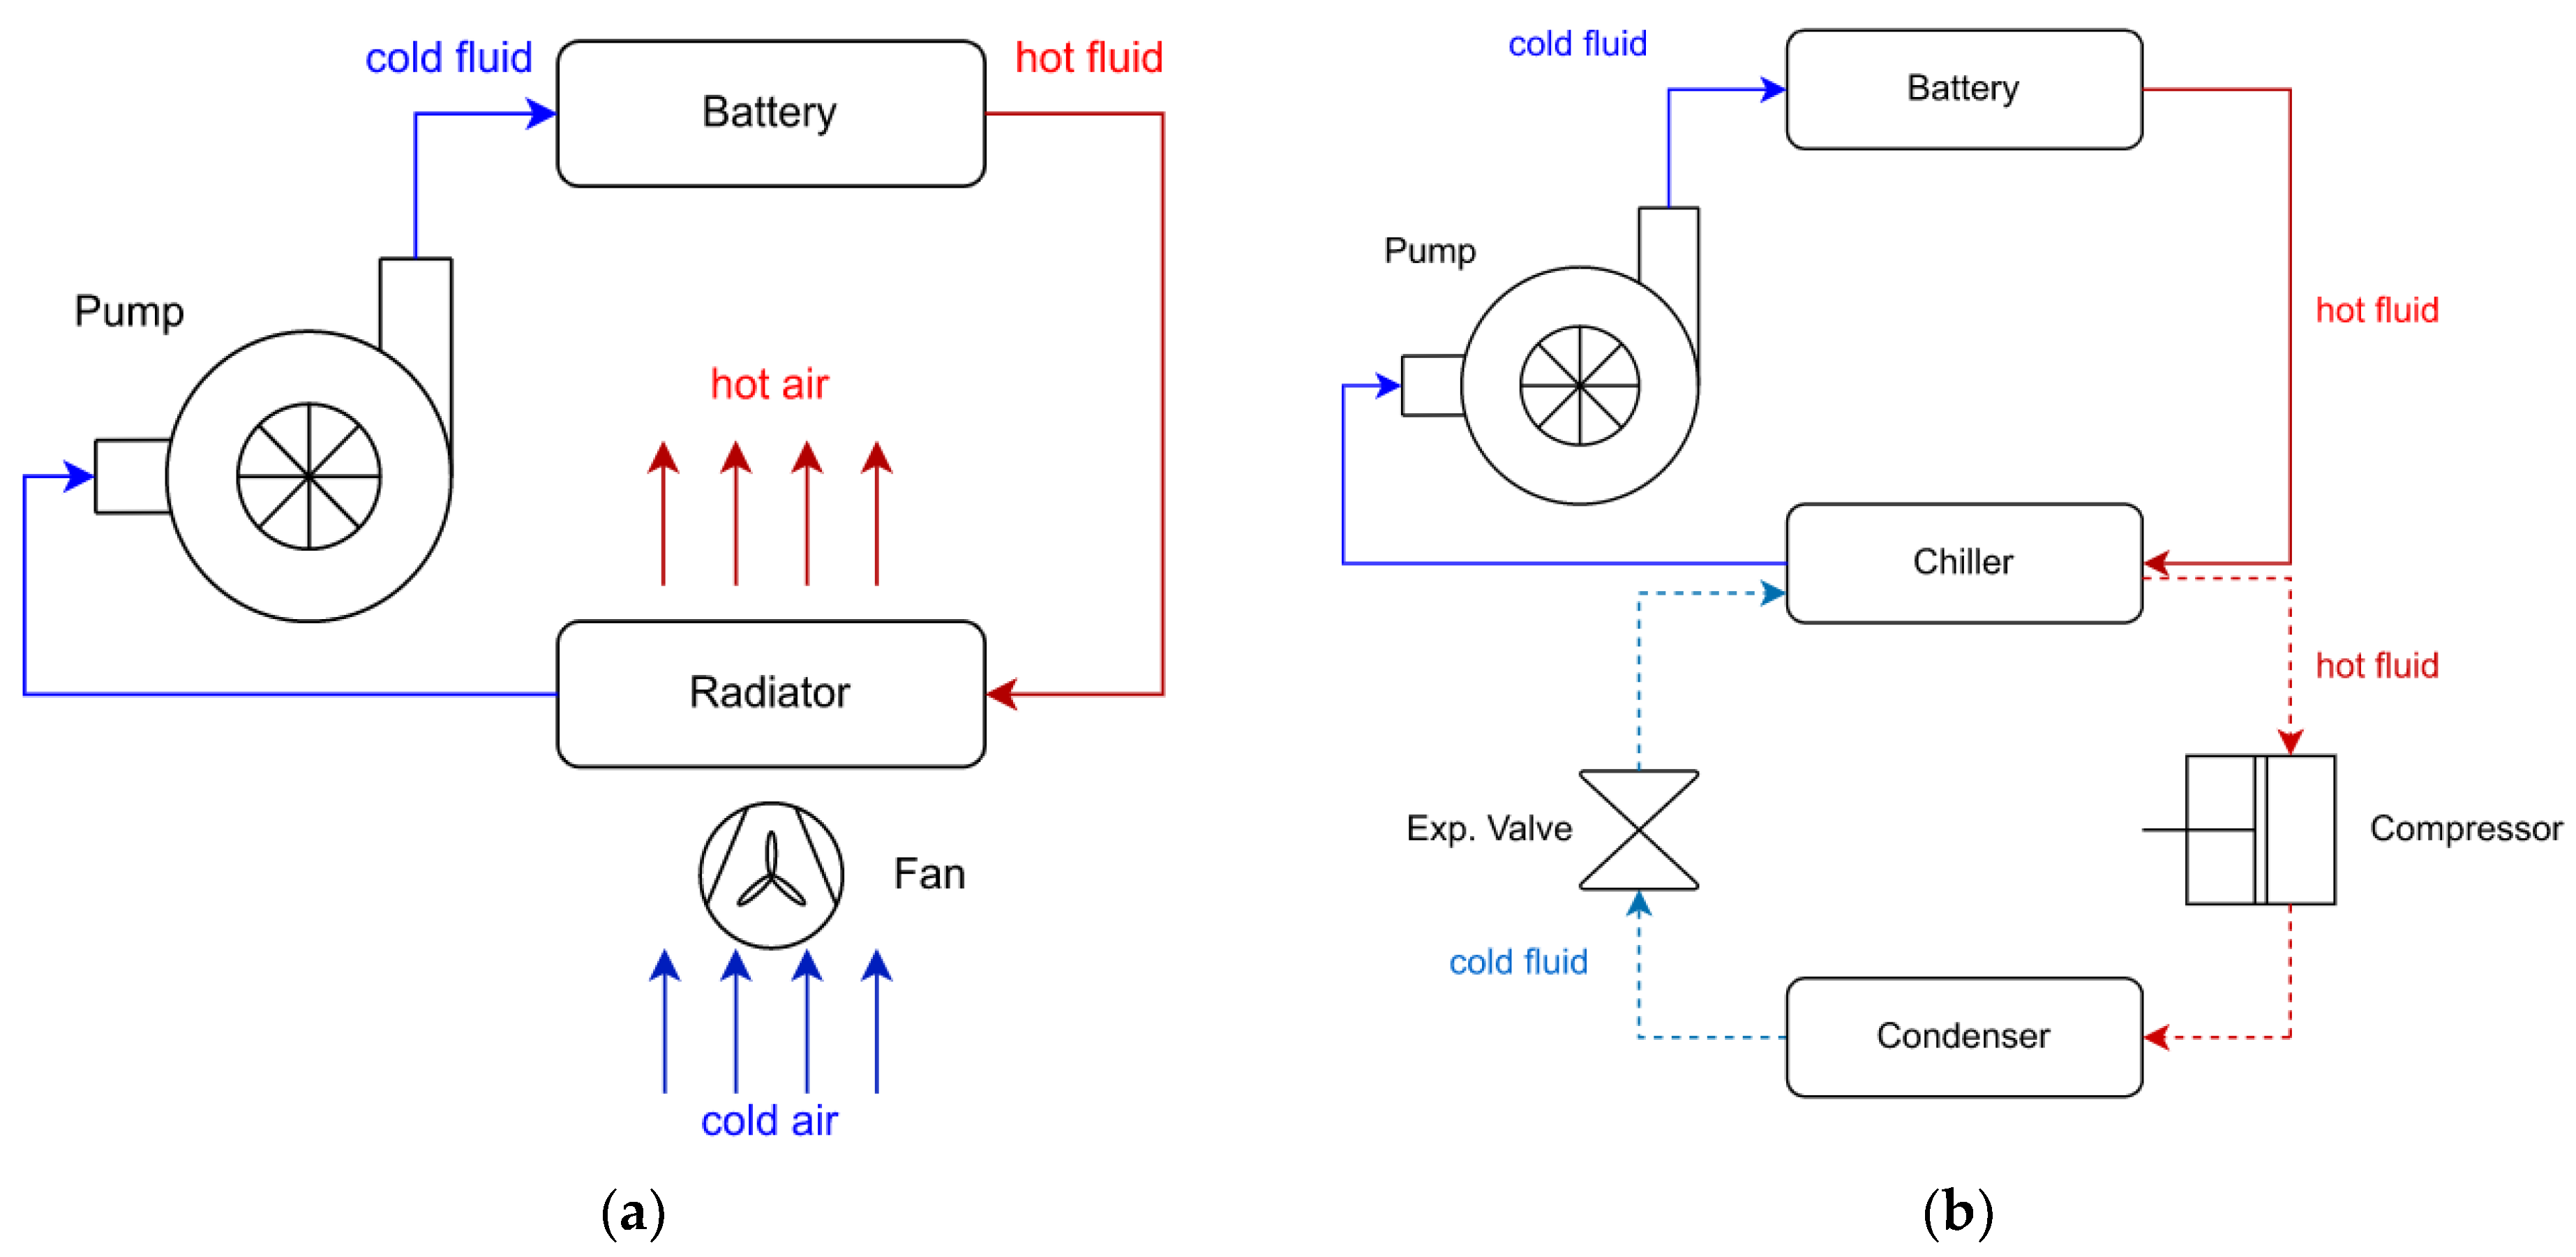
A liquid cooling system has two types of design, radiator-based and refrigeration-based. These two types of design have different calculation formulations and applications. A radiator-based cooling consists in a transport fluid system that takes the heat from the battery pack and rejects it to the environment through the radiator. This type of system is very effective when the environmental temperature is lower than the target battery temperature. A liquid pump, a radiator and a fan are the main system components, as shown in Figure 4a.

Figure 4.
Liquid cooling system types: (a) radiator-based and (b) refrigeration-based.
Refrigeration-based cooling system, as radiator-based, operates with a transport fluid that takes the heat from the battery pack and rejects it to a heat exchanger. The heat exchanger is the key difference from a radiator-based system, which, in this case, is a chiller. A chiller is a device that provides adequate heat exchange between two different working fluids without direct contact. The fluid that exchanges heat with the transport fluid is a refrigerant fluid that runs in another circuit called a refrigeration circuit. The usual schematic of a refrigerator-based system is presented in Figure 4b.
The refrigeration circuit, widely used in refrigerators and air conditioners, consists of a four-step thermodynamic cycle: evaporation, compression, condensation and expansion []. This type of thermodynamic circuit takes most part of the energy used in cooling the transport fluid from the environment, operating at a higher efficiency than the radiator-based system. Another difference from a radiator circuit is that a refrigeration-based system can cool the transport fluid to temperatures below the environment temperature, having a more complex and expensive construction.
The heat exchange capacity of a liquid-based cooling system is directly affected by some variables associated with the transport liquid, heat rejection fluid and heat exchanger properties, being the major ones: the temperature difference between the battery pack and the reject fluid, the heat exchanger’s surface area and thermal conduciveness and the fluids flow rates. The modeling of heat equations for liquid cooling systems is widely used through two major equation systems: the NTU effectiveness and the LMTD (Logarithm Mean Temperature Difference) [].
Widely used in radiator-based models, the NTU effectiveness method operates with less information than the LMTD method []. As shown in Equation (7), the amount of heat transferred in the heat exchanger is calculated with the fluid with minimum heat transport capability, the inlet temperature difference between fluids and the correction factor ε. This correction factor, Equation (8), denominated effectiveness, is a function of NTU and the fluid’s heat capability ratio, being the function defined by the heat exchanger construction characteristics []. The variable NTU is associated with the global heat transfer number, the contact surface area between fluids and the minimum heat transport capability. The minimum heat capacity (Cmin) is a result of a comparison between the two working fluids with the minimum capacity of exchange heat, which is calculated as presented in Equation (9). c is the fluid-specific heat, stands for the volumetric flow rate, Ttransport inlet is the transport fluid temperature on the heat exchanger’s inlet and Trejection inlet is the heat rejection fluid temperature on the heat exchanger’s inlet.
To attest to the model validity, tests conducted in [,] compared a radiator-based liquid cooling system with the use of the NTU method with experimental results with great correlation. For a better understanding of the NTU method, a better discussion of the method can be seen in [,,,,]. It is worth noting that these equations are directly affected by the fluid’s properties at specific environmental and/or operational conditions. Neglecting the variation of fluid properties will produce disparity compared to real results. It is also important to detect the fluid flow pattern if it is in a laminar, turbulent or laminar–turbulent transition region. These flow patterns directly influence the Nusselt number calculation, consequently obtaining the heat transfer rate []. To determine the flow pattern, the Reynolds number (Re) is used, presented in Equation (11). The Reynolds number, as a ratio of inertial and viscosity forces, is given by the equivalent diameter (D) and the fluid’s velocity (v), specific mass () and kinematic viscosity (μ). In tubes, laminar flow occurs for Re < 2300, turbulent for Re > 4000, and between these values sits the transient flow pattern [].
The power demanded, in W, by a radiator-based cooling system is associated with the sum of the pump’s power and the fan’s power, Equation (12). The power demanded by the pump and fan is obtained with the determination of the necessary fluid volumetric flow from Equations (13) and (14). The relation of volumetric flow and power demanded by that type of equipment can be modeled using experimental data or deducted formulas.
The power consumption, in W, of a refrigeration-based system is determined by the sum of the pump’s power and the compressor’s power, Equation (15). Relation to the demanded flow rate determines the power demanded by the pump, as indicated in Equation (13). In the case of the compressor, the power is obtained through the difference between the energy absorbed in the condensation step and heat exchanged in the evaporation step. The energy difference can be calculated with the enthalpy difference between the condenser inlet and evaporator outlet, multiplied by the fluid volumetric flow rate, as presented in Equation (16).
2.4. Problem Statement
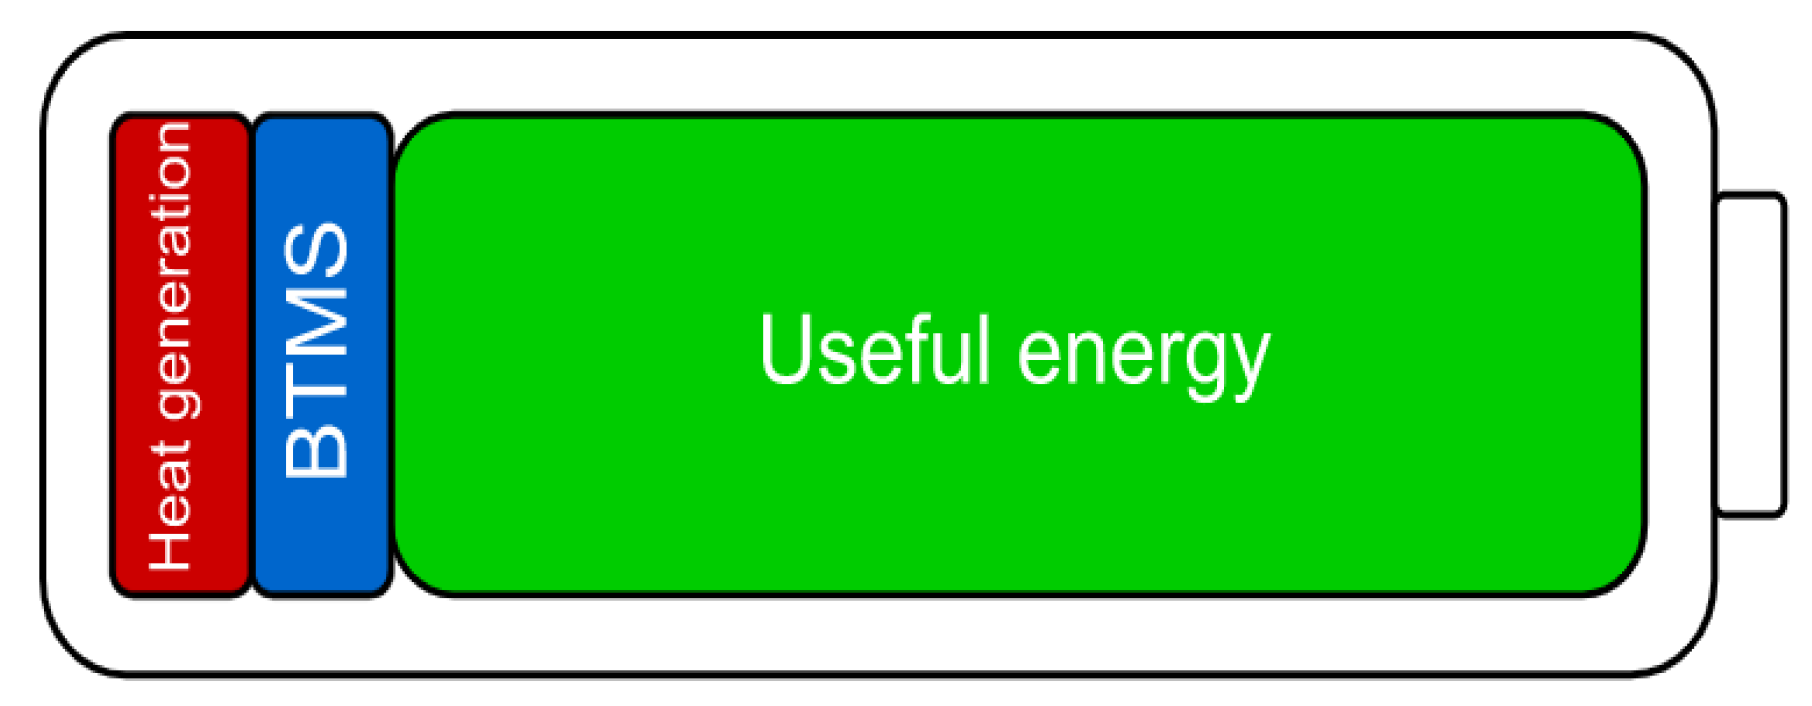
In a discharging cycle, the battery autonomy defines the total time of the vehicle’s operation. As discussed in the previous topics, autonomy is directly impacted by the cell’s heat generation. This heat is a consequence of battery energy losses, which takes another part of the cell’s energy to power the BTMS devices, lowering even more the useful energy, as shown in Figure 5.

Figure 5.
Energy portions distribution in a cycle.
The useful energy through a cycle (Quseful) can be expressed as presented in Equation (17). As Q being the amount of energy available in the battery in Wh, Pcool being the total power demanded by the equipment of the temperature control system, being the battery energy rate converted into heat in W and top being the total running time of the vehicle in hours.
Equation (17) can be rewritten in terms of the percentage of useful energy compared to the total battery energy, as presented in Equation (18). Being cycle useful (Cycleuseful) is an important parameter to establish the relation between a cell’s heat and degradation.
The determination of a battery’s total cycles depends on the estimation of degradation. Since the degradation rate translates into the loss of battery capacity per cycle, it is possible to estimate the number of cycles until the end of the device’s life with the usable range of SoH. The number of cycles (Cycles) is determined as the ratio of capacity loss within the acceptable SoH range and the degradation rate, as given in Equation (19). stands for the battery life interval stated previously; stands for the degradation rate in relation to the total capacity of the battery, in percentage.
In Equation (18), a definition of a useful cycle was established in terms of the fraction of energy available to the vehicle. In the same way, the definition of total useful cycles can be understood as the result of the number of cycles with only useful energy available. In this way, the total useful cycles (Cyclesuseful) results as the product of the battery’s useful energy fraction and the number of cycles expected until its end of life, as expressed by Equation (20).
From Equation (20), it is possible to rewrite it in the form of Equation (19), starting from the consideration of a normalized degradation rate (), as presented in Equation (21). The normalized degradation rate takes both degenerative effects, degradation and heat generation, into consideration, as presented in Equation (22).
With both negative phenomena described in the same equation, as presented in Equation (22), it is now possible to analyze the problem with the use of optimization algorithms.
The deduction of Equation (22) is made through simple physical considerations, such as the battery’s energy conservation and the estimation of the total number of cycles based on the stated SoH range and the rate of decrease in health. With this, it can be stated that the equation in question can be applied to any LiB and BTMS system, considering the correct modeling of those devices and systems.
3. Case Study
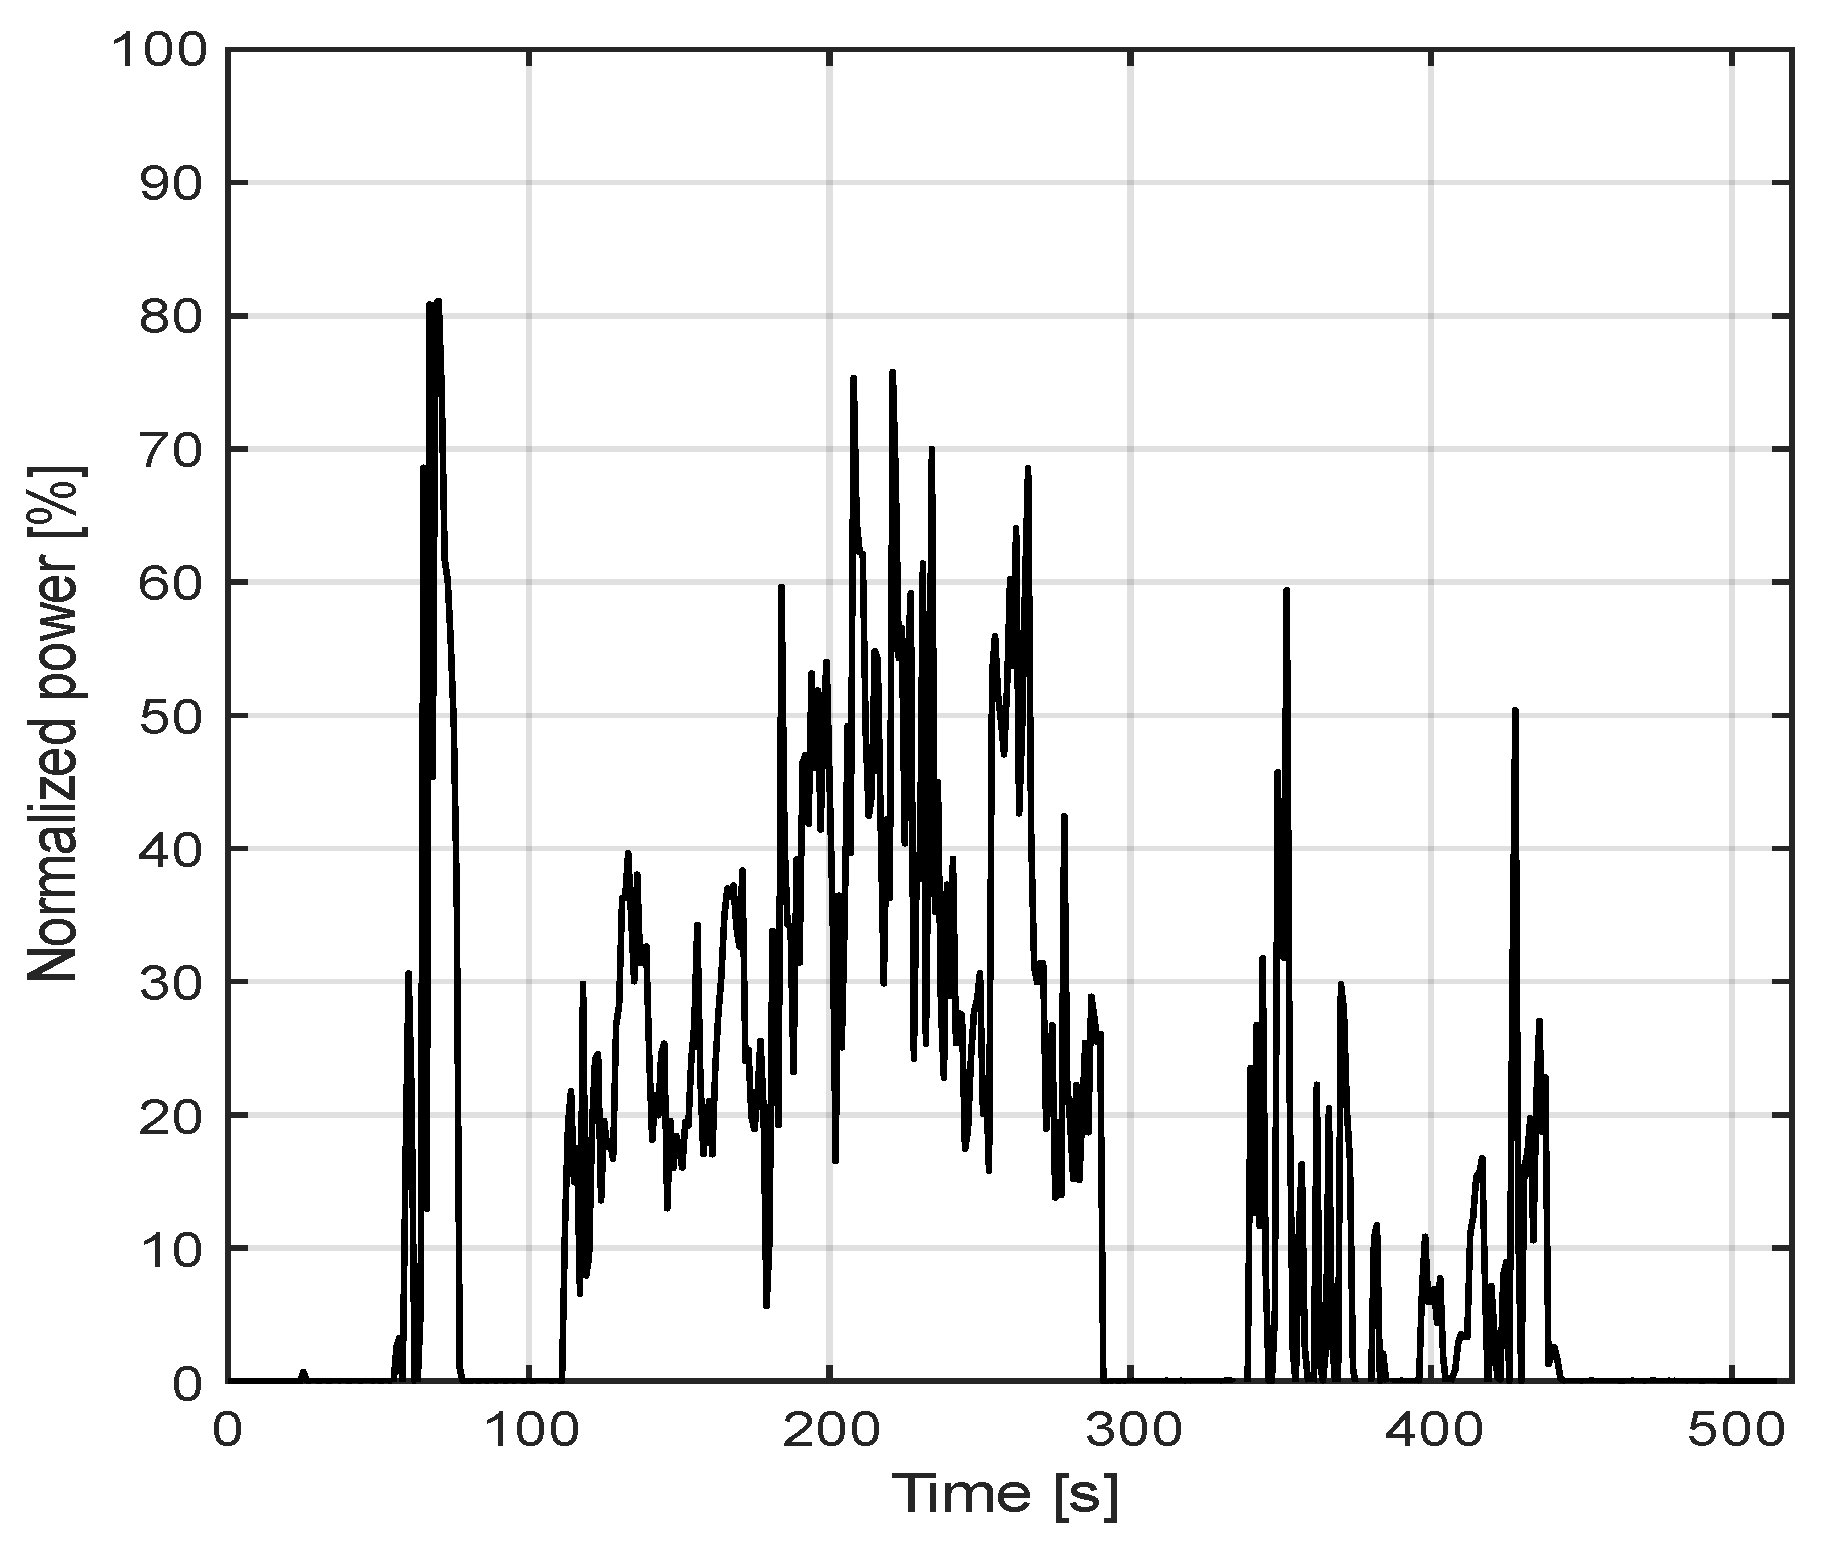
A case study is proposed to validate the equation that establishes a relationship between heat generation and degradation. The case study is based on an off-highway hybrid vehicle. A backhoe non-road transient cycle, presented in Figure 6, is considered for obtaining the average power during operation. Table 1 presents the rated vehicle’s torque and speed.

Figure 6.
Power demand for EPA’s non-road transient cycle (NRTC).

Table 1.
Rated torque and speed for the electric motor.
Only the electrical part of the vehicle will handle the cycle to obtain the average power consumption of the operation. The presented cycle will repeat until the battery reaches 100% DoD. Table 2 presents the specification of the battery pack, composed of 18,650 type Lithium-ion cells.

Table 2.
Battery pack parameters.
From the considered cycle and the electrical part of the vehicle’s specifications, the average operation discharge current rate value fits between 1C and 2C. This information establishes the target discharge rate in which the degradation model should be more accurate. Two different electrode types of lithium-ion are tested. Experimental data from NMC (LiNiCoMnO2) and NCA (LiNiCoAlO2) 18,650 cells are taken from the literature to build heat generation and degradation models.
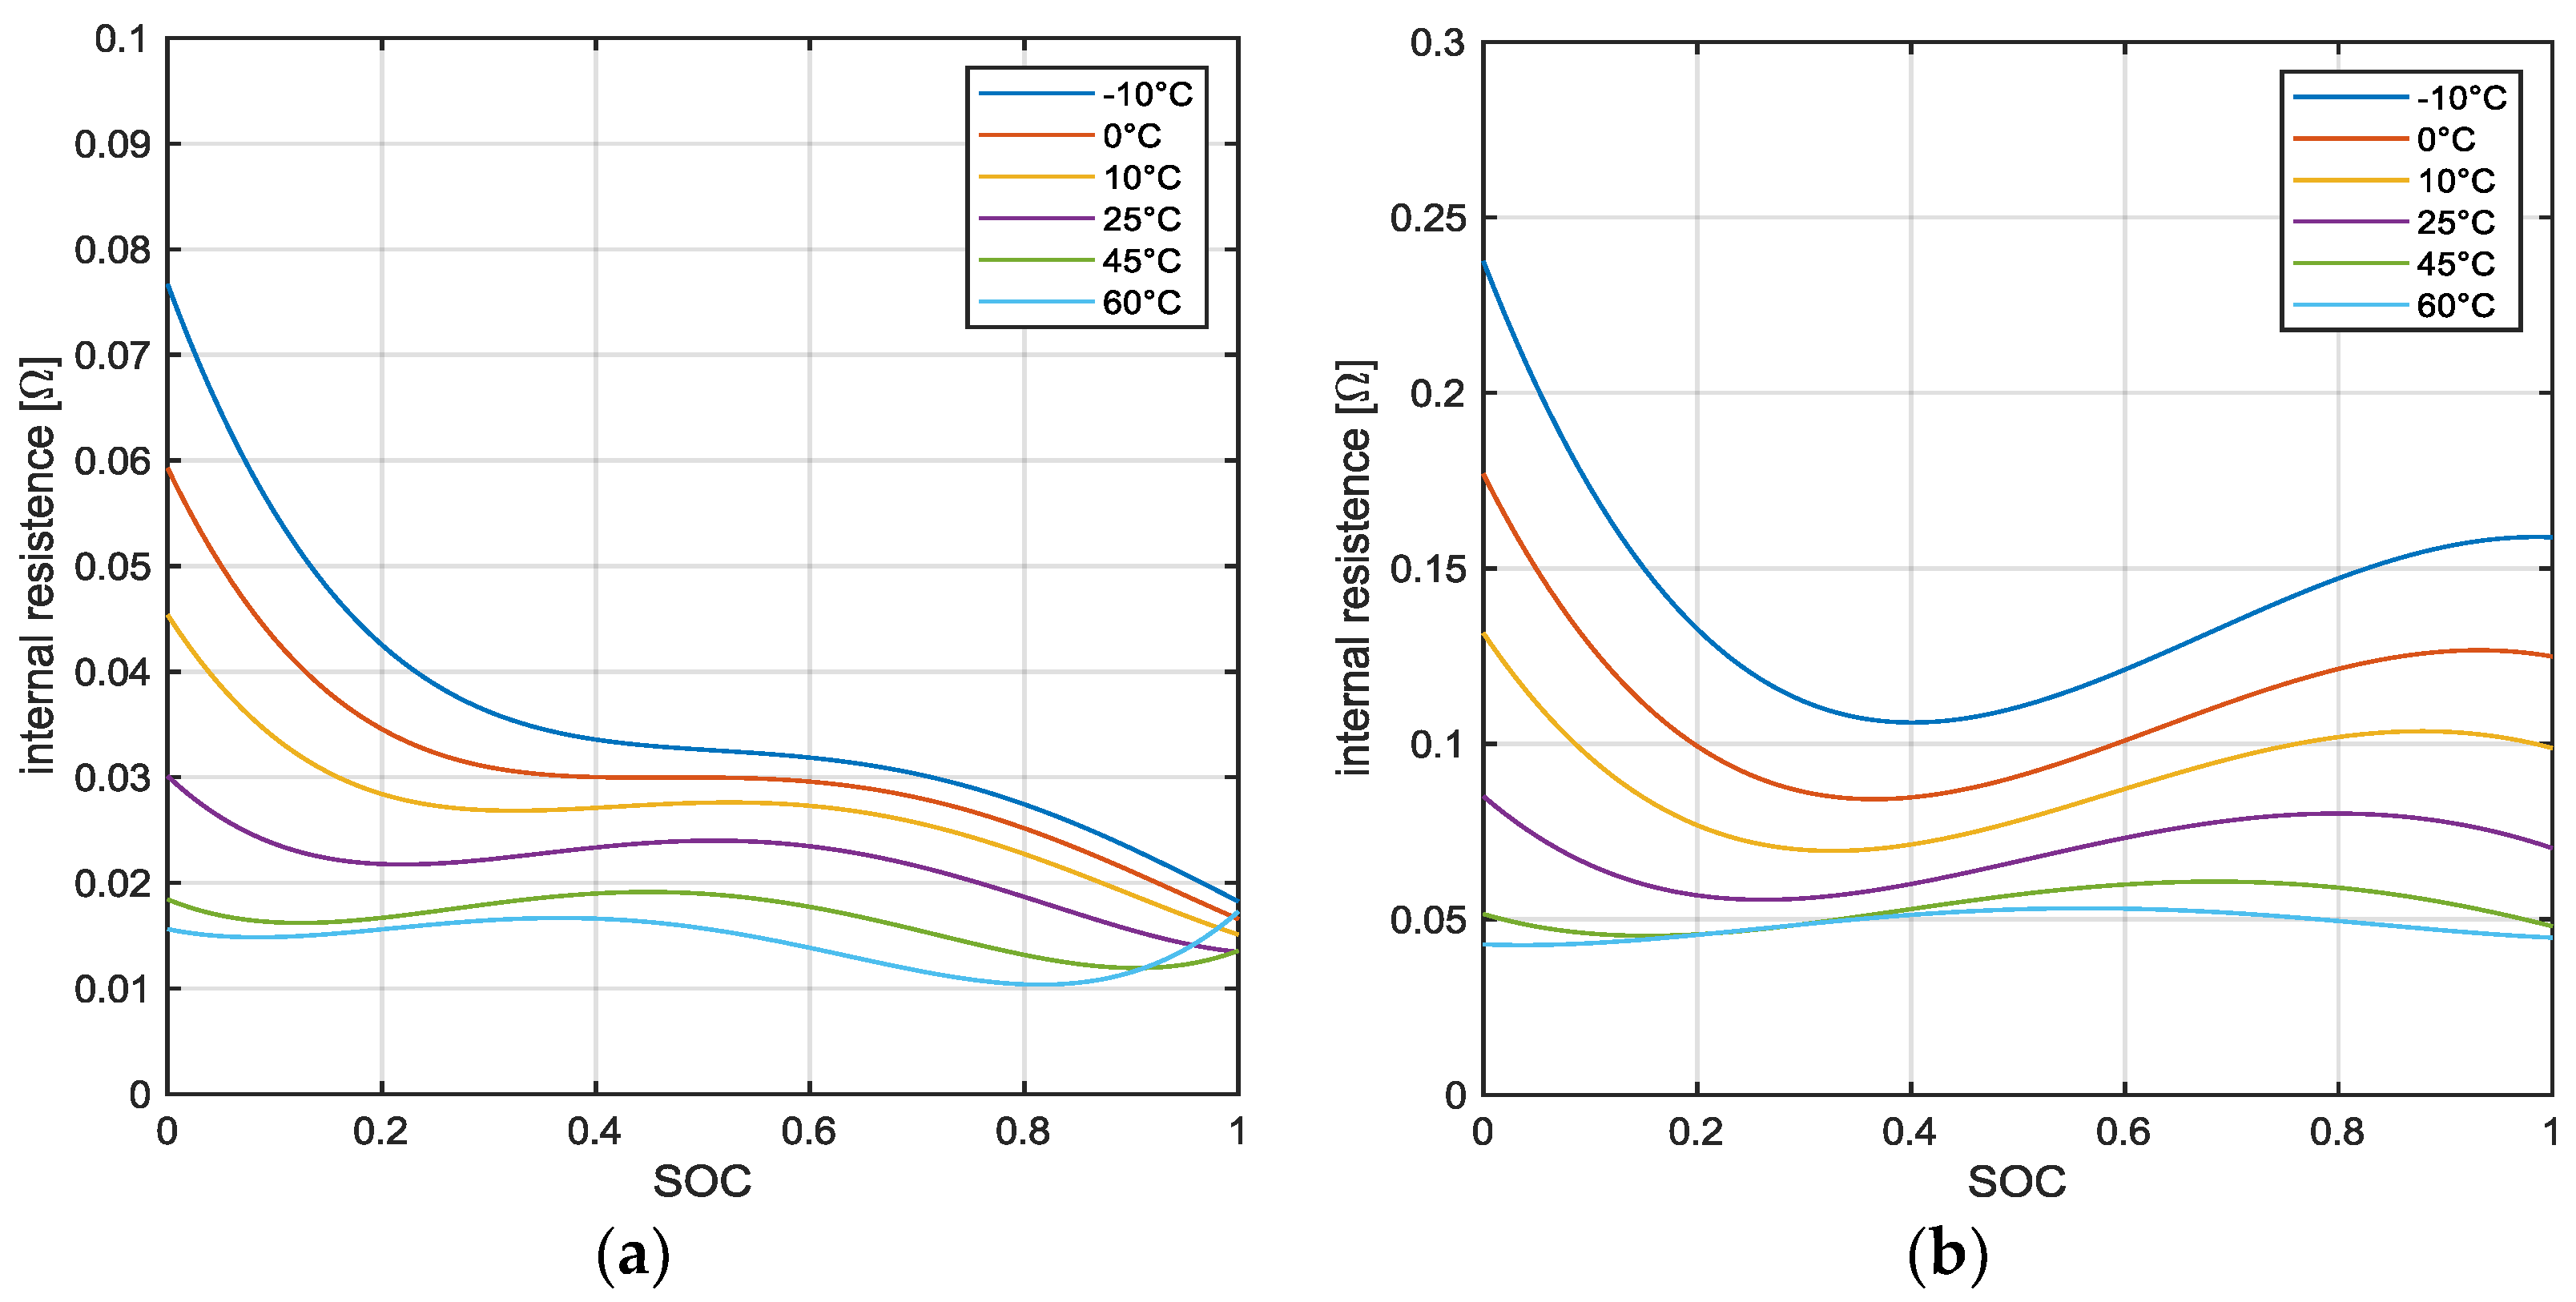
Through the method presented in Section 2.3, the heat generation is modeled as internal resistance. Figure 7 shows the results of the internal resistance model, which was formulated with the use of the data collected from the datasheets of cell manufacturers. Both the NMC and NCA cells have lower internal resistance at 60 °C, indicating that at this temperature, the energy loss due to heat generation will be minimum. NMC type cell has smaller internal resistance when compared to the NCA type cell, meaning that the effects of energy loss due to heat generation will have less influence during operation. According to [], the increase of resistance because of the cell’s aging is set to 30% at the end of the device’s life, i.e., SoH equal to 80%. The internal resistance model obtained has similar behavior to the experimental results shown in [].

Figure 7.
Equivalent internal resistance model of the NMC (a) and NCA (b) cells.
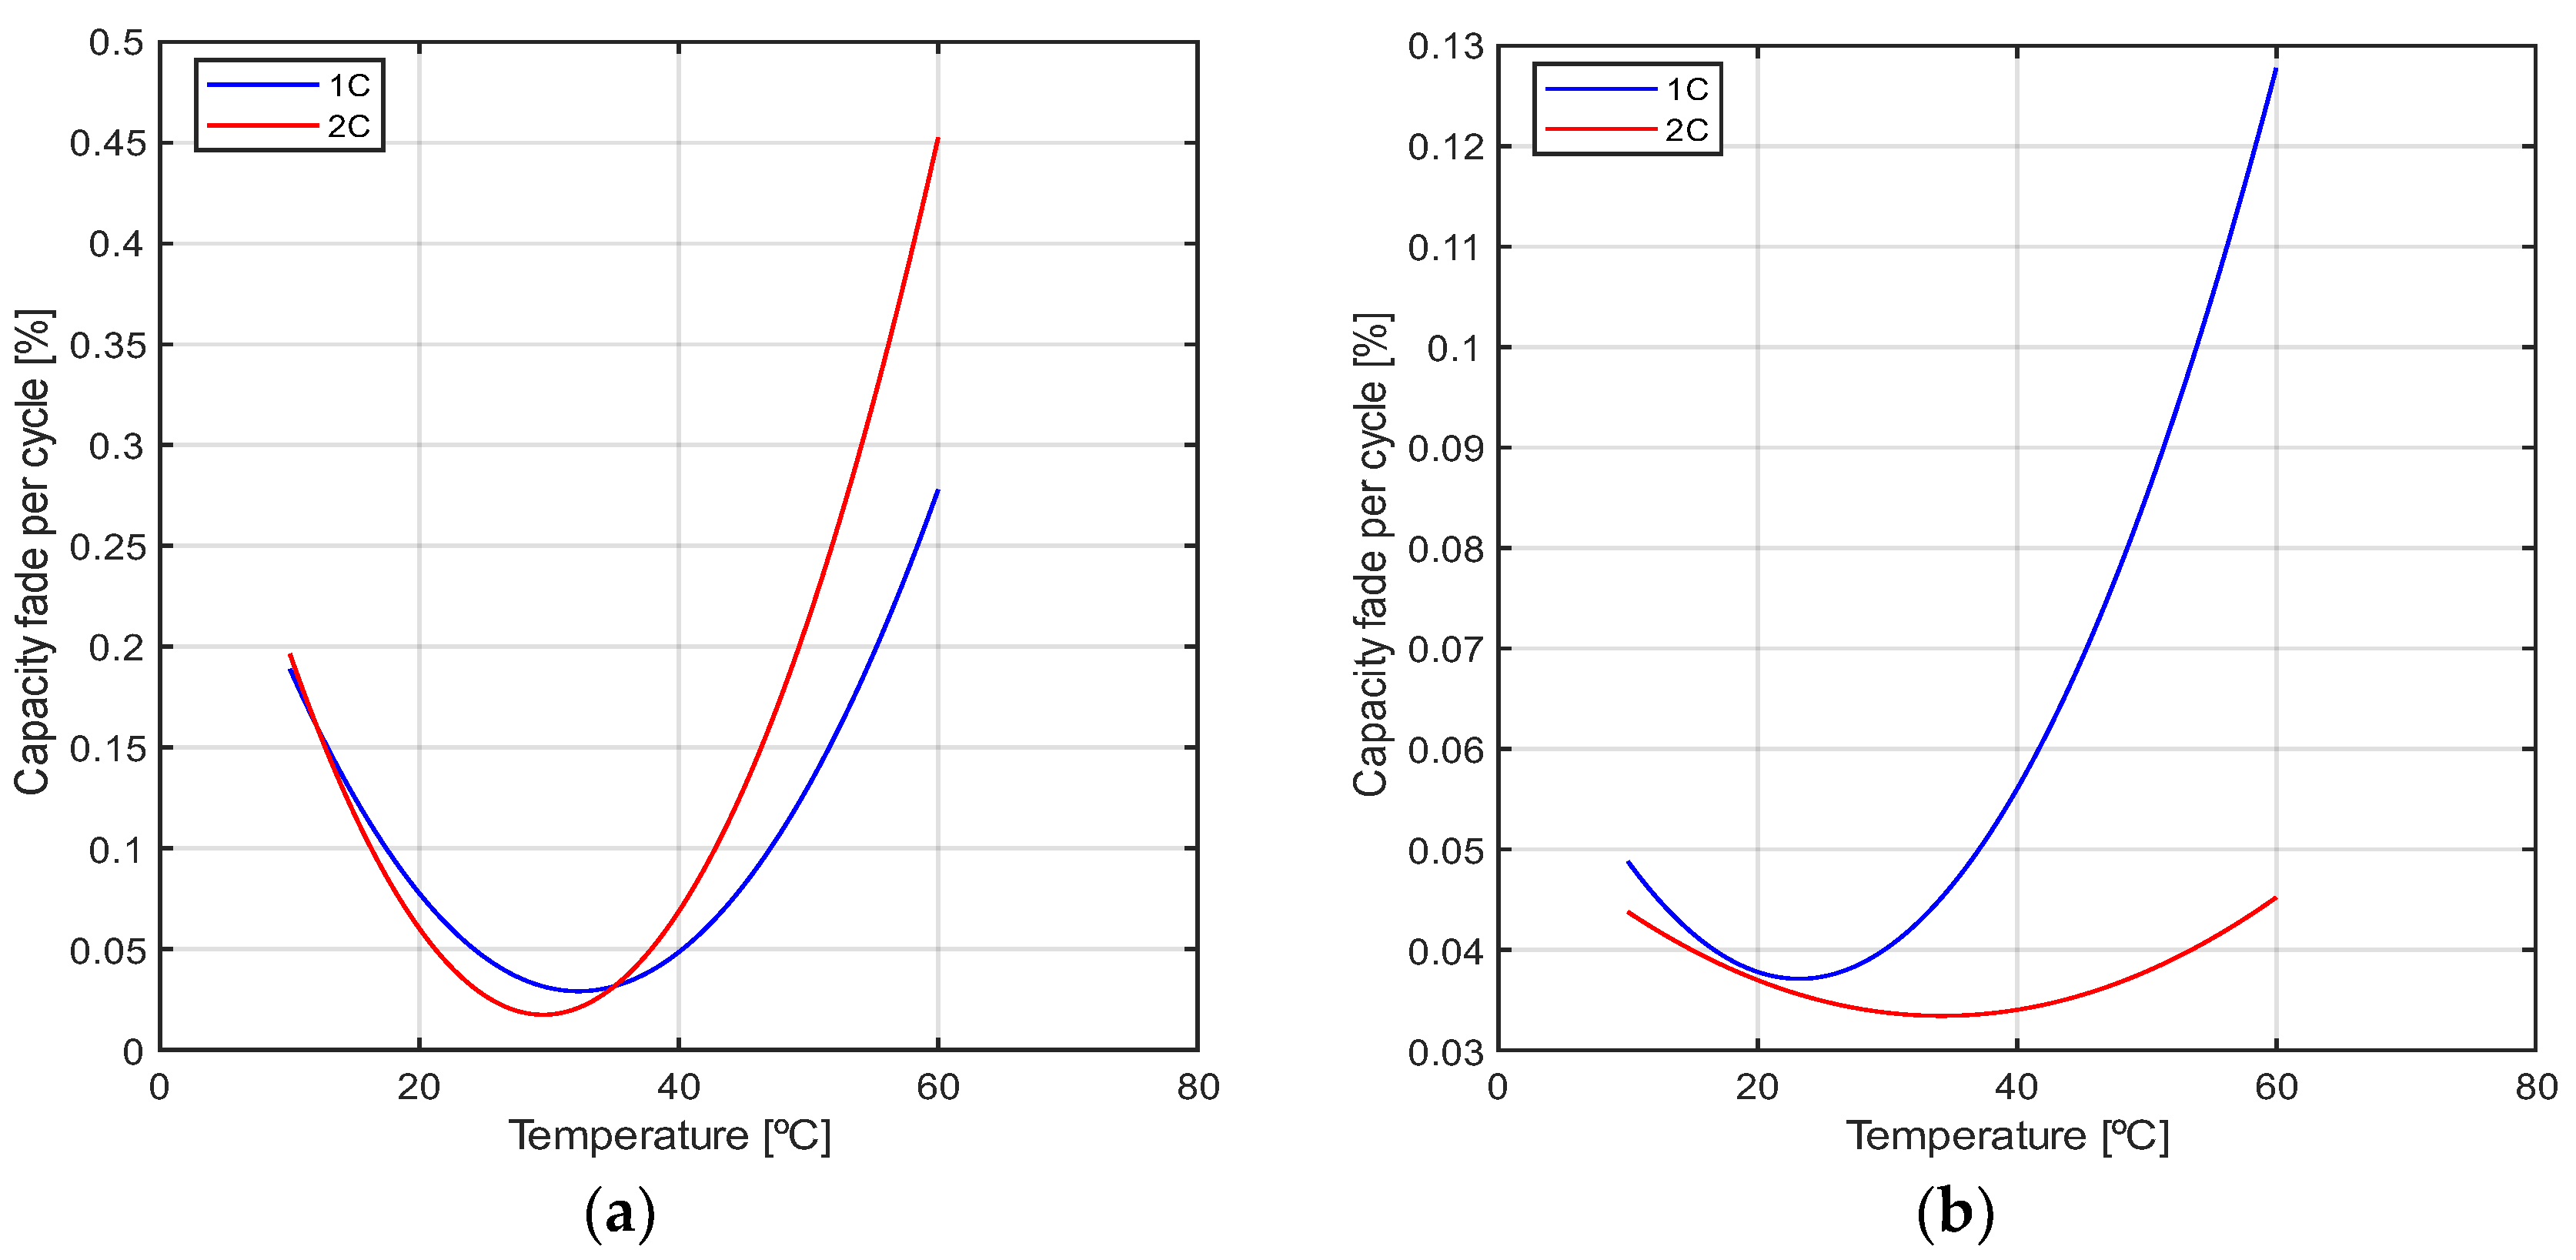
To establish a robust degradation method under 1C and 2C discharge rates, experimental results were taken from [,,,,,,]. As stated in Section 2.2, these experimental data were collected considering the three vital pieces of information: the degradation and discharge rate and cell temperature. The matrix is generated, and the kn coefficients are retrieved, being the degradation behavior of the NMC and NCA cells shown in Figure 8. The NMC cell has less degradation in its optimum point, but the degradation values tend to grow with a greater degree when distancing from this point. For the NMC cell, the increase in discharge rate, between 1C to 2C, decreases the optimum temperature; the opposite effect is observed in the NCA cell. The degradation behavior of both cells has similarities to the experimental tests conducted in [].

Figure 8.
Equivalent degradation model of the NMC (a) and NCA (b) cells.
The battery cooling system is based on a radiator liquid cooling system with a water/ethylene glycol 50/50 mixture as transport fluid. For more accurate results, all fluid properties variation, such as specific mass and heat, are modeled as a function of the liquid’s temperature. The liquid flow and airflow region are kept in the laminar–turbulent transition and laminar region, respectively. A linear fitting approximates the properties data collected in [,]. Moreover, a linear fitting is used to calculate the pump and fan power consumption as a function of its volumetric flows, respectively
To solve the BTMS dilemma between autonomy and degradation, an optimization algorithm based on a hybridization of genetic algorithm and SQP (Sequential Quadratic Programming) is proposed. Equation (22), deducted in Section 2.4., stands for the case objective function. Seven variables are considered in the algorithm, as seen in Table 3; four of them are input variables, and three are output variables. The input variables’ values are arbitrated, approximating real-life conditions and feasible operational control range. The optimization algorithm calculates the output variable values within the constraints set. The environmental conditions considered for the case study are at 1 atm pressure and 25 °C ambient temperature.

Table 3.
Algorithm parameters and their constraints.
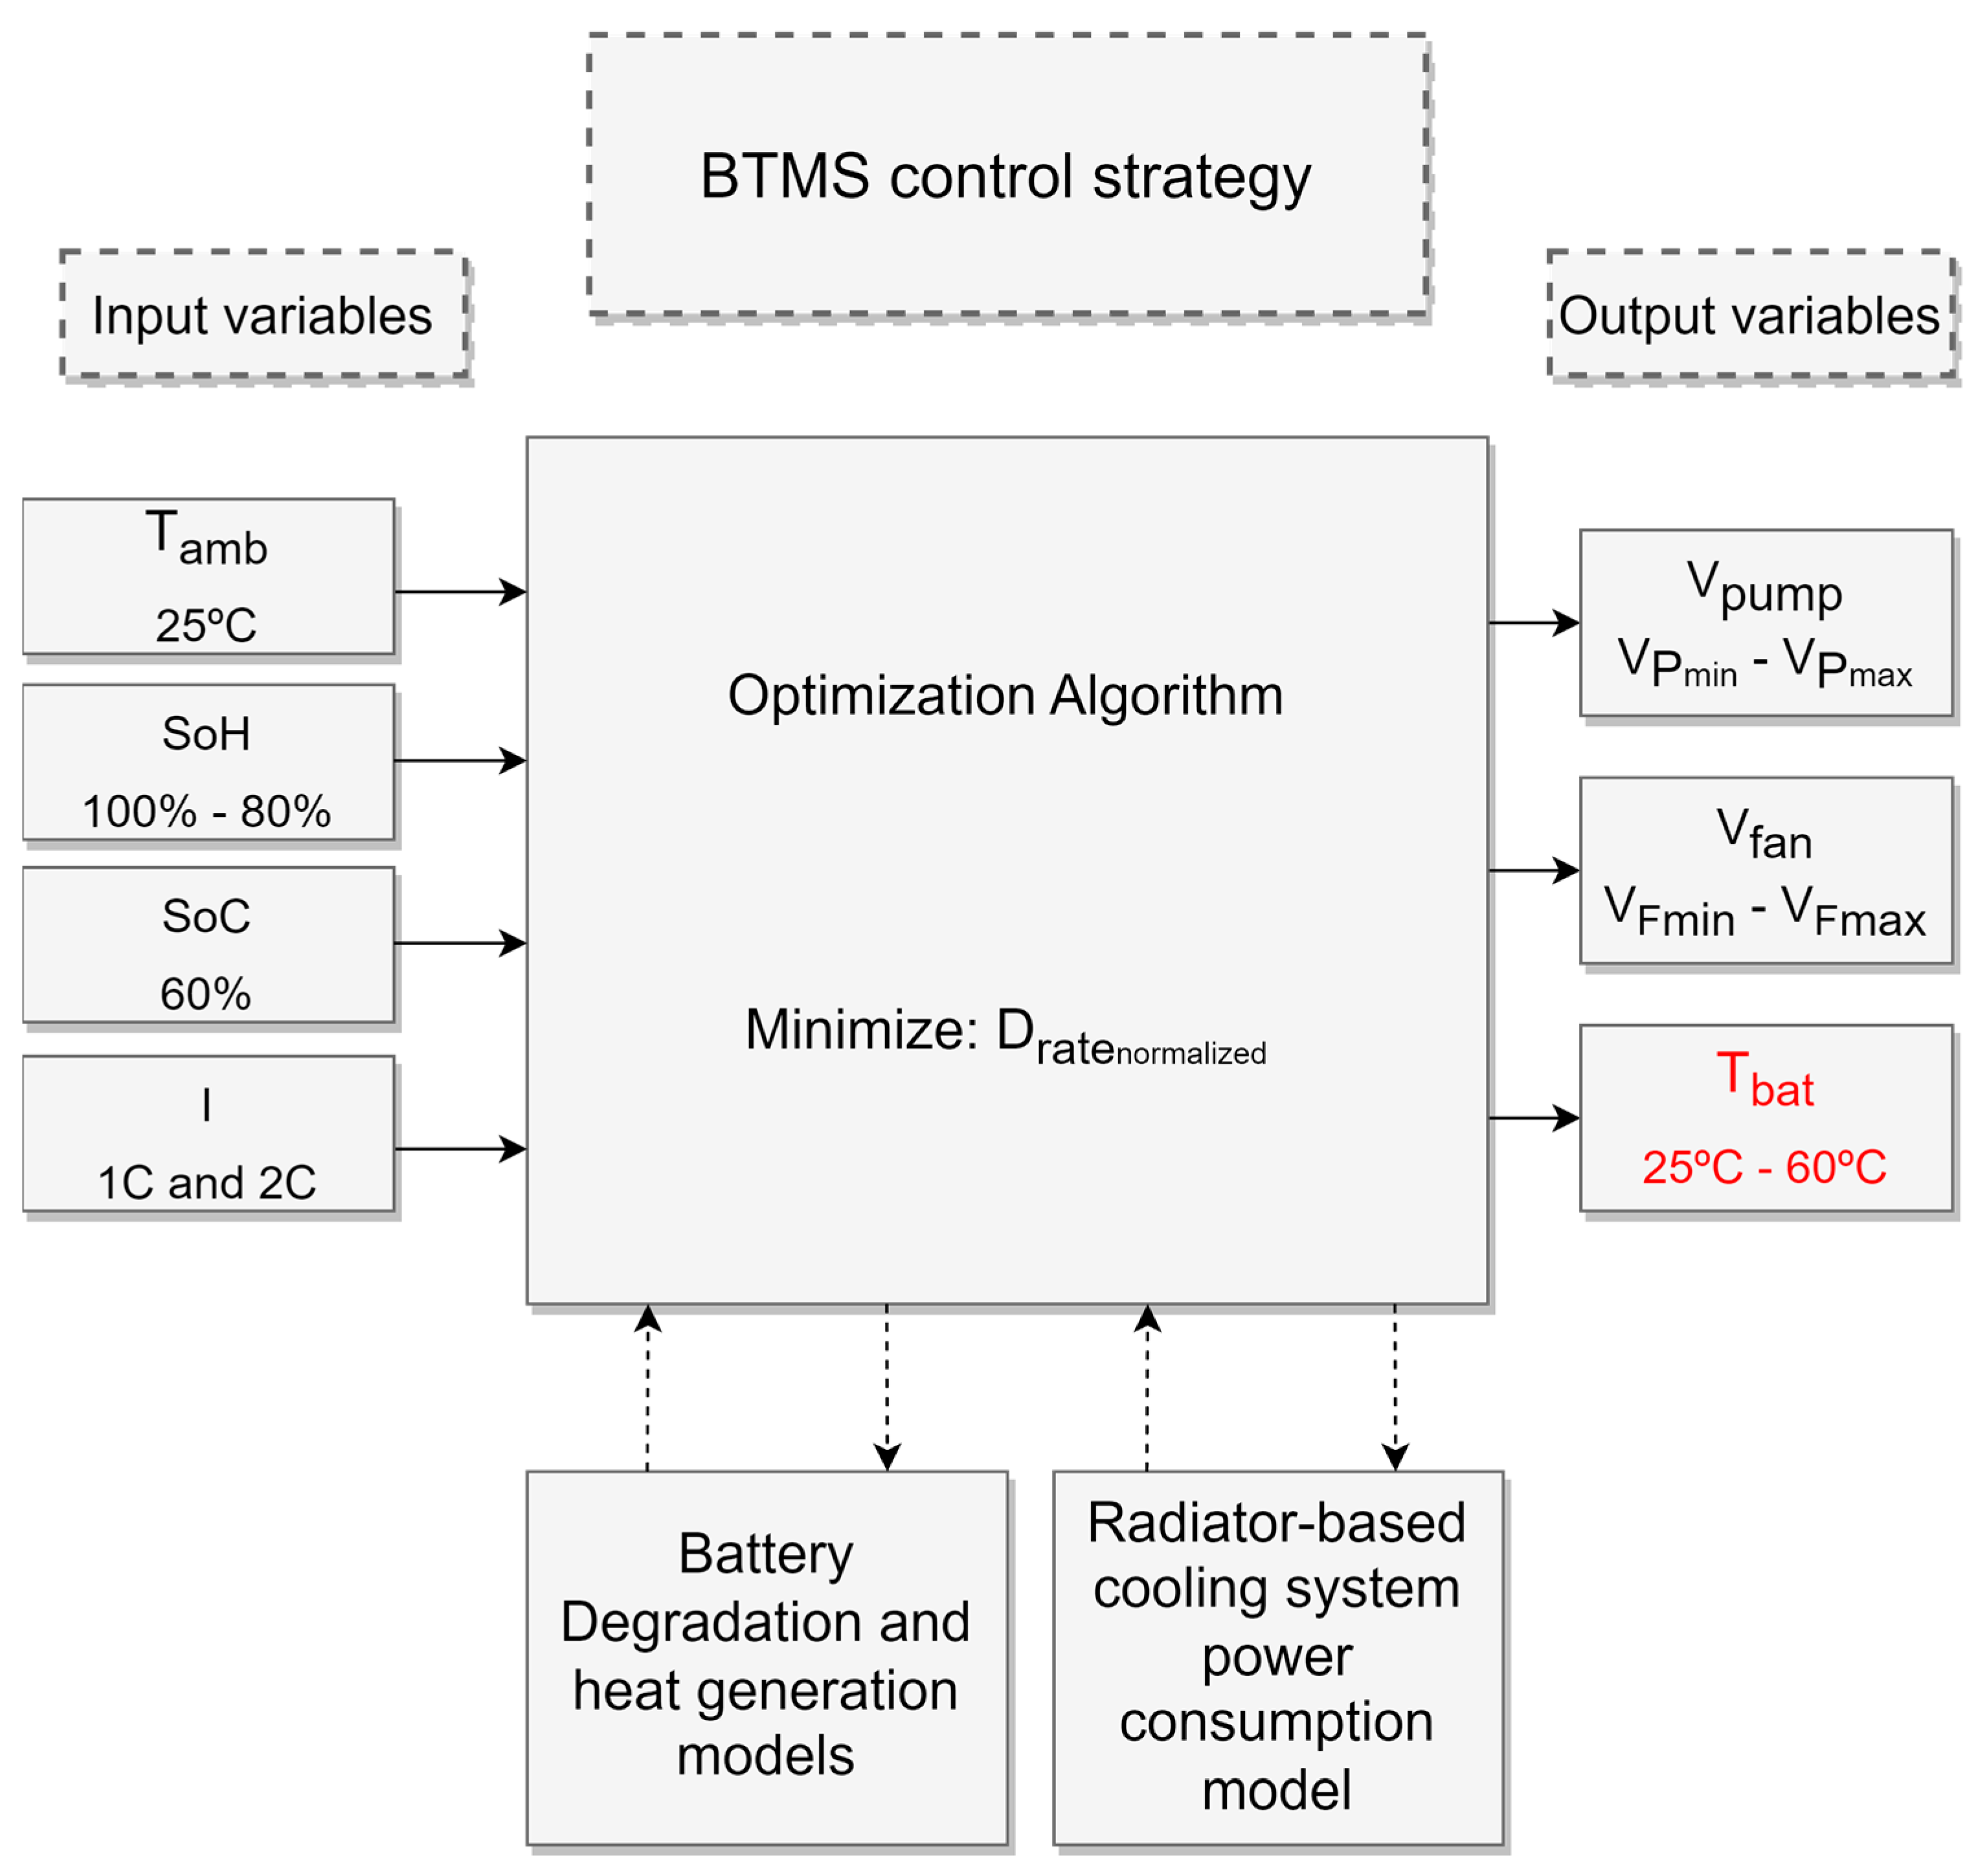
Figure 9 presents the case study problem summarization. The optimization algorithm is defined to minimize the objective function, the normalized degradation rate. Four operation variables are indicated as input variables with values and ranges in accordance with real-life parameters. Between the input variables, in order to establish a mean internal resistance value in a full cycle, the SoC is kept constant at 60%. Three parameters, the battery temperature and the BTMS device’s volumetric flow rates are optimized. The results analysis will focus on the battery temperature due to the direct connection to the negative phenomena described.

Figure 9.
Case study summarization as an optimization algorithm.
4. Results and Discussion
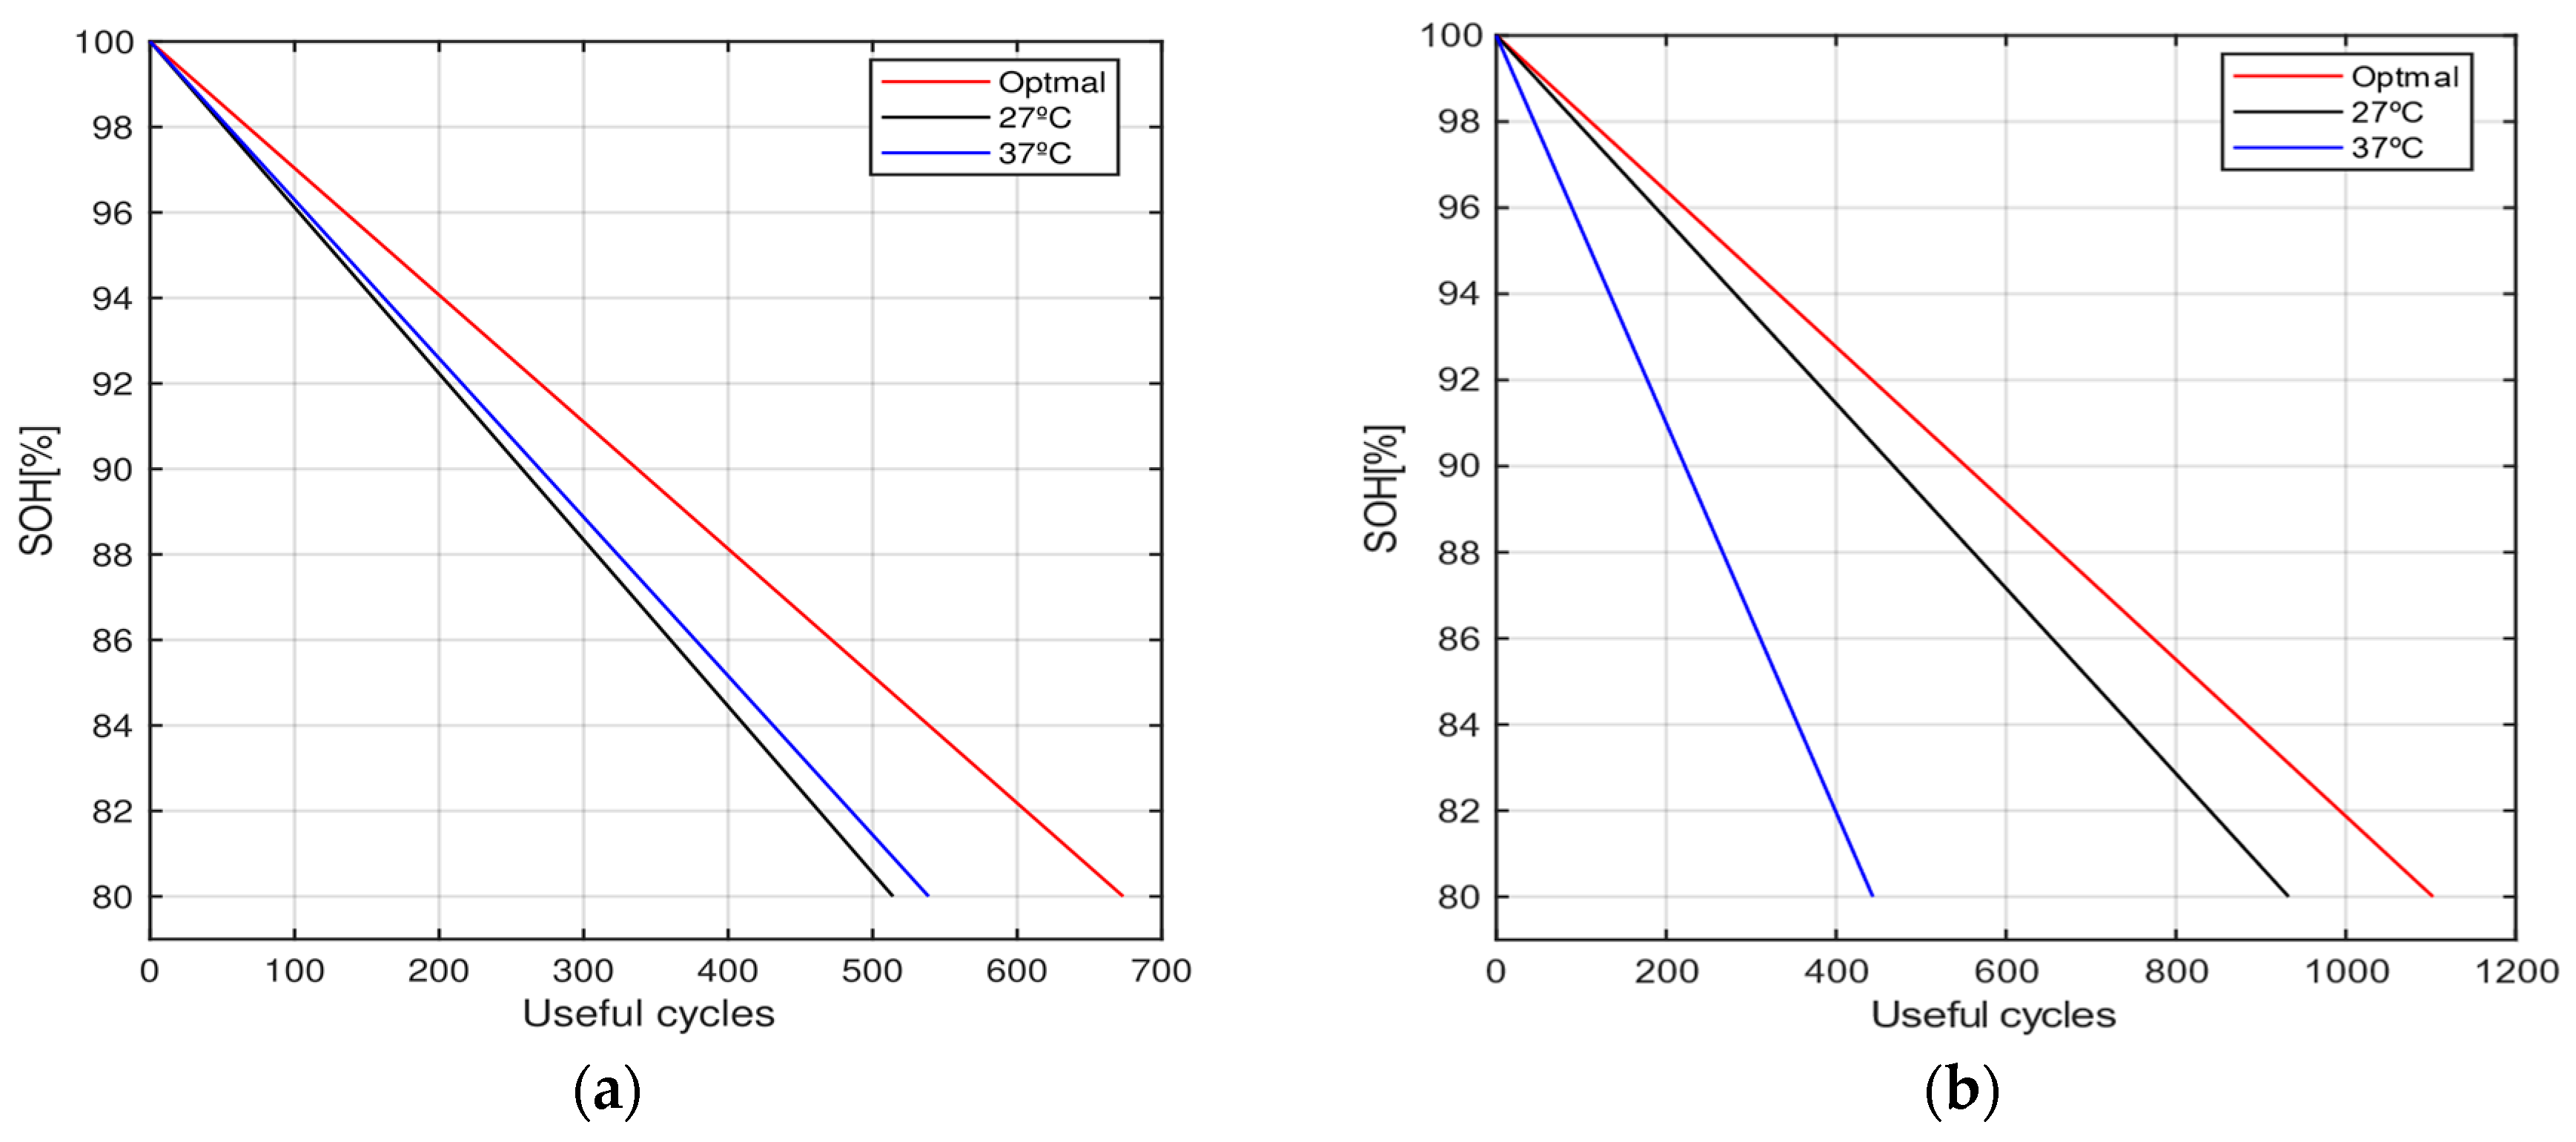
The results present gains for total useful cycles, a concept discussed in Section 2.4, from the beginning to the end of the device life, when the SoH reaches 80% of its capacity. The tests made for NCA and NMC cells consist of a comparison to the optimization with simulation results made for the maintenance of battery temperatures above and below the ideal temperature found by the algorithm. The results obtained for the NMC cell at 1C are presented in Figure 10a. The decay for the optimal approach is lower in relation to when the battery is kept at temperatures of 27 °C and 37 °C; this means that the degradation rate is lower in the optimal curve, which translates into more useful cycles. For the simulated case, the optimization provided an increase of more than 200 useful cycles if compared to the other curves, representing an increase of about 40% of the useful life.

Figure 10.
Simulation results for NMC cell at 1C (a) and 2C (b) discharge.
The result of the test conducted for the same cell under a constant 2C discharge is presented in Figure 10b. If compared with the 1C discharge regime, it is a noticeable and considerable increase of useful cycles in the optimum region, which means that, for the cell in question, the 2C discharge regime offers less cell degradation if compared with the 1C discharge. From the analysis of the curves of all simulated cases, it is observed a displacement of the optimum point closer to the temperature of 27 °C when compared with the results for 1C. In this regime, the operation at the optimum point guaranteed about 200 more cycles in relation to the temperature of 27 °C and more than 600 useful cycles in relation to the temperature of 37 °C.
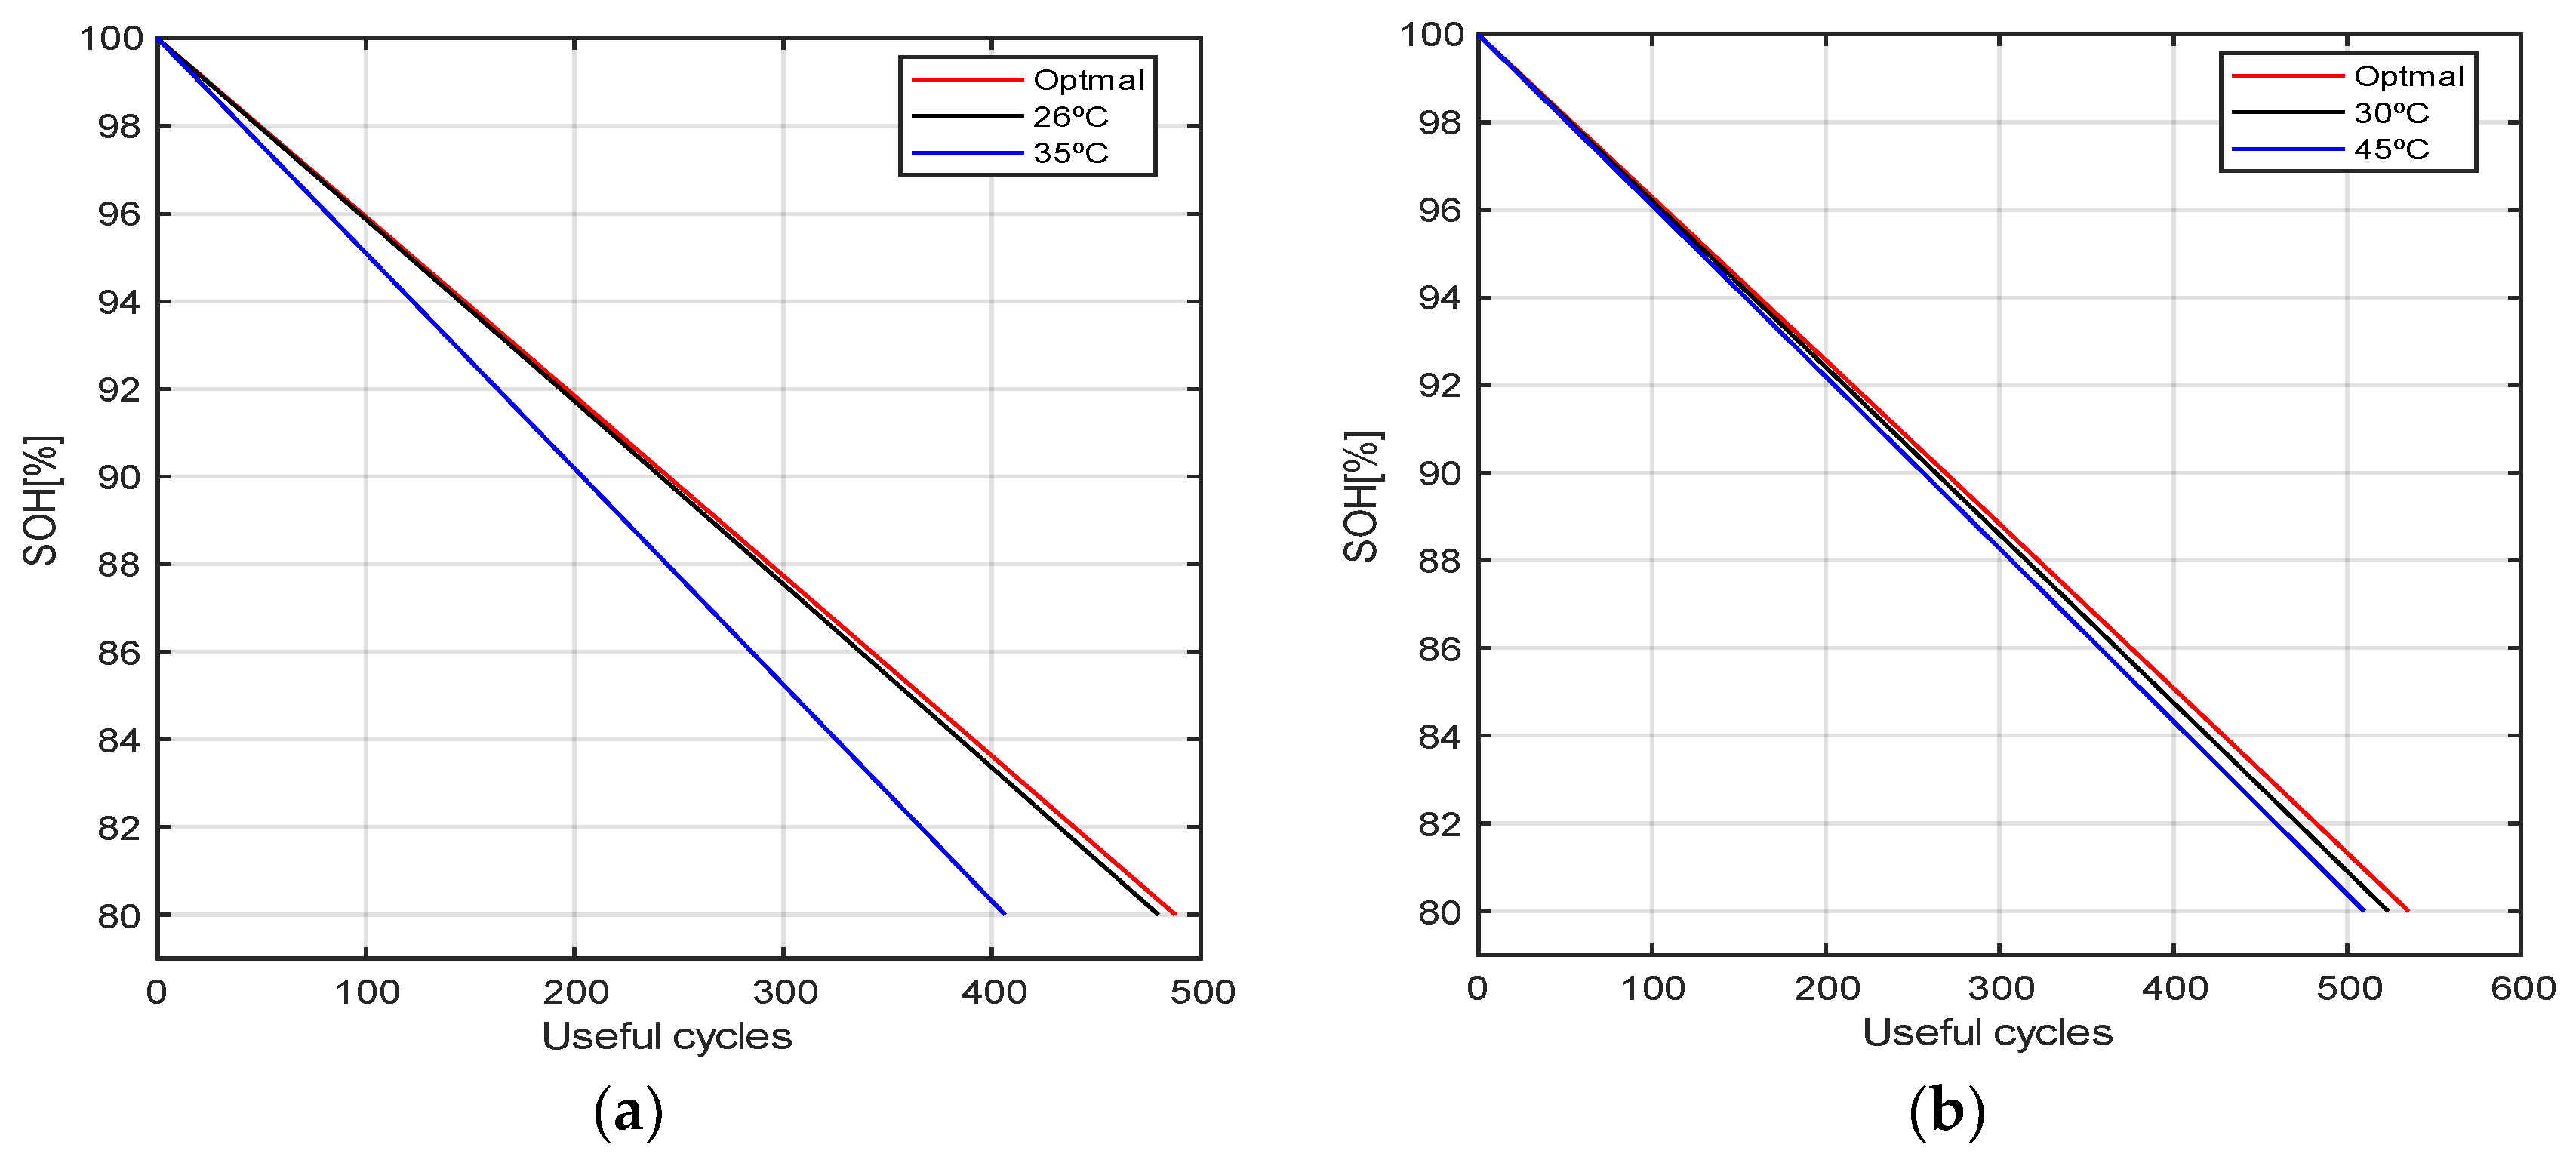
In the same way as with the NMC cell, tests are shown with the NCA cell under constant discharge rates at 1C and 2C. Figure 11a presents the simulation results of the NCA cell under a constant discharge rate at 1C. From the image analysis, it is observed that the optimal operating point of the battery is near the temperature of 26 °C, presenting the optimization of about 10 useful cycles more in this case. In relation to the curve regarding the maintenance of the battery at 35 °C, it is observed a great reduction of total useful cycles, about 75 cycles, when compared with the optimization curve.

Figure 11.
Simulation results for NCA cell at 1C (a) and 2C (b) discharge.
Under 2C discharge, Figure 11b, the cell in question has a less pronounced degradation rate behavior outside the optimal point, allowing more flexibility in the cell operation when compared to the NMC cell at the same discharge rate or the same cell under the 1C discharge rate. In this case, the optimum operation point obtained is about 15 cycles more in relation to the closest curve, which indicates the maintenance of the battery at a temperature of 30 °C, and 30 cycles more than the most distant curve, in which the battery is maintained at 45 °C.
The increase in internal resistance increases; in turn, heat generation and, consequently, the power demanded by the cooling system increases. That generates a natural decrease in the autonomy of the device with aging. Based on the analysis of the problem from the perspective of the equations presented, this autonomy reduction is weighted by the algorithm, which gradually increases the operating temperature in order to reduce the efforts of the cooling system, maintaining the balance between the degradative effects and autonomy reduction. Table 4 shows the optimal temperature increase with the cell’s aging of the NMC cell for 1C and 2C discharges.

Table 4.
Optimal temperature evolution as cell’s aging process.
As seen in Table 4, the evolution of optimal temperature through the cell’s aging process is more noticeable under 2C compared to 1C. That occurs due to the fact that higher discharge rates generate more heat and will demand more BTMS power. This effect will be more prominent with the internal resistance increase due to the aging process. With this analysis, it is possible to assume that the proposed strategy will have less impact on lower current rates.
The results show improvement in the number of total useful cycles under constant discharge and SoC regimes. The constant average values used are not observed in real-time conditions. During operation, the instant internal resistance value will change with the SoC decrease, as the degradation rate with the discharge current variation. The key parameter values will modify the instant strategy’s optimum temperature operation. The instant optimum temperature modification will need to be balanced with the thermal inertia, pondering if it is worth it or not to raise the BTMS power to reach a lower degradation rate state at that moment. The strategy reliability under real-time conditions will be tested experimentally in future works.
5. Conclusions
This paper presents a new method for determining the best discharge operational parameters of a battery. The strategy proposed consists of minimizing the variable deducted in Equation (22) and normalizing the degradation rate. The objective parameter presented is deducted to be suitable for any thermal system as for any operational conditions. It is worth noting that the use of BTMS power consumption, degradation and internal resistance models presented are not mandatory, being the strategy suitable for any equivalent method available in the literature.
All chosen models are based on physical and experimentally validated equations, with the exception of LiB’s degradation rate. For the degradation rate modeling, a known method from the automotive industry to model the BSFC is used, given the similarities in both parameters’ behavior can be observed. As with any empirical model, the method proposed shows a high correlation near the point at which the experimental data is collected to build the model.
Simulations under different discharge rates for two different cell electrode formulations are made to validate the presented method. The algorithm shows better results on every condition tested. Results show a reduction of autonomy with the decrease of SoH. This phenomenon occurs by the internal resistance rises due to the degradation mechanisms.
The effectiveness of the method may vary for different batteries because of the wide variation of parameters intrinsic to each manufacturer and model. In order to establish a degradation model with a wider range of correlation to real data, experimental tests in all conditions observed in real life must be driven.
The simulation results show the strategy’s reliability under fixed discharge regimes, given the modeled cells. Future works will aim to validate the presented strategy under real-time conditions, considering the variation of discharge rate and SoC over the cycle.
Author Contributions
Conceptualization, R.A.P.J.; Data curation, S.A.C.; Formal analysis, R.A.P.J. and T.A.C.M.; Methodology, B.J.C.F., I.A.P. and T.A.C.M.; Project administration, B.J.C.F. and I.A.P.; Supervision, T.A.C.M.; Validation, R.H.; Writing—original draft, R.A.P.J.; Writing—review & editing, S.A.C. and R.H. All authors have read and agreed to the published version of the manuscript.
Funding
This research received no external funding.
Data Availability Statement
The data that support the study’s findings are available from the corresponding author upon reasonable request.
Acknowledgments
This work was supported by Fundação de Desenvolvimento de Pesquisa–Fundep Rota 2030/Linha V 27192.03.01/2020.15-00.
Conflicts of Interest
The authors declare no conflict of interest.
References
- Masias, A.; Marcicki, J.; Paxton, W.A. Opportunities and challenges of lithium ion batteries in Automotive Applications. ACS Energy Lett. 2021, 6, 621–630. [Google Scholar] [CrossRef]
- Pichler, B. Increasing Electric Vehicle Range with a Recommendation App Providing Context Specific Trip Rankings. Ph.D. Thesis, Universität Linz, Linz, Austria, 2016. [Google Scholar]
- Duan, X.; Jiang, W.; Zou, Y.; Lei, W.; Ma, Z. A coupled electrochemical–thermal–mechanical model for spiral-wound Li-ion batteries. J. Mater. Sci. 2018, 53, 10987–11001. [Google Scholar] [CrossRef]
- Grandjean, T.; Groenewald, J.; McGordon, A.; Widanage, W.; Marco, J. Accelerated internal resistance measurements of lithium-ion cells to support future end-of-life strategies for electric vehicles. Batteries 2018, 4, 49. [Google Scholar] [CrossRef]
- Taffal, M. Electro-Thermal Modeling of Lithium-Ion Battery. Ph.D. Thesis, Politecnico di Torino, Turin, Italy, 2019. [Google Scholar]
- Islam, S.M.; Park, S.-Y.; Balasingam, B. Unification of internal resistance estimation methods for Li-ion batteries using hysteresis-free equivalent circuit models. Batteries 2020, 6, 32. [Google Scholar] [CrossRef]
- Yang, N.; Fu, Y.; Yue, H.; Zheng, J.; Zhang, X.; Yang, C.; Wang, J. An improved semi-empirical model for thermal analysis of lithium-ion batteries. Electrochim. Acta 2019, 311, 8–20. [Google Scholar] [CrossRef]
- Wu, X.; Cui, Z.; Chen, E.; Du, J. Capacity degradation minimization oriented optimization for the pulse preheating of lithium-ion batteries under low temperature. J. Energy Storage 2020, 31, 101746. [Google Scholar] [CrossRef]
- Zhang, L.; Mu, Z.; Gao, X. Coupling analysis and performance study of Commercial 18650 lithium-ion batteries under conditions of temperature and Vibration. Energies 2018, 11, 2856. [Google Scholar] [CrossRef]
- Redondo-Iglesias, E.; Venet, P.; Pelissier, S. Modelling lithium-ion battery ageing in Electric Vehicle Applications—Calendar and cycling ageing combination effects. Batteries 2020, 6, 14. [Google Scholar] [CrossRef]
- Uddin, K.; Perera, S.; Widanage, W.; Somerville, L.; Marco, J. Characterising lithium-ion battery degradation through the identification and tracking of electrochemical battery model parameters. Batteries 2016, 2, 13. [Google Scholar] [CrossRef]
- Yang, X.-G.; Wang, C.-Y. Understanding the trilemma of fast charging, energy density and cycle life of lithium-ion batteries. J. Power Sources 2018, 402, 489–498. [Google Scholar] [CrossRef]
- Zeng, Y.; Chalise, D.; Lubner, S.D.; Kaur, S.; Prasher, R.S. A review of thermal physics and management inside lithium-ion batteries for high energy density and fast charging. Energy Storage Mater. 2021, 41, 264–288. [Google Scholar] [CrossRef]
- Uitz, M.; Sternad, M.; Breuer, S.; Täubert, C.; Traußnig, T.; Hennige, V.; Hanzu, I.; Wilkening, M. Aging of Tesla’s 18650 lithium-ion cells: Correlating solid-electrolyte-interphase evolution with fading in capacity and power. J. Electrochem. Soc. 2017, 164, A3503. [Google Scholar] [CrossRef]
- Wu, Y.; Keil, P.; Schuster, S.F.; Jossen, A. Impact of temperature and discharge rate on the aging of a LiCoO2/LiNi0.8Co0.15Al0.05O2 lithium-ion pouch cell. J. Electrochem. Soc. 2017, 164, A1438. [Google Scholar] [CrossRef]
- Maheshwari, A.; Paterakis, N.G.; Santarelli, M.; Gibescu, M. Optimizing the operation of energy storage using a non-linear lithium-ion battery degradation model. Appl. Energy 2020, 261, 114360. [Google Scholar] [CrossRef]
- Fayaz, H.; Afzal, A.; Samee, A.D.; Soudagar, M.E.; Akram, N.; Mujtaba, M.A.; Jilte, R.D.; Islam, M.T.; Ağbulut, Ü.; Saleel, C.A. Optimization of thermal and structural design in lithium-ion batteries to obtain Energy Efficient Battery Thermal Management System (BTMS): A critical review. Arch. Comput. Methods Eng. 2021, 29, 129–194. [Google Scholar] [CrossRef] [PubMed]
- Hoke, A.; Brissette, A.; Smith, K.; Pratt, A.; Maksimovic, D. Accounting for lithium-ion battery degradation in electric vehicle charging optimization. IEEE J. Emerg. Sel. Top. Power Electron. 2014, 2, 691–700. [Google Scholar] [CrossRef]
- Ma, Y.; Mou, H.; Zhao, H. Cooling optimization strategy for lithium-ion batteries based on triple-step nonlinear method. Energy 2020, 201, 117678. [Google Scholar] [CrossRef]
- Hoke, A.; Brissette, A.; Maksimovic, D.; Kelly, D.; Pratt, A.; Boundy, D. Maximizing lithium ion vehicle battery life through optimized partial charging. In Proceedings of the 2013 IEEE PES Innovative Smart Grid Technologies Conference (ISGT), Washington, DC, USA, 4–27 February 2013. [Google Scholar]
- Du, J.; Chen, Z.; Li, F. Multi-objective optimization discharge method for heating lithium-ion battery at low temperatures. IEEE Access 2018, 6, 44036–44049. [Google Scholar] [CrossRef]
- Ruan, H.; Jiang, J.; Sun, B.; Su, X.; He, X.; Zhao, K. An optimal internal-heating strategy for lithium-ion batteries at low temperature considering both heating time and lifetime reduction. Appl. Energy 2019, 256, 113797. [Google Scholar] [CrossRef]
- Casals, L.C.; Rodríguez, M.; Corchero, C.; Carrillo, R.E. Evaluation of the end-of-life of electric vehicle batteries according to the state-of-health. World Electr. Veh. J. 2019, 10, 63. [Google Scholar] [CrossRef]
- Xie, Y.; Wang, C.; Hu, X.; Lin, X.; Zhang, Y.; Li, W. An MPC-based control strategy for electric vehicle battery cooling considering energy saving and battery lifespan. IEEE Trans. Veh. Technol. 2020, 69, 14657–14673. [Google Scholar] [CrossRef]
- Wikner, E.; Thiringer, T. Extending battery lifetime by avoiding high soc. Appl. Sci. 2018, 8, 1825. [Google Scholar] [CrossRef]
- Preger, Y.; Barkholtz, H.M.; Fresquez, A.; Campbell, D.L.; Juba, B.W.; Romàn-Kustas, J.; Ferreira, S.R.; Chalamala, B. Degradation of commercial lithium-ion cells as a function of chemistry and cycling conditions. J. Electrochem. Soc. 2020, 167, 120532. [Google Scholar] [CrossRef]
- Kuntz, P.; Raccurt, O.; Azaïs, P.; Richter, K.; Waldmann, T.; Wohlfahrt-Mehrens, M.; Bardet, M.; Buzlukov, A.; Genies, S. Identification of degradation mechanisms by post-mortem analysis for high power and high energy commercial li-ion cells after electric vehicle aging. Batteries 2021, 7, 48. [Google Scholar] [CrossRef]
- Maheshwari, A.; Heck, M.; Santarelli, M. Cycle aging studies of lithium nickel manganese cobalt oxide-based batteries using electrochemical impedance spectroscopy. Electrochim. Acta 2018, 273, 335–348. [Google Scholar] [CrossRef]
- Golverk, A.A. Mathematical calculation of the performance map of Internal Combustion Engine. SAE Tech. Pap. Ser. 1992. [Google Scholar] [CrossRef]
- Wang, D.; Bao, Y.; Shi, J. Online lithium-ion battery internal resistance measurement application in state-of-charge estimation using the extended Kalman filter. Energies 2017, 10, 1284. [Google Scholar] [CrossRef]
- Jin, X.; Duan, X.; Jiang, W.; Wang, Y.; Zou, Y.; Lei, W.; Sun, L.; Ma, Z. Structural design of a composite board/heat pipe based on the coupled electro-chemical-thermal model in Battery Thermal Management System. Energy 2021, 216, 119234. [Google Scholar] [CrossRef]
- Xie, Y.; Li, W.; Yang, Y.; Feng, F. A novel resistance-based thermal model for lithium-ion batteries. Int. J. Energy Res. 2018, 42, 4481–4498. [Google Scholar] [CrossRef]
- Al-Hallaj, S.; Selman, J.R. Thermal modeling of secondary lithium batteries for electric vehicle/Hybrid Electric Vehicle Applications. J. Power Sources 2002, 110, 341–348. [Google Scholar] [CrossRef]
- Bao, Y.; Dong, W.; Wang, D. Online internal resistance measurement application in lithium ion battery capacity and state of charge estimation. Energies 2018, 11, 1073. [Google Scholar] [CrossRef]
- Wang, Q.; Ping, P.; Zhao, X.; Chu, G.; Sun, J.; Chen, C. Cheminform abstract: Thermal runaway caused fire and explosion of lithium ion battery. ChemInform 2012, 43, 210–224. [Google Scholar] [CrossRef]
- Wark, K. Advanced Thermodynamics for Engineers; McGraw-Hill: New York, NY, USA, 1995. [Google Scholar]
- Bergman, T.L.; Incropera, F.P. Fundamentals of Heat and Mass Transfer 7E: Heat Transfer; Wiley Custom Learning Solutions: Hoboken, NJ, USA, 2011. [Google Scholar]
- Noie, S.H. Investigation of thermal performance of an air-to-air thermosyphon heat exchanger using ε-NTU method. Appl. Therm. Eng. 2006, 26, 559–567. [Google Scholar] [CrossRef]
- Ng, E.Y.; Johnson, P.W.; Watkins, S. An analytical study on heat transfer performance of radiators with non-uniform Airflow Distribution. Proc. Inst. Mech. Eng. Part D J. Automob. Eng. 2005, 219, 1451–1467. [Google Scholar] [CrossRef]
- Dong, J.; Chen, J.; Chen, Z.; Zhang, W.; Zhou, Y. Heat transfer and pressure drop correlations for the multi-louvered fin compact heat exchangers. Energy Convers. Manag. 2007, 48, 1506–1515. [Google Scholar] [CrossRef]
- Badgujar Pankaj, R.; Rangarajan, S.; Nagaraja, S.R. Analytical performance analysis of cross flow louvered fin automobile radiator. MATEC Web Conf. 2018, 172, 02003. [Google Scholar] [CrossRef]
- Seo, M.; Song, Y.; Kim, J.; Paek, S.W.; Kim, G.-H.; Kim, S.W. Innovative lumped-battery model for state of charge estimation of lithium-ion batteries under various ambient temperatures. Energy 2021, 226, 120301. [Google Scholar] [CrossRef]
- Friesen, A.; Mönnighoff, X.; Börner, M.; Haetge, J.; Schappacher, F.M.; Winter, M. Influence of temperature on the aging behavior of 18650-type lithium ion cells: A comprehensive approach combining electrochemical characterization and post-mortem analysis. J. Power Sources 2017, 342, 88–97. [Google Scholar] [CrossRef]
- Atalay, S.; Sheikh, M.; Mariani, A.; Merla, Y.; Bower, E.; Widanage, W.D. Theory of battery ageing in a lithium-ion battery: Capacity fade, nonlinear ageing and lifetime prediction. J. Power Sources 2020, 478, 229026. [Google Scholar] [CrossRef]
- Liu, C.; Qian, K.; Lei, D.; Li, B.; Kang, F.; He, Y.-B. Deterioration mechanism of LiNi0.8Co0.15Al0.05O2/Graphite–SiOx power batteries under high temperature and discharge cycling conditions. J. Mater. Chem. A 2018, 6, 65–72. [Google Scholar] [CrossRef]
- Zhang, Y.Z.; Xiong, R.; He, H.W.; Qu, X.; Pecht, M. Aging characteristics-based health diagnosis and remaining useful life prognostics for lithium-ion batteries. eTransportation 2019, 1, 100004. [Google Scholar] [CrossRef]
- Waldmann, T.; Wilka, M.; Kasper, M.; Fleischhammer, M.; Wohlfahrt-Mehrens, M. Temperature dependent ageing mechanisms in lithium-ion batteries—A post-mortem study. J. Power Sources 2014, 262, 129–135. [Google Scholar] [CrossRef]
- Engineering ToolBox Ethylene Glycol Heat-Transfer Fluid Properties. Available online: https://www.engineeringtoolbox.com/ethylene-glycol-d_146.html (accessed on 20 October 2021).
Disclaimer/Publisher’s Note: The statements, opinions and data contained in all publications are solely those of the individual author(s) and contributor(s) and not of MDPI and/or the editor(s). MDPI and/or the editor(s) disclaim responsibility for any injury to people or property resulting from any ideas, methods, instructions or products referred to in the content. |
© 2022 by the authors. Licensee MDPI, Basel, Switzerland. This article is an open access article distributed under the terms and conditions of the Creative Commons Attribution (CC BY) license (https://creativecommons.org/licenses/by/4.0/).