Article

Electrochemical Change Induced by Spherical Indentation in Lithium-Ion Batteries

Institute of Applied Mechanics, National Taiwan University, Taipei 10617, Taiwan
*
Author to whom correspondence should be addressed.
Batteries 2022, 8(12), 268; https://doi.org/10.3390/batteries8120268
Submission received: 4 November 2022 / Revised: 26 November 2022 / Accepted: 29 November 2022 / Published: 2 December 2022
(This article belongs to the Topic Safety of Lithium-Ion Batteries)

Abstract

:
Since the Young’s modulus of the separator is weaker than that of the other materials inside a lithium-ion battery, local deformation may cause blockage or rupture of the separator, resulting in internal short-circuit or other disasters. This study collects the stress–strain relationship of various materials within the battery, and combines the mechanical model with the electrochemical model through the coupled relationship between the volumetric strain and the volume fractions of solid and liquid phases. From a two-dimensional electrochemical simulation of a spherical indentation on a layer-structured battery, it is found that there is local negative value of the side reaction overpotential on the negative electrode adjacent to the separator after the battery is deformed. A higher strain will cause a decrease in the negative overpotential, leading to a more serious deposition of lithium during the charge process. The deformation-dependent overpotential is evaluated and the lithium deposition is then quantified. Moreover, the issue of the separator thickness is explored. We find that under an indentation, the thickness does not affect the charging voltage, while a thinner layer will reduce the separator porosity and thus lower the overpotential and increase the chance of lithium deposition.

1. Introduction

Lithium-ion batteries (LIBs) became one of the most reliant energy sources due to their advantages of high energy density and long cycle times. As LIBs quickly penetrated into our daily life, their safety became a major concern for consumers [1,2,3,4].
In post-mortem analysis of the spontaneous combustion of mobile phones, was found that the main cause of the incidents is the internal short circuit (ISC) [5], which can result from deformation of the batteries [6]. Two major factors were noted to account for the deformation: (i) the rupture of the separator under compression [7], and (ii) the penetration of lithium dendrites through the separator [8,9,10].
The compression of the separator further leads to deposition of lithium metal at the interface between the negative electrode and the separator [11] and batteries generally suffer from uneven stress caused by the early winding process [12]. When a LIB is charged at a high current or at a low temperature, in particular, a high amount of lithium metal will be accumulated on the negative electrode [13,14,15]. In addition to deposition, lithium metal could also gradually oxidize into lithium ions during the discharging process, called Li stripping [16].
A basic indicator of the lithium deposition is the overpotential between the electrode and the electrolyte [17], and it can be obtained in the electrochemical model by solving concentration diffusion, electric field, and reaction kinetics. The relevant reaction kinetics of the lithium metal deposition reported in previous studies are summarized in Table 1.
Studies also show that ISC can be induced by the damage of the materials inside the batteries through external force, which gives rise to a new trend in the mechanics of the battery, focusing on the decrease in the electric resistance between the positive and negative electrodes in pressurized batteries [6], the relationship between the battery force and deformation in pouch batteries [20,21], the relationship between the mechanical properties of the separator and the strain rate [22], or the mechanical behavior of graphite anode via the discrete element method [21,23].
The progressive failure of LIBs under external force was also examined by the spherical indentation test [24,25]. Using this test, Zhou et al. analyzed the short-circuit behavior of lithium-ion pouch cells from experiments [26], and Li et al. perform a simulation of the coupling of four sub-models, i.e., the 2D mechanical model, the 2D short-circuit model, the 2D thermal model, and the 1D battery model, to predict the short-circuit process under mechanical indentation [27,28]. Since these battery models are constrained to one dimension, there remains a lack of research about the evolution of the local electrochemical quantities in the direction parallel to the battery layers.
In the present study, we establish a coupled model related to mechanics and electrochemistry to understand the electrochemical response of a deformable LIB under a spherical indentation before a short circuit occurs. Based on this model, we explore the possible lithium deposition caused by different degrees of deformation, and quantify the maximum deformation that the battery can withstand. The current paper is organized as follows. We first introduce the mechanical and electrochemical models, which are used to analyze the two-dimensional electro-chemical change induced by non-uniform deformation. Next, an electrochemical simulation is carried out to thoroughly discuss the time evolution of various field variables within the battery, such as volume fractions of solid and liquid phases, overpotential, current density, and state of charge when the battery is subjected to a spherical indentation. Finally, the conclusions of this study are presented.

2. Methodology

This study uses a Python package to carry out the analysis of the mechanical model, while the electrochemical behavior of the LIB is delineated by the Doyle–Fuller–Newman (DFN) electrochemical model [29,30,31], which is also called the pseudo 2-dimensional (P2D) model. Through the strain–porosity relation, the two models can be coupled so that the deformation-induced local lithium deposition within the battery can be explicated.

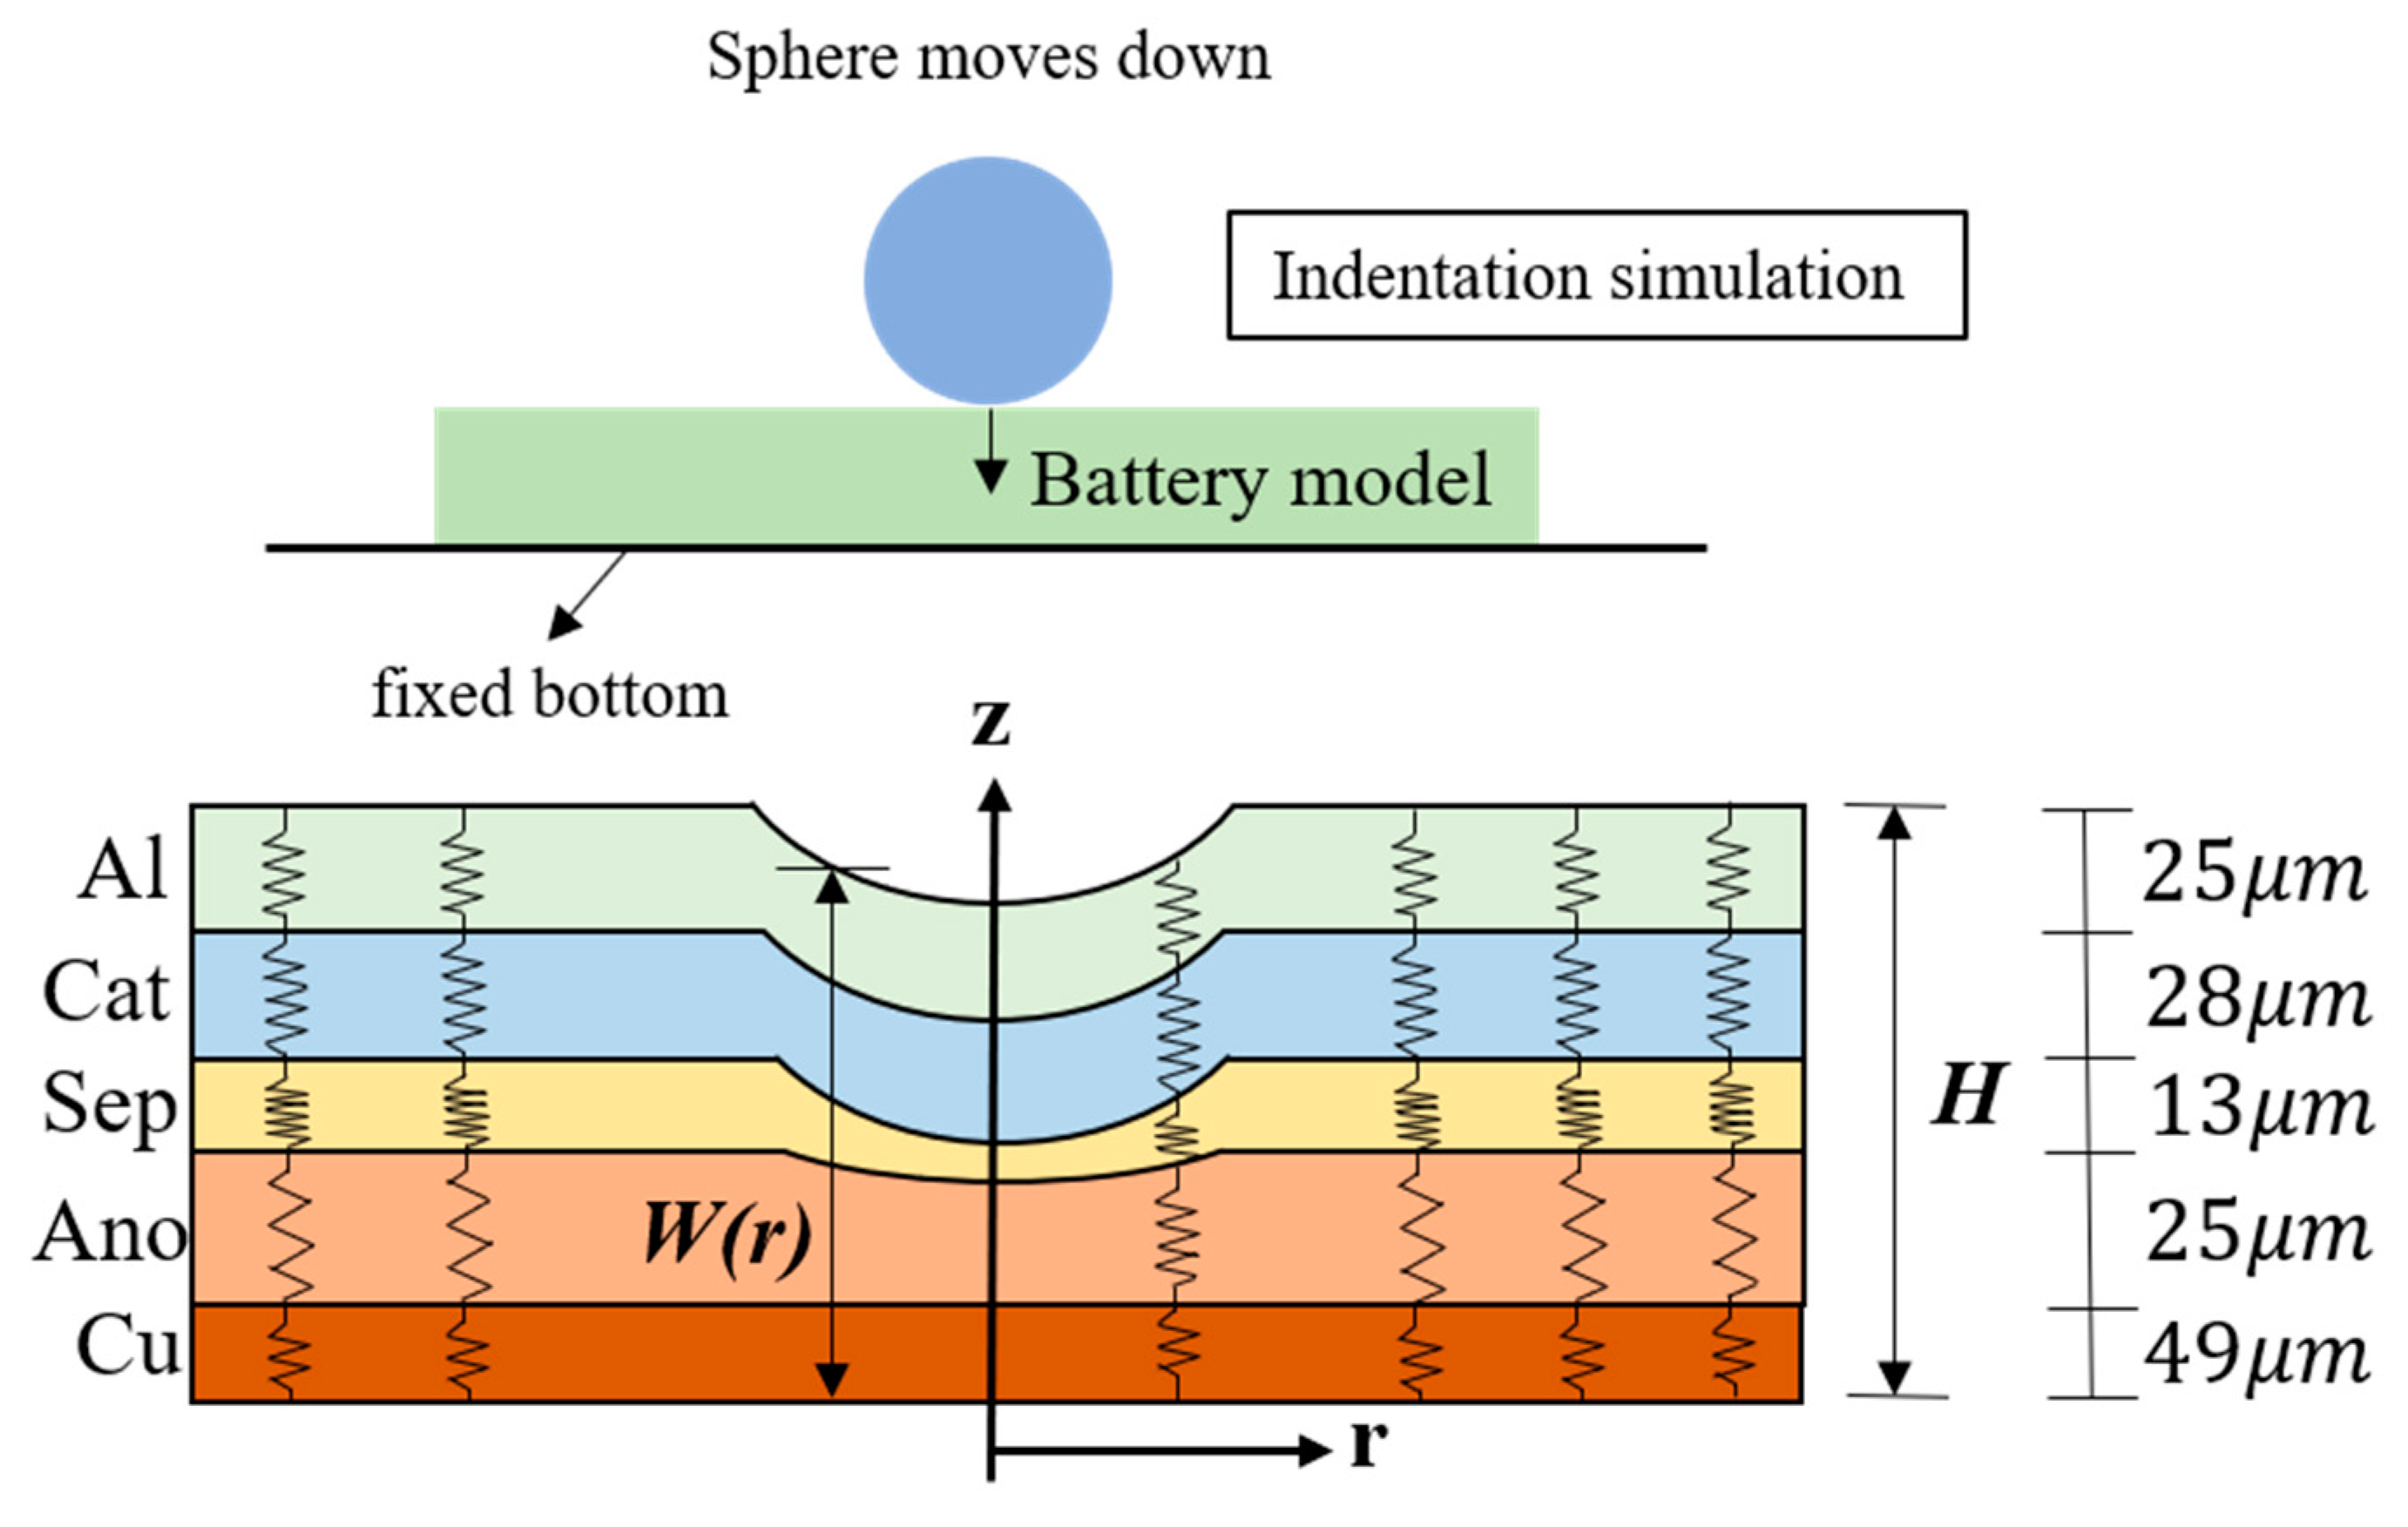
2.1. Mechanical Analysis

We assume that the battery is stacked with different materials along the z-direction in the order of copper (Cu) current collector, anode active material (Ano), separator (Sep), cathode (Cat) active material, and aluminum current collector (Al). Since it was reported that the Poisson ratio of a LIB is close to 0 [21], the battery can be greatly simplified by a one-dimensional mechanical model.
As shown in Figure 1, the materials in the spherical indentation problem are subjected to the stress of σzz, and thus the stress field is only related to the r-direction. The total deformation in the z-direction is evaluated by the superposition of the deformation of each layer, which is written as
W ( r ) H = i Δ h i
where H and W represent the thickness of the battery before and after deformation. Δhi is the deformation of each layer, and it can be expressed by
Δ h i = h i ε i
in which hi and εi indicate the thickness and the strain of each layer whose index i (from 1 to 5) refers to the layer associated with the positive current collector, positive active material, separator, negative active material, and negative current collector, respectively.
Along with the observation that the Poisson ratio is close to zero when a LIB is subjected to compression, a small deformation of the battery (see Figure 1) allows us to assume that the strain εi only takes the z-direction and it is the same as the volumetric strain εV,i [20]. Under the quasi-static condition, the stress–strain relationship takes the form
ε z z , i = ε V , i = g l a y e r , i σ z z , i
where σzz,i is the stress tensor and glayer,i(σzz,i) is the strain function of the layer i. The strain function for the material associated with each layer, displayed in Figure 2, can be determined from the uniform compression experiment [21,23]. It can be seen from Figure 2a that when subjected to the same stress (up to 80 MPa), the copper and the aluminum are basically not deformed. However, the deformation of the negative electrode is the largest when the stress is small (below 15 MPa). With the increase in stress, the deformation of the separator rises sharply and it becomes the largest among the five materials.
On account of the force balance, the stress of each layer must be the same, which means σzz,i(r) = σzz,j(r). Since each layer produces different strains under the same stress, the overall strain performance of the battery is the summation of the deformation of each layer under the same stress. Accordingly, with the help of the layer thickness information in Figure 1, we obtain the stress–strain relation of the whole battery, shown in Figure 2b.
To explore the deformation of the battery under non-uniform compression, we formulate the stress in Figure 2b in terms of the total strain as
σ z z , b a t t e r y = f b a t t e r y ε z z , b a t t e r y
where the total strain can be expressed as
ε z z , b a t t e r y = W r H H .
Here, W(r) is specified by the geometric shape. Taking the sphere of a radius R pressed into the battery with the distance D as an example, we could have
W r = H + R D R 2 r 2 , r < 2 R D D 2 H ,   r 2 R D D 2 .
Substitution of Equations (5) and (6) into Equation (4) enables us to evaluate the stress field σzz (r). Figure 2c displays the stress σzz (r) in the case of R = 10 mm and D = 0.46 mm; the figure exhibits that the stress decreases to zero when r is around 2.9 mm. Having the stress distribution, Equation (3) helps to acquire the strain of each layer, shown in Figure 2d. It can be seen that, around the force center (r = 0), the separator layer is most strained, followed by the anode layer. However, within the range of 2.3 < r < 3.0, the simulation indicates that the anode owns a higher strain than the separator.
Regarding the deformation of each layer, the position yi,n for the i-type material of the nth layer (n indicates the number of a unit of layers) is given as
y i , n = i , n h i , n ε z z , i + y i , n 1
where the bottom position of anode at the unit n = 1 is set to be zero. The deformation shape of the battery with 20 layered units is exemplified in Figure 2e, which shows that the uppermost area has a large curvature. Theoretically, this area shares a shear strain, which, however, is not considered in the current study for the sake of modeling simplicity. To have a closer look, the first layered unit is enlarged and shown in Figure 2f. As can be seen, this unit contains two layers of each of the five materials, and it is observed that the deformation of the separator is larger than that of the other materials. This is in line with the results indicated in Figure 2d.
In the above discussion, we reviewed the mechanical model used to investigate the stress–strain relation of layer-structured batteries. In our study, the model will be coupled with an electrochemical method to examine the internal reactions of batteries when they are deformed. The procedure is as follows: As soon as the values of R and D are specified, we can have the total battery strain, shown in Equation (5), and then in turn the total stress can be obtained from Equation (4). Given that the stress of each layer is equal to the total stress, the constitutive relation in Equation (3) further enables us to determine the strain of each layer. Specifically, the coupling of the strain of each layer to the volume fraction will be performed.

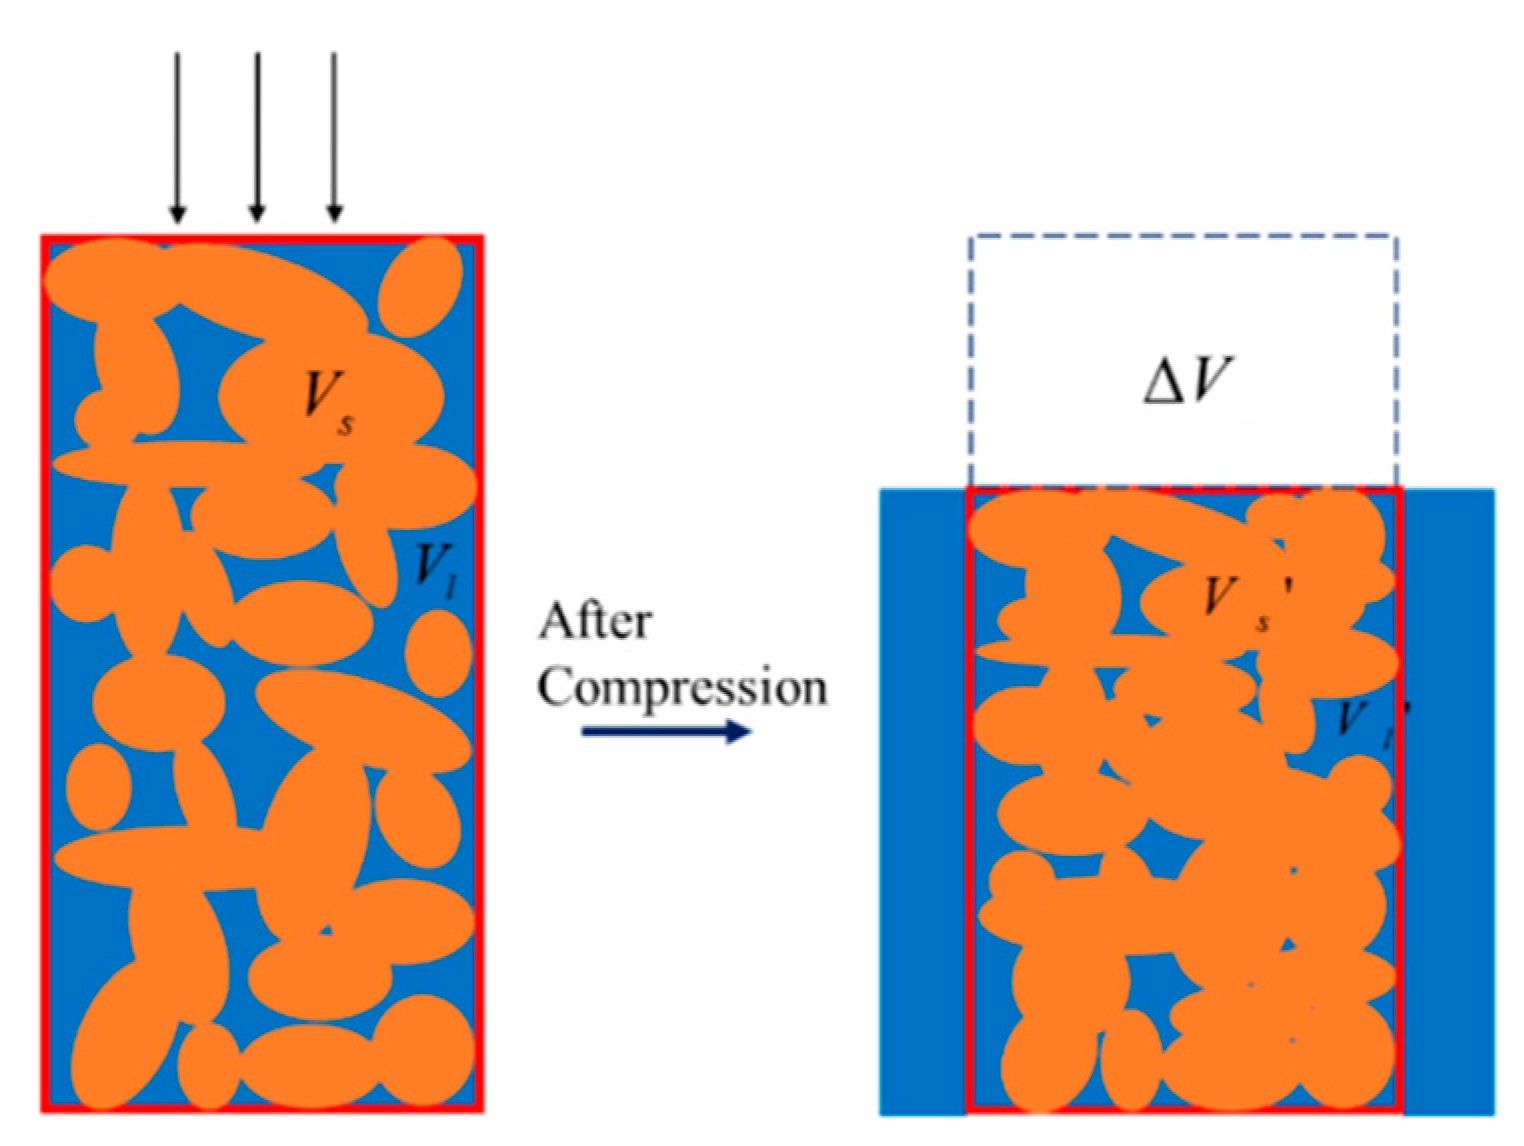
2.2. Strain-Induced Change in Porosity

In order to characterize the effect of deformation on the battery, we convert the strain field into the volume fraction (or porosity) field, which is one of the main field variables in the electromechanical modeling. Since the inside of a LIB is a porous material (denoting anode, separator, and cathode here) and can be treated as a mixture of a solid phase and a liquid phase, when the mixture is compressed, the fluid would flow freely relative to the solid phase.
As shown in Figure 3, the orange area signifies the solid portion of the porous material, while Vs refers to the volume of the solid phase. The blue part symbolizes the fluid portion of the porous material, whose volume is represented by Vl. The control volume, featured by the red box, can be defined as the volume spanned by the solid skeleton. When the mixture is compressed, denoted by the three arrows, the fluid flows out of the control volume, and the fluid inside the control volume decreases. Inspection of Figure 3 reveals the geometrical relations before and after the compression:
V = V s + V l , V s = e s V , V l = e l V , V = V s + V l , V s = e s V , V l = e l V ,
where es and el indicate the volume fractions of solid and fluid, and the quantities with prime above denote those quantities after the deformation. Given that there is a volume change ΔV in the control volume, we could have V’ = V + ΔV = V(1 + εV). Furthermore, we assume that the volume change is caused by the fluid flowing out of the control volume, which implies V’s = Vs and V’l = Vl + ΔV. Hence, from Equation (8), the volume fractions of the two phases after deformation can be obtained as
e s ' = e s 1 + ε V , e l ' = e l + ε V 1 + ε V
based on which the mechanical and electrochemical models are coupled.
Considering the battery structure in Figure 2e, the layer thickness in Figure 1, and the case of R = 10 mm and D = 0.46 mm, we obtain the distribution of the volume fractions for the solid active material in Figure 4a and those for the electrolyte in Figure 4b. As shown in Figure 2a, when the battery is compressed by a stress of more than 20 MPa, the separator will deform greatly, resulting in a rapid decrease in the volume fraction of electrolyte within the separator. This accounts for the large es and the small el in the vicinity of r = 0 in Figure 4a,b. An additional simulation is carried out by increasing the thickness of the separator from 13 to 23 μm, while the thickness of the other materials remains unchanged. We find in Figure 4c that this increase results in a rise of the volume fraction of electrolyte in the vicinity of r = 0, which indicates that a great reduction in the thickness of the separator would significantly affect the mechanical properties of the battery.

2.3. Electrochemical Simulation

The DFN model, developed by Newman’s group, is the most widely used electrochemical model [29,30,31]. It usually treats the temperature as a constant parameter and simplifies the jelly roll of the cell to a one-dimensional geometry that is composed of five segments, which correspond to the thickness of the two current collectors, of two electrodes, and of a separator. This model is dominated by several partial differential equations, characterizing the interfacial reaction kinetics at the electrode surfaces, the charge conservation in the solid and in the liquid phases, the solid phase diffusion in the electrodes, and the mass transfer process in the electrolyte phase. These equations are listed in Table 2.
In the current study, the axis-symmetrical deformation of the layer-structural battery is explored. Thus, we extend the accustomed one-dimensional electrochemical analysis to a two-dimensional simulation, in which the z- and r-dependent field variables are considered.
In view of Equation (9), the mechanical–electrochemical coupling can be introduced into the set of the governing equations through the volume fraction-dependent diffusion coefficient and conductivity [11], that is
D l = D l , b u l k e l γ , D s = D s , b u l k e s γ , κ l = κ l , b u l k e l γ , κ s = κ s , b u l k e s γ ,
where γ stands for the Bruggeman exponent, whose value is given in Table 3. This exponent is used to take the tortuosity factors of porous media into account.
The interfacial reaction kinetics in Table 2 is the Butler–Volmer equation, where the charge transfer coefficients αa,1 and αc,1 are both set to be 0.5 in this study. This equation expresses the reaction flux j1, which comes from the difference between reduction and oxidation reaction rates of lithium at the electrode–electrolyte interface. In addition to the flux flowing into or out of the two electrodes, certain side reactions, such as lithium plating, may occur in the negative electrode. When this reduction reaction of lithium ions takes place, they may return to lithium metal in the electrolyte, and the reduction flux j2 can be written as
j 2 = i 0 , 2 exp F α a , 2 η 2 R g T exp F α c , 2 η 2 R g T
where the lithium plating exchange current density i0,2 is set to be a constant of 0.001 A/m2 [9]. In this study, the two parameters αa,2 and αc,2 are given as 0.33 and 0.67, respectively [19], and αa,2 < αc,2 indicates that the reducing power of lithium ions is stronger than the oxidizing power of lithium. Since lithium ions are directly reduced to lithium metal, there is no interface impedance and the reference potential (Li vs. Li+/Li) is zero. Hence, the SR overpotential η2 for this side reaction (SR) process can take the form:
η 2 z , r , t = ϕ s z , r , t ϕ l z , r , t
According to Equation (12), when η2 < 0, there is a reduction tendency for the lithium ions so that the lithium plating on the surface of negative electrode particles is more liable to occur.

3. Results

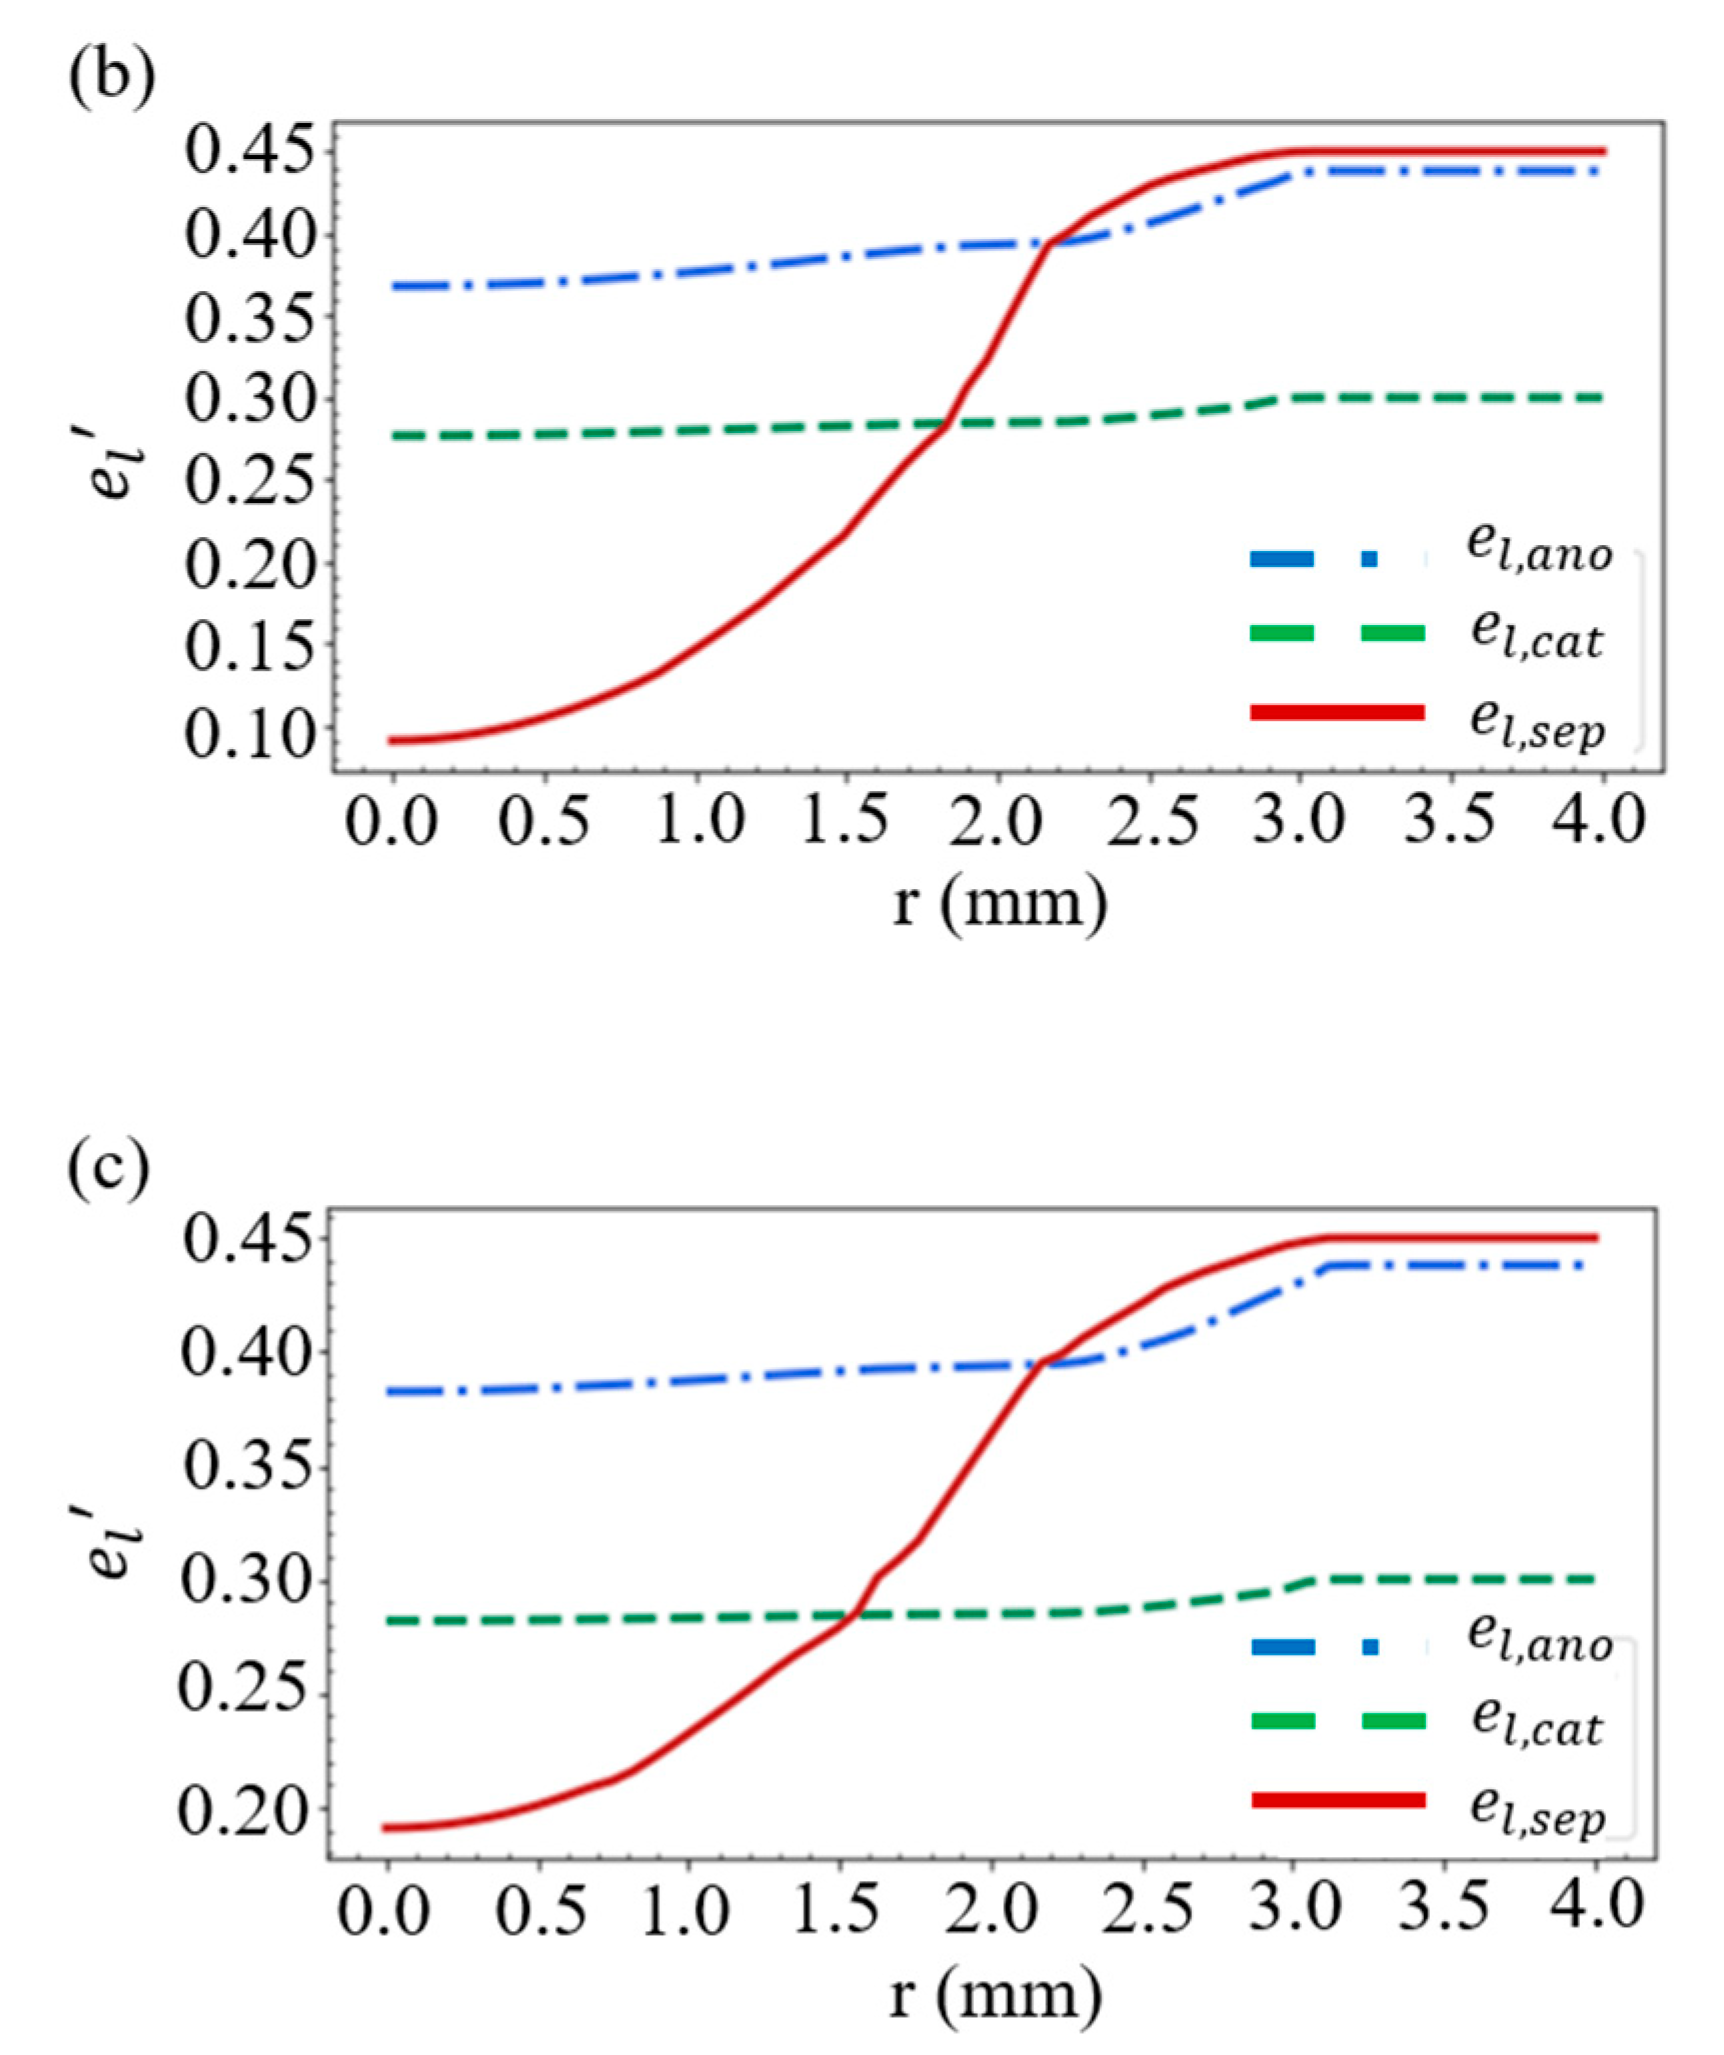
3.1. Battery Strain of 8%

A higher strain case is first studied to highlight the effect of deformation on the deposition amount of lithium metal. We consider a rigid sphere of radius R = 6 mm, and it presses the battery into an indentation depth of D = 0.368 mm, giving rise to 8% compression with respect to the thickness of the battery (or a strain value of 8% along r = 0). It is found in Figure 5a that the volume fraction of the electrolyte in the separator greatly decreases around r = 0, which indicates that the separator suffered from a large deformation. When r > 2 mm, the deformation effect significantly diminished, and thus all of the volume fractions of the electrolyte in the three materials approach their original values (see Table 3).
Now the deformed battery is charged with a constant current of 1C and then discharged at 1C, it is expected that lithium will be deposited at the junction of the separator, and the negative electrode in the charge/discharge process, and the deposition amount, can be evaluated in terms of the molar number per unit volume as:
n d e p = 0 t j 2 a s F d t
Figure 5b exhibits the lithium metal production field at the ending point of charging, i.e., t = 3600 s. We observe that more lithium deposition occurs at the center of the indentation and that there is a large gradient of the production field along the vertical direction.
Figure 5c shows the electrolyte potential ϕl at t = 3600 s, and the colors refer to the potential magnitude of the electrolyte. It can be found that the highest potential appears at the top of the positive electrode (where it is in contact with the current collector) around the center of the indentation, while the lowest potential appears at the current collector of the negative electrode. On the other hand, the solid electrode potential field ϕs at t = 3600 s is exhibited in Figure 5d. Since the solid electrode has good electrical conductivity, the potential of the positive electrode is kept at about 4.2 V, while the negative electrode is kept at a potential close to 0 V.
During the charging process, lithium ions will move from the positive to the negative electrode. The deformation due to the indentation results in a nonuniform distribution of the concentration of lithium ions, which is z- and r-dependent. This concentration can be readily expressed in terms of the local state of charge (SOC) on the surface of solid electrode particles, defined as
S O C c s = C s , s u r f C s , min C s , max C s , min
where Cs,surf, Cs,max, and Cs,min are the local solid-phase surface, the maximum, and the minimum concentrations of lithium in the solid electrodes, respectively. The time evolution of the distribution of the SOCcs field is simulated and displayed in Figure 6. It is observed that before charging, the SOCcs in the positive electrode is close to 0.95 while nearly 0.1 in the negative electrode. In the middle stage of charging (t = 1800 s, see Figure 6b), the SOCcs rises quickly in the negative electrode near the separator under the compression. At the end of charging (t = 3600 s, see Figure 6c), there is a large gradient of the SOCcs around the compression area of the negative electrode, and this area, which is near the current collector and under the indentation, is difficult to charge.

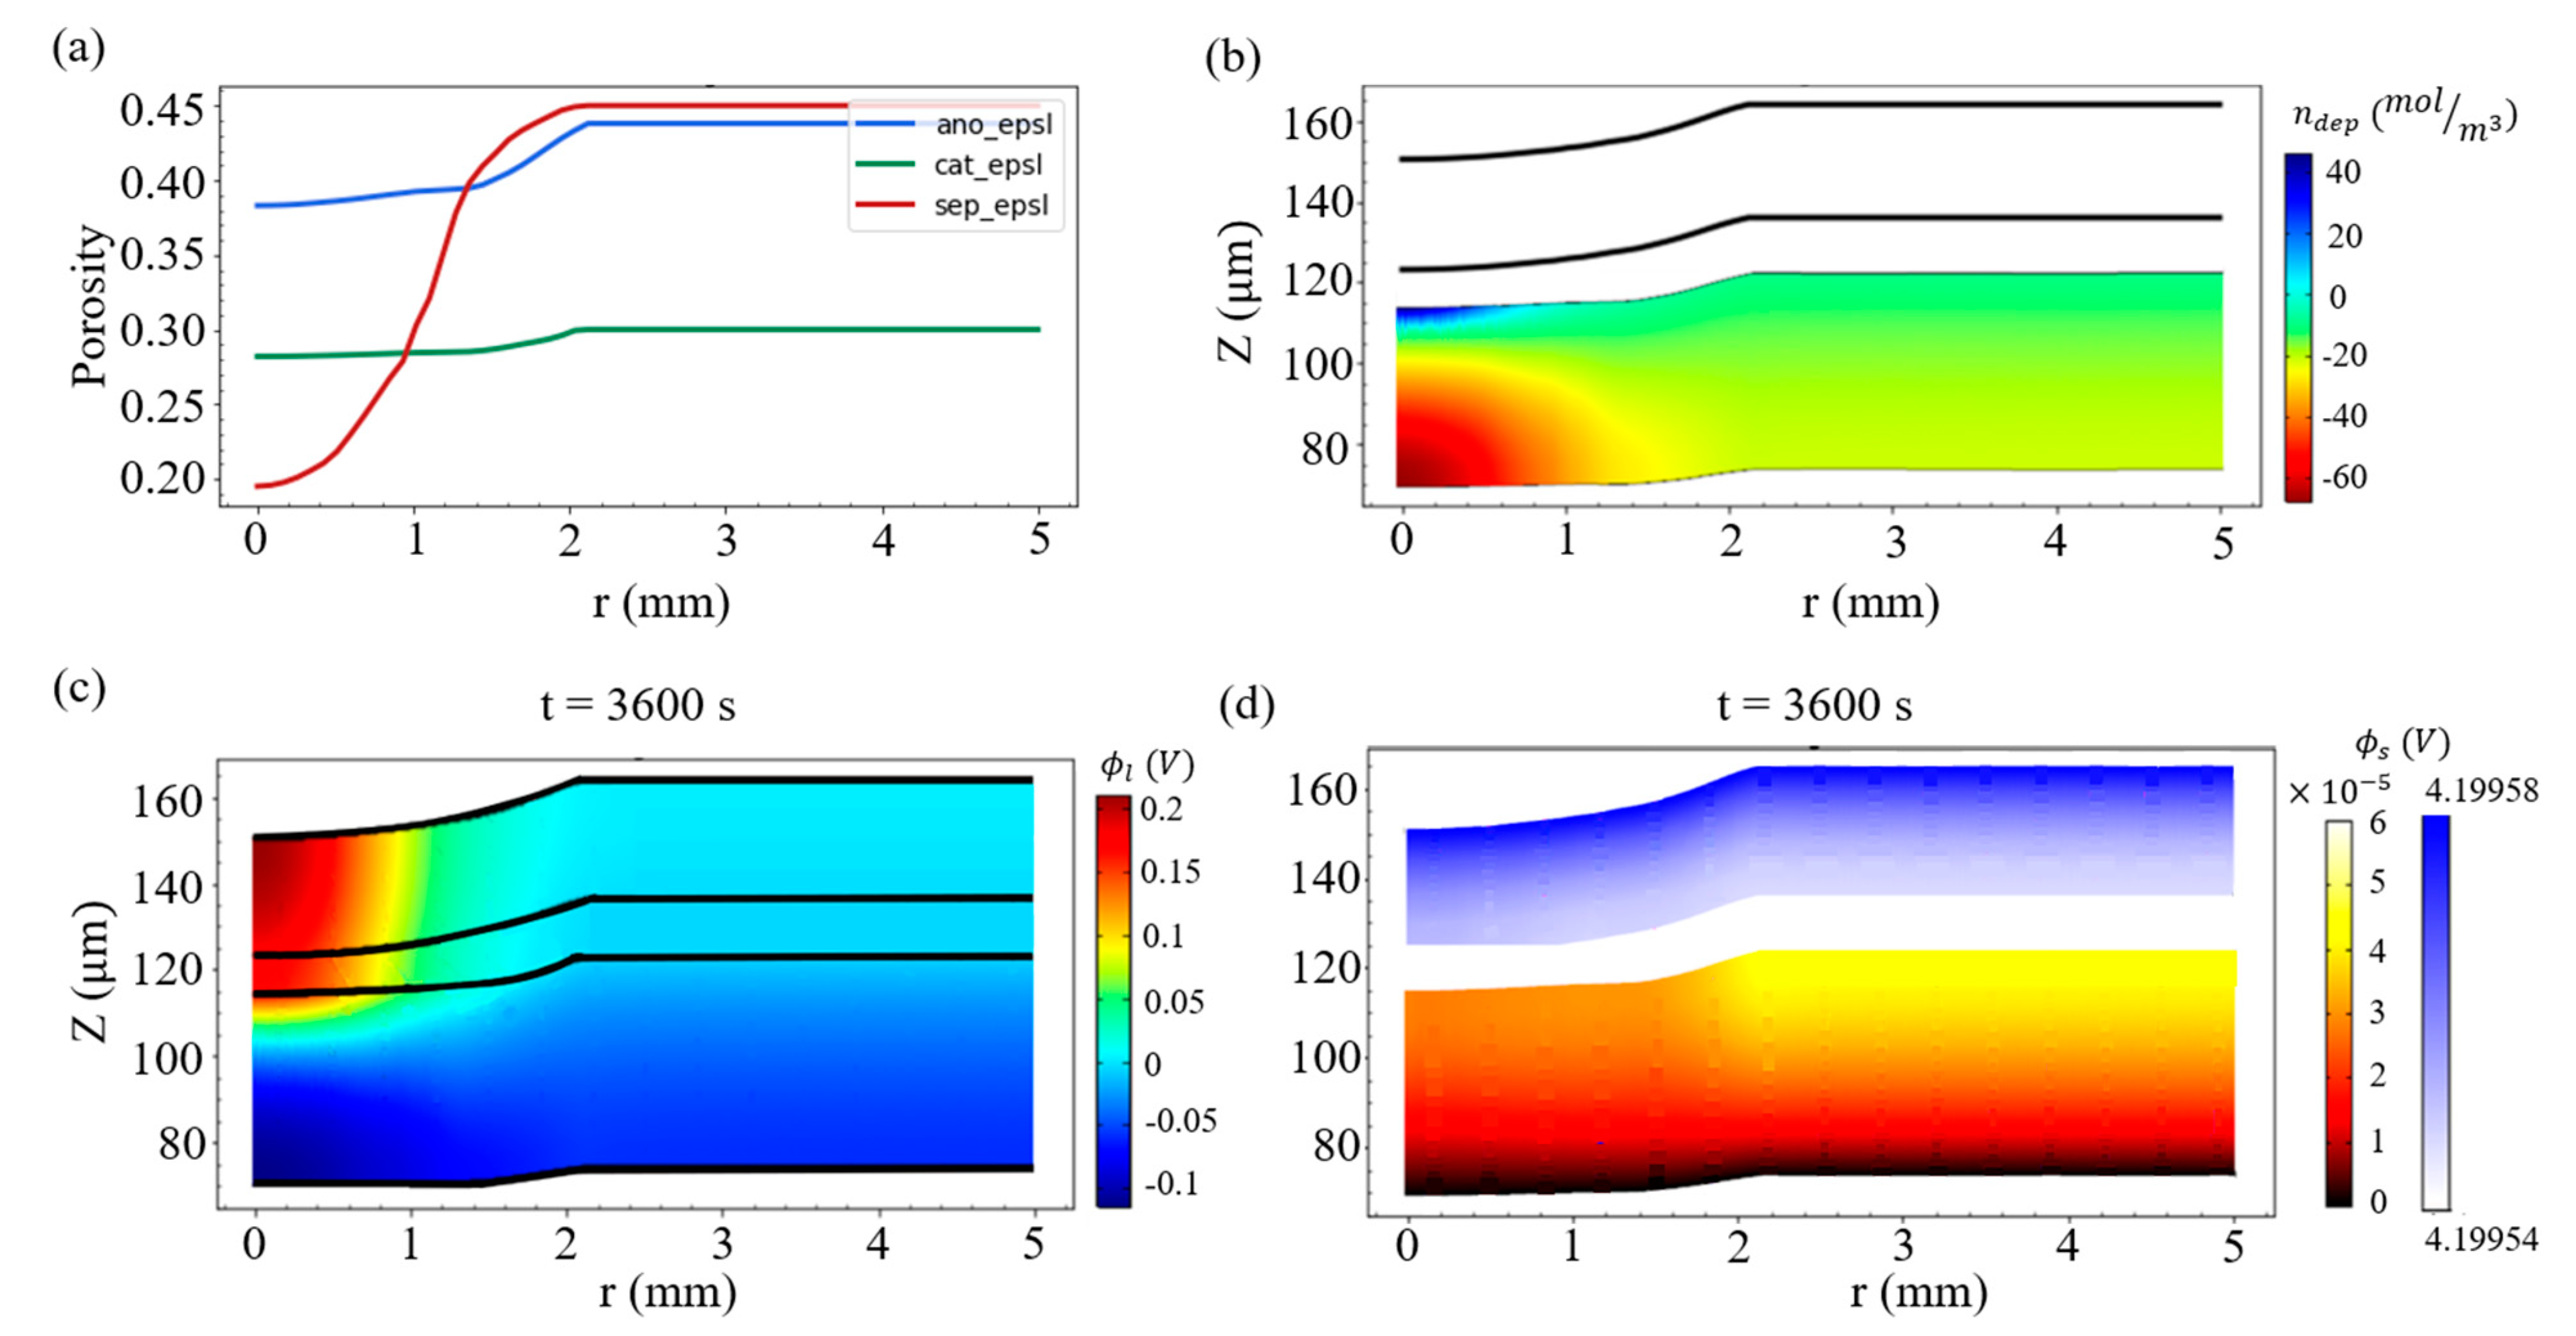
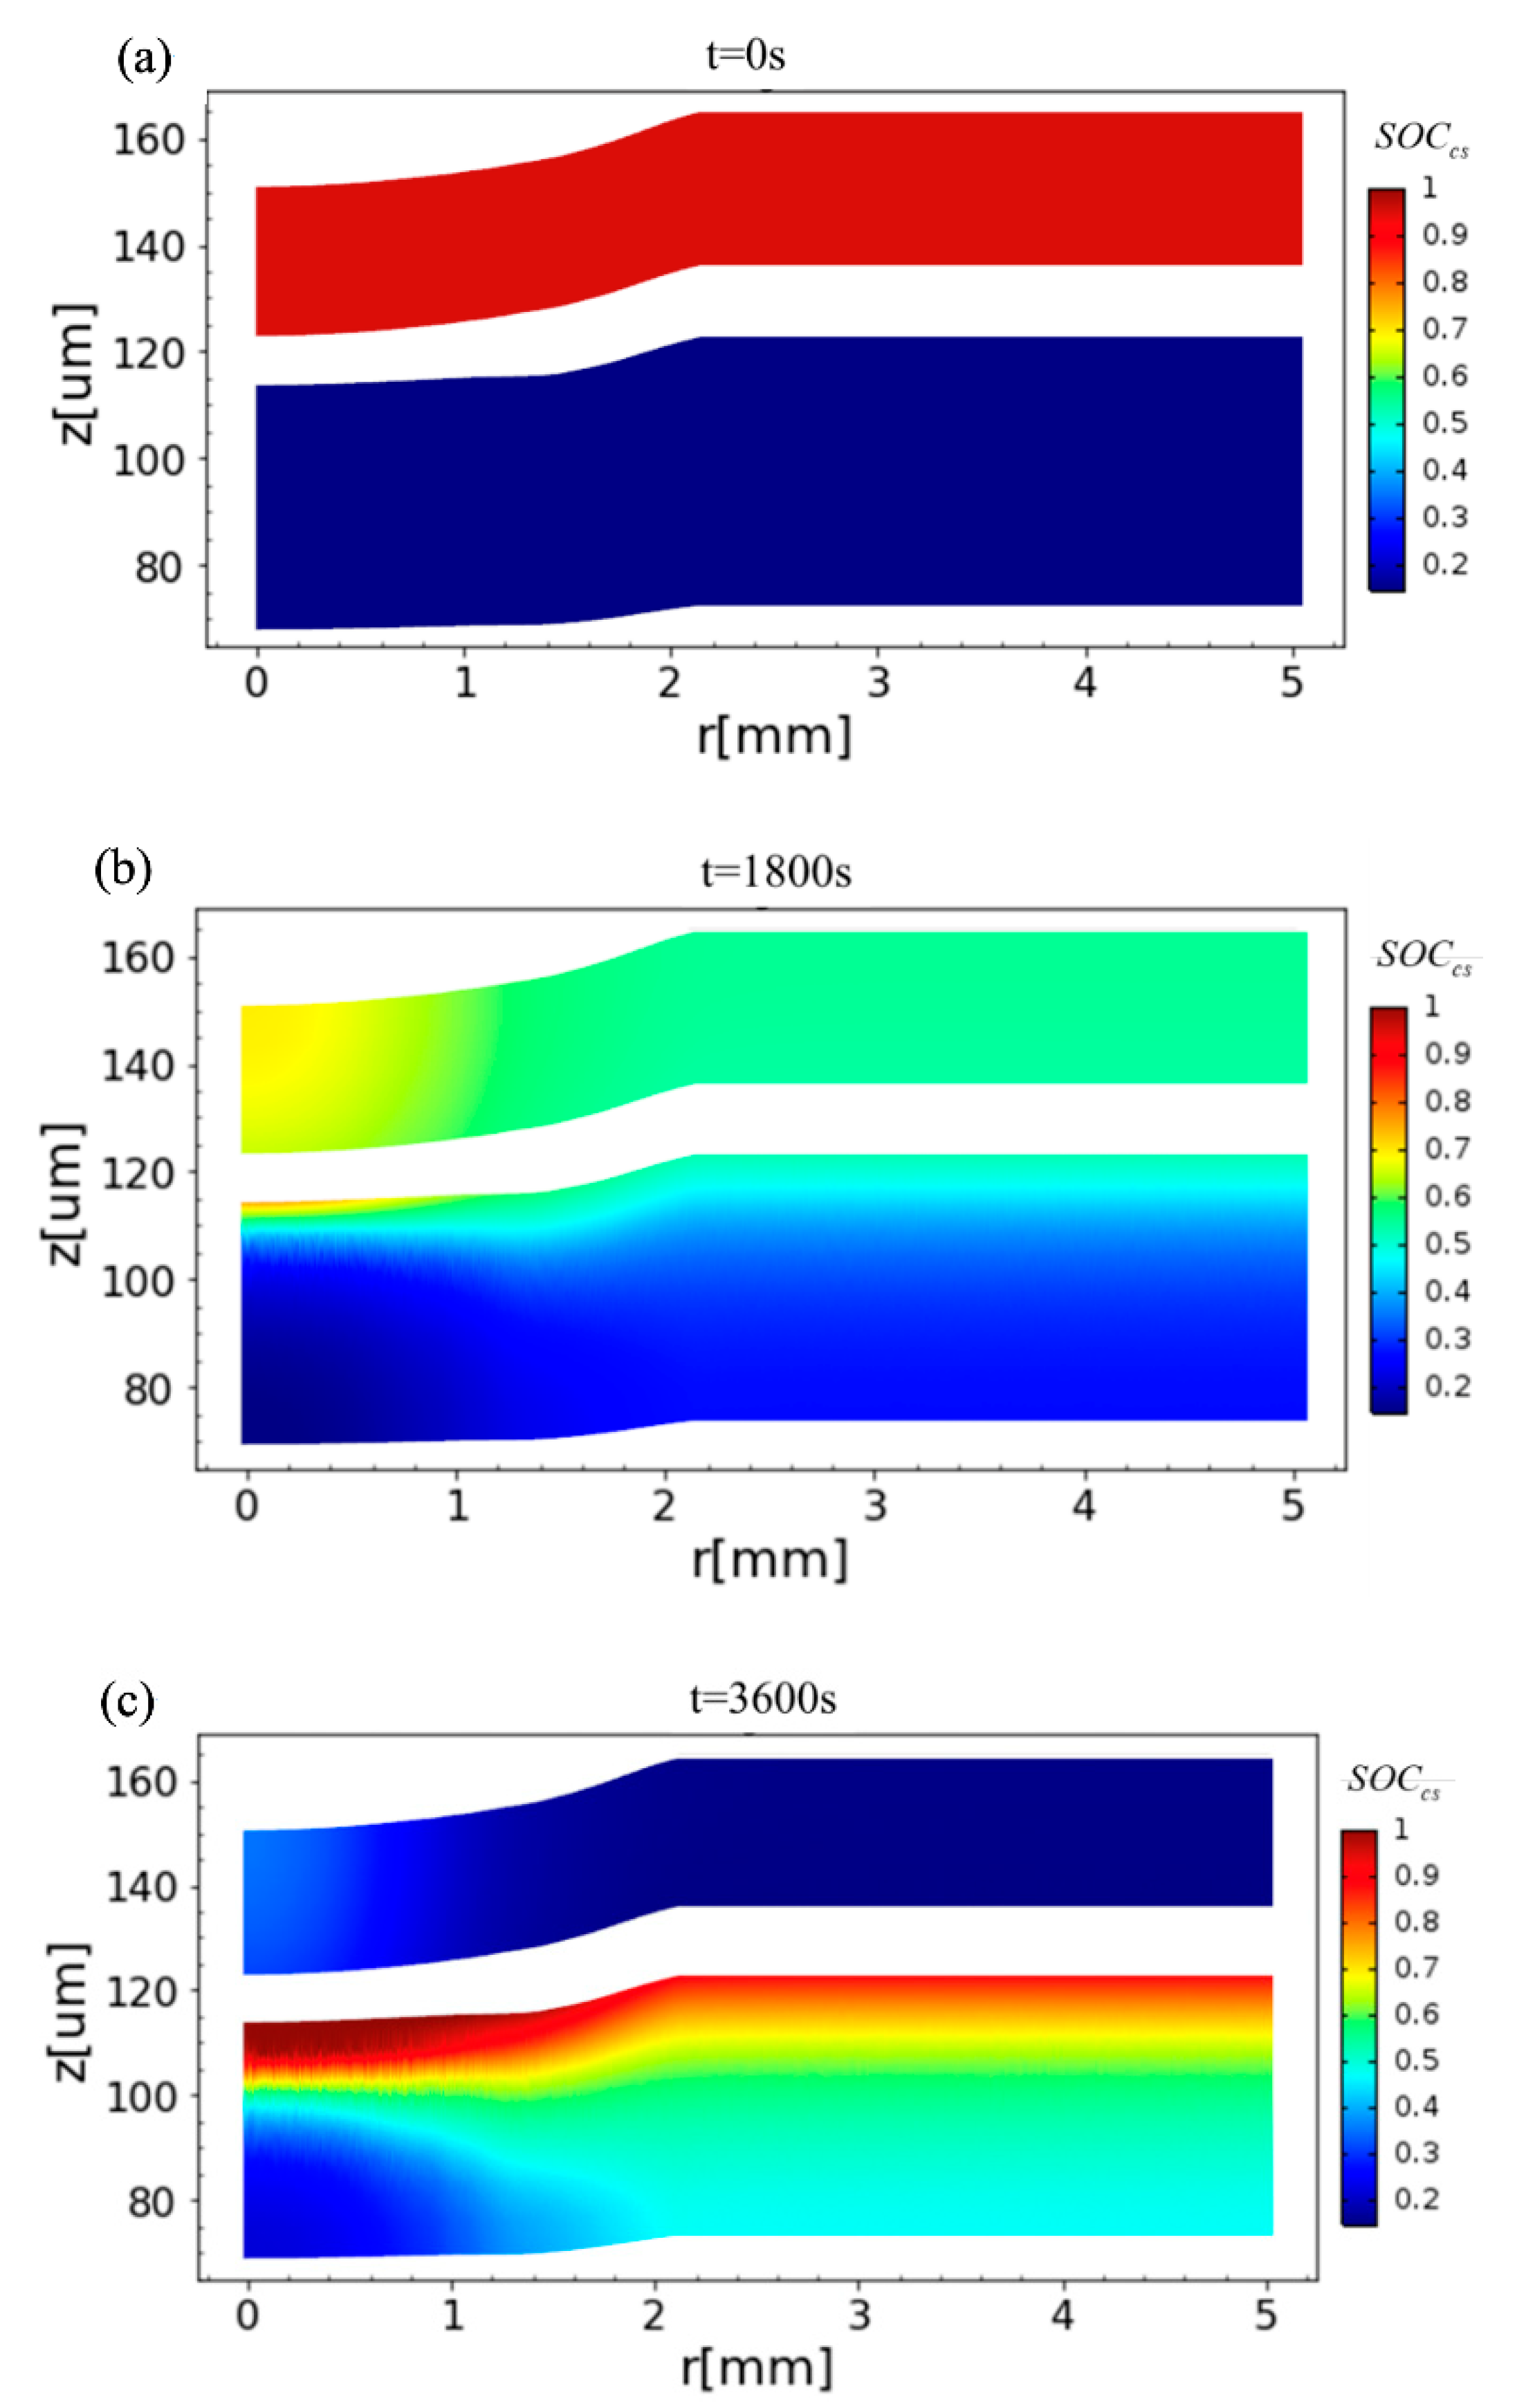
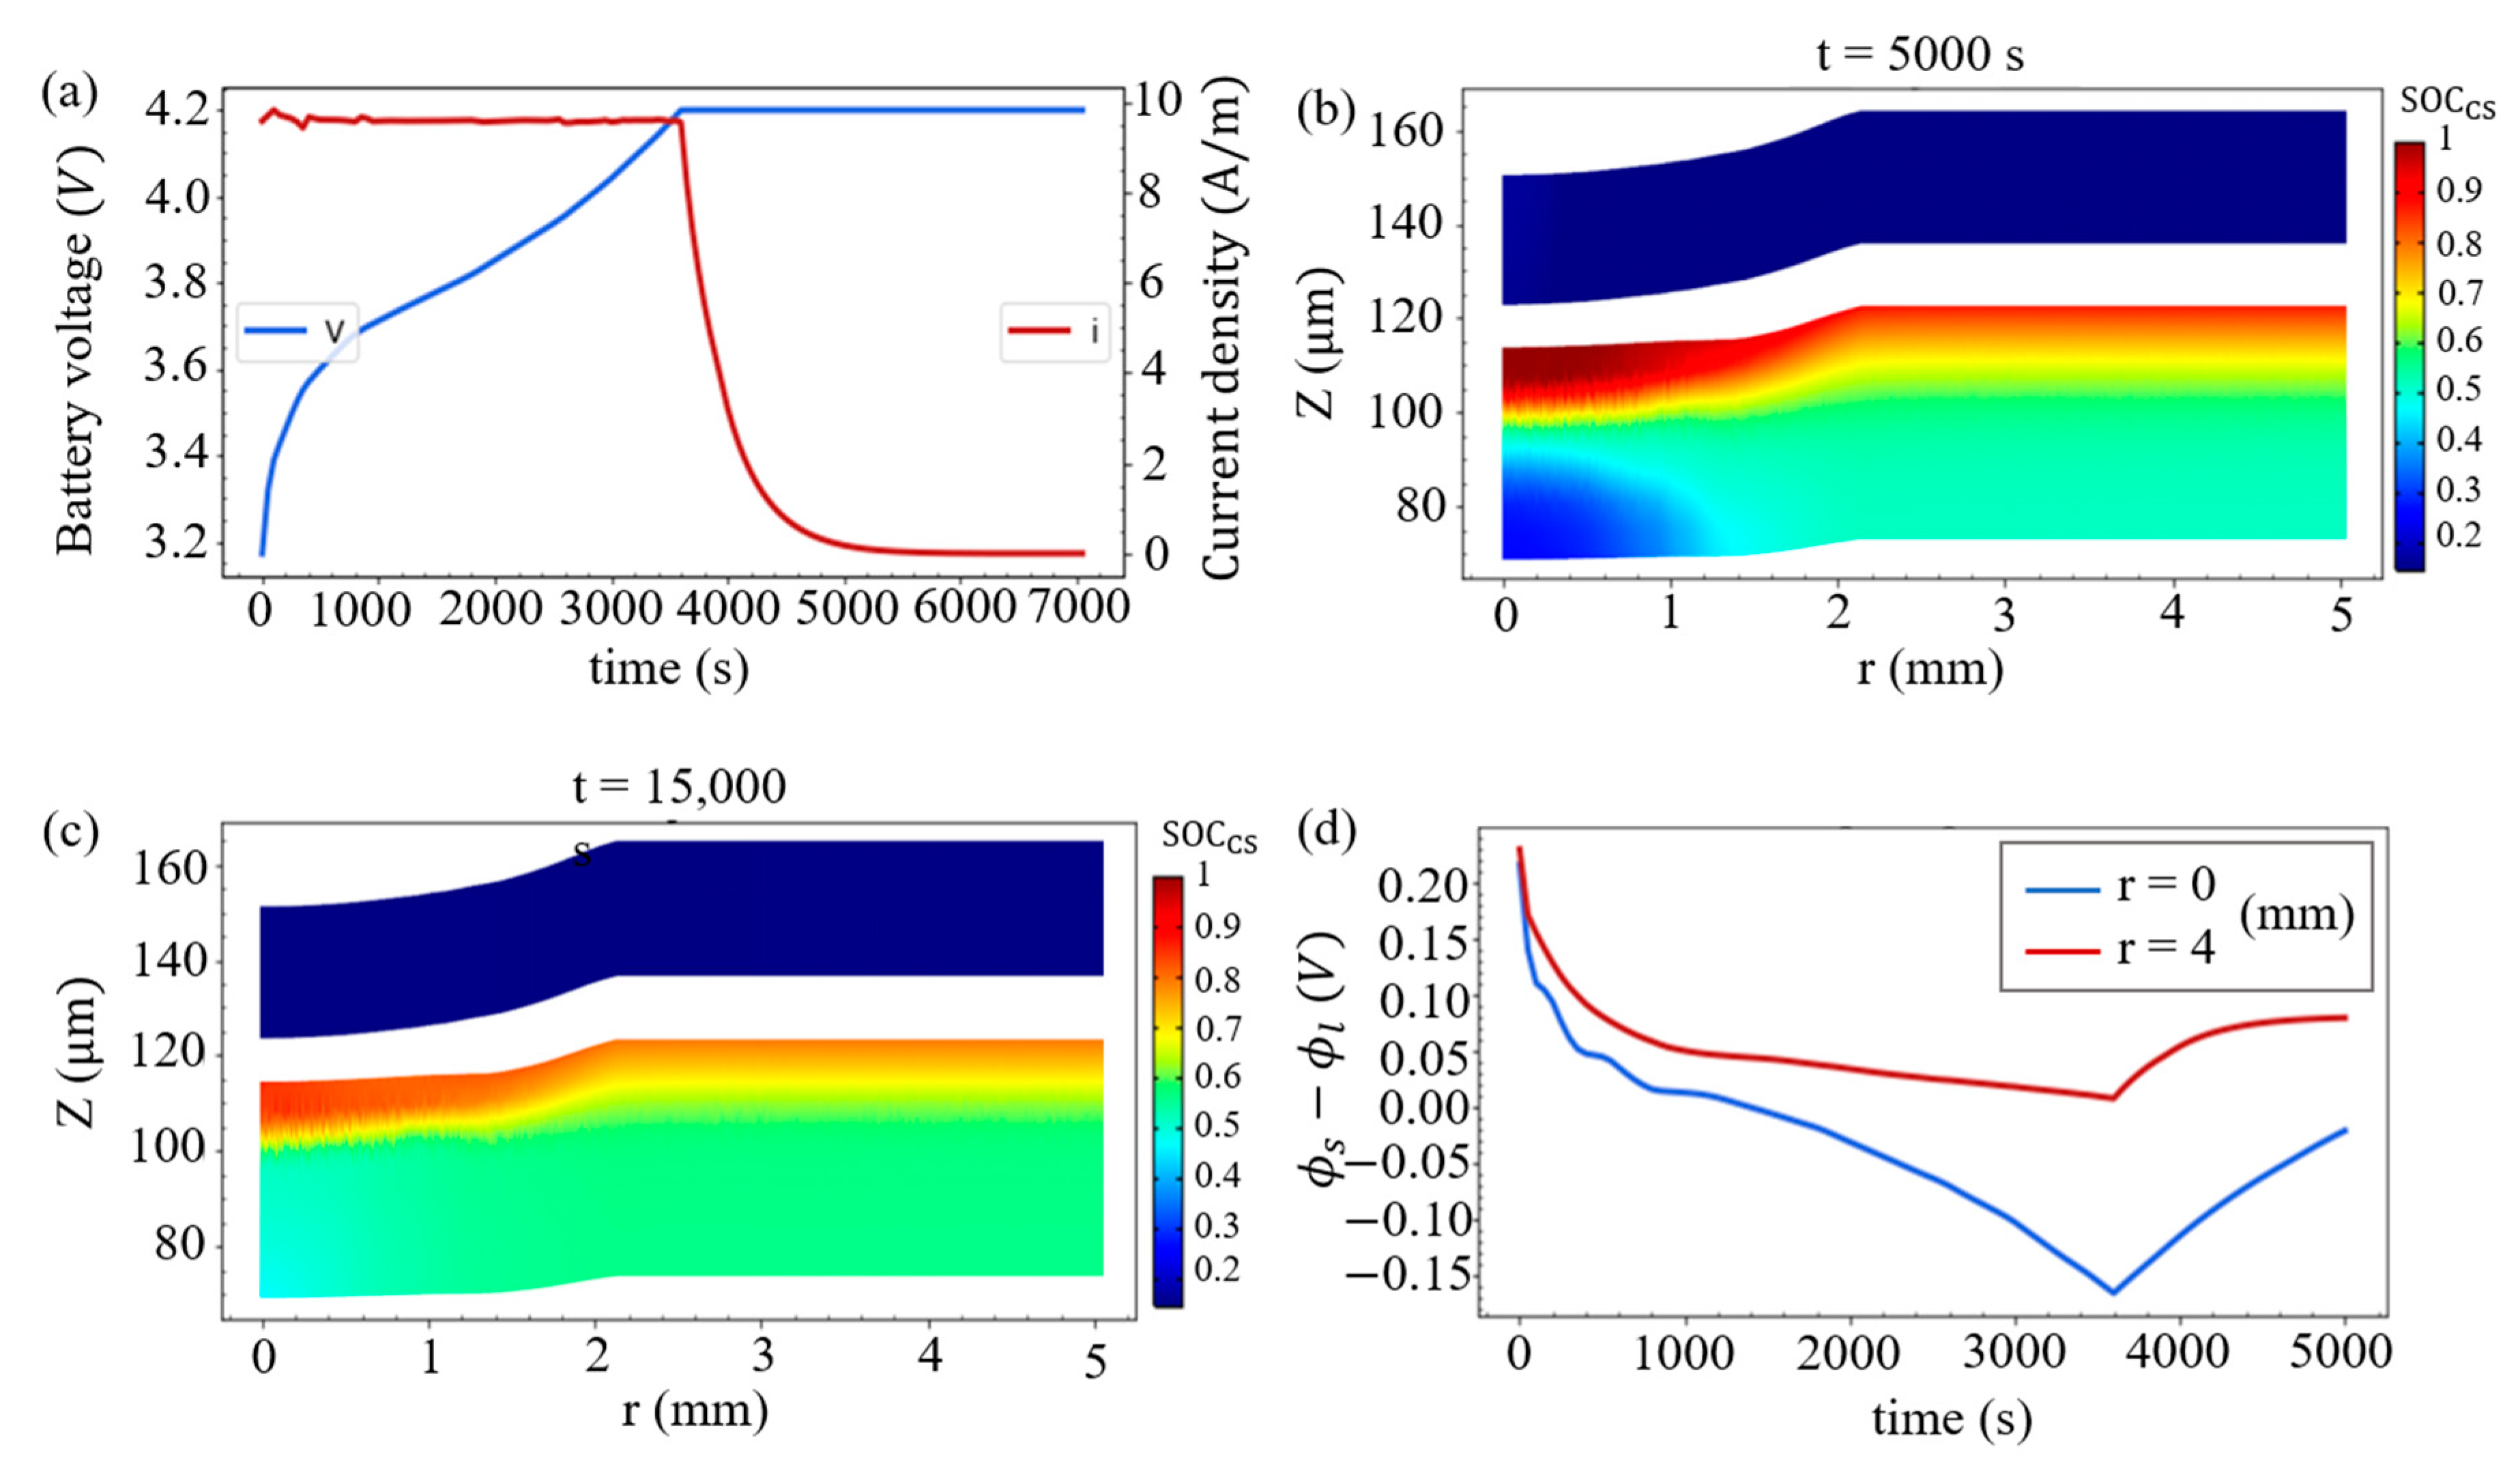
3.2. Charge with CCCV

Here, the battery is charged at a constant current (CC) for 3600 s to 4.2 V, and is then further charged at a constant voltage (CV) of 4.2 V. As shown in Figure 7a, the current drops rapidly during the CV process. At t = 5000 s, the SOCcs distribution inside the battery is shown in Figure 7b, and we observe that around r = 0 this SOCcs distribution in the positive electrode is more uniform when compared with the distribution at the end of CC charging (t = 3600 s) in Figure 6c. In addition, it can be seen that the size of the domain with a relatively low value of SOCcs in the negative electrode is reduced, indicating that lithium ions diffuse to the compression zone of the negative electrode. This diffusion will continue and the SOCcs will gradually become uniform along the r-direction, which can be seen in Figure 7c when the CV continues and the charging time extends to 15,000 s. Moreover, at the junction of the negative electrode and the separator, the time evolutions of the SR overpotential for the Li-metal deposition at the point of indentation (r = 0) and at the point deviating from the indentation (r = 4 mm) are demonstrated in Figure 7d. It is found that the SR overpotential at r = 0 is less than 0 when charging for about 1300 s. Even if this overpotential still keeps negative within 3600 s to about 6000 s in the CV process, the deposition of lithium ions is less likely to accumulate due to the small current in this process.

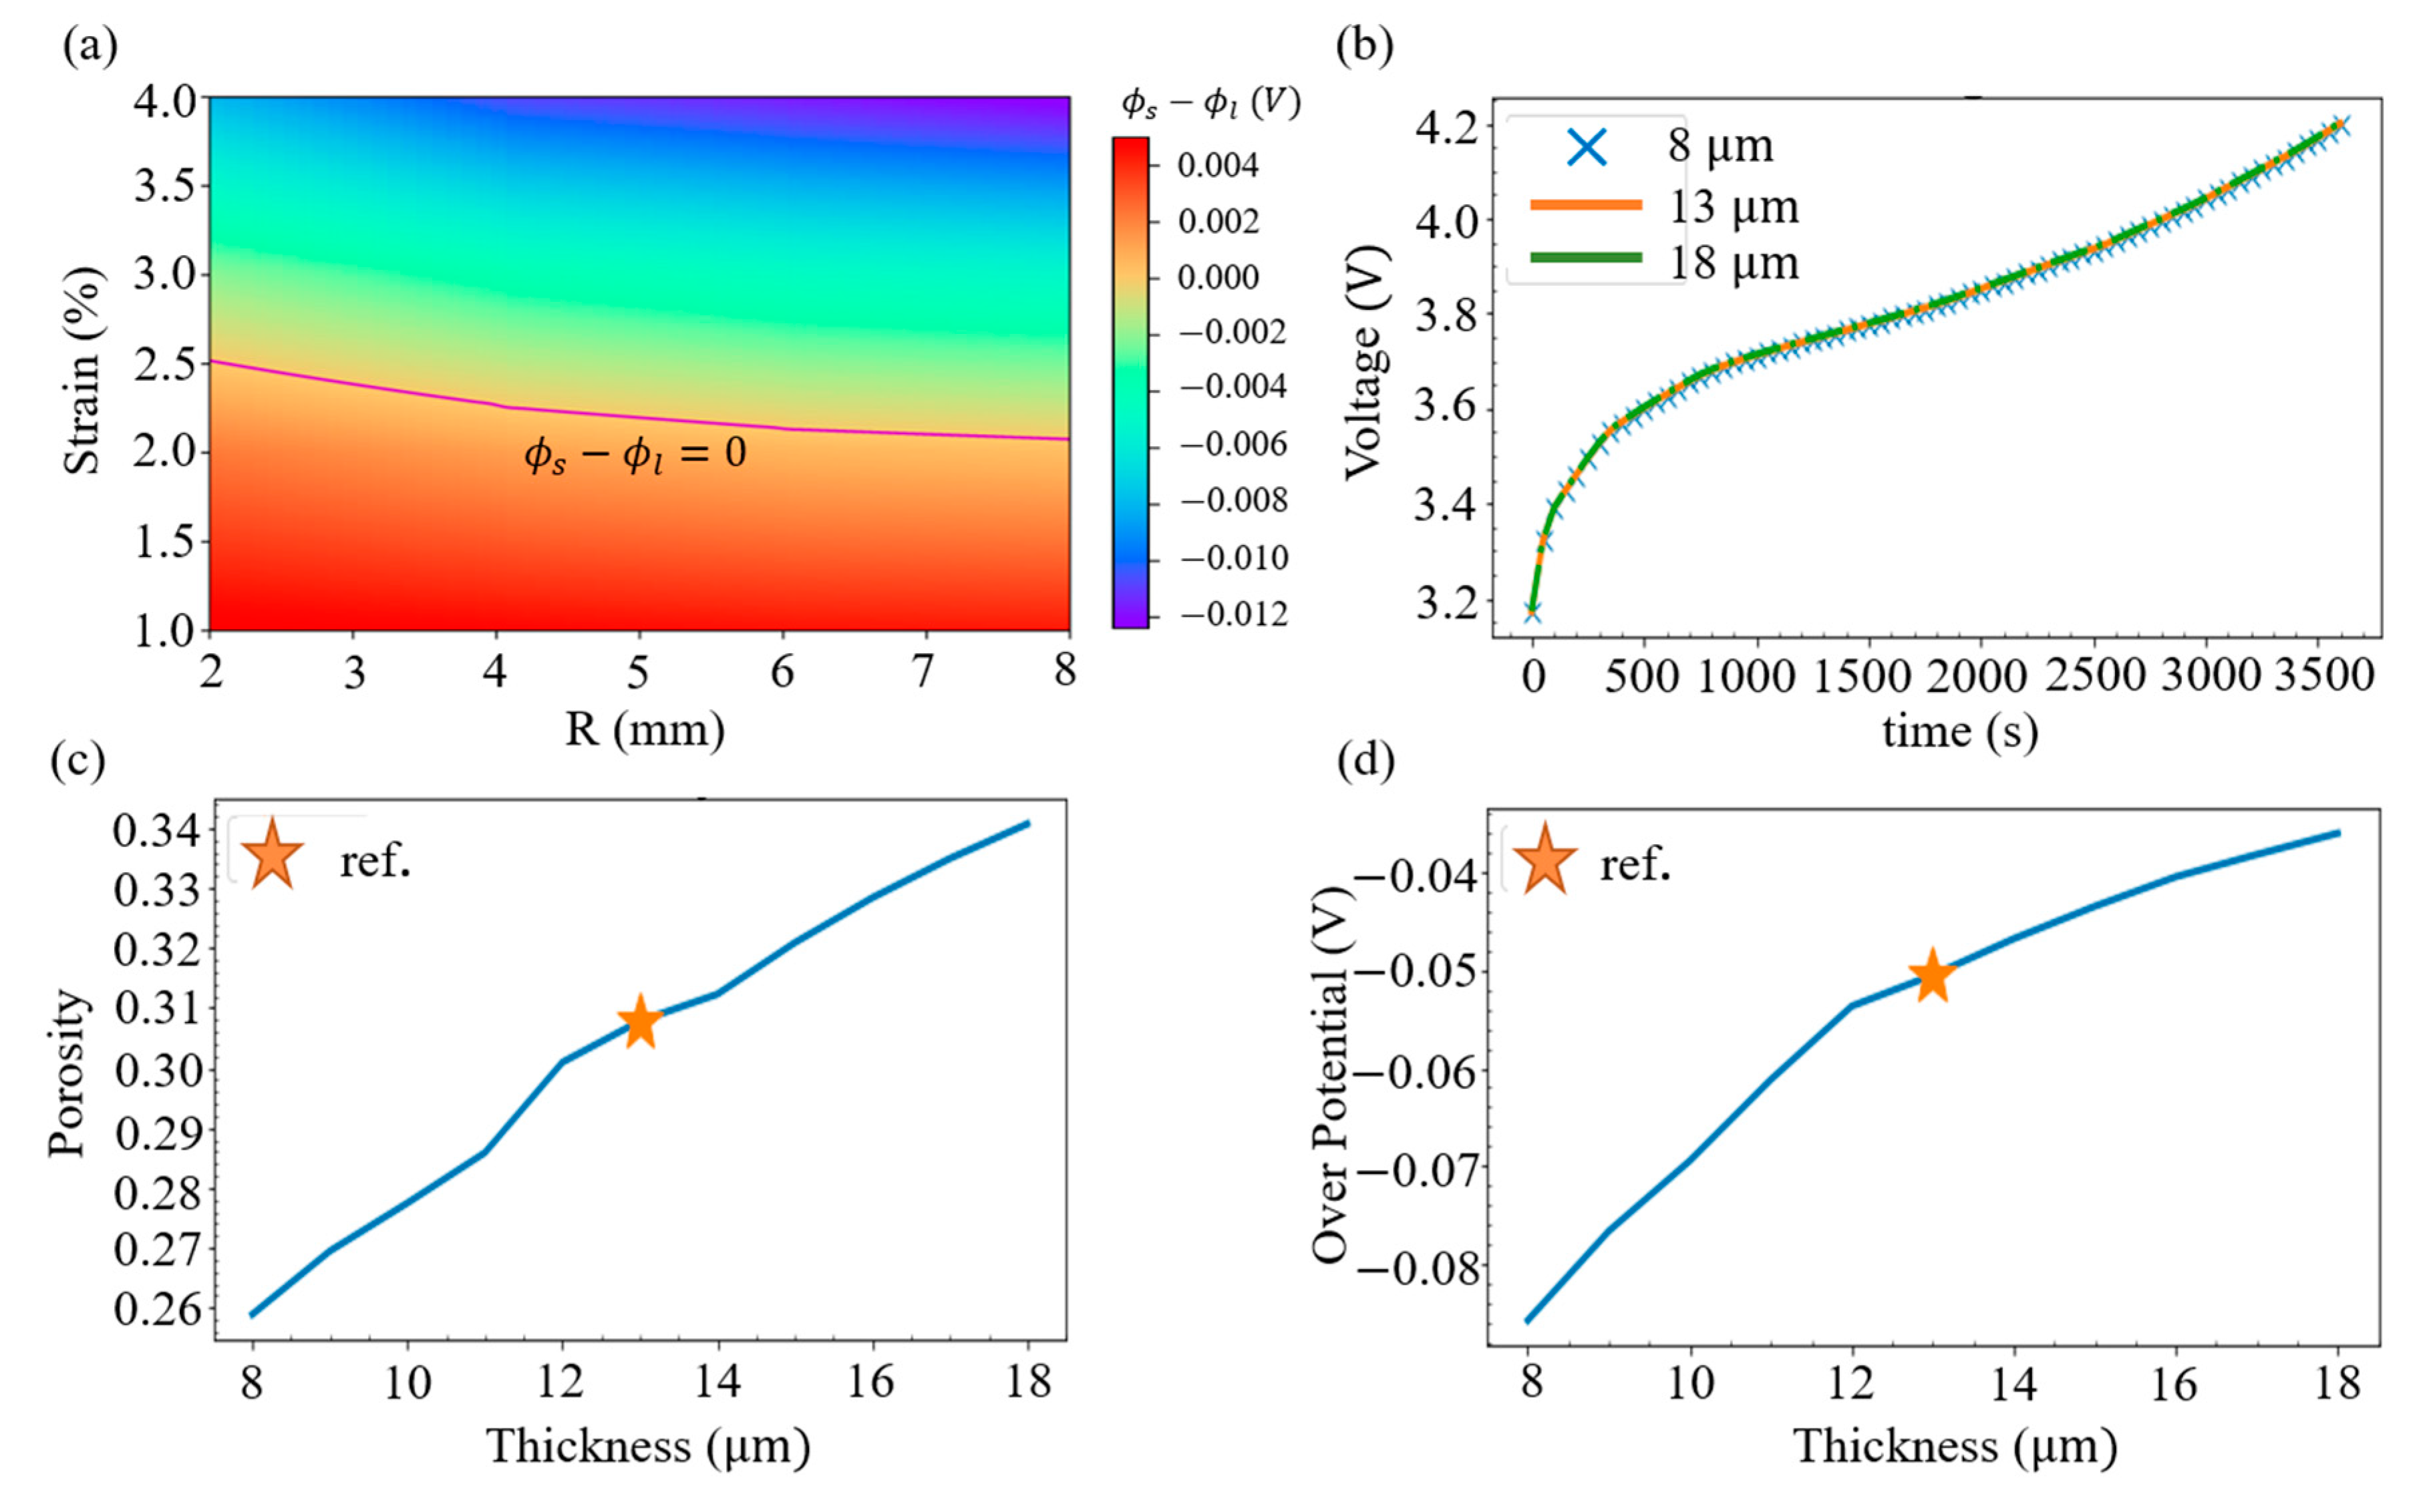
3.3. Deformation and the SR Overpotential

Lithium metal deposition will not only result in battery aging, but will also increase the chance of internal short circuits. To determine whether lithium metal would deposit under various geometry of spherical indentation, i.e., change the radius of sphere R and alter the strain of the battery, the SR overpontential of the negative electrode adjacent to the separator with r = 0 is evaluated. By treating the zero overpotential as the division, it can be seen from Figure 8a that when subjected to a small radius of the indentation sphere, the battery deformation under a strain of about 2.5% does not cause lithium metal deposition; however, when a larger radius is used, only about 2.2% of the strain can be tolerated.
It can also be shown that changing the internal design of the battery would affect the ability of the battery to resist external forces. To explore the issue, we consider different choices of separator thickness and evaluate the terminal voltage when a sphere with a radius of 6 mm is pressed into a 6% relative displacement. From the electrochemical simulation in Figure 8b, it is found that changing the thickness of the separator from 8, 13, to 18 mm has little effect on the charging voltage. However, with the same compression, the mechanical analysis in Figure 8c indicates that thinner separators have greater strain, resulting in a lower volume fraction of the electrolyte (or porosity). Figure 8d illustrates that this drop further leads to a more negative value of the SR overpotential at the intersection of r = 0 and the junction of the negative electrode and the separator. Hence, it is concluded that a separator with a thinner thickness would increase the risk of the lithium deposition.

4. Conclusions

The mechanical and electrochemical response of a LIB subjected to a spherical indentation is numerically simulated. Two points can be summarized regarding the small compression on the electrochemistry of a LIB. First, it is found that the indentation causes local strain inside the battery, which induces the decrease of the volume fraction of the electrolyte in the separator and electrodes. This decrease makes the SR overpotential at the junction of the negative electrode and the separator become negative, resulting in lithium deposition during the CC charging process. Second, the map of the overpotential at the position under the indentation and at the junction of the anode and the separator is plotted, indicating that a strain higher than about 2% will result in a negative overpotential, and thus have a negative impact on a LIB.
The negative overpotential is an indicator of the lithium deposition. The current study shows that the overpotential at the junction of the negative electrode and the separator could become negative, which is compatible with the simulation result by Cannarella and Arnold [11], who show that the local electrode potential can decline to negative values along the separator/negative electrode interface in the charging process when there are defects (closed pores) in the separator. Since the reduction in porosity caused by the spherical indentation is analogous to the effect of closed pores in the separator, we believe that our analytical result is qualitatively correct.
Finally, it is noticed that the shear-induced volume change, which can be observed in porous media [32,33], is not explored in our mechanical modeling for the sake of simplicity. Whether the effect is significant in a battery system is an interesting topic to explore in future research.

Author Contributions

Conceptualization and writing—original draft preparation, H.-C.L. and K.-C.C.; methodology and software, H.-C.L.; validation and formal analysis, H.-C.L., K.-C.C. and C.-H.C.; writing—review and editing, project administration, and funding acquisition, K.-C.C. All authors have read and agreed to the published version of the manuscript.

Funding

This work was supported by the Ministry of Science and Technology R.O.C. under Grant MOST 109-2221-E-002-009.

Institutional Review Board Statement

Not applicable.

Informed Consent Statement

Not applicable.

Data Availability Statement

Not applicable.

Conflicts of Interest

The authors declare no conflict of interest.

Nomenclature

Hthickness of the battery before deformation
Wthickness of the battery after deformation
hithickness of the layer i
εstrain of the layer i
εV,ivolumetric strain of the layer i
ddistance of the sphere pressed into the battery
rradius of the sphere indentation
esvolume fraction of solid
elvolume fraction of fluid
Dsdiffusion coefficient of lithium in electrode
Dldiffusion coefficient of fluid in electrolyte
κsconductivity of solid phase
κlconductivity of fluid phase
Ffaraday’s constant
i0,1exchange current density
Rggas constant
Ttemperature
ϕssolid phase potential
ϕlelectrolyte phase potential
j1reaction flux
j2reduction flux of lithium
ndepmolar number of deposition per unit volume
asspecific interfacial area
η1surface overpotential
η2side-reaction overpotential
Csconcentration of lithium in electrode
SOCcslocal state of charge
Uopen circuit potential
RfSEI film resistance
clconcentration of lithium ions in electrolyte
t+transference number
k1reaction rate constant

References

  1. Fantham, T.L.; Gladwin, D.T. An overview of safety for laboratory testing of lithium-ion batteries. Energy Rep. 2021, 7, 2–8. [Google Scholar]
  2. Williard, N.; He, W.; Hendricks, C.; Pecht, M. Lessons learned from the 787 Dreamliner issue on lithium-ion battery reliability. Energies 2013, 6, 4682–4689. [Google Scholar]
  3. Hendricks, C.; Williard, N.; Mathew, S.; Pecht, M. A failure modes, mechanisms, and effects analysis (FMMEA) of lithium-ion batteries. J. Power Sources 2015, 297, 113–120. [Google Scholar]
  4. Zhu, J.; Wierzbicki, T.; Li, W. A review of safety-focused mechanical modeling of commercial lithium-ion batteries. J. Power Sources 2018, 378, 153–168. [Google Scholar]
  5. Li, Z.; Huang, J.; Liaw, B.Y.; Metzler, V.; Zhang, J. A review of lithium deposition in lithium-ion and lithium metal secondary batteries. J. Power Sources 2014, 254, 168–182. [Google Scholar]
  6. Loveridge, M.J.; Remy, G.; Kourra, N.; Genieser, R.; Barai, A.; Lain, M.J.; Guo, Y.; Amor-Segan, M.; Williams, M.A.; Amietszajew, T.; et al. Looking deeper into the Galaxy (Note 7). Batteries 2018, 4, 3. [Google Scholar]
  7. Zhang, C.; Santhanagopalan, S.; Sprague, M.A.; Pesaran, A.A. Coupled mechanical-electrical-thermal modeling for short-circuit prediction in a lithium-ion cell under mechanical abuse. J. Power Sources 2015, 290, 102–113. [Google Scholar]
  8. Wu, H.; Zhuo, D.; Kong, D.; Cui, Y. Improving battery safety by early detection of internal shorting with a bifunctional separator. Nat. Commun. 2014, 5, 5193. [Google Scholar]
  9. Yang, X.G.; Leng, Y.; Zhang, G.; Ge, S.; Wang, C.Y. Modeling of lithium plating induced aging of lithium-ion batteries: Transition from linear to nonlinear aging. J. Power Sources 2017, 360, 28–40. [Google Scholar]
  10. Jana, A.; Ely, D.R.; García, R.E. Dendrite –separator interactions in lithium-based batteries. J. Power Sources 2015, 275, 912–921. [Google Scholar]
  11. Cannarella, J.; Arnold, C.B. The effects of defects on localized plating in lithium-ion batteries. J. Electrochem. Soc. 2015, 162, A1365–A1373. [Google Scholar]
  12. Bach, T.C.; Schuster, S.F.; Fleder, E.; Müller, J.; Brand, M.J.; Lorrmann, H.; Jossen, A.; Sextl, G. Nonlinear aging of cylindrical lithium-ion cells linked to heterogeneous compression. J. Energy Storage 2016, 5, 212–223. [Google Scholar]
  13. Lin, X.; Khosravinia, K.; Hu, X.; Li, J.; Lu, W. Lithium plating mechanism, detection, and mitigation in lithium-ion batteries. Prog. Energy Combust. Sci. 2021, 87, 100953. [Google Scholar]
  14. Sun, T.; Shen, T.; Zheng, Y.; Ren, D.; Zhu, W.; Li, J.; Wang, Y.; Rui, X.; Wang, S.; Wang, L.; et al. Modeling the inhomogenerous lithium plating in lithium-ion batteries induced by non-uniform temperature distribution. Electrochim. Acta 2022, 425, 140701. [Google Scholar]
  15. von Lüders, C.; Keil, J.; Webersberger, M.; Jossen, A. Modeling of lithium plating and lithium stripping in lithium-ion batteries. J. Power Sources 2019, 414, 41–47. [Google Scholar]
  16. Yang, X.G.; Ge, S.; Liu, T.; Leng, Y.; Wang, C.Y. A look into the voltage plateau signal for detection and quantification of lithium plating in lithium-ion cells. J. Power Sources 2018, 395, 251–261. [Google Scholar]
  17. Tang, M.; Albertus, P.; Newman, J. Two-Dimensional Modeling of Lithium Deposition during Cell Charging. J. Electrochem. Soc. 2009, 156, A390–A399. [Google Scholar]
  18. Verbrugge, M.W.; Koch, B.J. Microelectrode investigation of ultrahigh-rate lithium deposition and stripping. J. Electroanal. Chem. 1994, 367, 123–129. [Google Scholar]
  19. Perkins, R.D.; Randall, A.V.; Zhang, X.; Plett, G.L. Controls oriented reduced order modeling of lithium deposition on overcharge. J. Power Sources 2012, 209, 318–325. [Google Scholar]
  20. Sahraei, E.; Hill, R.; Wierzbicki, T. Calibration and finite element simulation of pouch lithium-ion batteries for mechanical integrity. J. Power Sources 2012, 201, 307–321. [Google Scholar]
  21. Sahraei, E.; Bosco, E.; Dixon, B.; Lai, B. Microscale failure mechanisms leading to internal short circuit in Li-ion batteries under complex loading scenarios. J. Power Sources 2016, 319, 56–65. [Google Scholar]
  22. Cannarella, J.; Liua, X.; Leng, C.Z.; Sinko, P.D.; Gor, G.Y.; Arnold, C.B. Mechanical properties of a battery separator under compression and tension. J. Electrochem. Soc. 2014, 161, F3117–F3122. [Google Scholar]
  23. Zhu, J.; Li, W.; Xia, Y.; Sahraei, E. Testing and modeling the mechanical properties of the granular materials of graphite anode. J. Electrochem. Soc. 2018, 165, A1160–A1168. [Google Scholar]
  24. Yin, H.; Ma, S.; Li, H.; Wen, G.; Santhanagopalan, S.; Zhang, C. Modeling strategy for progressive failure prediction in lithium-ion batteries under mechanical abuse. eTransportation 2021, 7, 100098. [Google Scholar]
  25. Li, H.; Zhou, D.; Zhang, M.; Liu, B.; Zhang, C. Multi-field interpretation of internal short circuit and thermal runaway behavior for lithium-ion batteries under mechanical abuse. Energy 2022, 263, 126027. [Google Scholar] [CrossRef]
  26. Zhou, D.; Li, H.; Li, Z.; Zhang, C. Toward the performance evolution of lithium-ion battery upon impact loading. Electrochim. Acta 2022, 432, 141192. [Google Scholar]
  27. Li, H.; Liu, B.; Zhou, D.; Zhang, C. Coupled mechanical-electrochemical-thermal study on the short-circuit mechanism of lithium-ion batteries under mechanical abuse. J. Electrochem. Soc. 2020, 167, 120501. [Google Scholar]
  28. Li, H.; Zhou, D.; Du, C.; Zhang, C. Parametric study on the safety behavior of mechanically induced short circuit for lithium-ion pouch batteries. J. Electrochem. Energy Convers. Storage 2021, 18, 020904. [Google Scholar]
  29. Bernardi, D.; Pawlikowski, E.; Newman, J. A general energy balance for battery systems. J. Electrochem. Soc. 1985, 132, 5. [Google Scholar]
  30. Doyle, M.; Fuller, T.F.; Newman, J. Modeling of galvanostatic charge and discharge of the lithium/polymer/insertion cell. J. Electrochem. Soc. 1993, 140, 1526. [Google Scholar]
  31. Doyle, M.; Newman, J.; Gozdz, A.S.; Schmutz, C.N.; Tarascon, J.M. Comparison of modeling predictions with experimental data from plastic lithium ion cells. J. Electrochem. Soc. 1996, 143, 1890–1903. [Google Scholar]
  32. Chen, K.C.; Lan, J.Y. Micromorphic modeling of granular materials. Int. J. Solids Struct. 2009, 46, 1554–1563. [Google Scholar]
  33. Lee, C. Two-phase modelling of submarine granular flows with shear-induced volume change and pore-pressure feedback. J. Fluid Mech. 2021, 907, A31. [Google Scholar]
Figure 1. Schematic of the spherical indentation and a simplified one-dimensional mechanical LIB model. The thickness of each layer is taken from a former study [7].
Batteries 08 00268 g001
Figure 2. (a) Compressive stress–strain relation of the main materials inside the battery. The materials of the negative electrode include lithium carbon compound and electrolyte, while the positive electrode contains nickel manganese cobalt (NMC) and electrolyte. The separator is a mixture of high molecular polymer (PVDF) and electrolyte. (b) Stress–strain relation of the whole battery. (c) Stress distribution at different locations. (d) Strain of each layer at different positions. (e) Deformation of each layer. (f) Deformation of the first unit of layers.
Batteries 08 00268 g002
Figure 3. Control volume of the mixture before and after compression.
Batteries 08 00268 g003
Figure 4. Distribution of the volume fractions of (a) the solid active material and (b) the electrolyte. (c) Volume fraction of the electrolyte when the separator thickness is increased from 13 to 23 μm.
Batteries 08 00268 g004aBatteries 08 00268 g004b
Figure 5. (a) Distribution of the volume fractions of the electrolyte (porosity) in the anode, cathode, and separator under the strain of 8%. (b) Field of Li metal production in the negative electrode, (c) field of the electrolyte potential, and (d) potential field of the solid electrode at the end of charging.
Batteries 08 00268 g005
Figure 6. Distribution of the SOCcs at the positive (top) electrode and the negative (lower) electrode in the charging process when (a) t = 0, (b) t = 1800 s, and (c) t = 3600 s.
Batteries 08 00268 g006
Figure 7. (a) Battery voltage and current density during the CCCV charging process. The SOCcs distributions in the two electrodes at (b) t = 5000 s and (c) t = 15,000 s. (d) Time evolutions of the SR overpotential at the junction of the negative electrode and the separator at r = 0 and r = 4 mm.
Batteries 08 00268 g007
Figure 8. (a) Map of the SR overpotential at the intersection of r = 0 and the junction of the anode and the separator. (b) History of the voltage with three separator thicknesses. (c) Relation between the porosity and the separator thickness; the reference thickness is also indicated. (d) Relation between the SR overpotential and the separator thickness.
Batteries 08 00268 g008
Table 1. Reaction kinetic models for various lithium metal depositions.
ModelFeatureOutcomeRef.
αa,2 = 0.5, αc,2 = 0.5Same charge transfer coefficients.Overestimation of Li metal oxidation.[11]
αa,2 = 0.33, αc,2 = 0.67Transfer coefficient is measured.Interfacial resistance is attributable to degradation.[18]
TafelLi metal will not re-oxidize to lithium ions.Li metal generated continuously.[9]
Modified Butler–VolmerReduced-order model with plating equations is presented.Li metal deposition when the overpotential is less than zero.[19]
Table 2. Equations of the P2D model of a LIB.
DescriptionsEquations
Interfacial reaction kinetics η 1 = ϕ s ϕ l U ( S O C ) F j 1 R f
i 0 , 1 = F k 1 [ c l C s , s u r f a c e ( C s , s u r f a c e max C s , s u r f a c e ) ] 0.5
j 1 = i 0 , 1 exp F α a , 1 η 1 R g T exp F α c , 1 η 1 R g T
Charge conservation in the solid phase · κ s ϕ s = F a s j
Solid phase diffusion C s / t = · D s C s
Charge conservation in the electrolyte phase · κ s ϕ s + · κ l ϕ l + 2 R T F ( t + 1 ) · κ l ( ln c l ) = 0
Mass transfer in the electrolyte phase e l c l t = · e l D l c l + a s 1 t + j
Table 3. Original volume fractions of the simulated battery [11].
ParametersPositiveSeparatorNegative
Volume fraction of electrolyte el0.30.450.438
Volume fraction of active material es 0.550.550.505
Bruggeman exponent γ1.52.34.1
Publisher’s Note: MDPI stays neutral with regard to jurisdictional claims in published maps and institutional affiliations.

