Abstract
A novel energy storage mode based on the vehicle-to-grid (V2G) and vehicle-to-vehicle (V2V) concept will be greatly researched and applied as a new green solution to energy and environmental problems. However, the existing research on battery capacity decline in V2G applications has mainly focused on modeling the battery capacity to investigate its decline during vehicle charging and discharging, in order to reduce the battery capacity decline and evaluate its economics. A car-following model with the acceleration generalized force coupled with external resistance is proposed in the paper. A linear stability analysis was used to analyze the stability of the model. The stability of the traffic flow was improved when the value of the resistance coefficient increases. Then, the currents of different vehicles were also calculated according to the velocities. Moreover, the effect of different physical characteristics of driving on the decline of distributed energy storage batteries in the Internet of Vehicles (IoV) was investigated. The results suggest that in different road types and road slopes, vehicles which are at the end of the platoon position have less battery capacity degradation and better battery condition. It provides a reference for subsequent research related to V2G energy storage in the context of vehicle networking.
1. Introduction
With the development of the global industry and economy, energy and environmental issues have become one of the most important challenges of all countries in this century. The increasing number of vehicles also means more energy consumption and pollutant emission [1]. Therefore, the electrification of vehicles is accelerating as a green solution to energy and environmental problems [2]. In recent years, experts have written many research papers on the use of electric vehicle (EV) batteries in the grid [3]. In the early stages of vehicle electrification, on-demand vehicle charging helped transfer peak loads from the grid [4]. However, as the number of electric vehicles increased, they could be used more efficiently by supplying power to the grid [5]. This kind of concept is called V2G (vehicle-to-grid).
With the popularity of electric vehicles, energy storage modes based on the V2G concept will increase rapidly. Thus, V2G has appeal for many scholars and experts. Martin Hofmann et al. [6] proposed a bi-directional charging concept to investigate the technical possibilities of using electric vehicles (EVs) and plug-in hybrid electric vehicles (PHEVS) and showed that consumer-driven charging and discharging signals can be used for efficient integration into future V2G systems within the limits given by the vehicle battery management system. Mustafa İnci et al. [7] proposed that by providing vehicle to grid (V2G) technology, it enables more efficient use of fuel cell (FC) vehicles to integrate transportation and electricity networks. Henrik Lund et al. [8] modeled four types of fleets at levels of wind penetration ranging from 0% to 100% based on the EnergyPlan model. It was found that the inclusion of electric vehicles and V2G in the energy system can integrate higher levels of wind power generation without generating excess electricity, resulting in significant reductions in CO2 emissions. Udaya K. Madawala et al. [9] proposed a new type of bi-directional IPT system that is particularly suitable for applications such as plug-in electric vehicles (EVs) and vehicle networking (V2G) systems. Mithat C. Kisacikoglu et al. [10] presented a single-phase vehicle-mounted bi-directional plug-in electric vehicle (PEV) charger design scheme. Sayed Saeed Hosseini et al. [11] revealed different aspects of V2G in the power system. This research analyzed V2G in terms of power system services and power market applications. K. Nandha Kumar et al. [12] proposed a half-hourly V2G capacity estimation algorithm using real-time electric vehicle scheduling. The algorithm is implemented as part of a building energy management system (BEMS). I. Sami et al. [13] proposed simulation models for V2G and G2V to describe the various parameters affecting the grid interface network. Meanwhile, some researchers have considered the incorporation of V2G with microgrids. Cui et al. [14] applied V2G to a microgrid and constructed a V2G system based on a parking lot. This research proposed a bi-directional AC/DC and bi-directional DC/DC converter. Then they provided the coordination control strategy. Shi et al. [15] proposed an effective strategy to improve the security and economy of microgrid systems. Paulo R.C. Mendes et al. [16] proposed an economic optimization algorithm for a laboratory microgrid. The microgrid consists of a hybrid storage system consisting of a battery pack and hydrogen storage, which has connections to the external grid and electric vehicle charging station.
As a new energy storage mode, many experts have simulated and predicted the applications and research related to V2G in order to evaluate its economics. Ulas BaranBaloglu et al. [17] analyzed the economics of V2G from different aspects. The results show that the cost of battery aging can be minimized in V2G systems through intelligent energy management systems. Rebecca Gough et al. [18] evaluated the potential for electric vehicles to generate revenue from energy supplied to commercial buildings. The results show that the net revenue generation is highly dependent on the cost of battery decline associated with the V2G cycle. Peng et al. [19] proposed an optimal scheduling strategy for V2G aggregators, and maximize economic efficiency when the aggregator is involved in supplementary FM. Willett Kempton et al. [20] documented a practical demonstration of V2G from real-time frequency regulation on an electric vehicle. Sekyung Han et al. [21] proposed four possible contract types between grid operators and V2G regulation providers, and developed a profit function from APC and penalties to V2G aggregators. Sekyung Han et al. [22] estimated the regulation revenue by analyzing the actual regulation signals and transactions to estimate the transfer energy calculated in terms of contracted power capacity. The expected V2G revenue is estimated and compared with the battery price to determine the economic feasibility of V2G regulation. M. Sufyan et al. [23] researched the optimal coordination of electric vehicles with V2G technology and performed a cost-benefit analysis. This was followed by a real-time analysis of the degradation cost of the battery based on the depth of discharge at each time interval. Simulation results show that operating costs are significantly reduced when renewable energy is integrated into the distribution grid. Y. Ota et al. [24] proposed an autonomous distributed vehicle-to-grid control scheme. The scheme also considers the charging requirements for the next drive and the battery condition during the vehicle-to-grid process. Liang et al. [25] investigated the problem of optimal energy delivery in load-shedding services for V2G systems from the perspective of vehicle owners and aggregators. Alexandros-Michail Koufakis et al. [26] proposed an optimal electric vehicle (EV) charging scheduling scheme that includes vehicle-to-grid (V2G) and vehicle-to-vehicle (V2V) energy delivery options. It is used to improve energy utilization.
In the research on analyzing economics of V2G applications, it can be found that the loss of battery capacity is one of the important reasons for its economic impact. In order to address the feasibility of V2G technology, Hussain W. et al. [27] identified the morphological differences between MnS nanoparticles (NPs) and nanosheets (NSs), and this research is also can be used in various new applications. Bahadur A. et al. [28] proposed a new type of negative electrode material. Through constant current charge and discharge analysis and research, it shows that this material has excellent reversible battery capacity, excellent power capacity and high cycle stability, which is an important step in the development and application of today’s energy storage devices. Kotub Uddin et al. [29] proposed a comprehensive battery degradation model which considered all the established degradation modes and was validated using six different operational use cycles, and later integrated the model into a smart grid algorithm. Benedikt Lunz et al. [30] proposed the models for PHEVs in distribution networks. That could compare the impact of different charging strategies for cost. This research provides a comprehensive analysis of lithium-ion battery aging tests and shows that high battery states of charge (SOCs) reduce battery lifetime, while battery cycling at moderate SOCs has only a small effect on aging. It can be seen that a proper charging strategy can significantly increase the battery lifetime while reducing the charging cost. Mina Jafari et al. [31] proposed a linear model for the co-optimal planning and operation of distributed energy resources and transportation systems in an interconnected system and analyzed the interactions of such interconnected systems. This research also developed a degradation model based on the design of an optimization formulation to increase the battery life of electric vehicles. Shubham Bhoir et al. [32] proposed a battery model based on experiments performed on Li-ion batteries to estimate the battery decline. Yutaka Ota et al. [33] proposed an autonomous distributed V2G control scheme. A typical two-zone model is used to interconnect the grid model and an automotive lithium-ion battery model to simulate the load frequency of grid. Zhou et al. [34] analyzed the mathematical correlation between charge–discharge, ambient temperature, depth of discharge (DoD) and degradation of electric vehicle batteries. Justin D.K. Bishop et al. [35] found that battery degradation is most dependent on energy throughput for both EV and PHEV powertrains, but is most sensitive to charging regime (for EVs) and battery capacity (for PHEVs). Battery degradation for both powertrains is most sensitive to the depth of discharge of individual vehicle batteries when auxiliary services are provided. Li et al. [36] proposed a novel active battery anti-aging V2G scheduling method. Ali Ahmadian et al. [37] proposed a stochastic approach for smart charging of PEVs. Moreover, a comprehensive model on the effect of charging or discharging strategies on the degradation of the vehicle battery pack is included. Kannan Thirugnanam et al. [38] proposed a circuit-based battery and capacity degradation model for electric vehicles (EVs) in V2G. Andreas Thingvad et al. [39] proposed a battery capacity test method in order to analyze the long-term impact of V2G services on EV batteries.
To sum up, existing research on battery capacity decline under V2G applications in the context of the IoV has mainly focused on modeling for battery analysis. This research analyzes the battery capacity decline during vehicle charging and discharging, to reduce the cost of battery decline. However, in actual applications, the driving situation of electric vehicles is complex, dynamic and variable. Factors such as driving situation and position will affect the vehicle’s driving. However, few researchers have considered the relationship of battery capacity degradation with the different driving situations and vehicle positions. Moreover, for the battery decline, multiple aging mechanisms with different temperature dependencies lead to different optimal operating temperatures for different battery lifetimes, affecting the rapid heating strategy of battery packs at low temperatures [40]. Additionally, after the battery capacity declines, the interface between the electrode and electrolyte will change, and the active material will also change, accompanied by the oxidation of lithium metal oxides, which in turn will indirectly affect the fast-charge thermal runaway electrochemical reaction [41]. Thus, it is necessary to estimate the prediction and evaluation of the decline characteristics of different batteries in networked distributed energy storage systems. In the process of car-following, different situations and different platoon positions will affect the movement of vehicles. It means that in different driving situations and external resistance, the dynamic behavior of the vehicle will change. The dynamic behavior of the vehicle will influence its current situation as well as the battery capacity decline. Therefore, it is important to incorporate the external resistance to the vehicle movement. Based on the IoV, this paper proposes a car-following model with the acceleration generalized force coupled with external resistance to analyze the velocities of vehicles when the vehicles are in different situations and different platoon positions. Moreover, the current variations of different vehicles were calculated and analyzed based on the velocity data through the electric vehicle simulation model. After that, this paper evaluates the decline of battery capacity of different vehicles based on the current variations. The results show that under the normal consideration of the external resistance of the vehicle, the vehicle which in the end of the platoon position is driving at a stable speed, the battery current is small, the battery capacity of the vehicle drops a small amount, and the battery condition is good [42]. The communication protocol of V2X for vehicles can take LTEV, 5G and other methods to achieve the V2V and V2G. Then, the information of batteries in electric vehicles can be accessed in real time by the electric grid as well as vehicles. It provides a reference for research about V2G energy storage.
The main contributions of this research are as follows. (1) This paper proposes a car-following model with the acceleration generalized force coupled with external resistance. The dynamic characteristics of a car depend on the driving force and the external resistance. The model conforms to Newton’s second law and can reflect the dynamic physical processes of the following more accurately from the principle. This model takes into account the driver’s psychological motivation and driving dynamic characteristics. (2) In this research, a battery capacity decline model is established to investigate the characteristics of vehicle velocity, current and battery capacity in a vehicle platoon under different driving situations and different time and space. It also analyzes the degree of battery capacity decline in different situations and vehicles. This research has practical implications for the precise management of distributed energy storage that is considering decline.
The rest of this paper is organized as follows. In the “Vehicle model” section, a car-following model with the acceleration generalized force coupled with external resistance, and its linear stability is analyzed. After that, the velocities of the vehicles at different positions in the platoon following movement are calculated and analyzed for four different case parameters. In the “Operating Current simulation” section, based on the velocities data of different vehicles, the currents of the vehicles are calculated and analyzed by the electric vehicle simulation model. In the “Vehicle Battery Capacity Decline Analysis” section, the battery capacity decline of the vehicle at various positions under different driving situations is researched. Some conclusions are summarized in the “Conclusions” section. Figure 1 shows the main research methods of this paper.
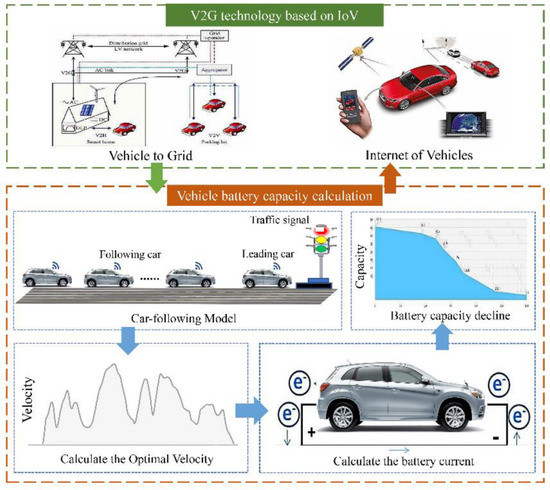
Figure 1.
Main research methods.
2. Vehicle Model
2.1. The Car-Following Model Considering the Influence of External Resistance
During the car-following process, the motion of a fuel or electric vehicle is the result of the combined effect of traction and resistance on the vehicles.
Traction force is mainly provided by the vehicle’s powertrain, which is related to the vehicle powertrain condition and the vehicle’s mass [43]. The resistance in vehicle movement is mainly divided into rolling resistance (), air resistance (), grade resistance () and acceleration resistance (). Among them, besides the vehicle’s mass, windward area, air resistance coefficient, wheel inertia and transmission ratio and other vehicles’ own influences, the external factors affecting the vehicle driving resistance are mainly related to the road conditions and road slope. Based on the balance of these forces, this paper proposes a car-following model with the acceleration generalized force coupled with external resistance. This model can calculate the velocities of vehicles in different driving situations and different platoon positions.
The car-following model considering the influence of external resistance is shown in Equation (1):
where is the velocity of the nth vehicle at moment t, is the headway of the i-th vehicle at moment t, is the driver reaction time constant , is the resistance coefficient of the vehicle, is the vehicle mass and represents the generalized force function. This is defined as shown in Equation (2):
where and are four parameters, the specific relevant parameters are defined as follows.
By expanding Equations (1) and (2), (3) and (4) are obtained as follows:
where is the driver’s reaction time constant, is the resistance coefficient of the vehicle, is the vehicle mass , is the rotating mass conversion factor of the vehicle , is the acceleration of gravity , is the rolling resistance coefficient, is the air resistance coefficient , is the windward area , is the air density and is the angle between the road surface and the horizontal plane.
By adjusting the parameter in the model, it could represent the magnitude of the effect of external resistances on the motion of the vehicle. The road surface situation is reflected as the value of the parameter in the model, and the rolling resistance coefficient of the vehicles varies for different road conditions. The coefficient in the model can represent the different slope magnitude of the road surface.
2.2. Linear Stability Analysis
This paper uses linear stability analysis to evaluate the stability performance of the model which is shown in Equation (1). Moreover, it is assumed that the traffic flow is always stable, all vehicles are uniformly distributed, and the headway time distance is (uniform), which corresponds to the optimal velocity .
Rewriting the car-following model (Equation (1)) into Equation (5):
where .
The position of the vehicle in the traffic flow is shown in Equation (6):
where is the position of the vehicle in the steady-state traffic flow, as expressed in Equation (7). is a small deviation value of the steady-state traffic flow , as expressed in Equation (8).
Substituting Equation (7) into Equation (6) and the result is shown in Equation (9),
and is shown in Equation (10).
Substituting Equation (6) into Equation (5) and the result is shown in Equation (11).
By substituting Equations (8) and (10) into Equation (11), Equation (12) is obtained.
Let be expressed as the Equation (13).
is shown in Equation (14).
Substituting Equations (13) and (14) into Equation (12), the result is shown in Equation (15).
Calculating Equation (15) yields the first-order as well as second-order term coefficients and for , the result is shown in Equations (16) and (17).
Let , then it will produce Equation (18).
By calculating Equation (18) and setting different values of the vehicle resistance coefficient , such as and , the diagram of the car-following model considering the influence of external resistance is obtained as Figure 2.
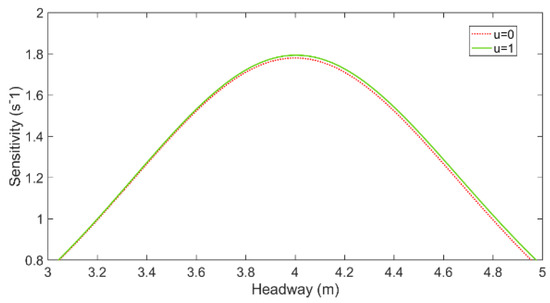
Figure 2.
The stability curves in headway−sensitivity space.
Figure 2 shows the phase space of the car-following model with the acceleration generalized force coupled with external resistance. From the figure, it can be obtained that as the vehicle resistance coefficient rises, the position of the stability curve will rise and the corresponding stability region will expand. It means that the stability of the traffic flow improves as the value of the drag coefficient increases.
2.3. Vehicle Velocities in Four Different Driving Situations
In this paper, according to the various resistance of the vehicles in driving, a car-following model with the acceleration generalized force coupled with external resistance is proposed. In the model (Equation (1)), the dynamic behavior of the vehicle depends mainly on the external resistance. The value of the resistance coefficient , can indicate the degree to which external resistance is taken into account in the movement of the vehicle. From Equation (1) as well as Figure 2, it can be obtained that the lower the value of the coefficient , the less external resistance is taken into account in the movement of the vehicle.
Additionally, the values of each of the resistance parameters can reflect the external resistance in different situations. Different road surface types (e.g., concrete road in good condition, mud road) have different rolling resistance parameters, so the model adjusts the rolling resistance parameter , to represent different road surface types. The model reflects different pavement slopes by changing the parameter of the slope angle.
Vehicle driving situation 1 is the standard situation. Situation 1 is expressed as: the road type is good asphalt or concrete pavement (rolling resistance coefficient ), horizontal road surface (angle ), and the degree of resistance consideration is normal (driving resistance coefficient ).
Vehicle driving situation 2 is expressed as: the road type is good asphalt or concrete road (rolling resistance coefficient ), the road is upslope (angle ), and the degree of resistance consideration is normal (driving resistance coefficient ).
Vehicle driving situation 3 is expressed as: the type of road surface is muddy dirt road (rolling resistance coefficient ), horizontal road surface (angle ), and the degree of resistance consideration is normal (driving resistance coefficient ).
Vehicle driving situation 4 is expressed as: the road type is good asphalt or concrete pavement (rolling resistance coefficient ), horizontal road surface (angle ), and the degree of resistance consideration is less (driving resistance coefficient ).
First, this paper defines the initial state of the vehicle platoon. The initial velocity of all vehicles is 0 m/s. The distance between the first vehicle in the platoon to the signal light (end point) is 1500 m. The headway between the rest of vehicles in the platoon is 8 m. The vehicles are driving on a straight road. Then, by adjusting the parameters , and in the car-following model, velocities of vehicles at different positions are calculated in four different situations. The vehicle velocities for situations 1–4 are shown in Figure 3, Figure 4, Figure 5 and Figure 6.
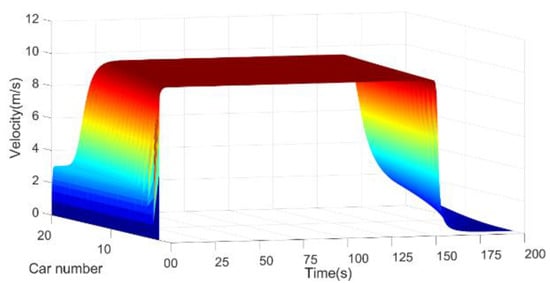
Figure 3.
Vehicle velocities in driving situation 1.
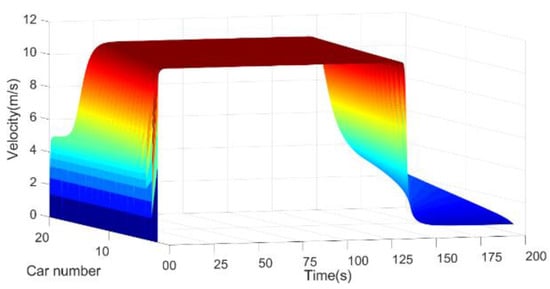
Figure 4.
Vehicle velocities in driving situation 2.
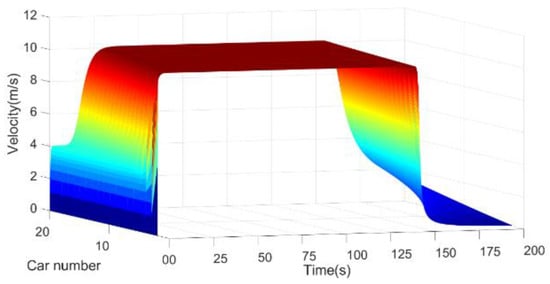
Figure 5.
Vehicle velocities in driving situation 3.
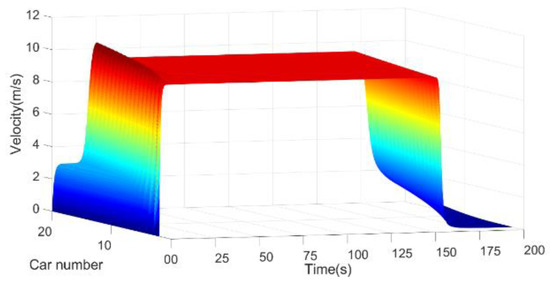
Figure 6.
Vehicle velocities in driving situation 4.
According to the vehicle dynamics model (Equation (1)), the maximum velocity of the vehicle is related to the headway and the external driving situations, different road situations and external resistance coefficients, which will affect the velocity fluctuation and maximum velocity situation of the vehicle platoon.
The vehicle needs to slow down until stopped before keeping a stable driving velocity to the end. Thus, the vehicle at the head of the platoon will be the first to slow down, and at this time, the headway of the vehicle at the end of the platoon will not immediately reduce, so the velocity of the vehicles at the end of the platoon does not reduce immediately. It takes some time from when the vehicle at the head of the platoon slows down until the vehicles at the end start to slow down. Thus, combined with the simulation results, the end of the platoon vehicles will start slowing down later than the head vehicles.
Figure 3 shows the velocities of the vehicle platoon in driving situation 1. It shows that the vehicles at the front of the platoon position increase their velocities to the stable velocity in a short time. On the contrary, the vehicles at the rear of the platoon will increase their velocities to a lower starting velocity at 3.02 m/s. The closer to the end of the vehicle platoon, the longer it will be driven at this lower starting velocity. Then, the velocity of the vehicle will be increased to the stable velocity at 9.46 m/s. After that, the vehicles at the front of the platoon begin to slow down at 156 s and reduce their velocities rapidly to 0 m/s. The slowdown time of the vehicles at the rear of the platoon is gradually delayed. The vehicle at the end of the platoon begins to slow down at 168 s. Furthermore, the deceleration process of the vehicles at the rear of the platoon is smoother.
Figure 4 shows the velocities of the vehicle platoon in driving situation 2. Different from driving situation 1, the vehicles in driving situation 2 have higher velocities. The starting velocity of the vehicles at the rear of the platoon is 4.96 m/s, and the stable velocity is 10.68 m/s. Furthermore, the moment when the vehicles begin to slow down is much earlier, the vehicles at the front of the platoon position begin to slow down at is 138 s, and the vehicle at the end of the platoon begins to slow down at 150 s.
Figure 5 shows the velocities of the vehicle platoon in driving situation 3. The starting and stable velocities of vehicles in situation 3 are between situation 1 and situation 2. The starting velocity of the vehicles at the rear of the platoon is 4.01 m/s, and the stable velocity is 10.1 m/s. Furthermore, the moments when the vehicles begin to slow down are also between situation 1 and 2. The vehicles at the front of the platoon position begin to slow down at 146 s, and the vehicle at the end of the platoon begins to slow down at 156 s.
Figure 6 shows the velocities of the vehicle platoon in driving situation 4. These vehicles have higher velocity fluctuations before they enter the stable velocity. The closer to the end of the vehicle platoon, the higher the velocity fluctuation. Moreover, the stable velocity of the whole vehicle platoon is essentially the same as that of the situation 1.
3. Operating Current Simulation
After calculating the velocities based on the car-following model proposed in 2.1, the vehicle current is calculated by an EV simulation model. Then we obtain the current variation of vehicles at different positions in four situations. The current is shown in Figure 7, Figure 8, Figure 9 and Figure 10.
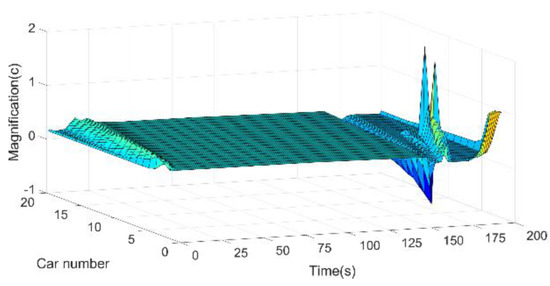
Figure 7.
Vehicle current in driving situation1.
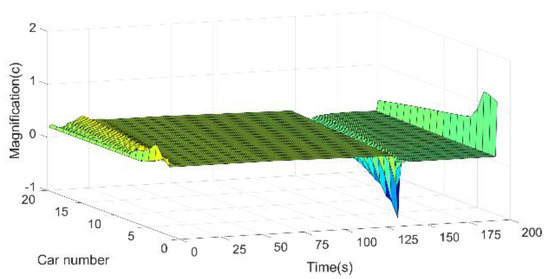
Figure 8.
Vehicle current in driving situation 2.
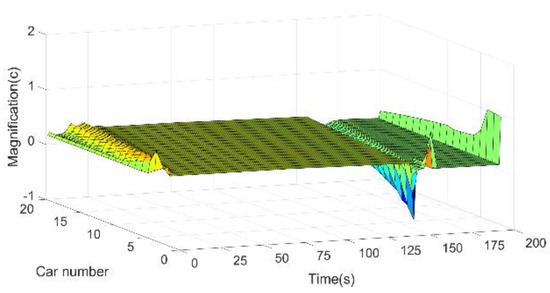
Figure 9.
Vehicle current in driving situation 3.
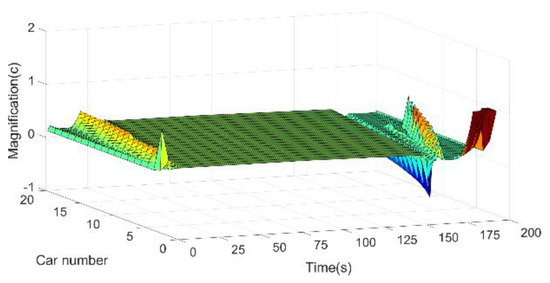
Figure 10.
Vehicle current in driving situation 4.
Figure 7, Figure 8, Figure 9 and Figure 10 show the current variation of the vehicles at different positions in the driving situations 1–4 for the vehicle platoon. From Figure 7, Figure 8, Figure 9 and Figure 10, it can be seen that the region where the current appears to fluctuate has a high consistency with the region where the velocities of the vehicles begin to fluctuate. It means that as the vehicle accelerates and decelerates, the current of the vehicle will change.
During the acceleration, the vehicles that have a higher number position in the platoon will have longer and smaller current fluctuations. As can be obtained from Figure 10, the more dramatic the degree of vehicle velocity change, the higher the magnitude of its current fluctuation. During the deceleration of the vehicle platoon, the closer to the front of the platoon, the higher the amplitude and magnitude of the current fluctuations.
As can be seen in Figure 7 and Figure 10, in situation 1 and situation 4, during their deceleration from a stable driving velocity to a stop, the current of the vehicles in the front to the middle position in the platoon is higher and unstable. The current of the vehicles at the end of the platoon is smaller and more stable.
4. Vehicle Battery Capacity Decline Analysis
4.1. Battery Capacity Decline Model
This paper proposes a battery capacity decline model which is based on the simplified electrochemical model [44] to analyze the battery capacity decline of electric vehicles [45].
Battery capacity decline is a complex process [46], which includes many different phenomena and conditions that vary with the chemistry properties of the battery [47]. Although there are many side reactions during this process, the side reactions can still be considered as a whole.
The lumped battery capacity decline rate is defined as the sum of all parasitic side-reaction currents that cause the battery capacity to decline [48]. According to the mathematical characteristics of the parasitic currents, a linear decline term is extended to consider various nonlinear effects in Equation (19).
where is the initial battery capacity, is a decline time constant, are decline factors corresponding to battery voltage, battery current, temperature and decline history, respectively.
High SOC values accelerate battery capacity decline, resulting from the high cell voltage generated by high SOC values. The parasitic side current is triggered by the battery voltage, which corresponds to an oxidation reaction at the positive terminal or a reduction reaction at the negative terminal. That is defined in Equation (20):
where is Faraday’s constant, are gas constant and temperature. The transfer coefficient and offset potential reflect the functional relationship between the parasitic reactions and the deviation of battery cell voltage from the average of open circuit voltage . When ignoring the concentration overpotential and the ohmic overpotential, the battery cell voltage is as shown in Equation (21).
where is the activation overpotential.
A current dependence linear relation between the capacity fade and the number of full cycles is defined in Equation (22).
where expresses the cycling induced capacity loss, and is the load current. A temperature dependence term is defined using an Arrhenius expression according to Equation (23).
where are activation energy and reference temperature. The decline rate slows down due to products formed by the parasitic reactions, which is calculated by Equation (24).
where is a constant to be determined.
The applied current satisfies the following Equation (25).
where J0 is the dimensionless charge exchange current, and I1C is the electric current at 1C rate.
To improve the calculation speed for real-time estimation, the prediction of decline rate is executed by training the numerical calculation results of the equations with a neural network (NN) structure (Equations (19)–(25)), which has three hidden layers with 14 neurons in each layer, with hyperbolic tangent activation functions, as shown in Equation (26).
where is the sets of trainable weights and biases.
4.2. Vehicle Battery Capacity Decline
According to the currents of vehicles in different situations and platoon positions, the battery capacity decline calculation model is proposed to obtain the corresponding battery capacity decline of different vehicles. The battery capacity decline of vehicles in different platoon positions in the four driving situations are shown in Figure 11, Figure 12, Figure 13 and Figure 14.
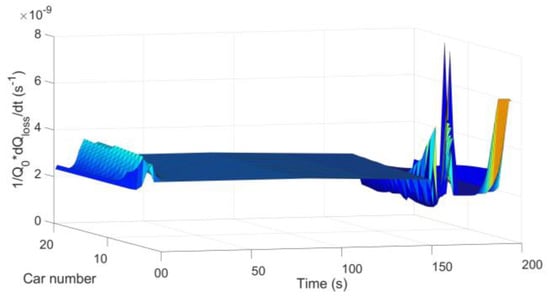
Figure 11.
Vehicle battery capacity decline in situation 1.
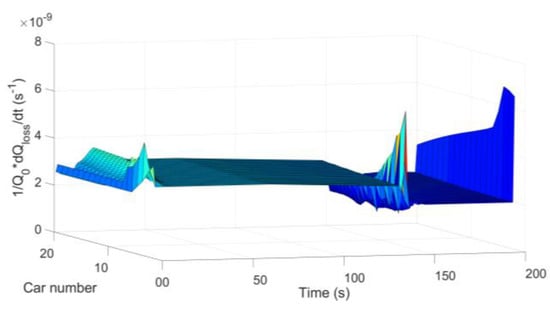
Figure 12.
Vehicle battery capacity decline in situation 2.
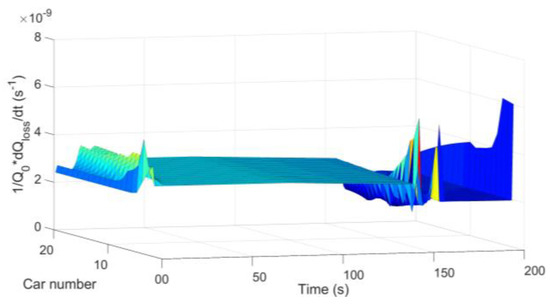
Figure 13.
Vehicle battery capacity decline in situation 3.
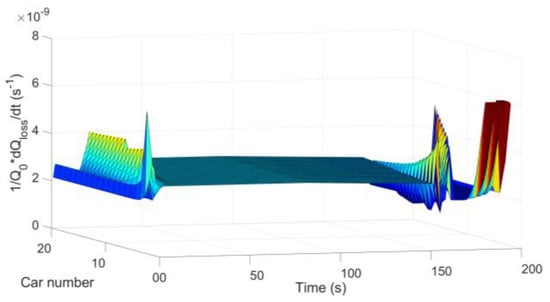
Figure 14.
Vehicle battery capacity decline in situation 4.
As can be seen from Figure 11, Figure 12, Figure 13 and Figure 14, the regions where the degree of battery capacity decline fluctuates are consistent with the regions where vehicle velocities and vehicle currents fluctuate. Vehicles at the end of the platoon have less battery capacity degradation. From Equation (18), Figure 2, it can be obtained that the vehicle platoon with less external resistance consideration has poor stability of motion. As can be seen from Figure 6, the vehicle platoon with less external resistance consideration, has a higher magnitude and fluctuation of velocity. From Figure 10, the velocity fluctuations will cause greater fluctuations in vehicle battery current. Finally, from Equation (26), it can be seen that the change in current magnitude will affect the degree of vehicle battery capacity decline. Thus, as shown in Figure 14, the vehicle platoon with less external resistance consideration, has a higher magnitude and fluctuation of battery capacity decline.
5. Conclusions
- (1)
- In this paper, a car-following model with the acceleration generalized force coupled with external resistance is proposed. The linear stability analysis is used to analyze the stability of the model. The stability of the traffic flow improves as the value of the resistance coefficient increases. Then, the effect of different physical characteristics of driving on the decline of distributed energy storage batteries in the IoV is investigated. The analytical results of the calculations and simulations are as follows. For situations 1–3, the vehicle that is closest to the end of the platoon position has a smaller and more stable vehicle velocity fluctuation. For situation 1, this vehicle has the lowest stable velocity, and the latest start of deceleration. For situation 2, this vehicle has the highest stable velocity, and the earliest start of deceleration. For situation 3, the stable velocity and the start of deceleration are between situations 1 and 2.
- (2)
- For situations 1–3, the vehicle that is closest to the end of the platoon position has a smaller and more stable vehicle current in the same situation. For situation 1 and 4, during their deceleration from a stable driving velocity to a stop, the current of the vehicles in the front to the middle position in the platoon is higher and unstable. The current of the vehicle at the end of the platoon is smaller and more stable.
- (3)
- For situations 1–3, the vehicle that is closest to the end of the platoon position has a smaller and more stable vehicle battery capacity decline in the same situation. The regions where the degree of battery capacity decline fluctuates are consistent with the regions where vehicle velocities and vehicle currents fluctuate.
- (4)
- Compared to the other three situations, the vehicle platoon with less influence of external resistance has a higher magnitude and fluctuation of velocity, current and battery capacity decline. Moreover, its stability is worse.
As the number of new energy vehicles grows, the power demand for unordered charging is more than twice the power for ordered charging, which will burden the city’s power infrastructure, and V2G technology will alleviate or even reduce the power demand by peak shaving and valley filling.
Energy storage is the key to the energy revolution, batteries and electric vehicles are the best carriers of distributed energy storage. These distributed energy sources will be connected through V2G technology to form an energy interconnection.
Future works will investigate the relationship between distributed energy storage and various factors such as temperature, humidity and air pressure. This is an important reference for the development of distributed energy storage and the selection of energy interaction strategies.
Author Contributions
Writing—Original Draft, Y.G. and H.L.; Writing—Review and Editing, Y.G., F.Y., H.L., X.Z., L.Q. and Y.L.; Research Conception and Design, Y.G.; Data Provision and Integration, H.L.; Funding Acquisition, F.Y. All authors have read and agreed to the published version of the manuscript.
Funding
This research was funded by the Natural Science Foundation of Shandong Province, grant number [ZR2019MEE029].
Institutional Review Board Statement
Not applicable.
Informed Consent Statement
Not applicable.
Data Availability Statement
The data presented in this study are available on request from the corresponding author.
Conflicts of Interest
The authors declare no conflict of interest.
References
- Guo, C.; Zhu, K.; Chen, C.; Xiao, X. Characteristics and effect laws of the large-scale electric Vehicle’s charging load. eTransportation 2020, 3, 100049. [Google Scholar] [CrossRef]
- Jian, L.; Yongqiang, Z.; Larsen, G.N.; Snartum, A. Implications of road transport electrification: A long-term scenario-dependent analysis in China. eTransportation 2020, 6, 100072. [Google Scholar] [CrossRef]
- Darcovich, K.; Recoskie, S.; Ribberink, H.; Michelet, C. The impact of V2X service under local climatic conditions within Canada on EV durability. eTransportation 2021, 9, 100124. [Google Scholar] [CrossRef]
- Dixon, J.; Bell, K. Electric vehicles: Battery capacity, charger power, access to charging and the impacts on distribution networks. eTransportation 2020, 4, 100059. [Google Scholar] [CrossRef]
- Darcovich, K.; Laurent, T.; Ribberink, H. Improved prospects for V2X with longer range 2nd generation electric vehicles. eTransportation 2020, 6, 100085. [Google Scholar] [CrossRef]
- Hofmann, M.; Schäfer, M.; Ackva, A. Bi-directional charging system for electric vehicles: A V2G concept for charging and discharging electric vehicles. In Proceedings of the 2014 4th International Electric Drives Production Conference (EDPC), Nuremberg, Germany, 30 September–1 October 2014; IEEE: Piscataway, NJ, USA, 2014; pp. 1–5. [Google Scholar]
- İnci, M.; Büyük, M.; Savrun, M.M.; Demir, M.H. Design and analysis of fuel cell vehicle-to-grid (FCV2G) system with high voltage conversion interface for sustainable energy production. Sustain. Cities Soc. 2021, 67, 102753. [Google Scholar] [CrossRef]
- Lund, H.; Kempton, W. Integration of renewable energy into the transport and electricity sectors through V2G. Energy Policy 2008, 36, 3578–3587. [Google Scholar] [CrossRef]
- Madawala, U.K.; Thrimawithana, D.J. A bidirectional inductive power interface for electric vehicles in V2G systems. IEEE Trans. Ind. Electron. 2011, 58, 4789–4796. [Google Scholar] [CrossRef]
- Kisacikoglu, M.C.; Kesler, M.; Tolbert, L.M. Single-phase on-board bidirectional PEV charger for V2G reactive power operation. IEEE Trans. Smart Grid 2014, 6, 767–775. [Google Scholar] [CrossRef]
- Hosseini, S.S.; Badri, A.; Parvania, M. The plug-in electric vehicles for power system applications: The vehicle to grid (V2G) concept. In Proceedings of the 2012 IEEE International Energy Conference and Exhibition (ENERGYCON), Florence, Italy, 9–12 September 2012; IEEE: Piscataway, NJ, USA, 2012; pp. 1101–1106. [Google Scholar]
- Kumar, K.N.; Sivaneasan, B.; Cheah, P.H.; So, P.L.; Wang, D.Z. V2G capacity estimation using dynamic EV scheduling. IEEE Trans. Smart Grid 2013, 5, 1051–1060. [Google Scholar] [CrossRef]
- Sami, I.; Ullah, Z.; Salman, K.; Hussain, I.; Ali, S.M.; Khan, B.; Mehmood, C.A.; Farid, U. A bidirectional interactive electric vehicles operation modes: Vehicle-to-grid (V2G) and grid-to-vehicle (G2V) variations within smart grid. In Proceedings of the 2019 International Conference on Engineering and Emerging Technologies (ICEET), Lahore, Pakistan, 21–22 February 2019; IEEE: Piscataway, NJ, USA, 2019; pp. 1–6. [Google Scholar]
- Shumei, C.; Xiaofei, L.; Dewen, T.; Qianfan, Z.; Liwei, S. The construction and simulation of V2G system in micro-grid. In Proceedings of the 2011 International Conference on Electrical Machines and Systems, Beijing, China, 20–23 August 2011; IEEE: Piscataway, NJ, USA, 2011; pp. 1–4. [Google Scholar]
- Shi, R.; Li, S.; Zhang, P.; Lee, K.Y. Integration of renewable energy sources and electric vehicles in V2G network with adjustable robust optimization. Renew. Energy 2020, 153, 1067–1080. [Google Scholar] [CrossRef]
- Mendes, P.R.; Isorna, L.V.; Bordons, C.; Normey-Rico, J.E. Energy management of an experimental microgrid coupled to a V2G system. J. Power Sources 2016, 327, 702–713. [Google Scholar] [CrossRef]
- Baloglu, U.B.; Demir, Y. Economic analysis of hybrid renewable energy systems with V2G integration considering battery life. Energy Procedia 2017, 107, 242–247. [Google Scholar] [CrossRef]
- Gough, R.; Dickerson, C.; Rowley, P.; Walsh, C. Vehicle-to-grid feasibility: A techno-economic analysis of EV-based energy storage. Appl. Energy 2017, 192, 12–23. [Google Scholar] [CrossRef]
- Peng, C.; Zou, J.; Lian, L.; Li, L. An optimal dispatching strategy for V2G aggregator participating in supplementary frequency regulation considering EV driving demand and aggregator’s benefits. Appl. Energy 2017, 190, 591–599. [Google Scholar] [CrossRef]
- Kempton, W.; Udo, V.; Huber, K.; Komara, K.; Letendre, S.; Baker, S.; Brunner, D.; Pearre, N. A test of vehicle-to-grid (V2G) for energy storage and frequency regulation in the PJM system. Results Ind. Univ. Res. Partnersh. 2008, 32, 1–32. [Google Scholar]
- Han, S.; Han, S.; Sezaki, K. Estimation of achievable power capacity from plug-in electric vehicles for V2G frequency regulation: Case studies for market participation. IEEE Trans. Smart Grid 2011, 2, 632–641. [Google Scholar] [CrossRef]
- Han, S.; Han, S. Economic feasibility of V2G frequency regulation in consideration of battery wear. Energies 2013, 6, 748–765. [Google Scholar] [CrossRef]
- Sufyan, M.; Rahim, N.A.; Muhammad, M.A.; Tan, C.K.; Raihan, S.R.S.; Bakar, A.H.A. Charge coordination and battery lifecycle analysis of electric vehicles with V2G implementation. Electric Power Syst. Res. 2020, 184, 106307. [Google Scholar] [CrossRef]
- Ota, Y.; Taniguchi, H.; Nakajima, T.; Liyanage, K.M.; Baba, J.; Yokoyama, A. Autonomous distributed V2G (vehicle-to-grid) considering charging request and battery condition. In Proceedings of the 2010 IEEE PES Innovative Smart Grid Technologies Conference Europe (ISGT Europe), Gothenburg, Sweden, 11–13 October 2010; IEEE: Piscataway, NJ, USA, 2010; pp. 1–6. [Google Scholar]
- Liang, H.; Choi, B.J.; Zhuang, W.; Shen, X. Optimizing the energy delivery via V2G systems based on stochastic inventory theory. IEEE Trans. Smart Grid 2013, 4, 2230–2243. [Google Scholar] [CrossRef]
- Koufakis, A.M.; Rigas, E.S.; Bassiliades, N.; Ramchurn, S.D. Towards an optimal EV charging scheduling scheme with V2G and V2V energy transfer. In Proceedings of the 2016 IEEE International Conference on Smart Grid Communications (SmartGridComm), Sydney, NSW, Australia, 6–9 November 2016; IEEE: Piscataway, NJ, USA, 2016; pp. 302–307. [Google Scholar]
- Hussain, W.; Malik, H.; Hussain, R.A.; Hussain, H.; Green, I.R.; Marwat, S.; Bahadur, A.; Iqbal, S.; Farooq, M.U.; Li, H.; et al. Synthesis of MnS from single-and multi-source precursors for photocatalytic and battery applications. J. Electron. Mater. 2019, 48, 2278–2288. [Google Scholar] [CrossRef]
- Bahadur, A.; Iqbal, S.; Shoaib, M.; Saeed, A. Electrochemical study of specially designed graphene-Fe 3 O 4-polyaniline nanocomposite as a high-performance anode for lithium-ion battery. Dalton Trans. 2018, 47, 15031–15037. [Google Scholar] [CrossRef] [PubMed]
- Uddin, K.; Jackson, T.; Widanage, W.D.; Chouchelamane, G.; Jennings, P.A.; Marco, J. On the possibility of extending the lifetime of lithium-ion batteries through optimal V2G facilitated by an integrated vehicle and smart-grid system. Energy 2017, 133, 710–722. [Google Scholar] [CrossRef]
- Lunz, B.; Yan, Z.; Gerschler, J.B.; Sauer, D.U. Influence of plug-in hybrid electric vehicle charging strategies on charging and battery degradation costs. Energy Policy 2012, 46, 511–519. [Google Scholar] [CrossRef]
- Jafari, M.; Kavousi-Fard, A.; Niknam, T.; Avatefipour, O. Stochastic synergies of urban transportation system and smart grid in smart cities considering V2G and V2S concepts. Energy 2021, 215, 119054. [Google Scholar] [CrossRef]
- Bhoir, S.; Caliandro, P.; Brivio, C. Impact of V2G service provision on battery life. J. Energy Storage 2021, 44, 103178. [Google Scholar] [CrossRef]
- Ota, Y.; Taniguchi, H.; Nakajima, T.; Liyanage, K.M.; Baba, J.; Yokoyama, A. Autonomous distributed V2G (vehicle-to-grid) satisfying scheduled charging. IEEE Trans. Smart Grid 2011, 3, 559–564. [Google Scholar] [CrossRef]
- Zhou, C.; Qian, K.; Allan, M.; Zhou, W. Modeling of the cost of EV battery wear due to V2G application in power systems. IEEE Trans. Energy Convers. 2011, 26, 1041–1050. [Google Scholar] [CrossRef]
- Bishop, J.D.; Axon, C.J.; Bonilla, D.; Tran, M.; Banister, D.; McCulloch, M.D. Evaluating the impact of V2G services on the degradation of batteries in PHEV and EV. Appl. Energy 2013, 111, 206–218. [Google Scholar] [CrossRef]
- Li, S.; Li, J.; Su, C.; Yang, Q. Optimization of bi-directional V2G behavior with active battery anti-aging scheduling. IEEE Access 2020, 8, 11186–11196. [Google Scholar] [CrossRef]
- Ahmadian, A.; Sedghi, M.; Mohammadi-Ivatloo, B.; Elkamel, A.; Golkar, M.A.; Fowler, M. Cost-benefit analysis of V2G implementation in distribution networks considering PEVs battery degradation. IEEE Trans. Sustain. Energy 2017, 9, 961–970. [Google Scholar] [CrossRef]
- Thirugnanam, K.; Ezhil Reena Joy, T.P.; Singh, M.; Kumar, P. Mathematical modeling of Li-ion battery using genetic algorithm approach for V2G applications. IEEE Trans. Energy Convers. 2014, 29, 332–343. [Google Scholar]
- Thingvad, A.; Calearo, L.; Andersen, P.B.; Marinelli, M. Empirical capacity measurements of electric vehicles subject to battery degradation from v2g services. IEEE Trans. Veh. Technol. 2021, 70, 7547–7557. [Google Scholar] [CrossRef]
- Li, Y.; Gao, X.; Qin, Y.; Du, J.; Guo, D.; Feng, X.; Lu, L.; Han, X.; Ouyang, M. Drive circuitry of an electric vehicle enabling rapid heating of the battery pack at low temperatures. iScience 2021, 24, 101921. [Google Scholar] [CrossRef] [PubMed]
- Li, Y.; Feng, X.; Ren, D.; Ouyang, M.; Lu, L.; Han, X. Thermal runaway triggered by plated lithium on the anode after fast charging. ACS Appl. Mater. Interfaces 2019, 11, 46839–46850. [Google Scholar] [CrossRef]
- Yang, X.G.; Leng, Y.; Zhang, G.; Ge, S.; Wang, C.Y. Modeling of lithium plating induced aging of lithium-ion batteries: Transition from linear to nonlinear aging. J. Power Sources 2017, 360, 28–40. [Google Scholar] [CrossRef]
- Liu, J.; Wang, Z.; Hou, Y.; Qu, C.; Hong, J.; Lin, N. Data-driven energy management and velocity prediction for four-wheel-independent-driving electric vehicles. eTransportation 2021, 9, 100119. [Google Scholar] [CrossRef]
- COMSOL. Battery Design Module User’s Guide; COMSOL Co.: Stockholm, Sweden, 2020. [Google Scholar]
- Yanfei, G.; Shichun, Y.; Xibo, W.; Wei, L.; Qinggao, H.; Qin, C. Cyber Hierarchy Multiscale Integrated Energy Management of Intelligent Hybrid Electric Vehicles. J. Automotive Innovation 2022, 1–15. [Google Scholar]
- Jiaming, Z.; Chunxiao, F.; Qingqing, S.; Shangfeng, J.; Zhixian, F.; Jiageng, R.; Shikai, S.; Leli, H. The Multi-Objective Optimization of Powertrain Design and Energy Management Strategy for Fuel Cell–Battery Electric Vehicle. Sustainability 2022, 14, 6320. [Google Scholar] [CrossRef]
- López-Ibarra, J.A.; Goitia-Zabaleta, N.; Herrera, V.I.; Camblong, H. Battery aging conscious intelligent energy management strategy and sensitivity analysis of the critical factors for plug-in hybrid electric buses. eTransportation 2020, 5, 100061. [Google Scholar] [CrossRef]
- Su, L.; Wu, M.; Li, Z.; Zhang, J. Cycle life prediction of lithium-ion batteries based on data-driven methods. eTransportation 2021, 10, 100137. [Google Scholar] [CrossRef]
Publisher’s Note: MDPI stays neutral with regard to jurisdictional claims in published maps and institutional affiliations. |
© 2022 by the authors. Licensee MDPI, Basel, Switzerland. This article is an open access article distributed under the terms and conditions of the Creative Commons Attribution (CC BY) license (https://creativecommons.org/licenses/by/4.0/).