Article

Correlation between Lithium Titanium Oxide Powder Morphology and High Rate Performance in Lithium-Ion Batteries

by
Hermes A. Llaín-Jiménez
1,
Dominika A. Buchberger
1,
Magdalena Winkowska-Struzik
2,*,
Maciej Ratyński
1,
Michał Krajewski
1,
Maciej Boczar
1,
Bartosz Hamankiewicz
1,* and
Andrzej Czerwiński
1,*
1
Faculty of Chemistry, University of Warsaw, ul. Ludwika Pasteura 1, 02-093 Warsaw, Poland
2
Łukasiewicz-Institute of Microelectronics and Photonics, al. Lotników 32/46, 02-668 Warsaw, Poland
*
Authors to whom correspondence should be addressed.
Batteries 2022, 8(10), 168; https://doi.org/10.3390/batteries8100168
Submission received: 14 July 2022 / Revised: 29 August 2022 / Accepted: 19 September 2022 / Published: 8 October 2022
(This article belongs to the Special Issue Li-Ion Battery Materials: Latest Advances and Prospects)

Abstract

:
This study determined the measurable factor responsible for the high rate performance of lithium titanium oxide (Li4Ti5O12, LTO) powders in lithium-ion batteries. The structural and morphological properties of various Li4Ti5O12 materials and their correlation with electrochemical performance were analysed. The results showed that there was a strong correlation between high capacity retention at 10 C and the specific surface area. Other electrochemical and structural factors, such as the crystal size and pore structure, were not correlated with 10 C performance. We found that an increase in the specific surface area of Li4Ti5O12 above c.a. 15 m2 g−1 neither improved the high rate capacity retention nor its specific discharge capacity at high current rates. We also showed that the sol–gel synthesized lithium titanium oxide powders could retain similar or higher discharge specific capacities than materials synthesized via more complex routes.

Graphical Abstract

1. Introduction

The mobile electronic and electric vehicle industries are constantly growing, and even small improvements in active material properties can bring significant benefits to both fields [1].
Commercial lithium-ion batteries (LIBs) typically contain graphite as a negative electrode material, in which the electrochemical activity comes from the intercalation of Li+ between the adjacent graphitic layers [2], reaching theoretical specific capacity of 372 mAh g−1 [3]. Despite its many advantages, graphite suffers from degradation [2,4] and a limited capacity during high-rate operation [5]. The moderate capacity of graphitic electrodes originates from solid electrolyte interphase (SEI) formation, which greatly increases the resistance of the electrode [2,3]. Some safety concerns are also related to the high possibility of lithium metal plating during the fast lithiation of graphite-based electrodes. Because of these drawbacks, extensive research on new substitute materials for negative electrodes is underway. Among the various intercalation and insertion materials, lithium titanium oxide (Li4Ti5O12, LTO) is considered as a safe, “zero-strain” compound, since its volume changes are less than 1% during the lithium insertion/extraction processes [6,7]. This results in better cycle life [8,9] and higher mechanical stability than graphite and other materials that suffer from much higher volume changes [2,10,11,12].
Lithium titanium oxide has a theoretical capacity of 175 mAh g−1 when operating in a potential range from 1 to 3 V vs. Li/Li+ [13,14]. A high working potential ensures no metallic lithium plating during battery overcharge, and very limited solid electrolyte interphase (SEI) formation [15]. Traces of an SEI have been identified on the LTO surface, originating from partial electrolyte degradation; however, its thickness (<10 nm) and resistance are significantly smaller than those of the SEI formed on graphite electrodes [16]. These factors warrant a significantly longer cycle life of LTO in comparison to graphite [16,17]. In addition, its high operating potential allows the use of aluminium foil as a current collector, which is cheaper and lighter than copper foil, which must be utilized for graphitic electrodes [18].
The major disadvantage of lithium titanium oxide is its poor electrical conductivity (<10−13 S cm−1) [15]. Several attempts have been made to further improve the performance of Li4Ti5O12, including doping [19,20,21], coating [22,23,24,25,26], particle engineering [27,28,29], or the modification of synthesis procedures [30,31,32,33,34,35]. Some of these approaches deliver materials with better capacity retention at a higher C-rate; however, many are expensive or relatively slow, and thus unfavourable for commercial application.
Pohjalainen et al. [36] studied the influence of LTO particle size on its electrochemical performance. Two groups of samples, obtained by solid state synthesis, were considered, corresponding to high (22 m2 g−1) and low (7 m2 g−1) specific surface areas (SSAs). A better capacity retention was found for the high-SSA material (about 80%), while the low-SSA material retained 70% of its initial capacity when operating at 10 C.
A very successful sol–gel synthesis pathway was reported by Kuo et al. [37]. The obtained LTO material had a specific capacity (at 10 C) of 147 and 153 mAh g−1 for pristine and carbon-coated materials, representing up to 89% and 93% of the 1 C capacity, respectively. Gaberscek et al. [38] showed that a decrease in particle size can be more beneficial than carbon coating. Smaller particles have a bigger specific surface area and lower electrical resistance at the grain boundaries. It is possible that the results obtained by Kuo et al. could be further improved by further decreasing the particle size.
Nanosized LTO has a higher capacity and better rate performance [39]; however, its production is expensive. Therefore, a balance point must be found between the performance and cost of the final material. An optimal particle size should exist depending on the desired operation rate, as mentioned by Kashkooli et al. [40].
Data from the literature on low current rate (1 C) and high current rate capacities (10 C) as a function of specific surface area (Figure 1a,b), crystal and particle sizes (Figure 1c–f), and electrode mass loading (Figure 1g,h) are presented in Figure 1. It can be seen that the general relation of structural/morphological parameters and specific capacity is hardly recognisable, suggesting a deeper investigation is needed in this field. Table S1 (Supporting Information) presents the experimental procedures in detail, and the results are presented in Figure 1.
The synthesis route can be responsible for the presence of aggregates and varying particle distribution, leading to differences in electrochemical properties. Solid state synthesis usually produces larger particles and LTO aggregates, whereas sol–gel synthesis generally results in materials with a more homogenous dispersion of particles, which is expected to provide better electrochemical performance. The direct solid-state synthesis is usually cheaper and less time consuming compared to sol–gel, leading to the necessity of balancing the material price and performance.
In this study, we investigated the relationship between the synthesis conditions, morphology, specific surface area, and high electrochemical performance of Li4Ti5O12 obtained via the sol–gel method. Our goal was to determine which parameter was the most relevant to LTO performance at high current rates. The obtained results revealed a clear dependency between the specific surface area of the LTO powder and the high rate performance, reaching a capacity retention of over 90% for discharge at 10 C. Our results and data from the literature indicate that increasing the specific surface area above a certain value does not improve the material’s performance, but rather makes its synthesis more complex and expensive; in addition, it might favour secondary reactions, decreasing the cycle life of the material. To the best of our knowledge, there are no reports in the literature reporting a detailed study on the influence of surface area on electrochemical performance at high rates.

2. Materials and Methods

2.1. Synthesis of Li4Ti5O12 Powders

Lithium titanium oxide powders were synthesized via a modified sol–gel method using titanium n-butoxide (TBT, >97% purum, Sigma-Aldrich, Burghausen, Germany), lithium acetate dihydrate (LiAc, bioXtra, Sigma-Aldrich, Bangalore, India), and citric acid monohydrate (CA, ppa, POCH, Gliwice, Poland) as a complexing agent. The molar ratio of Li:Ti:CA was 4:5:2.5. First, 7.4101 g of TBT was added slowly to 250 mL of ethyl alcohol (EtOH, 96%, Linegal Chemicals Sp. z o.o., Warsaw, Poland) at room temperature (RT) under magnetic stirring. The solution instantly turned milky white due to the precipitation of Ti(OH)4 (Sol-1, 0.0871 M) [41]. A total of 1.8705 g of LiAc was dissolved in 100 mL of EtOH at RT, which, after complete dissolution, was added to Sol-1, forming Sol-2 (0.1146 M). Sol-3, consisting of 0.2179 M citric acid in EtOH, was placed in a round-bottom reactor and heated to 70 °C. Then, Sol-2 was added to Sol-3 and left under magnetic stirring for several hours. The obtained creamy-white mixture was then left for EtOH evaporation during continuous stirring. The remaining fine, white powder was collected and dried overnight in vacuum at 120 °C and then heat-treated in the muffle furnace at 350 °C for 2 h and at 700 °C for 12 h in air. Four different samples were obtained, which differed in precursor addition rate: (1) Sol-2 added gradually in equal portions to Sol-3 within 45 min; (2) Sol-2 added quickly to Sol-3 within 3 min in continuous flow; (3) Sol-2 added slowly to Sol-3 within 45 min in continuous flow; and (4) Sol-2 added quickly to Sol-3 within 3 min in continuous flow with a total molar solution concentration three times higher. The samples were labelled S1, S2, S3, and S4, respectively.

2.2. X-ray Powder Diffraction and Raman Spectroscopy

The structural characterization was performed using X-ray diffractometry. The diffraction pattern of the powdered sample was recorded by a SuperNova Double Source Rigaku Oxford diffractometer (Tokyo, Japan) using a non-monochromatic Cu Kα radiation source (λ = 1.542 Å) with a step size of 0.02° in a 2θ range of 10°–80°. The determination of phase composition and crystal size was completed using the Match!® software (Crystal Impact, Bonn, Germany) and Scherrer formula, while the unit cell parameters were determined using Rietveld refinement (FullProf software, Toulouse, France). The reference diffraction patterns were modelled using the Vesta® software (Tokyo, Japan).
The local structural ordering was studied using Raman spectroscopy. Raman spectra were recorded using a Renishaw inVia confocal Raman microscope (London, UK) system with a frequency doubled Nd:YAG laser (wavelength: 532 nm) of maximum power 3.5 mW on the sample. In order to avoid any possible laser-induced thermal heating of the samples, the laser power was significantly reduced.

2.3. Scanning Electron Microscopy and N2 Adsorption/Desorption

To determine the aggregation and morphology of the particles, Li4Ti5O12 powders were analysed via scanning electron microscopy (SEM). A Merlin scanning electron microscope (Zeiss, Jena, Germany) was used together with a Quantax 400 energy dispersive X-ray spectroscope (Bruker, Billerica, MA, USA) with 3 keV electron beam energy.
The N2 adsorption/desorption experiments were conducted using a Micromeritics® ASAP 2060 apparatus (Norcross, GA 30093, USA) at an absolute temperature of 77.349 K and a relative pressure range of 0.01–0.995 p(p0)−1. The adsorption/desorption isotherm analysis was performed with the ASAP 2060 software by calculating the specific surface area using the BET method and the distribution of the pores and their volumes using the BJH approach for desorption curves. Moreover, the average grain sizes of the examined powders were also estimated, taking into account the density of Li4Ti5O12 (3.5 g cm−3).

2.4. Electrochemistry

Lithium titanium oxide powder was ground together with Vulcan® XC72R (Cabot, Bristol, UK) conductive carbon in an agate mortar to obtain a homogeneous mixture, which was transferred to a vial before a 5 wt.% solution of polyvinylidene fluoride (PVDF, Alfa Aesar, St. Louis, MA, USA) in N-methyl-2-pyrrolidone (NMP, anhydrous, 99.5%, Sigma-Aldrich, Burghausen, Germany) was added dropwise. The weight ratio of Li4Ti5O12:Vulcan®:PVDF was 8:1:1. Afterwards, the vial was placed on a magnetic stirrer and blended for 4 h. The obtained slurry was coated onto aluminium foil using the doctor blade technique. After preliminary drying at 55 °C in air, the foil was transferred to a vacuum oven and dried at 120 °C overnight. Then, disks 9 mm in diameter were cut from the foil, isostatically compressed under 6 t pressure for 1 min, weighed, and dried in a vacuum oven at 120 °C overnight. The electrodes were then transferred to an argon-filled glovebox (MBraun LABstar, Garching, Germany) for cell manufacturing.
Electrochemical measurements were carried out in three-electrode Swagelok®-type cells. The counter and reference electrodes were made of metallic lithium foil (Sigma-Aldrich). Celgard® 2325 (USA) was used as a separator and 1M LiPF6 in ethylene carbonate/dimethyl carbonate (1:1, vol., battery grade, Sigma-Aldrich, St. Louis, MA, USA) was used as an electrolyte. The chronopotentiometry (CP) experiments were carried out using a multichannel battery tester ATLAS 1361 (Sollich, Nowy Sącz, Poland). Every examined cell was preliminarily discharged at a current rate of 0.1 C (where 1 C corresponds to 175 mA g−1). Then, the cells were charged at a constant current rate of 1 C and discharged at consecutive 1, 2, 5, 10, and 1 C current rates for five cycles each. All the cells were cycled in the potential window of 1.00 to 3.00 V (vs. Li+/Li0).

2.5. Reference Samples

All experimental techniques were also applied to commercial lithium titanium oxide samples (Com), which were used as a reference point.

3. Results

3.1. Structural Analysis of LTO Materials

The phase composition and crystal size were confirmed using the X-ray diffraction method. Figure 2 presents the XRD patterns of both the synthesized and commercial samples, along with theoretical spinel and rutile patterns as a reference. Diffraction peaks were identified with the expected spinel phase (Fd 3 ¯ m space group) for all LTO materials: samples S1–S3 were of very high purity, whereas small traces of rutile were identified in sample S4. The commercial LTO (Com) also showed minor rutile phase impurities together with LiTiO2. The sum of all impurities was below 2.5% in those samples. The lattice parameters, composition of samples, and average crystallite sizes were calculated based on the XRD patterns; the results are shown in Table 1. The a lattice parameter was the same for all measured materials and reached ~8.358 Å. The average crystal size of the LTO samples calculated using the Scherrer equation was in the range of 140–150 nm; the Com LTO presented a crystal size that was twice as large.
Raman spectroscopy measurements were applied for local structural analysis. Five active Raman phonon modes could be well distinguished in the normalized spectra displayed in Figure 3. These Raman lines correspond to the expected typical Li4/3Me5/3O4 spinel structure. The A1g phonon mode was assigned to a strong band at 672 cm−1 with a shoulder around 741 cm−1 (width: 100 cm−1). This mode corresponds to the stretching vibration of the Ti-O bond in the TiO6 octahedra [41,75,76]. The Eg stretching vibrational mode corresponds to the Raman line at 421 cm−1, generated by the Li-O ionic bond of the LiO4 tetrahedra [41,75,76]. The last three F2g phonon modes at approximately 230, 265, and 350 cm−1 represent Li octahedrally coordinated by oxygen [75]. All five active Raman lines had an average width of ca. 46 cm−1, characteristic of good crystal quality. Samples S4 and Com showed additional lines in the spectra (shown by asterisks). These additional features correspond to the rutile phase impurities (also detected by XRD). The recorded signals of the rutile phase were weak due to overlapping with stronger lines originating from the LTO structure.
Similar to the XRD findings, the Raman analysis showed that, in general, the crystal quality of all samples was equal. This suggests that the crystal and local structures of all measured materials were very similar to each other, and any observed electrochemical performance variations originated only from LTO particle differences.

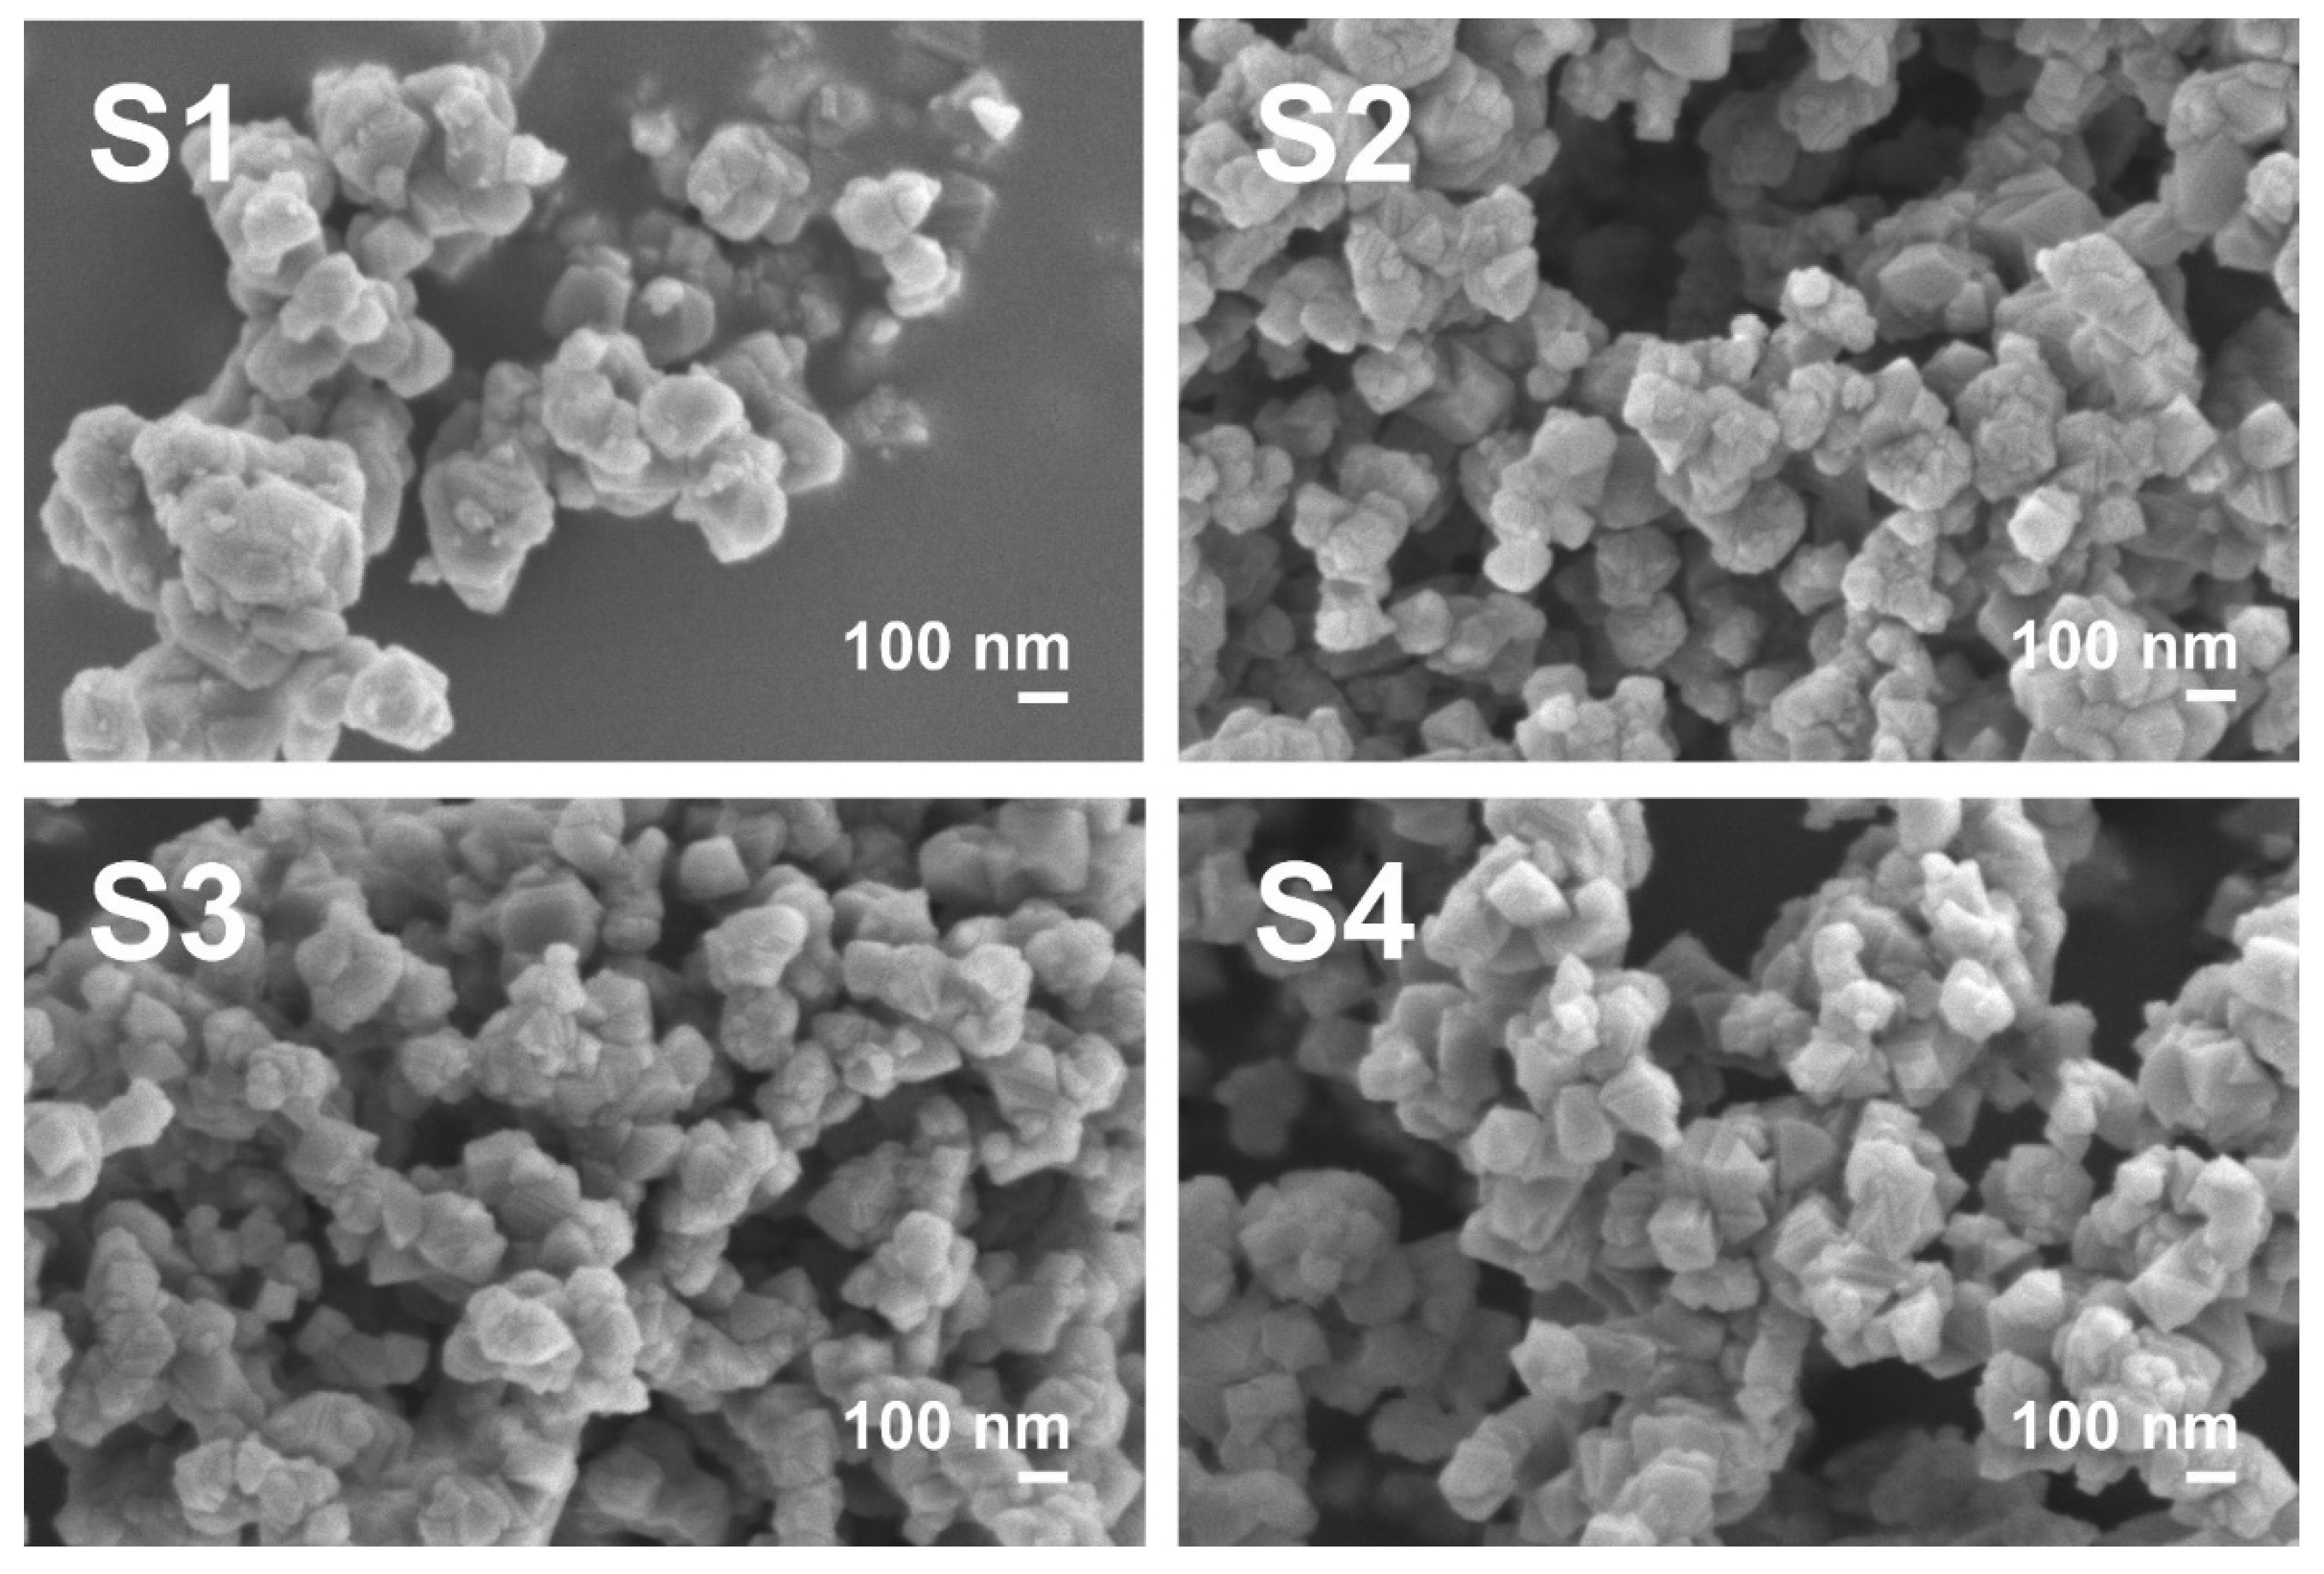
3.2. Morphological Analysis

SEM imaging was used to observe the morphology of all LTO samples; the results are presented in Figure 4. The commercial LTO SEM images can be found in Figure S1 (Supplementary Materials). The LTO samples S1–S4 were similar, displaying a cube-like morphology with well-developed surface facets (suggesting that the (111) plane made the most energetically stable surface facet in the material synthesized through our modified sol–gel method). The approximate LTO particle size for samples S1–S4 was between 100 and 200 nm, with an average of ~150 nm, which is in a good agreement with the XRD results for the average crystal size of these materials (additional images at lower magnification can be found in Figure S1); thus, the agglomerates consisted of interconnected crystallites (grains). The Com LTO sample also displayed a cube-like morphology, although it showed a non-uniform crystallite size. There were crystallites of various sizes, and some of them were even above 400 nm. Well-developed crystallite facets were visible in addition to well-defined interconnected crystallites (grains), showing a polycrystalline nature of bigger agglomerates. This could be an explanation of why the average XRD crystal size was about 315 nm while a particle size above 400 nm was observed in SEM. The difference in grain size and agglomeration degree could be a consequence of the synthesis method. The sol–gel method is known for its ability to obtain smaller particles and favour a less disperse particle size profile than, for example, solid-state synthesis routes [37].
To determine the specific surface area and pore size distribution, the N2 adsorption/desorption isotherms of Li4Ti5O12 powders were examined (Figure S2). All presented isotherms showed similar a type-II isotherm course with a hysteresis loop originating from the capillary condensation process in the powder’s pores. The hysteresis loop course was similar to H3 hysteresis, suggesting a slit-shaped pore geometry. The BJH calculations (Figure S3) showed that every examined sample had a dominant pore width between 2 and 3 nm. The BET specific surface area calculations showed the largest value for sample S2, reaching 12.58 ± 0.04 m2 g−1. Moreover, all synthesised samples had values of specific surface area between ca. 8 and 13 m2 g−1. The lowest BET specific surface area value was obtained for the Com sample (4.43 ± 0.03 m2 g−1). The average grain size calculated from the N2 adsorption/desorption data for every powder was in the range of ca. 130 to ca. 390 nm and correlated well with the SEM imaging and XRD results. The results of the N2 adsorption/desorption experiments are listed in Table 2.

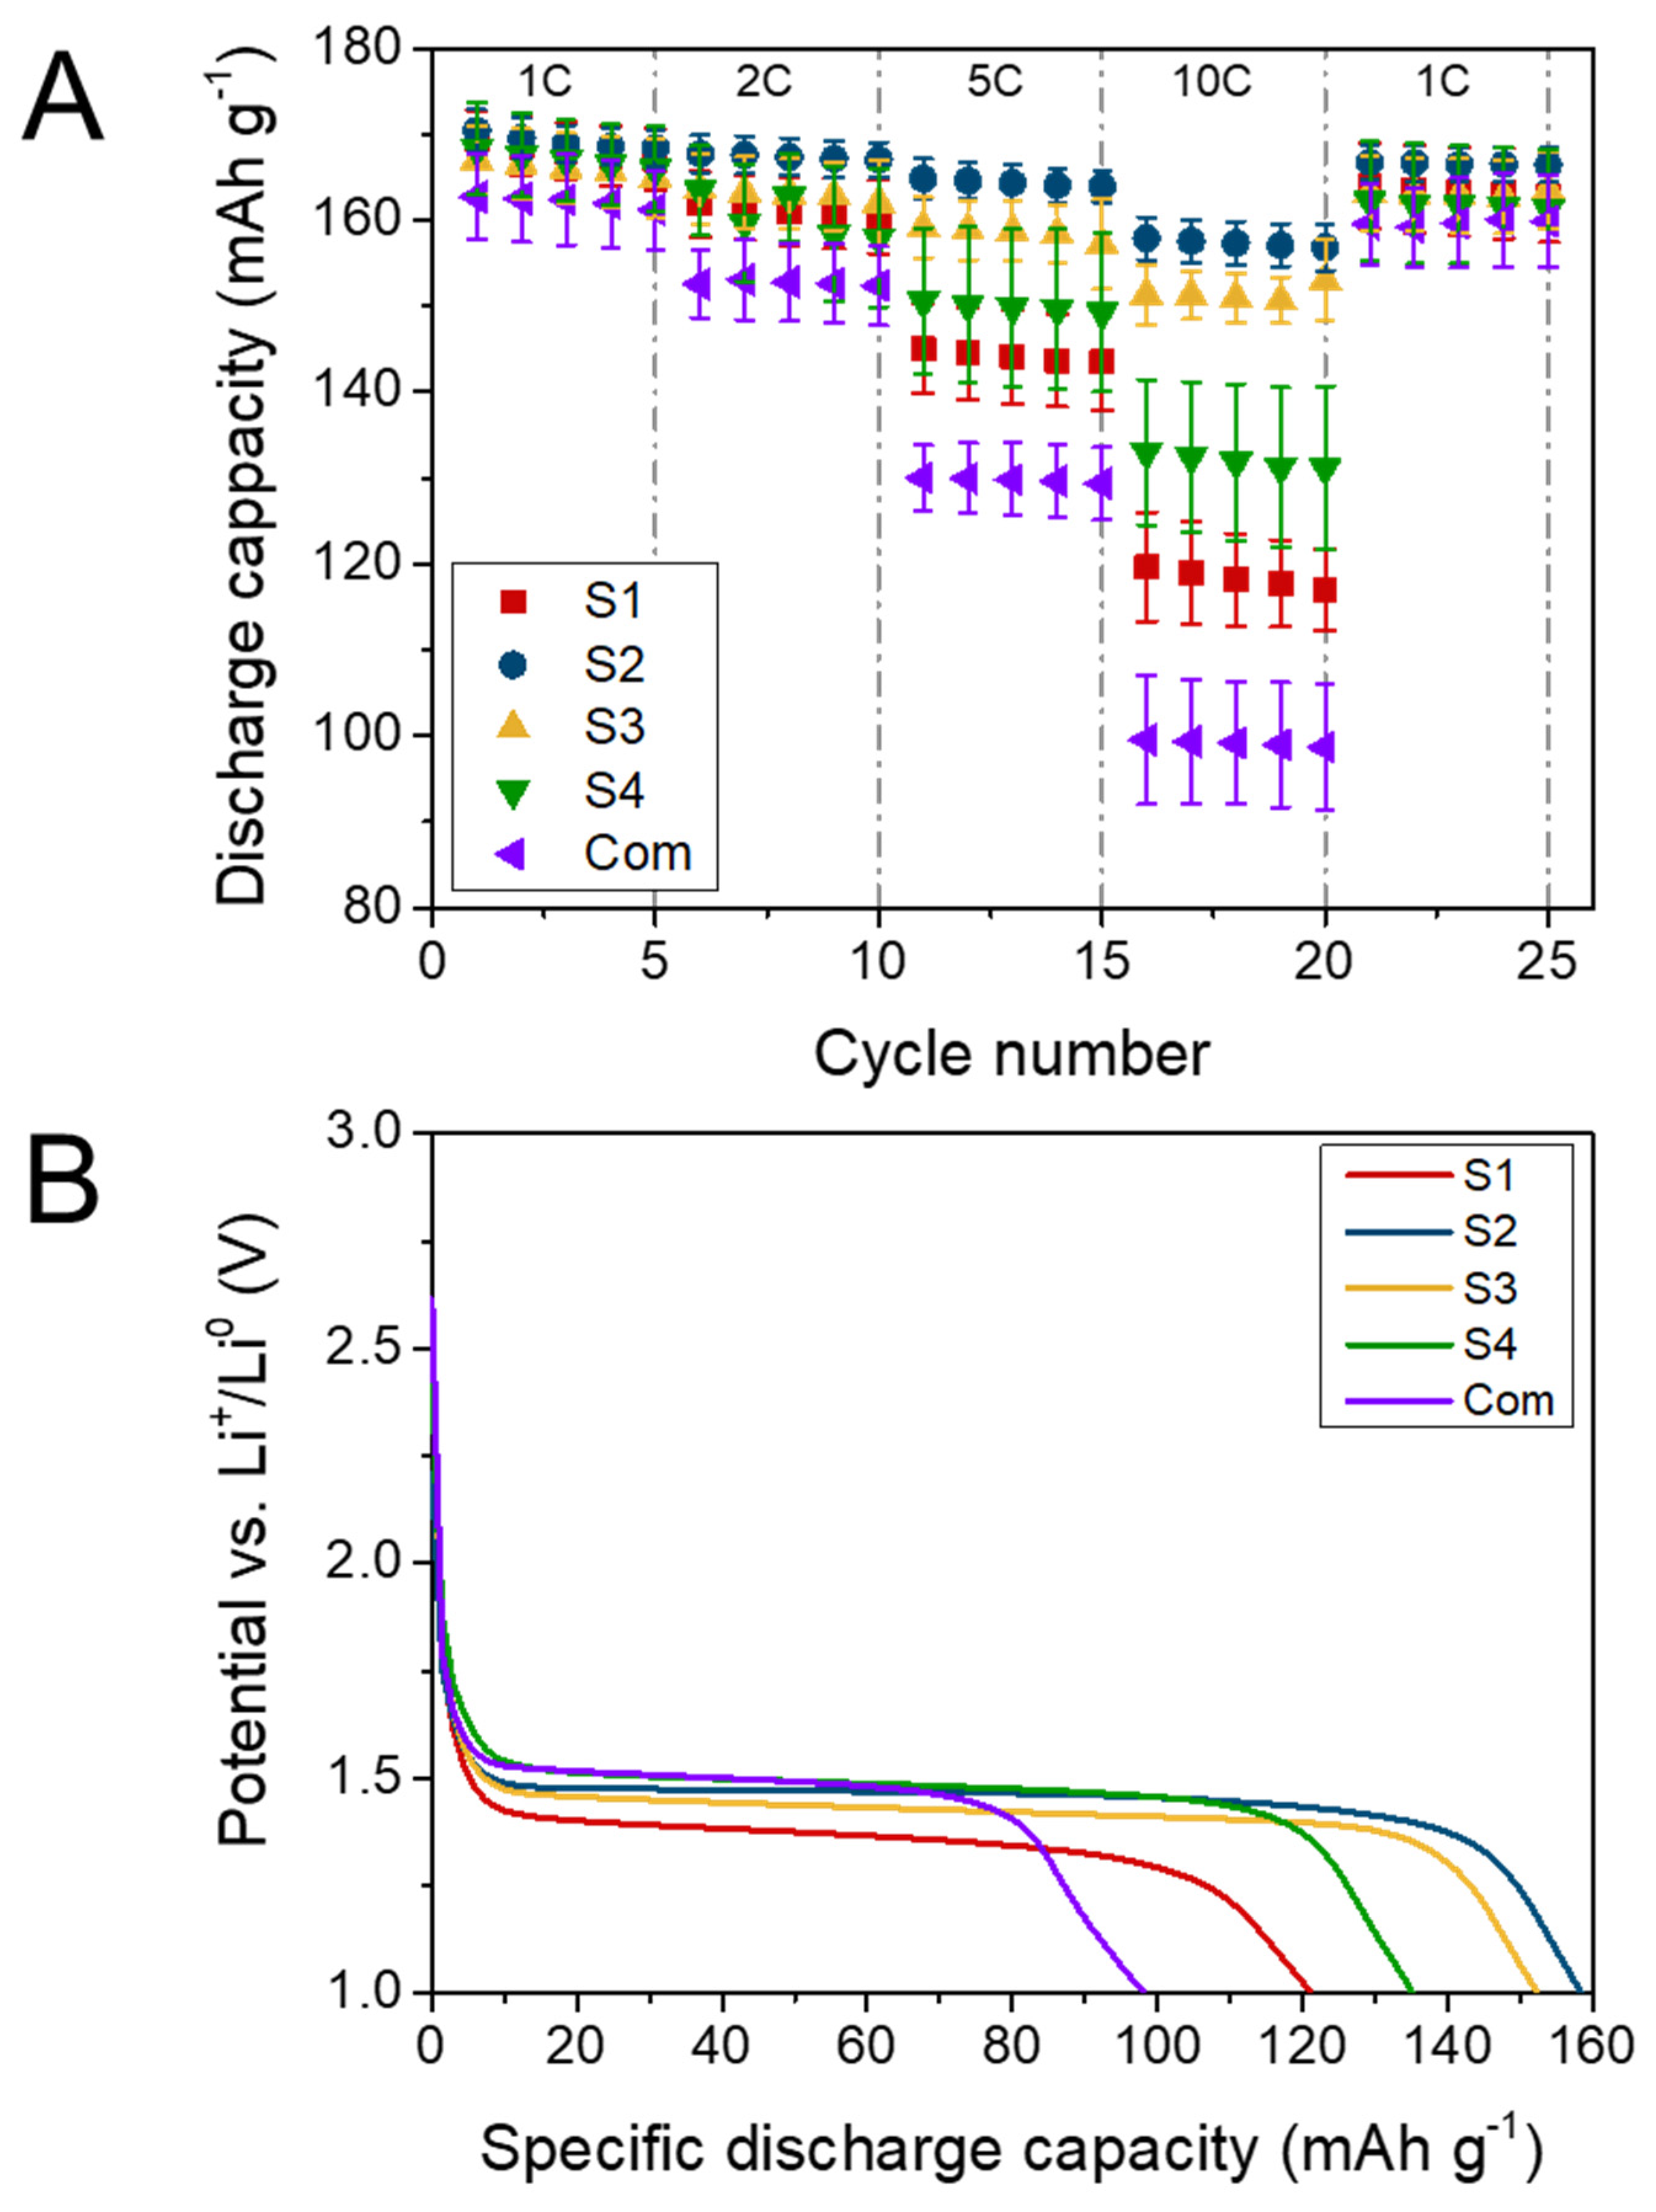
3.3. Electrochemistry
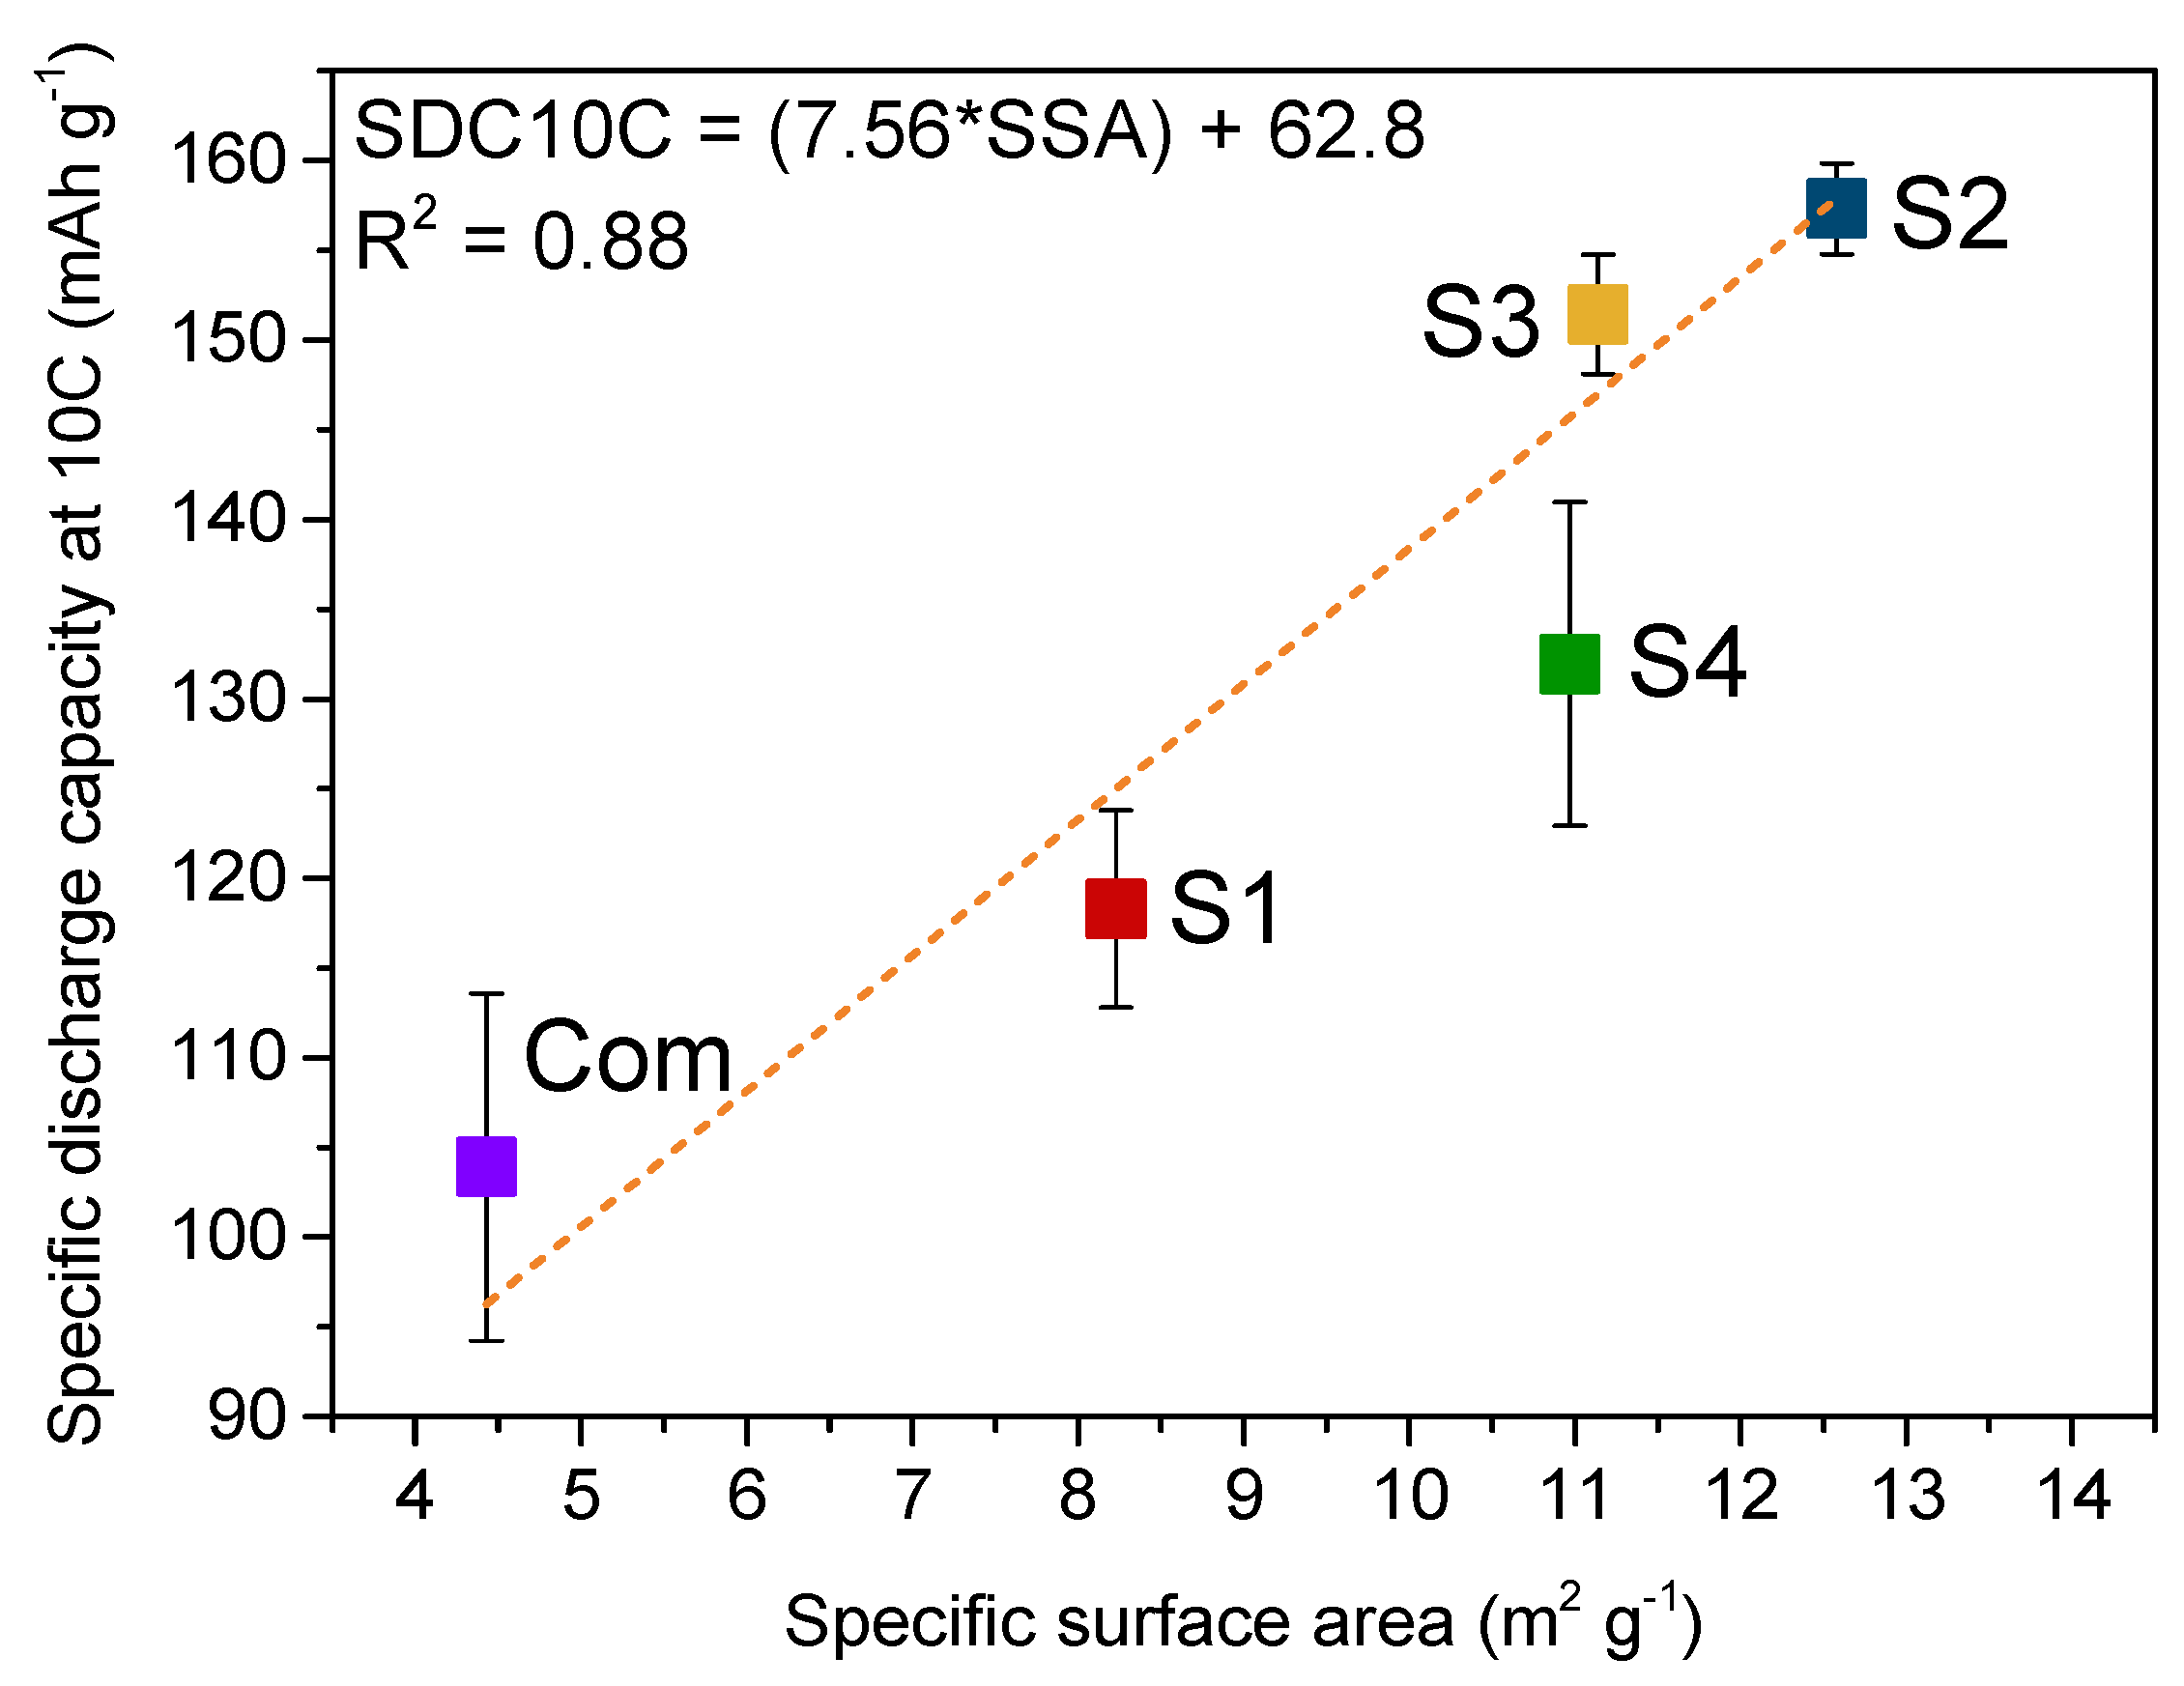
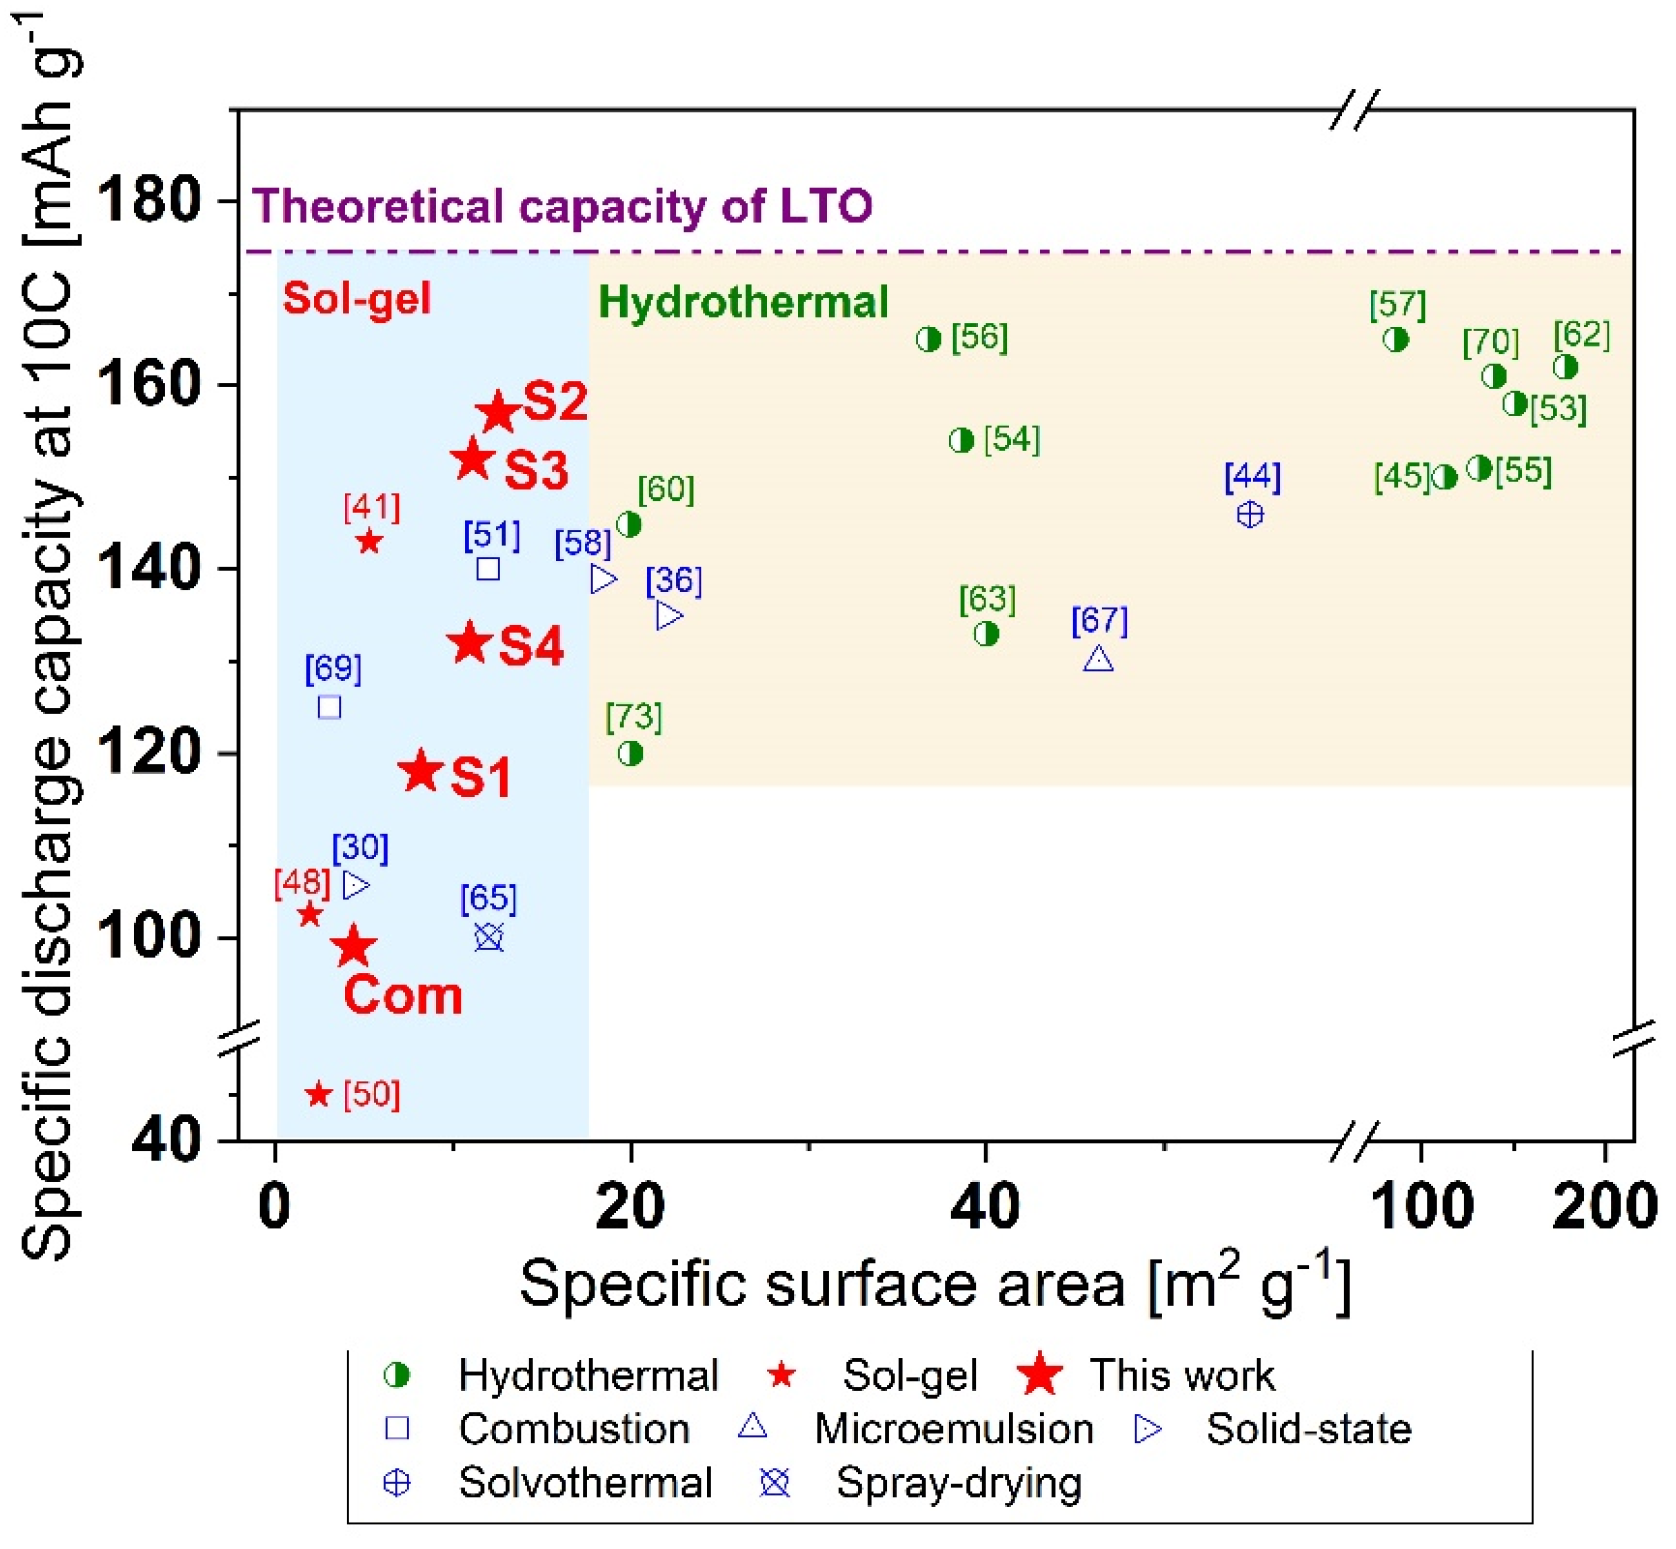
The galvanostatic charge/discharge results for the Li4Ti5O12 powders are presented in Figure 5. At a current of 1 C, the specific capacity of samples S1–S4 was similar, reaching ca. 169 mAh g−1. Moreover, the powders obtained via the modified sol–gel method showed a slightly higher specific capacity (by ca. 6 mAh g−1) at a current of 1 C compared to the commercial powders. The electrochemical behaviour of each sample began to differ at higher C-rates. At 10 C, the lowest specific capacity was found for the Com sample, reaching 99.2 ± 9.7 mAh g−1. The highest capacity retention at 10 C was obtained for sample S2, at 157.3 ± 2.5 mAh g−1 (93% of 1 C capacity) (Figure 5A). This shows an excellent rate performance of Li4Ti5O12 synthesised via a modified sol–gel method. After applying the 1 C current rate for the second time, the capacity of every examined cell returned to its initial value, suggesting no structural rearrangements occurred during heavy discharge loads. The results of the CP experiments are listed in Table 3.
The shapes of the discharge potential curves for all LTO samples at all rates are shown in Figure S4. It is notable how the samples share similar characteristics at the initial 1 C cycling. The most remarkable difference was the larger specific capacity value for the sol–gel synthesized samples with respect to the commercial sample. This behaviour was maintained as the discharge rate increased to 2 C, with a corresponding decrease in the discharge specific capacity. At 5 C, the loss in specific capacity for the commercial materials was around 18% and increased to approximately 40% at 10 C. On every curve, one can observe a characteristic discharge plateau at ca. 1.55 V (vs. Li+/Li0) originating from a two-phase reaction of Li4Ti5O12. The plateau values for all samples decreased as the current increased as a consequence of the resistance polarization of the cells. The bigger the polarization, the bigger the difference in the plateau at different currents and the bigger the internal resistance within the cell. Surprisingly the plateau potential was not clearly corelated with the material’s specific capacity. For example, sample S1 at 10 C presented a higher discharge capacity than the commercial samples, even though its plateau potential drop was bigger than that of the commercial samples. No other electrochemical processes were visible on the discharge curves, indicating the high purity of the materials and the absence of ongoing side reactions. There was no clear dependence between the change in the plateau potential and the material type utilized, suggesting a complex relationship between the internal resistance of the cells and the cell polarisation phenomenon.

4. Discussion

A graph plotting the 10 C specific discharge capacity of various Li4Ti5O12 powders against their BET specific surface areas is presented in Figure 6. It is evident that the specific capacity at 10 C was higher for samples with a higher specific surface area. This behaviour could be described with a standard linear regression; a linear trend was fitted when the 10 C rate specific capacity was plotted against the average particle size acquired from our N2 adsorption/desorption experiments (Figure S5A). No such relationship was obtained for the average crystallite size calculated from XRD measurements (Figure S5B), showing how the high rate performance is independent from the structural characteristics. According to the linear relationship between the specific capacity at 10 C and the BET specific surface area in the 4–13 m2 g−1 range, theoretically, by simple extrapolation, the maximum specific discharge capacity would be reached for materials showing a BET specific surface area of ca. 15 m2 g−1. In relation to this, further enlarging the specific surface area of lithium titanium oxide will not lead to an increase in its electrochemical performance at 10 C because of LTO’s theoretical capacity barrier.
To explore the bigger picture, we plotted our results along with data from the literature [30,36,41,44,45,46,48,50,51,53,54,55,56,57,58,62,63,64,67,69,70,73] as the specific capacity at 10 C versus specific surface area, as shown in Figure 7. The presented data points were divided into two zones: blue up to 17 m2 g−1 for sol–gel synthesized LTO, and beige for higher SSA for hydrothermally/solvothermally synthesized LTO. The maximum theoretical capacity of LTO (175 mAh g−1) is represented by a straight pink dashed/dotted line.
Our previously applied linear regression model collapses for materials with SSAs larger than c.a. 15 m2 g−1. One of the working models is a logistic function that may describe the increase in specific capacity as a function of the surface area in the whole range. In our case, the specific capacity at 10 C would increase along with the specific surface area until a theoretical capacity value (saturation value) was reached. Nevertheless, to properly describe this logistic function for LTO, further experiments will be needed for ultra-small and extra-large specific surface areas to cover a wider spectrum of the logistic function. This wide spectrum of particle SSAs can be obtained only by using different synthesis methods, which leads to additional issues with data comparison due to the presence of different impurities. Here, we only described a specific region between 4 and 13 m2 g−1 of the logistic plot for the S1–S4 and Com samples. This was possible since in this short range, the same synthesis route could be used for all samples, and a linear regression was a relatively good approximation of the experimental data.
From the behaviour of the logistic function, the LTO material data points display a steadily increasing trend for SSA from 2 to 15 m2 g−1 (Figure 7), while after this point synthesized LTO data look rather randomly scattered around a constant value. An up-to-date comparison between different synthesis routes with an emphasis on high rate performance has not yet been published; however, many researchers have postulated that small crystals [42,77], mesoporosity [43,44,45,61], or a high specific surface area [44,47,48] are more favourable in terms of shortened Li+ diffusion length and increased electrode/electrolyte surface. An opposite effect has also been suggested, that a very high SSA promotes SEI formation and undesirable side reactions at higher current loads leading to material degradation and capacity fade [16,49].
Our best sol–gel synthesized LTO (S2) was characterized by a 7% drop in its initial capacity during 10 C discharge (12.58 m2 g−1 SSA). Lower capacity drops have been reported for hydrothermally synthesized samples: 6.5% [50], 6% [51], 5.6% [52], 4% [53], and 3% [54] for surface areas at least three times higher than those of the sol–gel S2 LTO sample. Two samples had a higher specific capacity at 10 C, both 165 mAh g−1, for SSA 36.76 and 85.93 m2 g−1, respectively [53,54].
We showed that our sol–gel synthesis method can produce LTO materials with high specific discharge capacity at a rate of 10 C. The obtained results are comparable to those obtained from hydrothermal methods, even if their specific surface area is much higher. Similar linear behaviour was observed for the ultra-high rate performance (50–250 C) vs. the logarithm of SSA for LTO in thin-film electrodes up to 20 m2 g−1. Kavan et al. [78] used a simplified electrode design without carbon black or a binder and with an electrode thickness of only 2–4 µm deposited at the conducting glass. They concluded that an SSA increase above c.a. 20 m2 g−1 led to a plateau in C-rate performance, whereas for an SSA exceeding 100 m2 g−1, high rate capability was not obtained and even decreased. It was revealed that below a certain size of LTO particles, the Li+-Li+ repulsions generated more stress in the material, while ultrasmall particles tended to show higher irreversible charge capacities and were more sensitive to parasitic charge reactions [16,78].

5. Conclusions

We successfully synthesised Li4Ti5O12 powders via a modified sol–gel method. The powders were characterized using structural, morphological, and electrochemical techniques. The modified sol–gel approach resulted in fine, pure phase powders with relatively high BET specific surface areas. Galvanostatic charge/discharge experiments showed an excellent rate performance of the synthesised compounds, which retained ca. 93% of their 1 C specific capacity at a 10 C discharge rate. We discussed a possible explanation for the good performance of the high-rate LTO materials by optimizing the synthesis route and finding the measurable factor that most influences a rate performance. Based on our experimental results and previously published reports, we showed that there is an optimum BET specific surface area, above which (ca. 15 m2 g−1) the improvement of Li4Ti5O12 performance at a 10 C rate is insignificant. This work suggests that the morphology of the material can be, in some cases, more important than structural factors (such as crystal size tuning) or surface modifications when optimising electrochemical performance. Therefore, it is possible to obtain LTO that performs well without additional efforts leading to extremely high surface areas, since they will not contribute to further increasing the high rate performance of LTO, but will rather increase the chance for the occurrence of side degradation reactions.

Supplementary Materials

The following supporting information can be downloaded at: https://www.mdpi.com/article/10.3390/batteries8100168/s1, Table S1: High rate performance and characteristics of several LTO materials found in the literature; Figure S1: SEM images for the sol–gel synthesized and commercial LTO samples with reference to 1 µm; Figure S2: N2 adsorption/desorption isotherms of Li4Ti5O12 powders: S1 (A), S2 (B), S3 (C), S4 (D), and Com (E); Figure S3: Pore size and distribution of Li4Ti5O12 powders: S1 (A), S2 (B), S3 (C), S4 (D), and Com (E); Figure S4: Discharge curves of sol–gel synthesized and commercial LTO samples. (A) 1st cycle at 1 C, (B) 5th cycle at 1 C, (C) 10th cycle at 2 C, (D) 15th cycle at 5 C, (E) 20th cycle at 10 C, and (F) 25th cycle at 1 C; Figure S5: Relation between specific discharge capacity at 10 C (SDC10C) and (A) particle size calculated using BET and (B) crystal size calculated using XRD. References [30,36,37,41,42,43,44,45,46,47,48,49,50,51,52,53,54,55,56,57,58,59,60,61,62,63,64,65,66,67,68,69,70,71,72,73,74] are cited in the Supplementary Materials.

Author Contributions

Conceptualization, D.A.B., M.W.-S., B.H. and A.C.; methodology, D.A.B., M.W.-S. and M.K.; formal analysis, H.A.L.-J., D.A.B., M.W.-S., M.R., M.B., M.K. and B.H.; investigation, H.A.L.-J., D.A.B., M.W.-S., M.K., M.B. and B.H.; writing—original draft preparation, H.A.L.-J.; writing—review and editing, D.A.B., M.W.-S., M.R., M.B., M.K., B.H. and A.C.; visualization, D.A.B., M.W.-S. and M.K.; supervision, B.H. and A.C.; funding acquisition, B.H. and A.C. All authors have read and agreed to the published version of the manuscript.

Funding

This work was supported by The National Centre for Research and Development through the research grant “Efficient and light photo-rechargeable electric energy storage systems based on solar cell—lithium-ion battery or solar cell-supercapacitor structures for special applications”, grant No. TECHMATSTRATEG1/347431/14/NCBR/2018.

Institutional Review Board Statement

Not applicable.

Informed Consent Statement

Not applicable.

Data Availability Statement

Not applicable.

Conflicts of Interest

The authors declare no conflict of interest. The funders had no role in the design of the study; in the collection, analyses, or interpretation of data; in the writing of the manuscript; or in the decision to publish the results.

References

  1. Peters, J.F.; Baumann, M.; Zimmermann, B.; Braun, J.; Weil, M. The Environmental Impact of Li-Ion Batteries and the Role of Key Parameters – A Review. Renew. Sustain. Energy Rev. 2017, 67, 491–506. [Google Scholar] [CrossRef]
  2. Sethuraman, V.A.; Hardwick, L.J.; Srinivasan, V.; Kostecki, R. Surface Structural Disordering in Graphite upon Lithium Intercalation/Deintercalation. J. Power Sources 2010, 195, 3655–3660. [Google Scholar] [CrossRef] [Green Version]
  3. Pender, J.P.; Jha, G.; Youn, D.H.; Ziegler, J.M.; Andoni, I.; Choi, E.J.; Heller, A.; Dunn, B.S.; Weiss, P.S.; Penner, R.M.; et al. Electrode Degradation in Lithium-Ion Batteries. ACS Nano 2020, 14, 1243–1295. [Google Scholar] [CrossRef] [PubMed] [Green Version]
  4. Armand, M.; Axmann, P.; Bresser, D.; Copley, M.; Edström, K.; Ekberg, C.; Guyomard, D.; Lestriez, B.; Novák, P.; Petranikova, M.; et al. Lithium-Ion Batteries – Current State of the Art and Anticipated Developments. J. Power Sources 2020, 479, 228708. [Google Scholar] [CrossRef]
  5. Yang, J.; Zhou, X.Y.; Li, J.; Zou, Y.L.; Tang, J.J. Study of Nano-Porous Hard Carbons as Anode Materials for Lithium Ion Batteries. Mater. Chem. Phys. 2012, 135, 445–450. [Google Scholar] [CrossRef]
  6. Ohzuku, T.; Ueda, A.; Yamamoto, N. Zero-Strain Insertion Material of Li [ Li1 / 3Ti5 / 3 ] O 4 for Rechargeable Lithium Cells. J. Electrochem. Soc. 1995, 142, 1431–1435. [Google Scholar] [CrossRef]
  7. Panero, S.; Reale, P.; Ronci, F.; Scrosati, B.; Perfetti, P.; Rossi Albertini, V. Refined, in-Situ EDXD Structural Analysis of the Li[Li1/3Ti5/3]O4 Electrode under Lithium Insertion-Extraction. Phys. Chem. Chem. Phys. 2001, 3, 845–847. [Google Scholar] [CrossRef]
  8. Young, D.; Ransil, A.; Amin, R.; Li, Z.; Chiang, Y.M. Electronic Conductivity in the Li4/3Ti5/3O 4-Li7/3Ti5/3O4 System and Variation with State-of-Charge as a Li Battery Anode. Adv. Energy Mater. 2013, 3, 1125–1129. [Google Scholar] [CrossRef]
  9. Prosini, P.P.; Mancini, R.; Petrucci, L.; Contini, V.; Villano, P. Li4Ti5O12 as Anode in All-Solid-State, Plastic, Lithium-Ion Batteries for Low-Power Applications. Solid State Ion. 2001, 144, 185–192. [Google Scholar] [CrossRef]
  10. Ratynski, M.; Hamankiewicz, B.; Buchberger, D.A.; Boczar, M.; Krajewski, M.; Czerwinski, A. A New Technique for In Situ Determination of the Active Surface Area Changes of Li–Ion Battery Electrodes. Batter. Supercaps 2020, 3, 1028–1039. [Google Scholar] [CrossRef]
  11. Obrovac, M.N.; Krause, L.J. Reversible Cycling of Crystalline Silicon Powder. J. Electrochem. Soc. 2007, 154, A103. [Google Scholar] [CrossRef]
  12. Cao, C.; Abate, I.I.; Sivonxay, E.; Shyam, B.; Jia, C.; Moritz, B.; Devereaux, T.P.; Persson, K.A.; Steinrück, H.G.; Toney, M.F. Solid Electrolyte Interphase on Native Oxide-Terminated Silicon Anodes for Li-Ion Batteries. Joule 2019, 3, 762–781. [Google Scholar] [CrossRef] [Green Version]
  13. Krajewski, M.; Michalska, M.; Hamankiewicz, B.; Ziolkowska, D.; Korona, K.P.; Jasinski, J.B.; Kaminska, M.; Lipinska, L.; Czerwinski, A. Li4Ti5O12 Modified with Ag Nanoparticles as an Advanced Anode Material in Lithium-Ion Batteries. J. Power Sources 2014, 245, 764–771. [Google Scholar] [CrossRef]
  14. Shu, J. Electrochemical Behavior and Stability of Li 4Ti 5O 12 in a Broad Voltage Window. J. Solid State Electrochem. 2009, 13, 1535–1539. [Google Scholar] [CrossRef]
  15. Yuan, T.; Tan, Z.; Ma, C.; Yang, J.; Ma, Z.F.; Zheng, S. Challenges of Spinel Li4Ti5O12 for Lithium-Ion Battery Industrial Applications. Adv. Energy Mater. 2017, 7. [Google Scholar] [CrossRef]
  16. Gauthier, N.; Courrèges, C.; Demeaux, J.; Tessier, C.; Martinez, H. Probing the In-Depth Distribution of Organic/Inorganic Molecular Species within the SEI of LTO/NMC and LTO/LMO Batteries: A Complementary ToF-SIMS and XPS Study. Appl. Surf. Sci. 2020, 501, 144266. [Google Scholar] [CrossRef]
  17. Gauthier, N.; Courrèges, C.; Goubault, L.; Demeaux, J.; Tessier, C.; Martinez, H. Influence of the Positive Electrode on Li 4 Ti 5 O 12 (LTO) Electrode/Electrolyte Interfaces in Li-Ion Batteries. J. Electrochem. Soc. 2018, 165, A2925–A2934. [Google Scholar] [CrossRef]
  18. Myung, S.T.; Hitoshi, Y.; Sun, Y.K. Electrochemical Behavior and Passivation of Current Collectors in Lithium-Ion Batteries. J. Mater. Chem. 2011, 21, 9891–9911. [Google Scholar] [CrossRef]
  19. Ali, B.; Muhammad, R.; Anang, D.A.; Cho, M.K.; Kim, J.Y.; Nam, K.W. Ge-Doped Li4Ti5-XGexO12 (x = 0.05) as a Fast-Charging, Long-Life Bi-Functional Anode Material for Lithium- and Sodium-Ion Batteries. Ceram. Int. 2020, 46, 16556–16563. [Google Scholar] [CrossRef]
  20. Tsai, P.C.; Nasara, R.N.; Shen, Y.C.; Liang, C.C.; Chang, Y.W.; Hsu, W.D.; Thuy Tran, N.T.; Lin, S. kang Ab Initio Phase Stability and Electronic Conductivity of the Doped-Li4Ti5O12 Anode for Li-Ion Batteries. Acta Mater. 2019, 175, 196–205. [Google Scholar] [CrossRef]
  21. Zou, S.; Wang, G.; Zhang, Y.; Xue, C.; Chen, H.; Yang, G.; Nan, H.; Wei, H.; Lin, H. Nano-Structure and Characterization of Carbon Composite with Al3+ and Mn4+ Co-Doped Li4Ti5O12 as Anodes for Li-Ion Batteries. J. Alloys Compd. 2020, 816, 152609. [Google Scholar] [CrossRef]
  22. An, D.; Shen, L.; Lei, D.; Wang, L.; Ye, H.; Li, B.; Kang, F.; He, Y.B. An Ultrathin and Continuous Li 4 Ti 5 O 12 Coated Carbon Nanofiber Interlayer for High Rate Lithium Sulfur Battery. J. Energy Chem. 2019, 31, 19–26. [Google Scholar] [CrossRef] [Green Version]
  23. Chaturvedi, P.; Kanagaraj, A.B.; al Nahyan, M.S.; al Shibli, H.; Ashoor, A.A.; Fadaq, H.; al Dahmani, S.; Choi, D.S. Electrical and Electrochemical Properties of Carbon Nanotube-Based Free Standing LTO Electrodes for Current Collector-Free Li-Ion Batteries. Curr. Appl. Phys. 2019, 19, 1150–1155. [Google Scholar] [CrossRef]
  24. Chung, Y.; Shin, Y.; Liu, Y.; Park, J.S.; Margez, C.L.; Greszler, T.A. Synergetic Effect of Carbon and AlF 3 Coatings on the Lithium Titanium Oxide Anode Material for High Power Lithium-Ion Batteries. J. Electroanal. Chem. 2019, 837, 240–245. [Google Scholar] [CrossRef]
  25. Li, D.; Liu, Y.; Zhao, W.; Gao, Y.; Cao, L.; Liu, Y.; Wang, W.; Yi, L.; Qi, T. Synthesis of Ce Modified Li4Ti5O12 Using Biomass as Carbon Source. J. Electroanal. Chem. 2019, 851, 113441. [Google Scholar] [CrossRef]
  26. Zhang, P.; Liu, Y.; Chai, F.; Fan, Y.; Hou, A. One-Step Synthesis of Carbon Nanotubes-Modified and Carbon-Coated Li4Ti5O12 and Its Application to Li Half Cell and LiNi0.8Co0.1Mn0.1O2/Li4Ti5O12 Full Cell. J. Electron. Mater. 2020, 49, 2529–2538. [Google Scholar] [CrossRef]
  27. Liu, H.P.; Wen, G.W.; Bi, S.F.; Wang, C.Y.; Hao, J.M.; Gao, P. High Rate Cycling Performance of Nanosized Li4Ti5O12/Graphene Composites for Lithium Ion Batteries. Electrochim. Acta 2016, 192, 38–44. [Google Scholar] [CrossRef]
  28. Odziomek, M.; Chaput, F.; Lerouge, F.; Rutkowska, A.; Świerczek, K.; Carlier, D.; Sitarz, M.; Parola, S. Impact of the Synthesis Parameters on the Microstructure of Nano-Structured LTO Prepared by Glycothermal Routes and 7Li NMR Structural Investigations. J. Sol-Gel Sci. Technol. 2019, 89, 225–233. [Google Scholar] [CrossRef]
  29. Tang, L.; He, Y.-B.; Wang, C.; Wang, S.; Wagemaker, M.; Li, B.; Yang, Q.-H.; Kang, F. High-Density Microporous Li4 Ti 5 O 12 Microbars with Superior Rate Performance for Lithium-Ion Batteries. Adv. Sci. 2017, 4, 1600311. [Google Scholar] [CrossRef] [Green Version]
  30. Michalska, M.; Krajewski, M.; Ziolkowska, D.; Hamankiewicz, B.; Andrzejczuk, M.; Lipinska, L.; Korona, K.P.; Czerwinski, A. Influence of Milling Time in Solid-State Synthesis on Structure, Morphology and Electrochemical Properties of Li4Ti5O12 of Spinel Structure. Powder Technol. 2014, 266, 372–377. [Google Scholar] [CrossRef]
  31. Takami, N.; Hoshina, K.; Inagaki, H. Lithium Diffusion in Li4/3Ti5/3O4 Particles during Insertion and Extraction. J. Electrochem. Soc. 2011, 158, A725. [Google Scholar] [CrossRef]
  32. Lin, C.; Fan, X.; Xin, Y.; Cheng, F.; Lai, M.O.; Zhou, H.; Lu, L. Monodispersed Mesoporous Li4Ti5O12 Submicrospheres as Anode Materials for Lithium-Ion Batteries: Morphology and Electrochemical Performances. Nanoscale 2014, 6, 6651–6660. [Google Scholar] [CrossRef] [PubMed]
  33. Yan, B.; Li, M.; Li, X.; Bai, Z.; Yang, J.; Xiong, D.; Li, D. Novel Understanding of Carbothermal Reduction Enhancing Electronic and Ionic Conductivity of Li4Ti5O12 Anode. J. Mater. Chem. A Mater. 2015, 3, 11773–11781. [Google Scholar] [CrossRef]
  34. Krajewski, M.; Hamankiewicz, B.; Czerwiński, A. Voltammetric and Impedance Characterization of Li4Ti5O12/n-Ag Composite for Lithium-Ion Batteries. Electrochim. Acta 2016, 219, 277–283. [Google Scholar] [CrossRef]
  35. Krajewski, M.; Hamankiewicz, B.; Michalska, M.; Andrzejczuk, M.; Lipinska, L.; Czerwinski, A. Electrochemical Properties of Lithium-Titanium Oxide, Modified with Ag-Cu Particles, as a Negative Electrode for Lithium-Ion Batteries. RSC Adv. 2017, 7, 52151–52164. [Google Scholar] [CrossRef] [Green Version]
  36. Pohjalainen, E.; Rauhala, T.; Valkeapää, M.; Kallioinen, J.; Kallio, T. Effect of Li4Ti5O12 Particle Size on the Performance of Lithium Ion Battery Electrodes at High C-Rates and Low Temperatures. J. Phys. Chem. C 2015, 119, 2277–2283. [Google Scholar] [CrossRef] [Green Version]
  37. Kuo, Y.C.; Lin, J.Y. One-Pot Sol-Gel Synthesis of Li4Ti5O12/C Anode Materials for High-Performance Li-Ion Batteries. Electrochim. Acta 2014, 142, 43–50. [Google Scholar] [CrossRef]
  38. Gaberscek, M.; Dominko, R.; Jamnik, J. Is Small Particle Size More Important than Carbon Coating? An Example Study on LiFePO4 Cathodes. Electrochem. Commun. 2007, 9, 2778–2783. [Google Scholar] [CrossRef]
  39. Chen, Z.; Belharouak, I.; Sun, Y.K.; Amine, K. Titanium-Based Anode Materials for Safe Lithium-Ion Batteries. Adv. Funct. Mater. 2013, 23, 959–969. [Google Scholar] [CrossRef]
  40. Kashkooli, A.G.; Lui, G.; Farhad, S.; Lee, D.U.; Feng, K.; Yu, A.; Chen, Z. Nano-Particle Size Effect on the Performance of Li4Ti5O12 Spinel. Electrochim. Acta 2016, 196, 33–40. [Google Scholar] [CrossRef]
  41. Kuo, Y.C.; Peng, H.T.; Xiao, Y.; Lin, J.Y. Effect of Starting Materials on Electrochemical Performance of Sol-Gel-Synthesized Li4Ti5O12 Anode Materials for Lithium-Ion Batteries. J. Solid State Electrochem. 2016, 20, 1625–1631. [Google Scholar] [CrossRef]
  42. Li, X.; Hu, H.; Huang, S.; Yu, G.; Gao, L.; Liu, H.; Yu, Y. Nano-Sized Li4Ti5O12 Anode Material with Excellent Performance Prepared by Solid State Reaction: The Effect of Precursor Size and Morphology. Electrochim. Acta 2013, 112, 356–363. [Google Scholar] [CrossRef]
  43. Liu, W.; Zhang, J.; Wang, Q.; Xie, X.; Lou, Y.; Xia, B. The Effects of Li2CO3 Particle Size on the Properties of Lithium Titanate as Anode Material for Lithium-Ion Batteries. Ionics (Kiel) 2014, 20, 1553–1560. [Google Scholar] [CrossRef]
  44. Chen, X.; Guan, X.; Li, L.; Li, G. Defective Mesoporous Li 4Ti 5O 12-y: An Advanced Anode Material with Anomalous Capacity and Cycling Stability at a High Rate of 20 C. J. Power Sources 2012, 210, 297–302. [Google Scholar] [CrossRef]
  45. Ge, H.; Hao, T.; Zhang, B.; Chen, L.; Cui, L.; Song, X.M. Nanoparticles-Constructed Spinel Li4Ti5O12 with Extra Surface Lithium Storage Capability towards Advanced Lithium-Ion Batteries. Electrochim. Acta 2016, 211, 119–125. [Google Scholar] [CrossRef]
  46. Nugroho, A.; Kim, S.J.; Chang, W.; Chung, K.Y.; Kim, J. Facile Synthesis of Hierarchical Mesoporous Li4Ti5O12 Microspheres in Supercritical Methanol. J. Power Sources 2013, 244, 164–169. [Google Scholar] [CrossRef]
  47. Lin, Y.S.; Duh, J.G. Facile Synthesis of Mesoporous Lithium Titanate Spheres for High Rate Lithium-Ion Batteries. J. Power Sources 2011, 196, 10698–10703. [Google Scholar] [CrossRef]
  48. Mu, D.; Chen, Y.; Wu, B.; Huang, R.; Jiang, Y.; Li, L.; Wu, F. Nano-Sized Li4Ti5O12/C Anode Material with Ultrafast Charge/Discharge Capability for Lithium Ion Batteries. J. Alloys Compd. 2016, 671, 157–163. [Google Scholar] [CrossRef]
  49. Wang, C.; Wang, S.; Tang, L.; He, Y.B.; Gan, L.; Li, J.; Du, H.; Li, B.; Lin, Z.; Kang, F. A Robust Strategy for Crafting Monodisperse Li4Ti5O12 Nanospheres as Superior Rate Anode for Lithium Ion Batteries. Nano Energy 2016, 21, 133–144. [Google Scholar] [CrossRef]
  50. Mahmoud, A.; Amarilla, J.M.; Lasri, K.; Saadoune, I. Influence of the Synthesis Method on the Electrochemical Properties of the Li4Ti5O12 Spinel in Li-Half and Li-Ion Full-Cells. A Systematic Comparison. Electrochim. Acta 2013, 93, 163–172. [Google Scholar] [CrossRef]
  51. Prakash, A.S.; Manikandan, P.; Ramesha, K.; Sathiya, M.; Tarascon, J.M.; Shukla, A.K. Solution-Combustion Synthesized Nanocrystalline Li4Ti 5O12 as High-Rate Performance Li-Ion Battery Anode. Chem. Mater. 2010, 22, 2857–2863. [Google Scholar] [CrossRef]
  52. Liu, W.; Zhang, J.; Wang, Q.; Xie, X.; Lou, Y.; Han, X.; Xia, B. Microsized TiO2 Activated by High-Energy Ball Milling as Starting Material for the Preparation of Li4Ti5O12 Anode Material. Powder Technol. 2013, 247, 204–210. [Google Scholar] [CrossRef]
  53. Ge, H.; Chen, L.; Yuan, W.; Zhang, Y.; Fan, Q.; Osgood, H.; Matera, D.; Song, X.M.; Wu, G. Unique Mesoporous Spinel Li4Ti5O12 Nanosheets as Anode Materials for Lithium-Ion Batteries. J. Power Sources 2015, 297, 436–441. [Google Scholar] [CrossRef]
  54. Zhao, S.; Ka, O.; Xian, X.; Sun, L.; Wang, J. Effect of Primary Crystallite Size on the High-Rate Performance of Li4Ti5O12 Microspheres. Electrochim. Acta 2016, 206, 17–25. [Google Scholar] [CrossRef]
  55. Tang, Y.; Yang, L.; Fang, S.; Qiu, Z. Li4Ti5O12 Hollow Microspheres Assembled by Nanosheets as an Anode Material for High-Rate Lithium Ion Batteries. Electrochim. Acta 2009, 54, 6244–6249. [Google Scholar] [CrossRef]
  56. Liu, W.; Shao, D.; Luo, G.; Gao, Q.; Yan, G.; He, J.; Chen, D.; Yu, X.; Fang, Y. Mesoporous Spinel Li4ti5o12 Nanoparticles for High Rate Lithium-Ion Battery Anodes. Electrochim. Acta 2014, 133, 578–582. [Google Scholar] [CrossRef]
  57. Zhang, W.; Li, J.; Guan, Y.; Jin, Y.; Zhu, W.; Guo, X.; Qiu, X. Nano-Li4Ti5O12 with High Rate Performance Synthesized by a Glycerol Assisted Hydrothermal Method. J. Power Sources 2013, 243, 661–667. [Google Scholar] [CrossRef]
  58. Han, S.W.; Ryu, J.H.; Jeong, J.; Yoon, D.H. Solid-State Synthesis of Li4Ti5O12 for High Power Lithium Ion Battery Applications. J. Alloys Compd. 2013, 570, 144–149. [Google Scholar] [CrossRef]
  59. Chen, J.; Yang, L.; Fang, S.; Tang, Y. Synthesis of Sawtooth-like Li4Ti5O12 Nanosheets as Anode Materials for Li-Ion Batteries. Electrochim. Acta 2010, 55, 6596–6600. [Google Scholar] [CrossRef]
  60. He, Y.B.; Liu, M.; Huang, Z.D.; Zhang, B.; Yu, Y.; Li, B.; Kang, F.; Kim, J.K. Effect of Solid Electrolyte Interface (SEI) Film on Cyclic Performance of Li4Ti5O12 Anodes for Li Ion Batteries. J. Power Sources 2013, 239, 269–276. [Google Scholar] [CrossRef]
  61. Nugroho, A.; Kim, S.J.; Chung, K.Y.; Cho, B.W.; Lee, Y.W.; Kim, J. Facile Synthesis of Nanosized Li4Ti5O12 in Supercritical Water. Electrochem. Commun. 2011, 13, 650–653. [Google Scholar] [CrossRef]
  62. Hui, Y.; Cao, L.; Xu, Z.; Huang, J.; Ouyang, H.; Li, J. Mesoporous Li4Ti5O12 Nanoparticles Synthesized by a Microwave-Assisted Hydrothermal Method for High Rate Lithium-Ion Batteries. J. Electroanal. Chem. 2016, 763, 45–50. [Google Scholar] [CrossRef]
  63. Lin, Y.S.; Tsai, M.C.; Duh, J.G. Self-Assembled Synthesis of Nanoflower-like Li 4Ti 5O 12 for Ultrahigh Rate Lithium-Ion Batteries. J. Power Sources 2012, 214, 314–318. [Google Scholar] [CrossRef]
  64. He, Y.; Muhetaer, A.; Li, J.; Wang, F.; Liu, C.; Li, Q.; Xu, D. Ultrathin Li4Ti5O12 Nanosheet Based Hierarchical Microspheres for High-Rate and Long-Cycle Life Li-Ion Batteries. Adv. Energy Mater. 2017, 7, 1–6. [Google Scholar] [CrossRef]
  65. Haridas, A.K.; Sharma, C.S.; Rao, T.N. Donut-Shaped Li4Ti5O12 Structures as a High Performance Anode Material for Lithium Ion Batteries. Small 2015, 11, 290–294. [Google Scholar] [CrossRef] [Green Version]
  66. Chou, S.L.; Wang, J.Z.; Liu, H.K.; Dou, S.X. Rapid Synthesis of Li4Ti5O12 Microspheres as Anode Materials and Its Binder Effect for Lithium-Ion Battery. J. Phys. Chem. C 2011, 115, 16220–16227. [Google Scholar] [CrossRef]
  67. Liu, G.Y.; Wang, H.Y.; Liu, G.Q.; Yang, Z.Z.; Jin, B.; Jiang, Q.C. Facile Synthesis of Nanocrystalline Li 4Ti 5O 12 by Microemulsion and Its Application as Anode Material for Li-Ion Batteries. J. Power Sources 2012, 220, 84–88. [Google Scholar] [CrossRef]
  68. Wang, J.; Zhao, H.; Wen, Y.; Xie, J.; Xia, Q.; Zhang, T.; Zeng, Z.; Du, X. High Performance Li4Ti5O12 Material as Anode for Lithium-Ion Batteries. Electrochim. Acta 2013, 113, 679–685. [Google Scholar] [CrossRef]
  69. Yuan, T.; Cai, R.; Wang, K.; Ran, R.; Liu, S.; Shao, Z. Combustion Synthesis of High-Performance Li4Ti5O12 for Secondary Li-Ion Battery. Ceram. Int. 2009, 35, 1757–1768. [Google Scholar] [CrossRef]
  70. Zhang, N.; Liu, Z.; Yang, T.; Liao, C.; Wang, Z.; Sun, K. Facile Preparation of Nanocrystalline Li4Ti5O 12 and Its High Electrochemical Performance as Anode Material for Lithium-Ion Batteries. Electrochem. Commun. 2011, 13, 654–656. [Google Scholar] [CrossRef]
  71. Qiao, Y.; Hu, X.; Liu, Y.; Huang, Y. Li 4Ti 5O 12 Nanocrystallites for High-Rate Lithium-Ion Batteries Synthesized by a Rapid Microwave-Assisted Solid-State Process. Electrochim. Acta 2012, 63, 118–123. [Google Scholar] [CrossRef]
  72. Yin, S.Y.; Song, L.; Wang, X.Y.; Zhang, M.F.; Zhang, K.L.; Zhang, Y.X. Synthesis of Spinel Li4Ti5O12 Anode Material by a Modified Rheological Phase Reaction. Electrochim. Acta 2009, 54, 5629–5633. [Google Scholar] [CrossRef]
  73. Lai, C.; Dou, Y.Y.; Li, X.; Gao, X.P. Improvement of the High Rate Capability of Hierarchical Structured Li4Ti5O12 Induced by the Pseudocapacitive Effect. J. Power Sources 2010, 195, 3676–3679. [Google Scholar] [CrossRef]
  74. Tang, Y.F.; Yang, L.; Qiu, Z.; Huang, J.S. Preparation and Electrochemical Lithium Storage of Flower-like Spinel Li4Ti5O12 Consisting of Nanosheets. Electrochem. Commun. 2008, 10, 1513–1516. [Google Scholar] [CrossRef]
  75. Julien, C.M.; Zaghib, K. Electrochemistry and Local Structure of Nano-Sized Li4/3Me 5/3O4 (Me=Mn, Ti) Spinels. Electrochim. Acta 2004, 50, 411–416. [Google Scholar] [CrossRef]
  76. Nakazawa, T.; Grismanovs, V.; Yamaki, D.; Katano, Y.; Aruga, T. Disordering in Li2TiO3 Irradiated with High Energy Ions. Nucl. Instrum. Methods Phys. Res. Sect. B Beam Interact. Mater. At. 2003, 206, 166–170. [Google Scholar] [CrossRef]
  77. Aldon, L.; Kubiak, P.; Womes, M.; Jumas, J.C.; Tirado, J.L.; Corredor, J.I.; Pe, C. Chemical and Electrochemical Li-Insertion into the Li 4 Ti 5 O 12 Spinel. Methods 2004, 5721–5725. [Google Scholar]
  78. Kavan, L.; Prochaázka, J.; Spitler, T.M.; Kalbaácč, M.; Zukalovaá, M.; Drezen, T.; Graätzel, M. Li Insertion into Li4 Ti5 O12 (Spinel): Charge Capability vs. Particle Size in Thin-Film Electrodes. J. Electrochem. Soc. 2003, 150, A1000. [Google Scholar] [CrossRef]
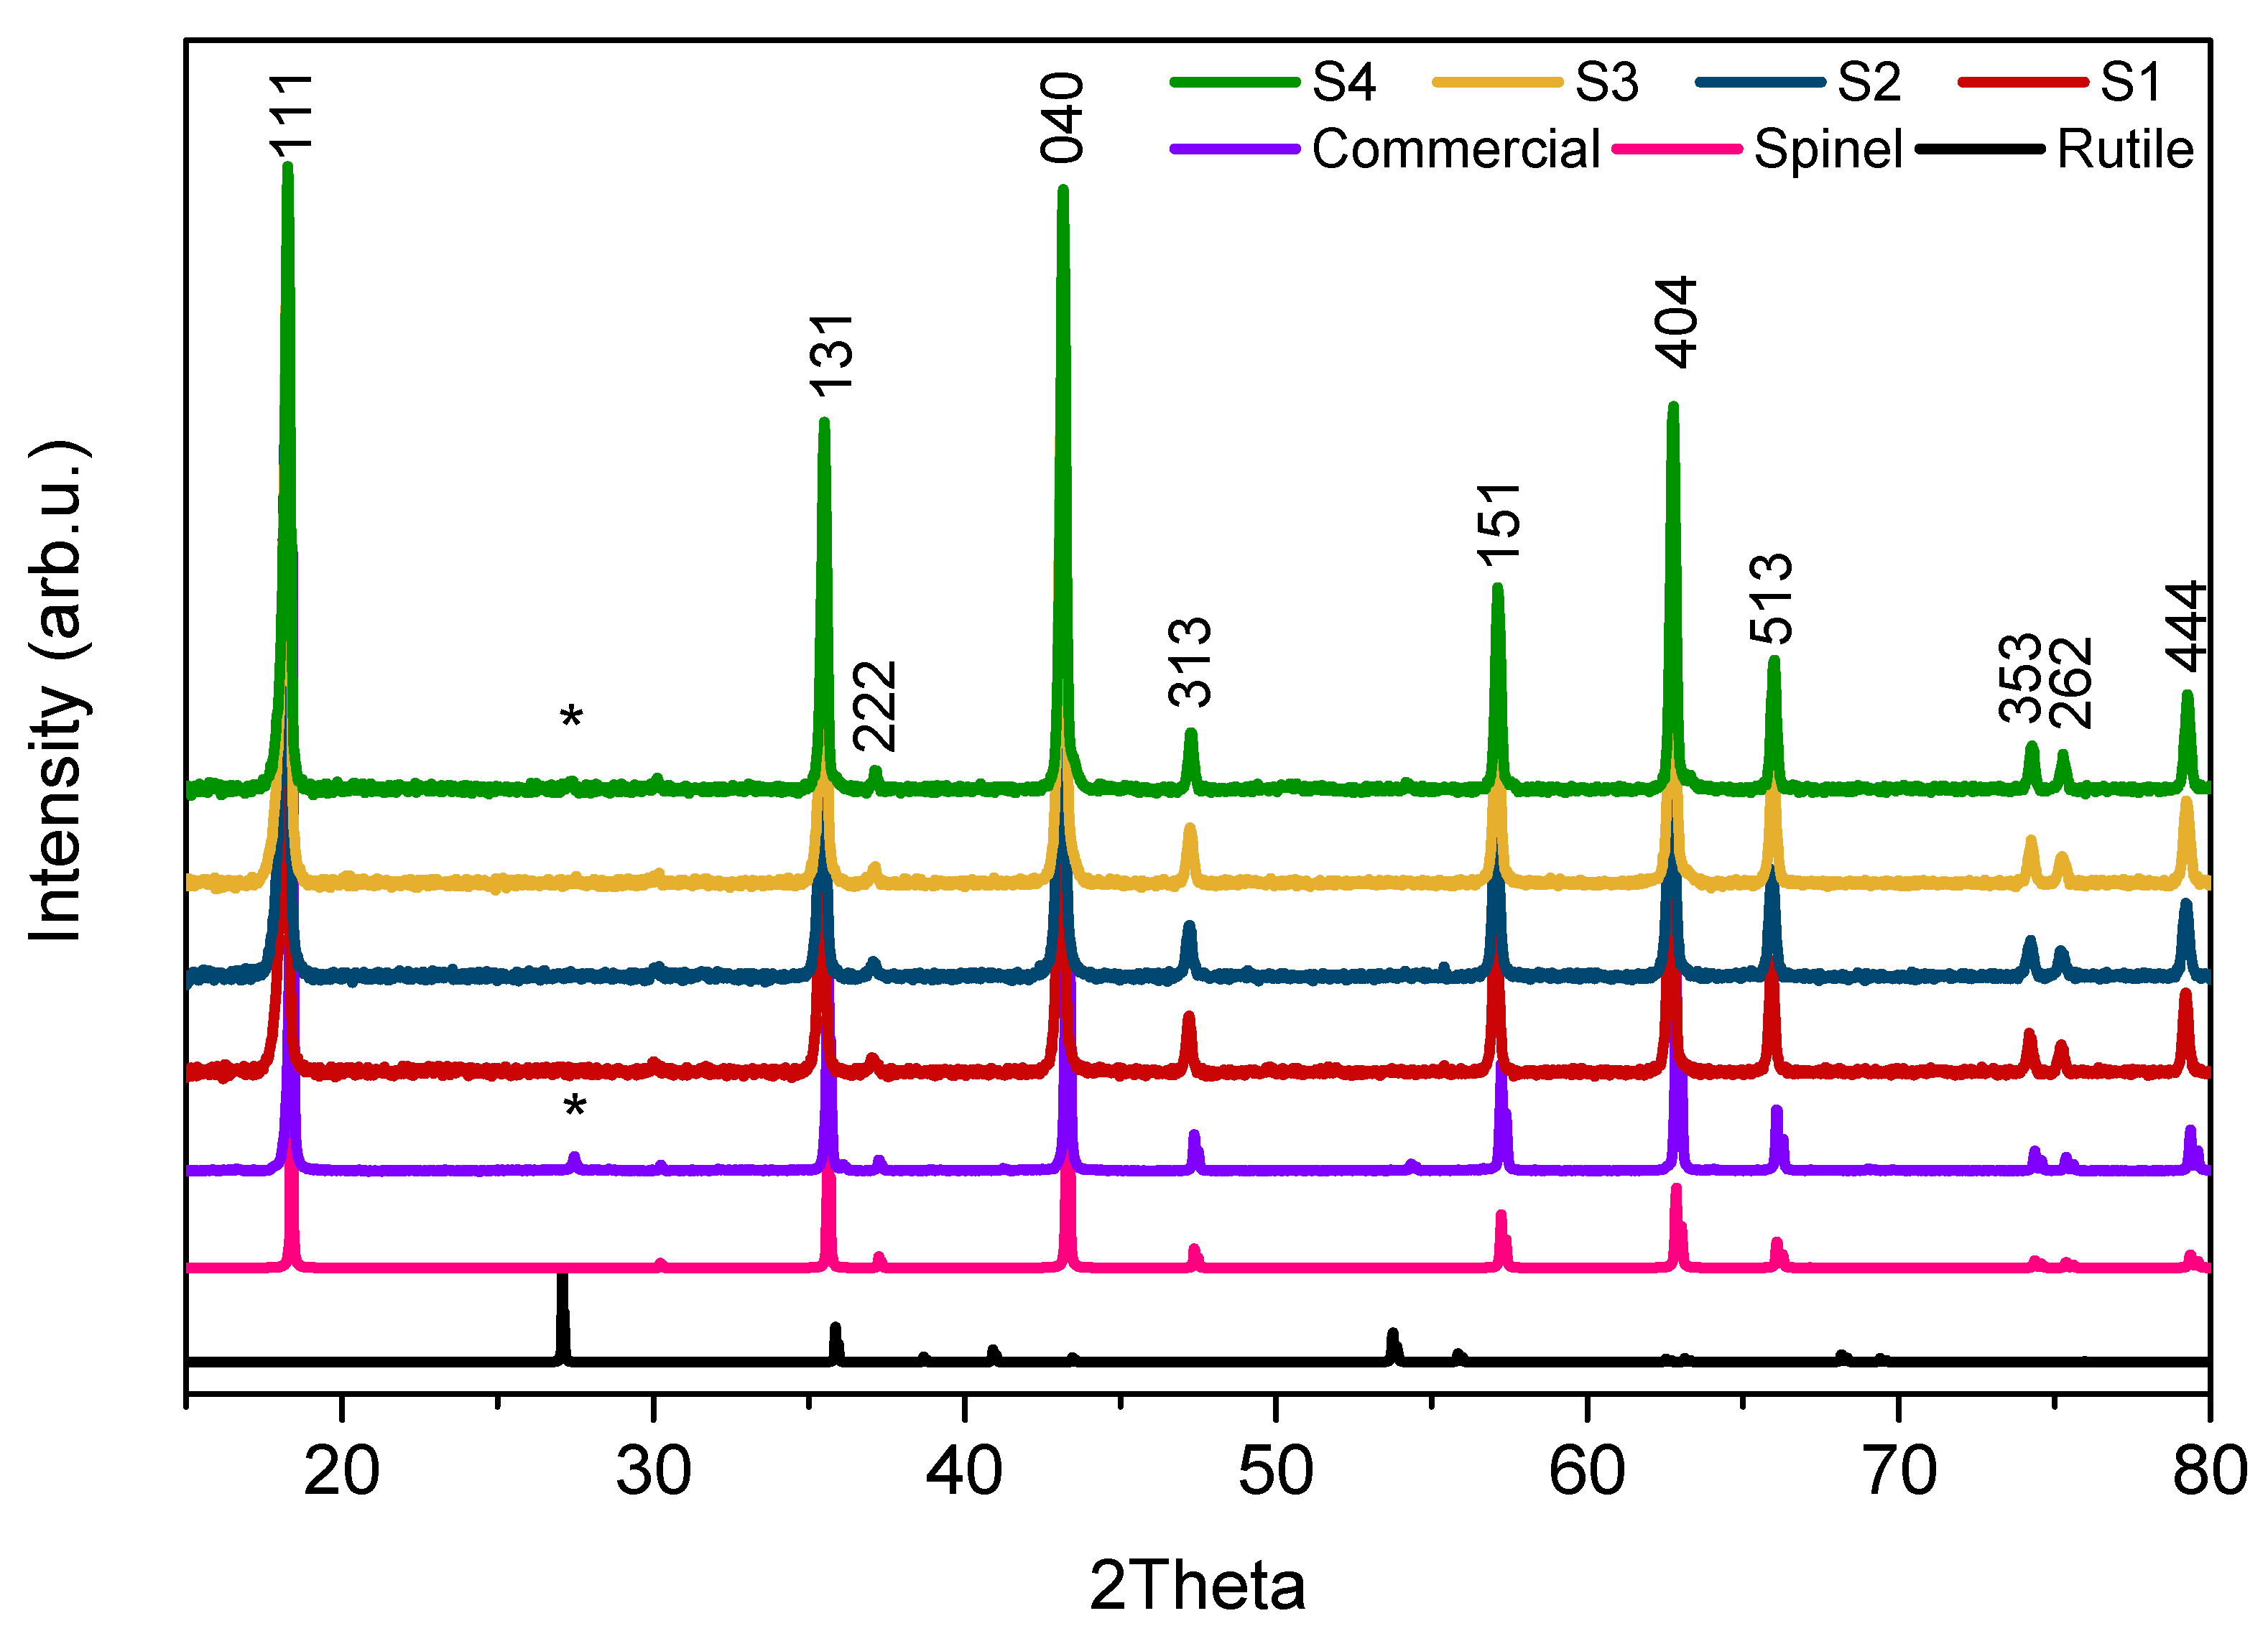
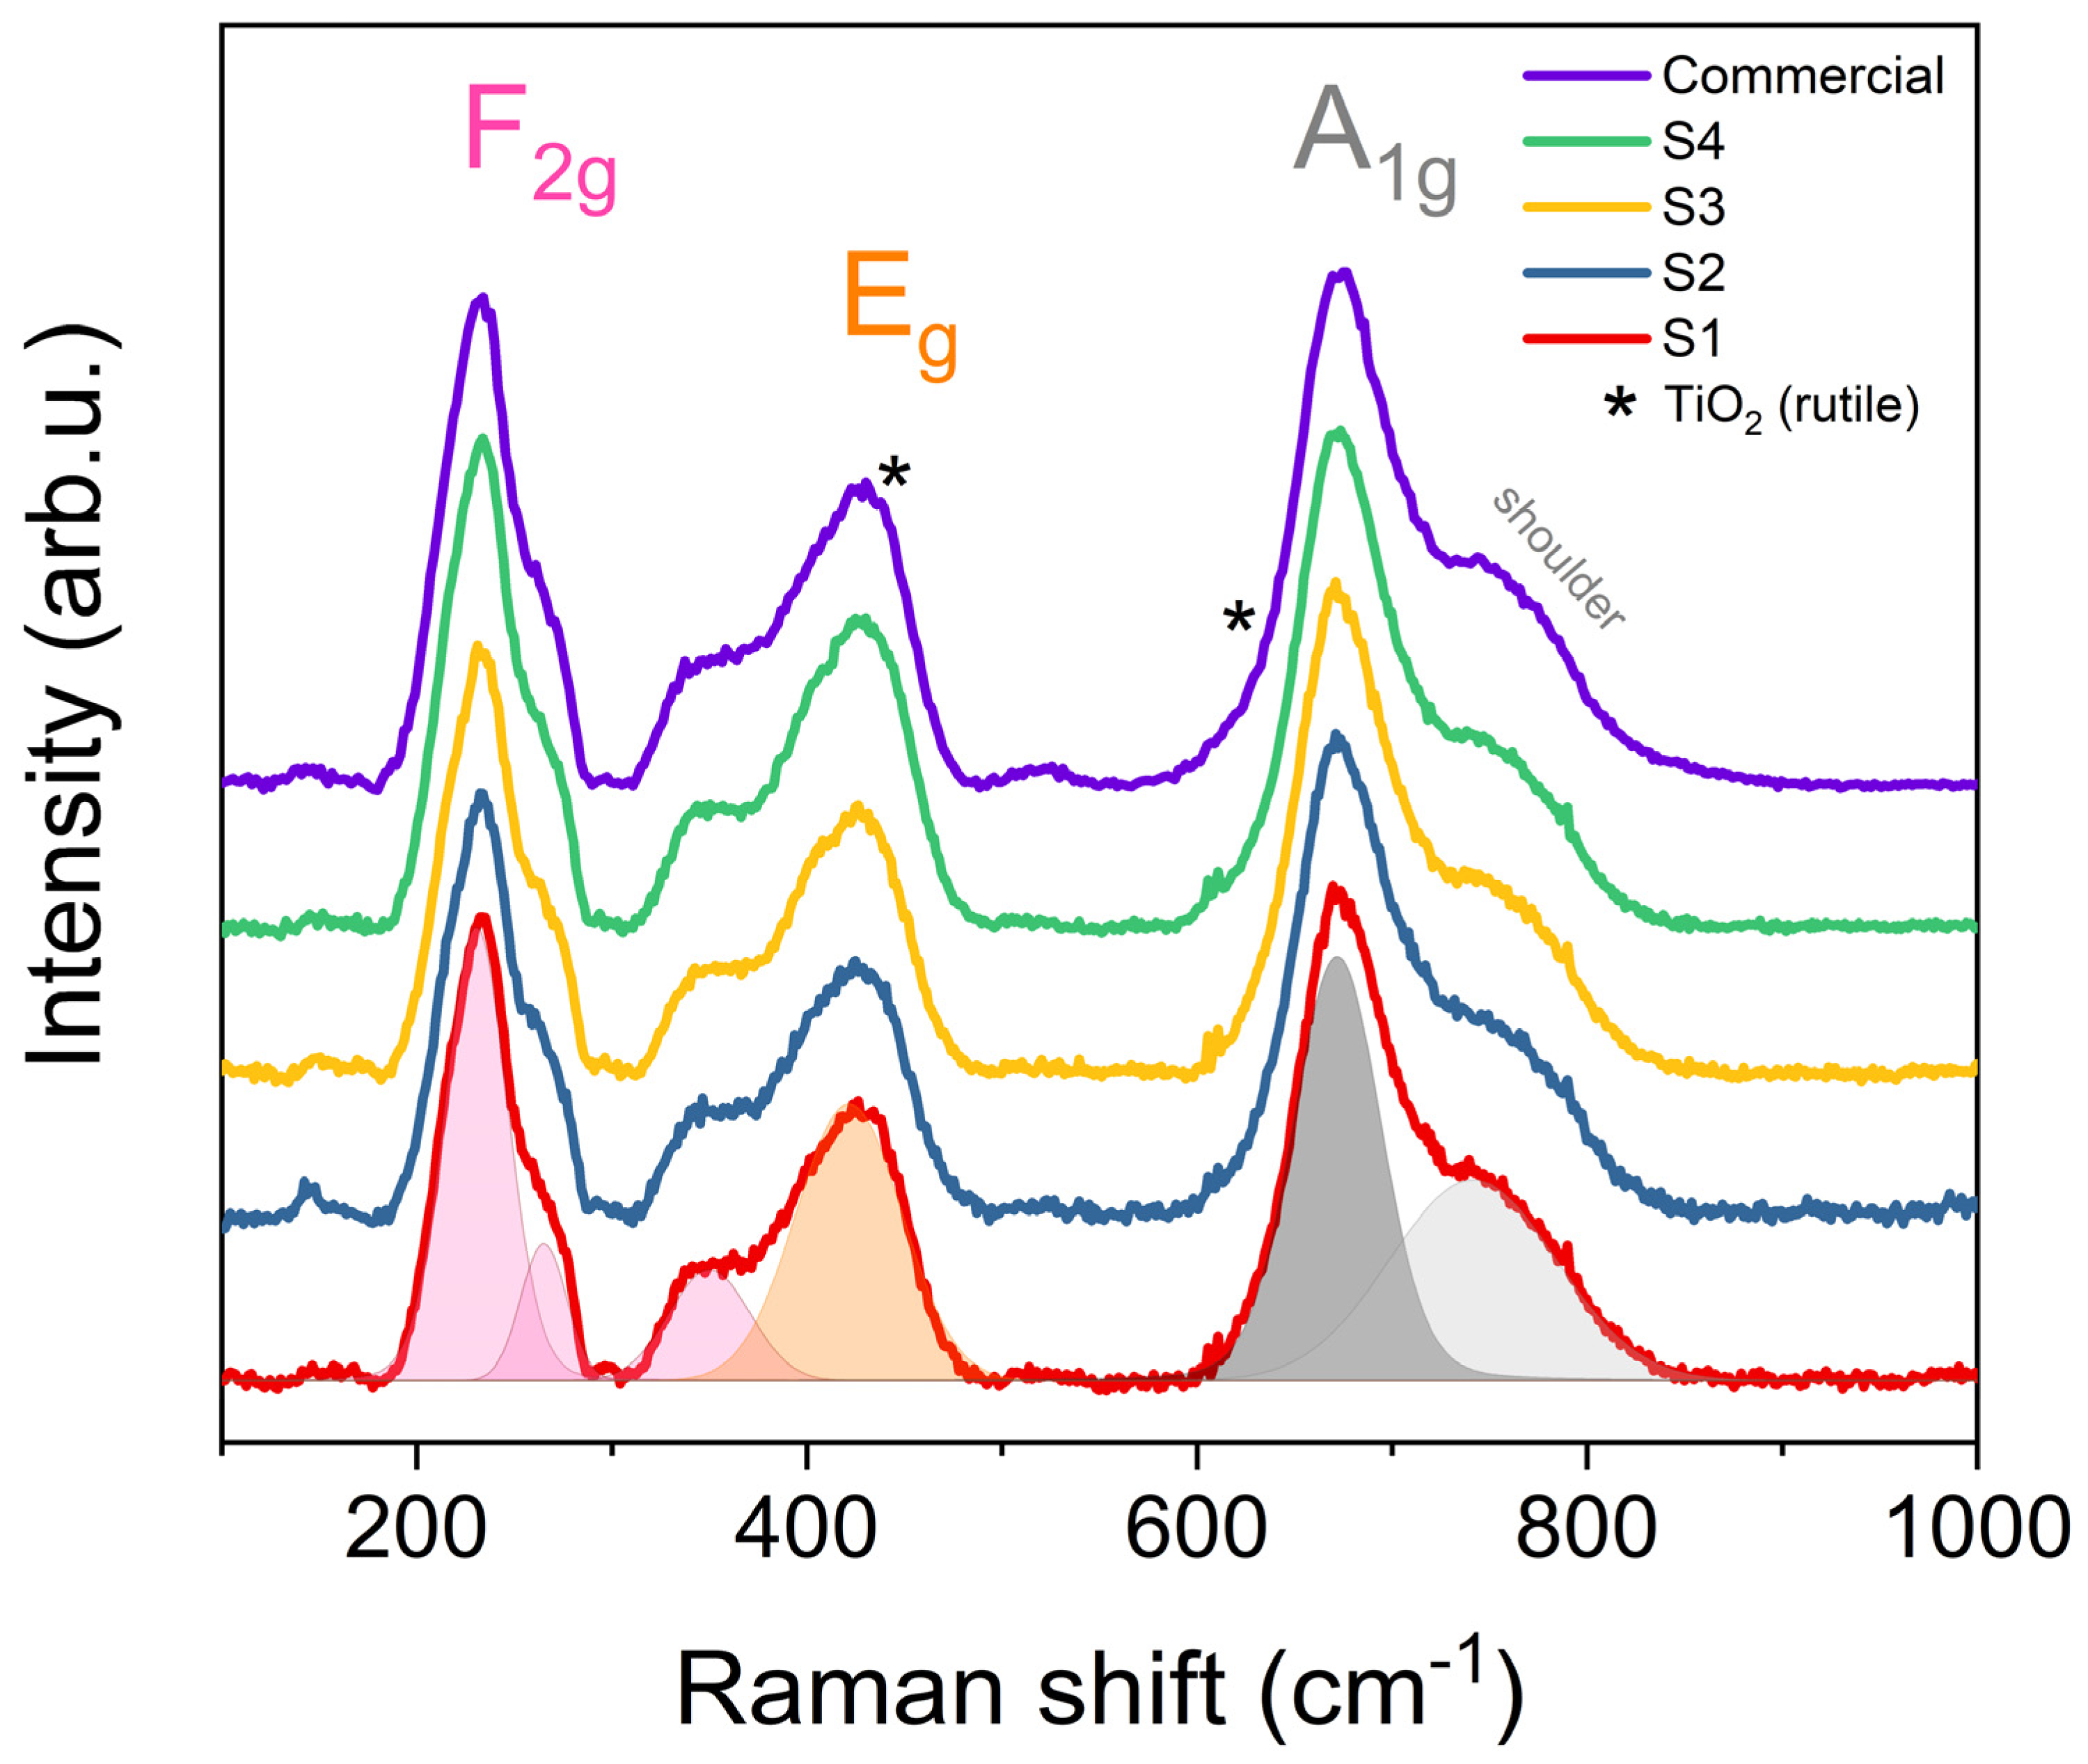
Figure 1. Low-rate (left column) and high-rate (right column) specific discharge capacity of LTO materials as a function of: (a,b) specific surface area, (c,d) particle size determined by SEM and TEM, (e,f) crystal size determined by XRD, and (g,h) electrode mass loading. Details of data points are given in Table S1 [30,36,37,41,42,43,44,45,46,47,48,49,50,51,52,53,54,55,56,57,58,59,60,61,62,63,64,65,66,67,68,69,70,71,72,73,74].
Batteries 08 00168 g001
Figure 2. XRD patterns of sol–gel synthesized LTO and the commercial sample and the theoretical patterns of rutile and spinel structures (* TiO2 phase marked in samples diffractograms).
Batteries 08 00168 g002
Figure 3. Raman spectra of sol–gel synthesized LTO and commercial sample (* TiO2 rutile phase).
Batteries 08 00168 g003
Figure 4. SEM images of pristine sol–gel LTO S1–S4.
Batteries 08 00168 g004
Figure 5. Chronopotentiometry results for sol–gel synthesized LTO and commercial sample: (A) rate capability and (B) discharge curves at 10 C current rate.
Batteries 08 00168 g005
Figure 6. Specific discharge capacity at 10 C vs. specific surface area of sol–gel synthesized LTO (S1–S4) and commercial sample (Com).
Batteries 08 00168 g006
Figure 7. Comparison between high rate performance as a function of the surface area in LTO produced via different synthetic methods [30,36,41,44,45,46,48,50,51,53,54,55,56,57,58,62,63,64,67,69,70,73].
Batteries 08 00168 g007
Table 1. Crystallite sizes and lattice parameters for pristine sol–gel and commercial LTO samples. R—rutile.
SampleAverage Crystal Size (nm)% LTO (Spinel)% TiO2% LiTiO2Lattice Parameter a (Å)
S1148 ± 5100--8.358 ± 0.001
S2144 ± 5100--8.358 ± 0.001
S3148 ± 5100--8.358 ± 0.001
S4141 ± 598.31.7 (R)-8.358 ± 0.001
Com313 ± 597.70.6 (R)1.78.359 ± 0.001
Table 2. BET parameters for the sol–gel synthesized LTO samples and commercial sample.
SampleBET Area (m2 g−1)Dominant Pores (nm)Pore Volume (1.7–300 nm) (cm3 g−1)Particle Size (nm)
S18.23 ± 0.022–3;0.0252208
S212.58 ± 0.042–3;0.0345136
S311.14 ± 0.062–3;0.0288154
S410.97 ± 0.082–3;0.0310156
Com4.43 ± 0.032–3;0.0124387
Table 3. Results of high-rate chronopotentiometry sol–gel synthesized LTO and commercial sample.
SampleElectrode Loading (mg cm−2)1 C 1st Dis. Cap. (mAh g−1)2 C 1st Dis. Cap. (mAh g−1)5 C 1st Dis. Cap. (mAh g−1)10 C 1st Dis. Cap. (mAh g−1)Capacity Retained at 10 C (%)
S11.60 ± 0.19168.1 ± 3.4161.1 ± 4.0144.2 ± 5.4118.3 ± 5.570.4 ± 3.6%
S21.68 ± 0.50169.2 ± 2.2167.4 ± 2.1164.3 ± 2.0157.3 ± 2.593.0 ± 1.9%
S31.47 ± 0.47166.0 ± 4.2162.9 ± 4.2158.5 ± 3.8151.4 ± 3.391.2 ± 3.0%
S41.78 ± 0.09167.0 ± 5.0160.4 ± 6.6149.9 ± 9.0132.0 ± 9.079.0 ± 5.9%
Com1.48 ± 0.19162.2 ± 5.7152.7 ± 7.2129.8 ± 8.699.2 ± 9.761.2 ± 6.4%
Publisher’s Note: MDPI stays neutral with regard to jurisdictional claims in published maps and institutional affiliations.

