


Improvement of Simple Test Cell Design for Cathode Microstructure Study in Tubular-Type Sodium–Metal Chloride Batteries

 , ,
, ,
Abstract
1. Introduction
2. Materials and Methods
2.1. Preparation of Cathode Materials
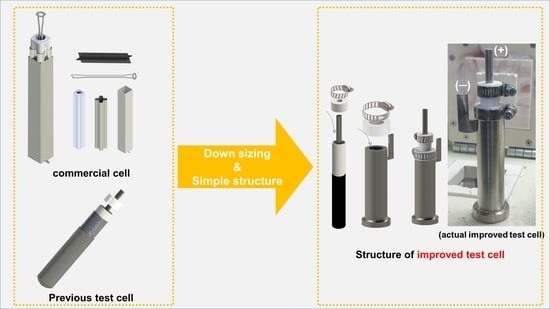
2.2. Design and Fabrication of the Tubular Type Simple Test Cell
2.3. Electrochemical Test Setup
3. Results and Discussion
4. Conclusions
Author Contributions
Funding
Institutional Review Board Statement
Informed Consent Statement
Data Availability Statement
Conflicts of Interest
References
- Wang, Q.; Jiang, L.; Yu, Y.; Sun, J. Progress of enhancing the safety of lithium ion battery from the electrolyte aspect. Nano Energy 2019, 55, 93–114. [Google Scholar] [CrossRef]
- Wang, Y.; Gao, Q.; Wang, G.; Lu, P.; Zhao, M.; Bao, W. A review on research status and key technologies of battery thermal management and its enhanced safety. Energy Res. 2018, 42, 4008–4033. [Google Scholar] [CrossRef]
- Wang, Z.; Zhang, Y.; Jiang, H.; Wei, C.; An, Y.; Tan, L.; Xiong, S.; Feng, J. Free-standing Na2C6O6/MXene composite paper for high performance organic sodium-ion batteries. Nano Res. 2022, 1–8. [Google Scholar] [CrossRef]
- Ellis, B.L.; Nazar, L.F. Sodium and sodium-ion energy storage batteries. Curr. Opin. Solid State Mater. Sci. 2012, 16, 168–177. [Google Scholar] [CrossRef]
- Hueso, K.B.; Armand, M.; Rojo, T. High temperature sodium batteries: Status, challenges and future trends. Energy Environ. Sci. 2013, 6, 734–749. [Google Scholar] [CrossRef]
- Lu, X.; Xia, G.; Lemmon, J.; Yang, Z. Advanced materials for sodium-beta alumina batteries: Status, challenges and perspectives. J. Power Sources 2010, 195, 2431–2442. [Google Scholar] [CrossRef]
- O’Sulivan, T.M.; Bingham, C.M.; Clark, R.E. SPEEDAM 2006. In Proceedings of the International Symposium on Power Electronics, Electrical Drives, Automation and Motion, Taormina, Italy, 23–26 May 2006; p. 243. [Google Scholar]
- Javadi, T.; Petric, A. Thermodynamic Analysis of Reaction Products Observed in ZEBRA Cell Cathodes. J. Electrochem. Soc. 2011, 158, A700–A704. [Google Scholar] [CrossRef]
- Benato, R.; Cosciani, N.; Crugnola, G.; Sessa, S.D.; Lodi, G.; Parmeggiani, C.; Todeschini, M. Sodium nickel chloride battery technology for large-scale stationary storage in the high voltage network. J. Power Sources 2015, 293, 127–136. [Google Scholar] [CrossRef]
- Hosseinifar, M.; Petric, A. Effect of High Charge Rate on Cycle Life of ZEBRA. J. Electrochem. Soc. 2016, 163, A1226–A1231. [Google Scholar] [CrossRef]
- Veneri, O.; Capasso, C.; Patalano, S. Experimental study on the performance of a ZEBRA battery based propulsion system for urban commercial vehicles. Appl. Energy 2017, 185, 2005–2018. [Google Scholar] [CrossRef]
- Bracco, S.; Delfino, F.; Trucco, A.; Zin, S. Electrical storage systems based on Sodium/Nickel chloride batteries: A mathematical model for the cell electrical parameter evaluation validated on a real smart microgrid application. J. Power Sources 2018, 399, 372–382. [Google Scholar] [CrossRef]
- Li, G.; Lu, X.; Kim, J.Y.; Lemmon, J.P.; Sprenkle, V.L. Cell degradation of a Na-NiCl2 (ZEBRA) battery. J. Mater. Chem. A 2013, 1, 14935–14942. [Google Scholar] [CrossRef]
- Kim, S.M.; Lee, S.-M.; Jung, K.; Park, Y.-C.; Cho, N.-U.; Choi, J.-H.; Kim, H.-S. Influence of Carbon Coating on Beta-Alumina Membrane for Sodium-Nickel Chloride Battery. Kor. Chem. Soc. 2015, 36, 2869–2874. [Google Scholar] [CrossRef]
- Kim, J.; Jo, S.H.; Bhavaraju, S.; Eccleston, A.; Kang, S.O. Low temperature performance of sodium-nickel chloride batteries with NaSICON solid electrolyte. J. Electroanal. Chem. 2015, 759, 201–206. [Google Scholar] [CrossRef]
- Kim, S.-M.; Lee, S.-M.; Jung, K.; Park, Y.-C.; Cho, N.-U.; Kim, H.-S. Feasibility Study of a Planar-type Sodium—Nickel Chloride Battery. Kor. Chem. Soc. 2016, 37, 695–699. [Google Scholar] [CrossRef]
- Lu, X.; Chang, H.J.; Bonnett, J.F.; Canfield, N.L.; Jung, K.; Sprenkle, V.L.; Li, G. Effect of cathode thickness on the performance of planar Na-NiCl2 battery. J. Power Sources 2017, 365, 456–462. [Google Scholar] [CrossRef]
- Chang, H.J.; Canfield, N.L.; Jung, K.; Sprenkle, V.L.; Li, G. Advanced Na-NiCl2 Battery Using Nickel-Coated Graphite with Core—Shell Microarchitecture. ACS Appl. Mater. Interfaces 2017, 9, 11609–11614. [Google Scholar] [CrossRef]
- Chang, H.J.; Lu, X.; Bonnett, J.F.; Canfield, N.L.; Son, S.; Park, Y.-C.; Jung, K.; Sprenkle, V.L.; Li, G. Development of intermediate temperature sodium nickel chloride rechargeable batteries using conventional polymer sealing technologies. J. Power Sources 2017, 348, 150–157. [Google Scholar] [CrossRef]
- Li, G.; Lu, X.; Kim, J.Y.; Meinhardt, K.D.; Chang, H.J.; Canfield, N.L.; Sprenkle, V.L. Advanced intermediate temperature sodium-nickel chloride batteries with ultra-high energy density. Nat. Commun. 2016, 7, 10683. [Google Scholar] [CrossRef]
- Li, Y.; Wu, X.; Wang, J.; Gao, X.; Hu, Y.; Wen, Z. Ni-less cathode with 3D free-standing conductive network for planar Na-NiCl2 batteries. Chem. Eng. J. 2020, 387, 124059. [Google Scholar] [CrossRef]
- Li, Y.; Shi, L.; Gao, X.; Wang, J.; Hu, Y.; Wu, X.; Wen, Z. Constructing a charged-state Na-NiCl2 battery with NiCl2/graphene aerogel composite as cathode. Chem. Eng. J. 2021, 421, 127853. [Google Scholar] [CrossRef]
- Li, G.; Lu, X.; Kim, J.Y.; Viswanathan, V.V.; Meinhardt, K.D.; Engelhard, M.H.; Sprenkle, V.L. An Advanced Na-FeCl2 ZEBRA Battery for Stationary Energy Storage Application. Adv. Energy Mater. 2015, 5, 1500357. [Google Scholar] [CrossRef]
- Ahn, B.-M.; Ahn, C.-W.; Hahn, B.-D.; Choi, J.-J.; Kim, Y.-D.; Lim, S.-K.; Jung, K.; Park, Y.-C.; Choi, J.-H. Easy approach to realize low cost and high cell capacity in sodium nickel-iron chloride battery. Compos. Part B 2019, 168, 442–447. [Google Scholar] [CrossRef]
- Ahn, B.-M.; Ahn, C.-W.; Hahn, B.-D.; Choi, J.-J.; Kim, Y.-D.; Lim, S.-K.; Choi, J.-H. Effect of Cathode Microstructure on Electrochemical Properties of Sodium Nickel-Iron Chloride Batteries. Materials 2021, 14, 5605. [Google Scholar] [CrossRef]


| Cell Name | Cell Type | Charge Capacity (%, the 1st Cycle) | Maximum Capacity Gap (%) | |
|---|---|---|---|---|
| PTC-1 | Na/NiCl2 | Previous test cell (Ni foil type) | 87.3 | 37.2 |
| PTC-2 | 62.8 | |||
| PTC-3 | 100 | |||
| ITC-1 | Improved test cell (Ni case type) | 93.6 | 9.5 | |
| ITC-2 | 100 | |||
| ITC-3 | 90.5 | |||
| Cell Name | Cell Type | Maintained Range of 200 mAh g−1 | |
|---|---|---|---|
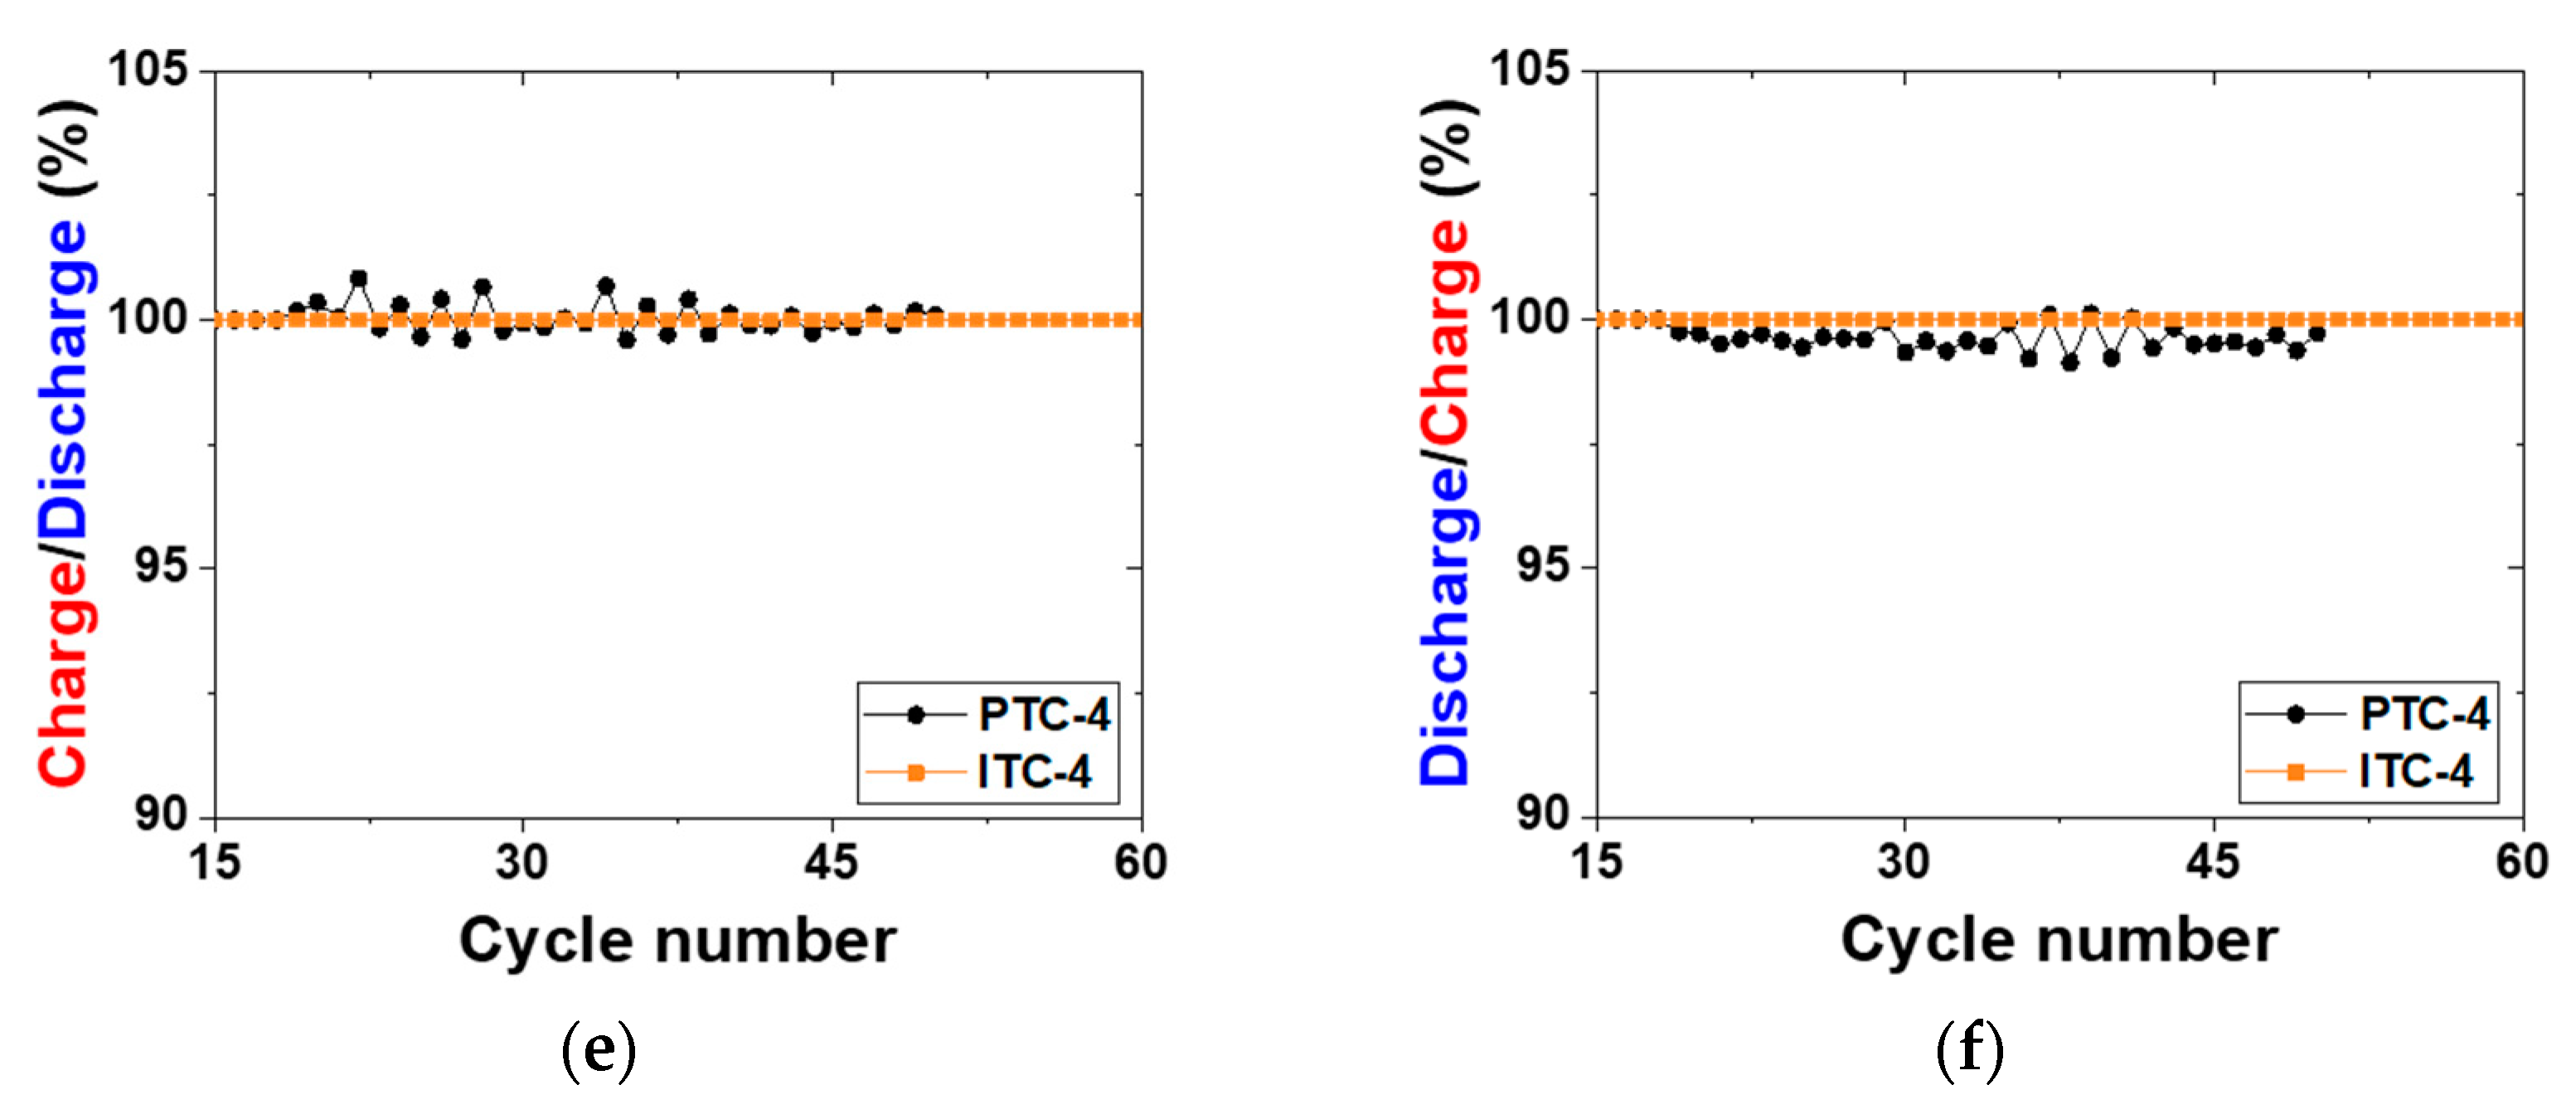
| PTC-4 | Na/(Ni, Fe)Cl2 | Previous test cell | To 23 cycles |
| ITC-4 | Improved test cell | To 554 cycles | |
Publisher’s Note: MDPI stays neutral with regard to jurisdictional claims in published maps and institutional affiliations. |
© 2022 by the authors. Licensee MDPI, Basel, Switzerland. This article is an open access article distributed under the terms and conditions of the Creative Commons Attribution (CC BY) license (https://creativecommons.org/licenses/by/4.0/).
Share and Cite
Ahn, B.-M.; Ahn, C.-W.; Hahn, B.-D.; Choi, J.-J.; Kim, Y.-D.; Lim, S.-K.; Choi, J.-H. Improvement of Simple Test Cell Design for Cathode Microstructure Study in Tubular-Type Sodium–Metal Chloride Batteries. Batteries 2022, 8, 163. https://doi.org/10.3390/batteries8100163
Ahn B-M, Ahn C-W, Hahn B-D, Choi J-J, Kim Y-D, Lim S-K, Choi J-H. Improvement of Simple Test Cell Design for Cathode Microstructure Study in Tubular-Type Sodium–Metal Chloride Batteries. Batteries. 2022; 8(10):163. https://doi.org/10.3390/batteries8100163
Chicago/Turabian StyleAhn, Byeong-Min, Cheol-Woo Ahn, Byung-Dong Hahn, Jong-Jin Choi, Yang-Do Kim, Sung-Ki Lim, and Joon-Hwan Choi. 2022. "Improvement of Simple Test Cell Design for Cathode Microstructure Study in Tubular-Type Sodium–Metal Chloride Batteries" Batteries 8, no. 10: 163. https://doi.org/10.3390/batteries8100163
APA StyleAhn, B.-M., Ahn, C.-W., Hahn, B.-D., Choi, J.-J., Kim, Y.-D., Lim, S.-K., & Choi, J.-H. (2022). Improvement of Simple Test Cell Design for Cathode Microstructure Study in Tubular-Type Sodium–Metal Chloride Batteries. Batteries, 8(10), 163. https://doi.org/10.3390/batteries8100163