Article

Sensor Fault Detection and Isolation for Degrading Lithium-Ion Batteries in Electric Vehicles Using Parameter Estimation with Recursive Least Squares

Department of Chemical Engineering, University of Waterloo, Waterloo, ON N2L 3G1, Canada
*
Author to whom correspondence should be addressed.
Batteries 2020, 6(1), 1; https://doi.org/10.3390/batteries6010001
Submission received: 4 October 2019 / Revised: 9 December 2019 / Accepted: 17 December 2019 / Published: 20 December 2019
(This article belongs to the Special Issue Battery Management Systems of Electric and Hybrid Electric Vehicles)

Abstract

:
With the increase in usage of electric vehicles (EVs), the demand for Lithium-ion (Li-ion) batteries is also on the rise. The battery management system (BMS) plays an important role in ensuring the safe and reliable operation of the battery in EVs. Sensor faults in the BMS can have significant negative effects on the system, hence it is important to diagnose these faults in real-time. Existing sensor fault detection and isolation (FDI) methods have not considered battery degradation. Degradation can affect the long-term performance of the battery and cause false fault detection. This paper presents a model-based sensor FDI scheme for a Li-ion cell undergoing degradation. The proposed scheme uses the recursive least squares (RLS) method to estimate the equivalent circuit model (ECM) parameters in real time. The estimated ECM parameters are put through weighted moving average (WMA) filters, and then cumulative sum control charts (CUSUM) are implemented to detect any significant deviation between unfiltered and filtered data, which would indicate a fault. The current and voltage faults are isolated based on the responsiveness of the parameters when each fault occurs. The proposed FDI scheme is then validated through conducting a series of experiments and simulations.

1. Introduction

Lithium-ion (Li-ion) batteries are the most popular form of energy storage in the world, amounting to 85.6% of energy storage systems utilized in 2015. Although it has the highest price, it shows the lowest cost per cycle [1]. The substantial demand for Li-ion batteries is due to portable devices and electric vehicles (EVs). Li-ion batteries are used in EVs due to their high power and energy density, long life span, and low environmental impact. EVs require a battery system that consists of hundreds or thousands of single cells. In order to manage this large number of cells, the battery pack needs a battery management system (BMS). It is important that the performance of the BMS is accurate and reliable, to ensure the performance and safety in EVs application. The functions of the BMS include state of charge (SOC) and state of health (SOH) estimation, and over-current and over-voltage protection [2]. These functions rely heavily on voltage and current sensor measurements [3]. It is possible for the sensors to experience malfunctions during the operation of the battery, due to manufacturing defects or environmental factors. The estimation of the SOC (similar to a fuel meter in conventional vehicles) and the SOH (similar to an odometer), would be affected if there were any faults with the sensors, leading to over-charge and/or over-discharge phenomenon which would degrade the battery faster. The current and voltage protection would also fail to work properly due to faulty sensors. This can lead to more catastrophic failures since the current and voltage can exceed their operational limits undetected, due to incorrect sensor readings [4]. Even though a sensor fault with a small magnitude does not immediately affect the battery performance, it can have a significant effect over time. This can be prevented by detecting and resolving the sensor fault promptly after it develops. Although the authors are not aware of any published data on the failure rates of BMS sensors in EVs, it is reasonable to anticipate some failures due to the nature of the application. The sensors are subject to vibration and physical damage from collisions, which can ultimately lead to disconnection or resistance build-up of the wires and cause deviations in the readings. Therefore, it is critical to develop an algorithm that can reliably and accurately diagnose any faulty operation of the voltage and current sensors in real time.
The reviews on fault mechanism and diagnosis approaches for Li-ion batteries can be found in [2,5]. Desirable characteristics of a fault detection and isolation (FDI) scheme include quick detection and diagnosis, isolability, robustness, adaptability, low modelling requirements, and a reasonable balance between storage and computational requirements [6]. Several existing FDI methods were able to accomplish some of the desired characteristics stated above. An extended Kalman filter was used in [4] to diagnose sensor faults, but fault isolation was not achieved. This study confirms that the battery can be over-charged or over-discharged due to sensor faults, caused by the inaccuracy of SOC estimation. In [7], the nonlinear parity equation approach, coupled with sliding mode observers, were used to develop an FDI scheme to detect sensor faults for a single battery cell. A set of Luenberger and learning observers were used in [8] for simultaneous single-fault isolation and estimation of a faulty cell in a battery string. In [9], an FDI strategy using structural analysis theory and statistical inference residual evaluation was presented, but the computational effort was rather high. An FDI scheme using sliding mode observers with equivalent output error injection was introduced in [10], with findings that show false detection rate is affected by the variation in model parameters. All of the methods mentioned above work under the assumption that the battery model parameters remain constant throughout the battery pack’s life span. However, the parameters can be affected by degradation, a significant property of battery operation. There has not been any mention of cell degradation in any FDI works or literature.
There are a few models used to illustrate battery behavior, but the equivalent circuit model (ECM) is the most widely used in FDI works [5]. The parameters of the ECM were derived using conservation of species, conservation of charge, and reaction kinetics in [11]. The results show that the parameters have physical meanings and can be affected by the chemistry of the battery, as well as the environment of operation. Therefore, degradation of the battery would have some effects on the parameters. The existing FDI schemes can be improved by integrating degradation into the ECM. However, this has been proven to be a difficult task. Currently, battery degradation models can be obtained by fitting experimental data under constant conditions. However, this is not an appropriate model for battery degradation in EVs applications, due to its complex operating state [12]. Experimental models are also less accurate, time-consuming, and costly. Adaptive models are more accurate, but require training to estimate the parameters that correlate with degradation. Moreover, the models can have high computational effort which is not suitable for real-time BMS applications [13]. Another approach is needed to effectively diagnose faults while considering the effect of degradation on ECM parameters, which this paper will present.
The key contribution of this paper is the proposal of a model-based sensor FDI scheme for Li-ion battery in EVs while considering battery degradation. The ECM parameters are expected to change during battery operation due to the effect of degradation. The paper studies and confirms this effect through a series of experiments. The proposed FDI scheme uses the recursive least squares (RLS) method to estimate the ECM parameters in real time, then applies a weighted moving average (WMA) filter coupled with a cumulative sum control chart (CUSUM) to detect any voltage and current sensor faults. The use of RLS is suggested because of its low computational demand and easy implementation [14]. The implementation of the WMA filter eliminates the concern of battery degradation, in addition to the effect of SOC and temperature on ECM parameters. Furthermore, the sensor faults are isolated based on the responsiveness of the parameters when a specific fault occurs. Finally, the Urban Dynamometer Driving Schedule (UDDS) cycle with sensor fault simulation is applied to validate and evaluate the performance of the proposed FDI scheme for a lithium iron phosphate (LFP) cell.
The rest of this paper is organized as follows: Section 2 describes the battery model used for this work, while Section 3 outlines the details of the proposed FDI scheme. Section 4 provides the experimental design and analysis of the effect of degradation and various faults on the parameters. The evaluation of the proposed fault diagnosis scheme is presented in Section 5, and the resulting conclusions are given in Section 6.

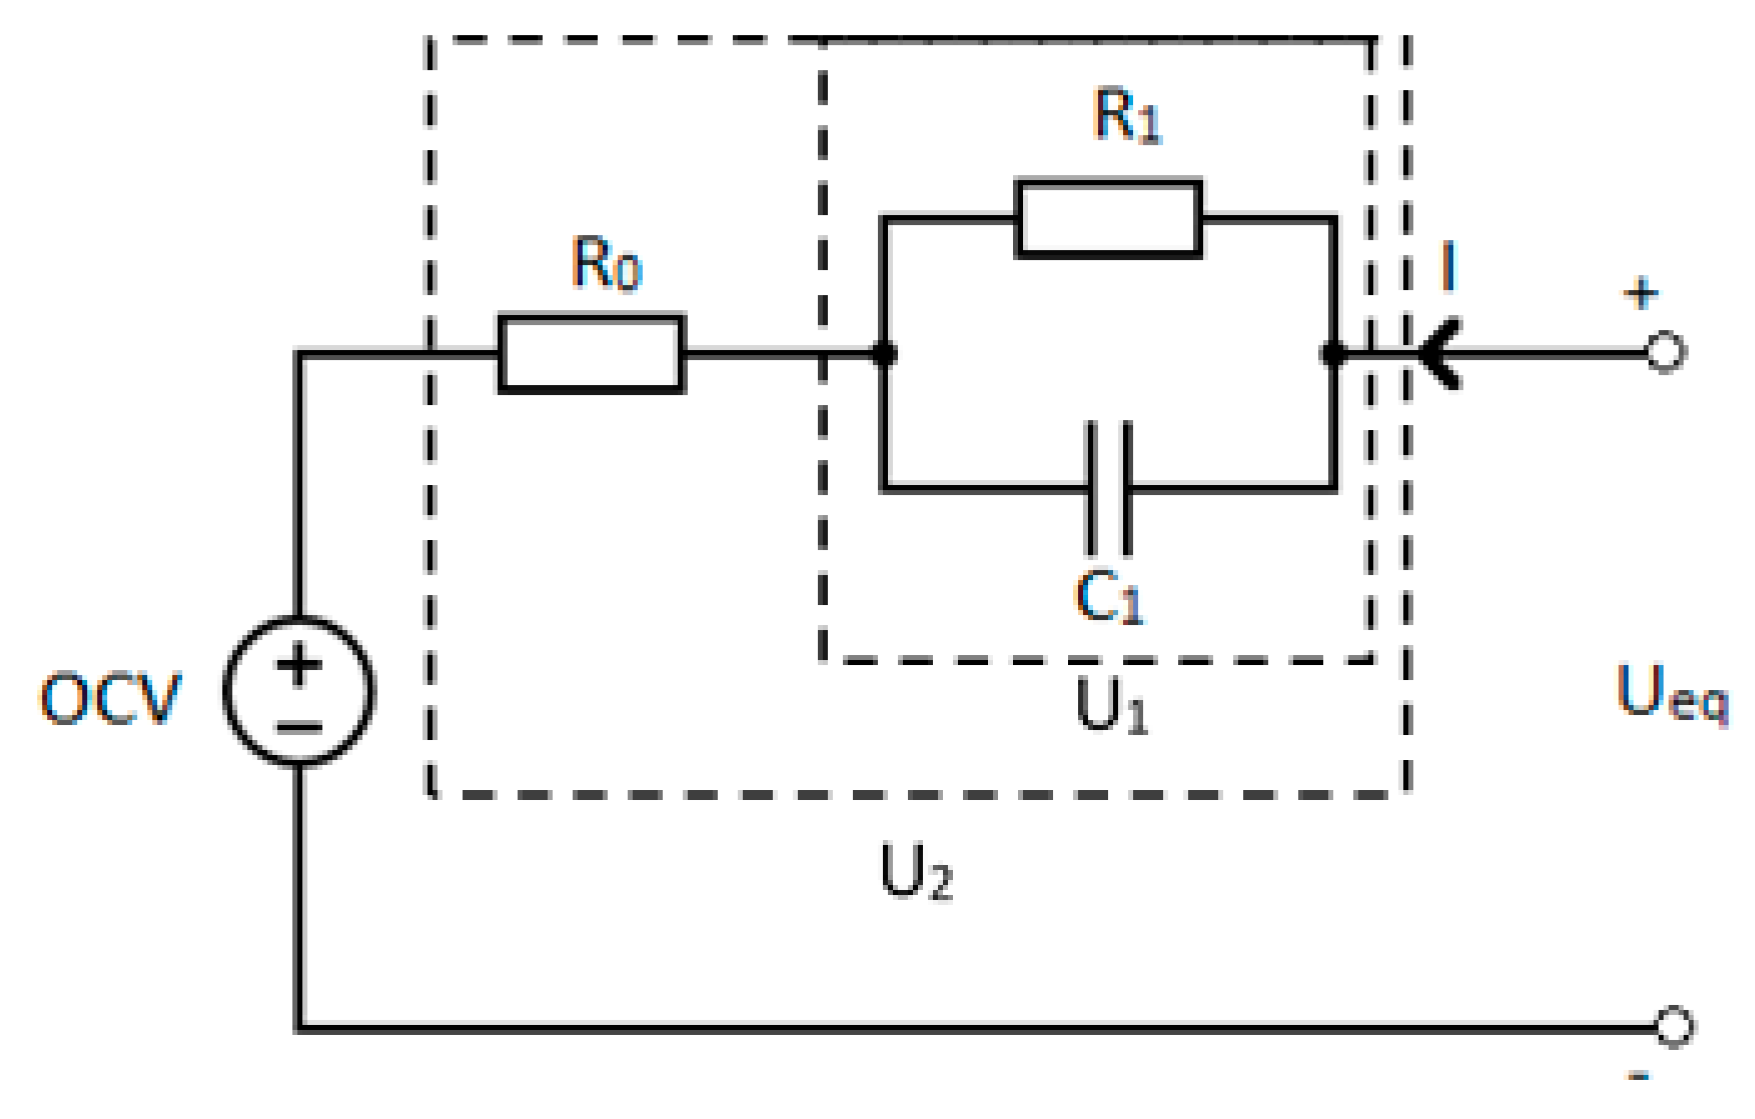
2. Battery Modelling

The most common model used to describe battery behaviors in EVs application is the equivalent circuit model. For an LFP battery running drive cycles that are highly dynamic, such as UDDS, an ECM with at least two RC pairs is recommended [15]. This is because the first order ECM neglects the effect of diffusion. However, the higher the model order is, the more computational effort it demands, due to the larger number of model parameters. For the implementation of the proposed FDI, it is not required for the model to have great accuracy, since the extraction of ECM parameters is used to monitor the state of battery operation, rather than to model the battery performance. Therefore, in order to optimize the computational complexity of the approach, the first order ECM is used in this paper. The simplified ECM model is shown in Figure 1.
The state space equation of this battery model can be expressed as follows:
U 1 ˙ = I C 1 U 1 C 1 R 1 U e q = O C V U 1 I R 0
In order to perform the proposed recursive approach on the model, an autoregressive exogenous model is needed. This is done through obtaining the transfer function of the battery impedance from Equation (1) in the s-domain, as shown in Equation (2). The transfer function is then discretized using the basic forward Euler transformation method, in which s is replaced by 1 z 1 T . z 1 , where T is the sampling time. The discretization is shown in Equation (3) below.
G ( s ) = U 2 ( s ) I ( s ) = R 0 R 1 1 + s R 1 C 1
G ( z ) = a 2 + a 3 z 1 1 + a 1 z 1
where
a 1 = T R 1 C 1 1
a 2 = R 0
a 3 = R 0 T C 1 T R 0 R 1 C 1
R1 and C1 can be determined as follows:
R 1 = a 1 a 2 a 3 1 + a 1
C 1 = T a 1 a 2 a 3
The autoregressive exogenous model can then be obtained as follows:
y k = O C V k + a 1 ( O C V k 1 y k 1 ) + I k a 2 + I k 1 a 3
with y k , which can be rewritten as:
y k = θ k T ϕ k
where
θ k = [ 1 ; a 1 , k ; a 2 , k ; a 3 , k ]
ϕ k = [ O C V k ; ( O C V k 1 y k 1 ) ; I k ; I k 1 ]
The values for OCV (open-circuit voltage) in Equation (12) will be determined from the OCV–SOC relationship, established experimentally. This reduces the computational effort for θ k , which gives more accurate ECM parameter estimations. Equations (10)–(12) will be used in the proposed RLS algorithm, and Equations (5), (7), and (8) will be used to extract the ECM parameters for the purpose of fault diagnosis.

3. Proposed Fault Diagnosis Scheme

In other industrial applications, parameter estimation is a common fault diagnosis method, due to its ability to be implemented online. The method involves the online estimation of the parameters, and the results are compared with a reference model [16]. For real-time identification of ECM parameters, the RLS method is selected because it has low computational demand, fast convergence speed, and can easily be implemented in an embedded system [14]. In this particular case, this method can estimate the model parameters, while adapting to their changes with the degradation and operational conditions of the battery [17]. The resulting estimations are in the form of a time series, for which a change point detection method can be used to diagnose faults [18]. The change point detection method proposed in this paper consists of a WMA filter and a CUSUM control chart.

3.1. Recursive Least Squares Estimation

The RLS algorithm used in this paper employs an optimal forgetting factor to give more weight to recent data, and avoid the saturation phenomenon [19]. The forgetting factor is applied to the parameter vector θ k . The recursive algorithm of Equation (10) can be represented as follows:
K k = P k 1 ϕ k λ + ϕ k T P k 1 ϕ k
P k = P k 1 K k ϕ k T P k 1 λ
θ ^ k = θ ^ k 1 + K k ( y k θ ^ k 1 T ϕ k )
where θ ^ k is the estimated parameter vector θ k , K k is the algorithm gain, P k is the covariance matrix, and λ is the forgetting factor, which will be optimized in the range of [0.95, 1]. The values of θ 0 and P 0 are initially guessed. The schematic diagram for the RLS algorithm is shown in Figure 2.

3.2. Sensor Faults

A fault is defined as a deviation of at least one property or parameter of the system from the standard condition. Faults are commonly classified as actuator faults, sensor faults, and component/parameter faults. They can affect the control action from the controller, produce measurement errors, or change the input/output properties of the system, which leads to degradation and damage of the system [20]. This paper focuses on sensor faults.
Readings from the sensors in the BMS have an important role in estimating other characteristics of the battery. For instance, the measurements from voltage and current sensors can affect the estimation of SOC. A ±1 mV voltage accuracy system used to calculate SOC in a lithium nickel manganese cobalt oxide (NMC) cell can have a base error of 0.2%. If the same accuracy is used to acquire a lithium iron phosphate (LFP) cell’s SOC, then a base error of 5.9% can be expected [21].
The BMS current and voltage sensors used in EVs application can be affected by two types of fault: bias (offset), and gain (scaling) faults. Bias fault is a constant offset from the sensor signal during normal operation. Gain fault happens when the measurement magnitudes are scaled by a factor, while the signal form itself does not change. The faults are considered additive and can be modelled as follows [4]:
y ˜ = y + f
where y ˜ is the measured value of current and voltage from the sensors, y is the actual current or voltage, and f is the sensor fault.

3.3. Online Fault Detection Using Weighted Moving Average Filter and Cumulative Sum Control Chart

WMA is a low-pass filter that is used for smoothing fluctuations, such as noise in a time series, to allow for more reliable trend analysis. Additionally, one can use WMA to compute short-term forecasts of time series [22]. The RLS-estimated ECM parameters are time series that contain noise and small fluctuations due to operational conditions (SOC and temperature) and degradation of the cells. A fault, however, is expected to affect the parameters more significantly. Therefore, the difference between WMA-filtered and unfiltered values of the ECM parameters during normal operation of the battery should be considerably smaller than when a fault first occurs. The WMA chosen for the proposed FDI is a two-term WMA to minimize storage requirement. The formula is presented in Equation (17).
P f , k = λ W M A P i , k + ( 1 λ W M A ) P f , k 1
where P f , k is the kth WMA value, P i , k is the kth unfiltered value obtained from RLS ( P represents R 0 , R 1 , and C 1 ), and λ W M A is the weighting factor. The discrepancy between P f , k and P i , k is characterized by an absolute fractional error term, as shown in Equation (18).
e ( P k ) = | P i , k P f , k P f , k |
The error is monitored using CUSUM, a common change-point detection algorithm, which accumulates deviations of data and signals when the cumulative sum exceeds a certain threshold. The algorithm is outlined in Equation (19) below [23]:
S ( e ( P k ) )   = max { 0 , S ( e ( P k 1 ) ) +   e ( P k )     ( µ 0   L σ ) }
where S is the cumulative sum value, S ( e ( P 0 ) )   = 0 ; e is the absolute fractional error from Equation (18); µ 0 and σ are the mean and standard deviation of the error population; and L is a specified constant.
In this paper, the λ W M A value from Equation (17) is set to 0.01, since it is more favourable for the filter to obtain a smooth line which can adapt to minor changes over a long period of time, such as noise or degradation effect. In Equation (19), the expected value for µ 0 is 0, and σ is estimated experimentally. During normal operation, the unfiltered values should not deviate from the smooth filtered line, because the amplitude of fluctuation is not significant. When a fault occurs, the unfiltered values would diverge significantly from the smooth filtered series. The CUSUM algorithm detects this divergence by indicating a fault ( F ( P k ) = 1 ) when S ( e ( P k ) ) exceeds an experimentally calibrated threshold J , as shown in Equation (20). When a fault is detected, the BMS will produce an alarm; and appropriate actions, such as replacing the faulty sensor, will be taken to resolve the fault.
F ( P k )   =   { 1     i f   S ( e ( P k ) )   >   J   0   i f   S ( e ( P k ) )   <   J  
The method outlined in this section can only be used for fault detection, not fault isolation. The full proposed FDI scheme will be shown in Section 4.5, after determining the effects of different sensor faults on ECM parameters. Since there has not been any work done in literature to determine fault effects on parameters, preliminary experiments will need to be performed to obtain this data before completing the full FDI scheme. The isolation will be based on the response time of the parameters when a certain fault occurs.

4. Effect of Degradation and Faults on ECM Parameters

In order to determine and validate the effect of degradation and faults on the ECM parameters, testing was done on an LFP pouch cell in a laboratory environment. The specifications of the cell at the initial state are listed in Table 1.

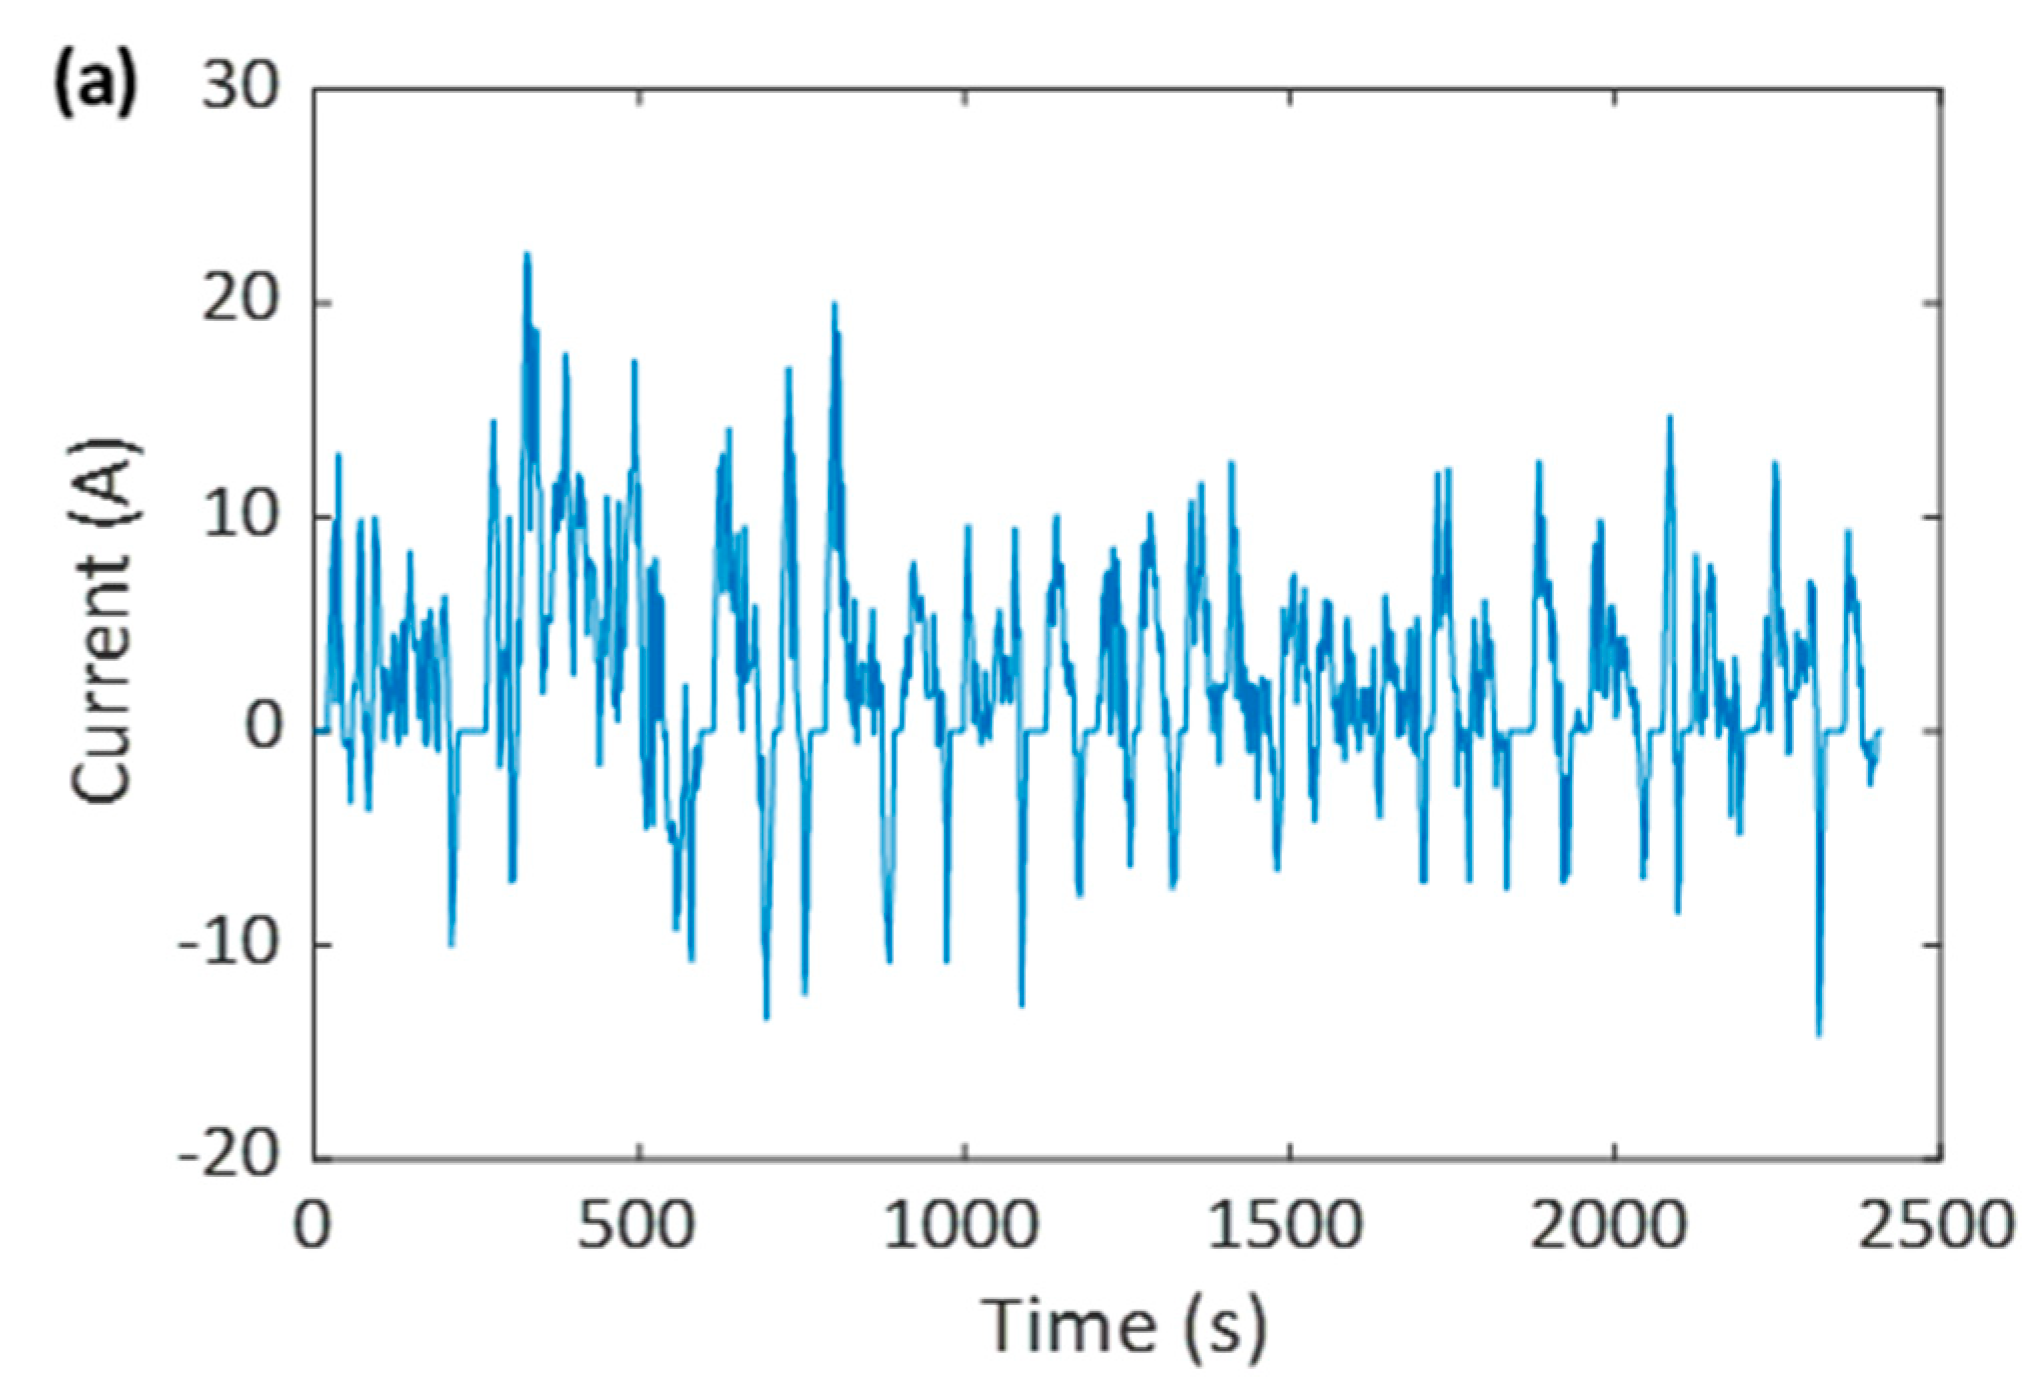
4.1. Experimental Setup

The experimental setup consists of a battery test system (Maccor 4200), connected to a testing station and a computer. The full setup is shown in Figure 3. All experiments were carried out at a room temperature of 23 °C. The computer has a software program that controls the battery test system to charge and discharge the cell. The current is assumed to be positive when discharging, and negative when charging. The data was collected at a frequency of 1 Hz, and then stored in the computer. Two test profiles were used: a set of multiple UDDS driving cycles, and a degradation cycle. The UDDS cycle is a velocity profile, and was translated and scaled into a current profile. It was run from the cell SOC of 95% to 20%. The degradation cycle involves charging and discharging multiple times between the extreme limits of the cell to degrade it quickly. Profiles of these cycles are shown in Figure 4. Characterization of the cell was also done through performing the OCV–SOC and capacity tests [24]. The sequence of tests began with cell characterization, then the testing cycle (UDDS and degradation), and all were repeated multiple times.

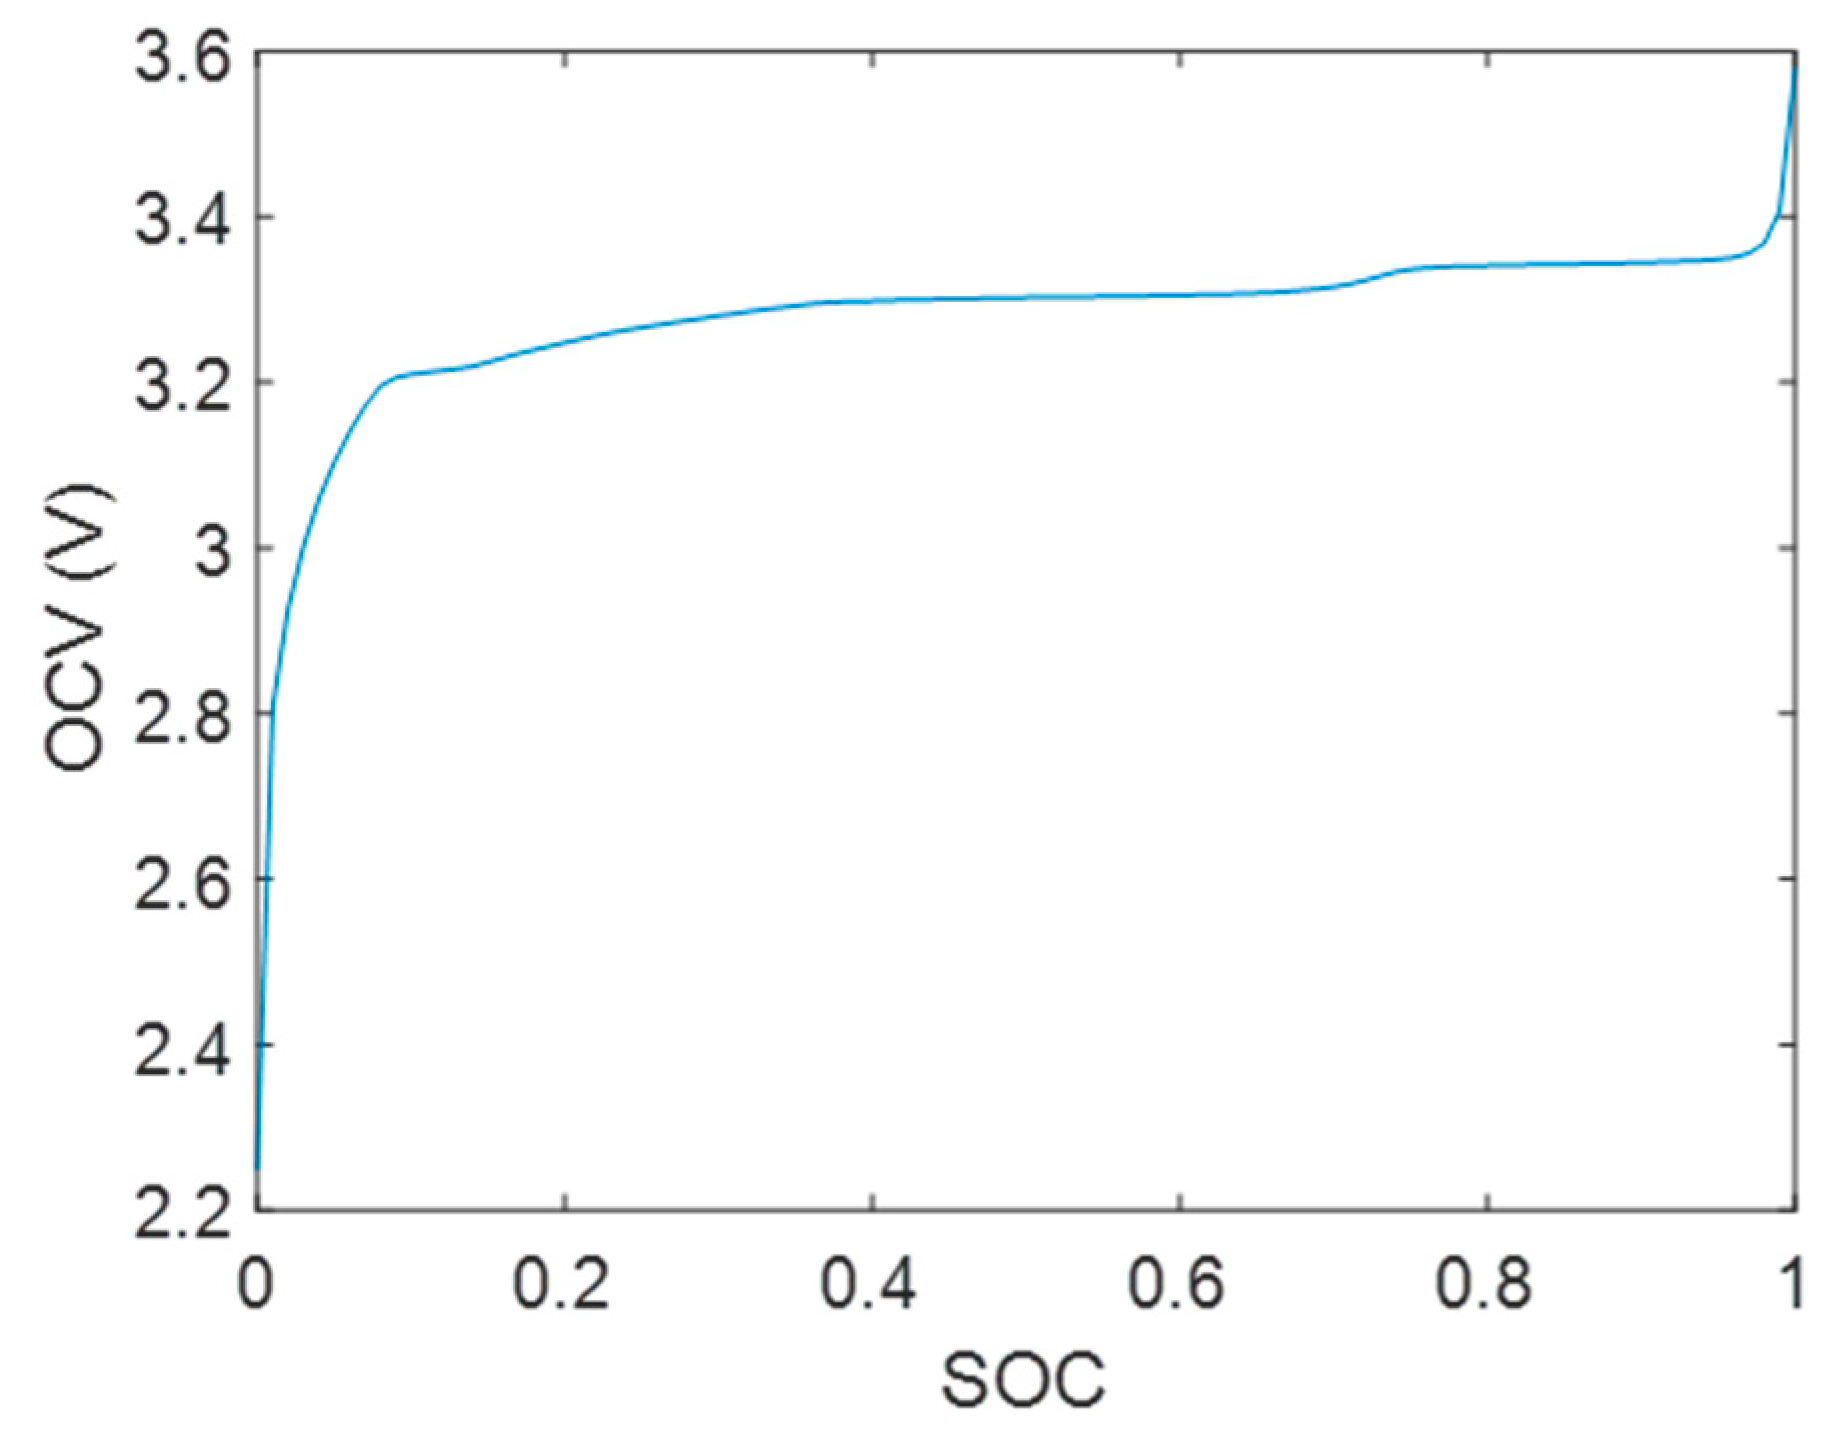
4.2. Cell Characterization Results

The cell capacity was captured at the beginning of each testing cycle, and it best represents the cell degradation since capacity decreases with degradation [12]. The results are presented in Table 2. The OCV–SOC relationship was also established and a look-up table was built, which was needed to estimate the cell OCV for the RLS algorithm. The OCV–SOC curve was found to change minimally with cell degradation, hence only one curve was used for all cell capacities in the RLS algorithm. The results can be seen in Figure 5.

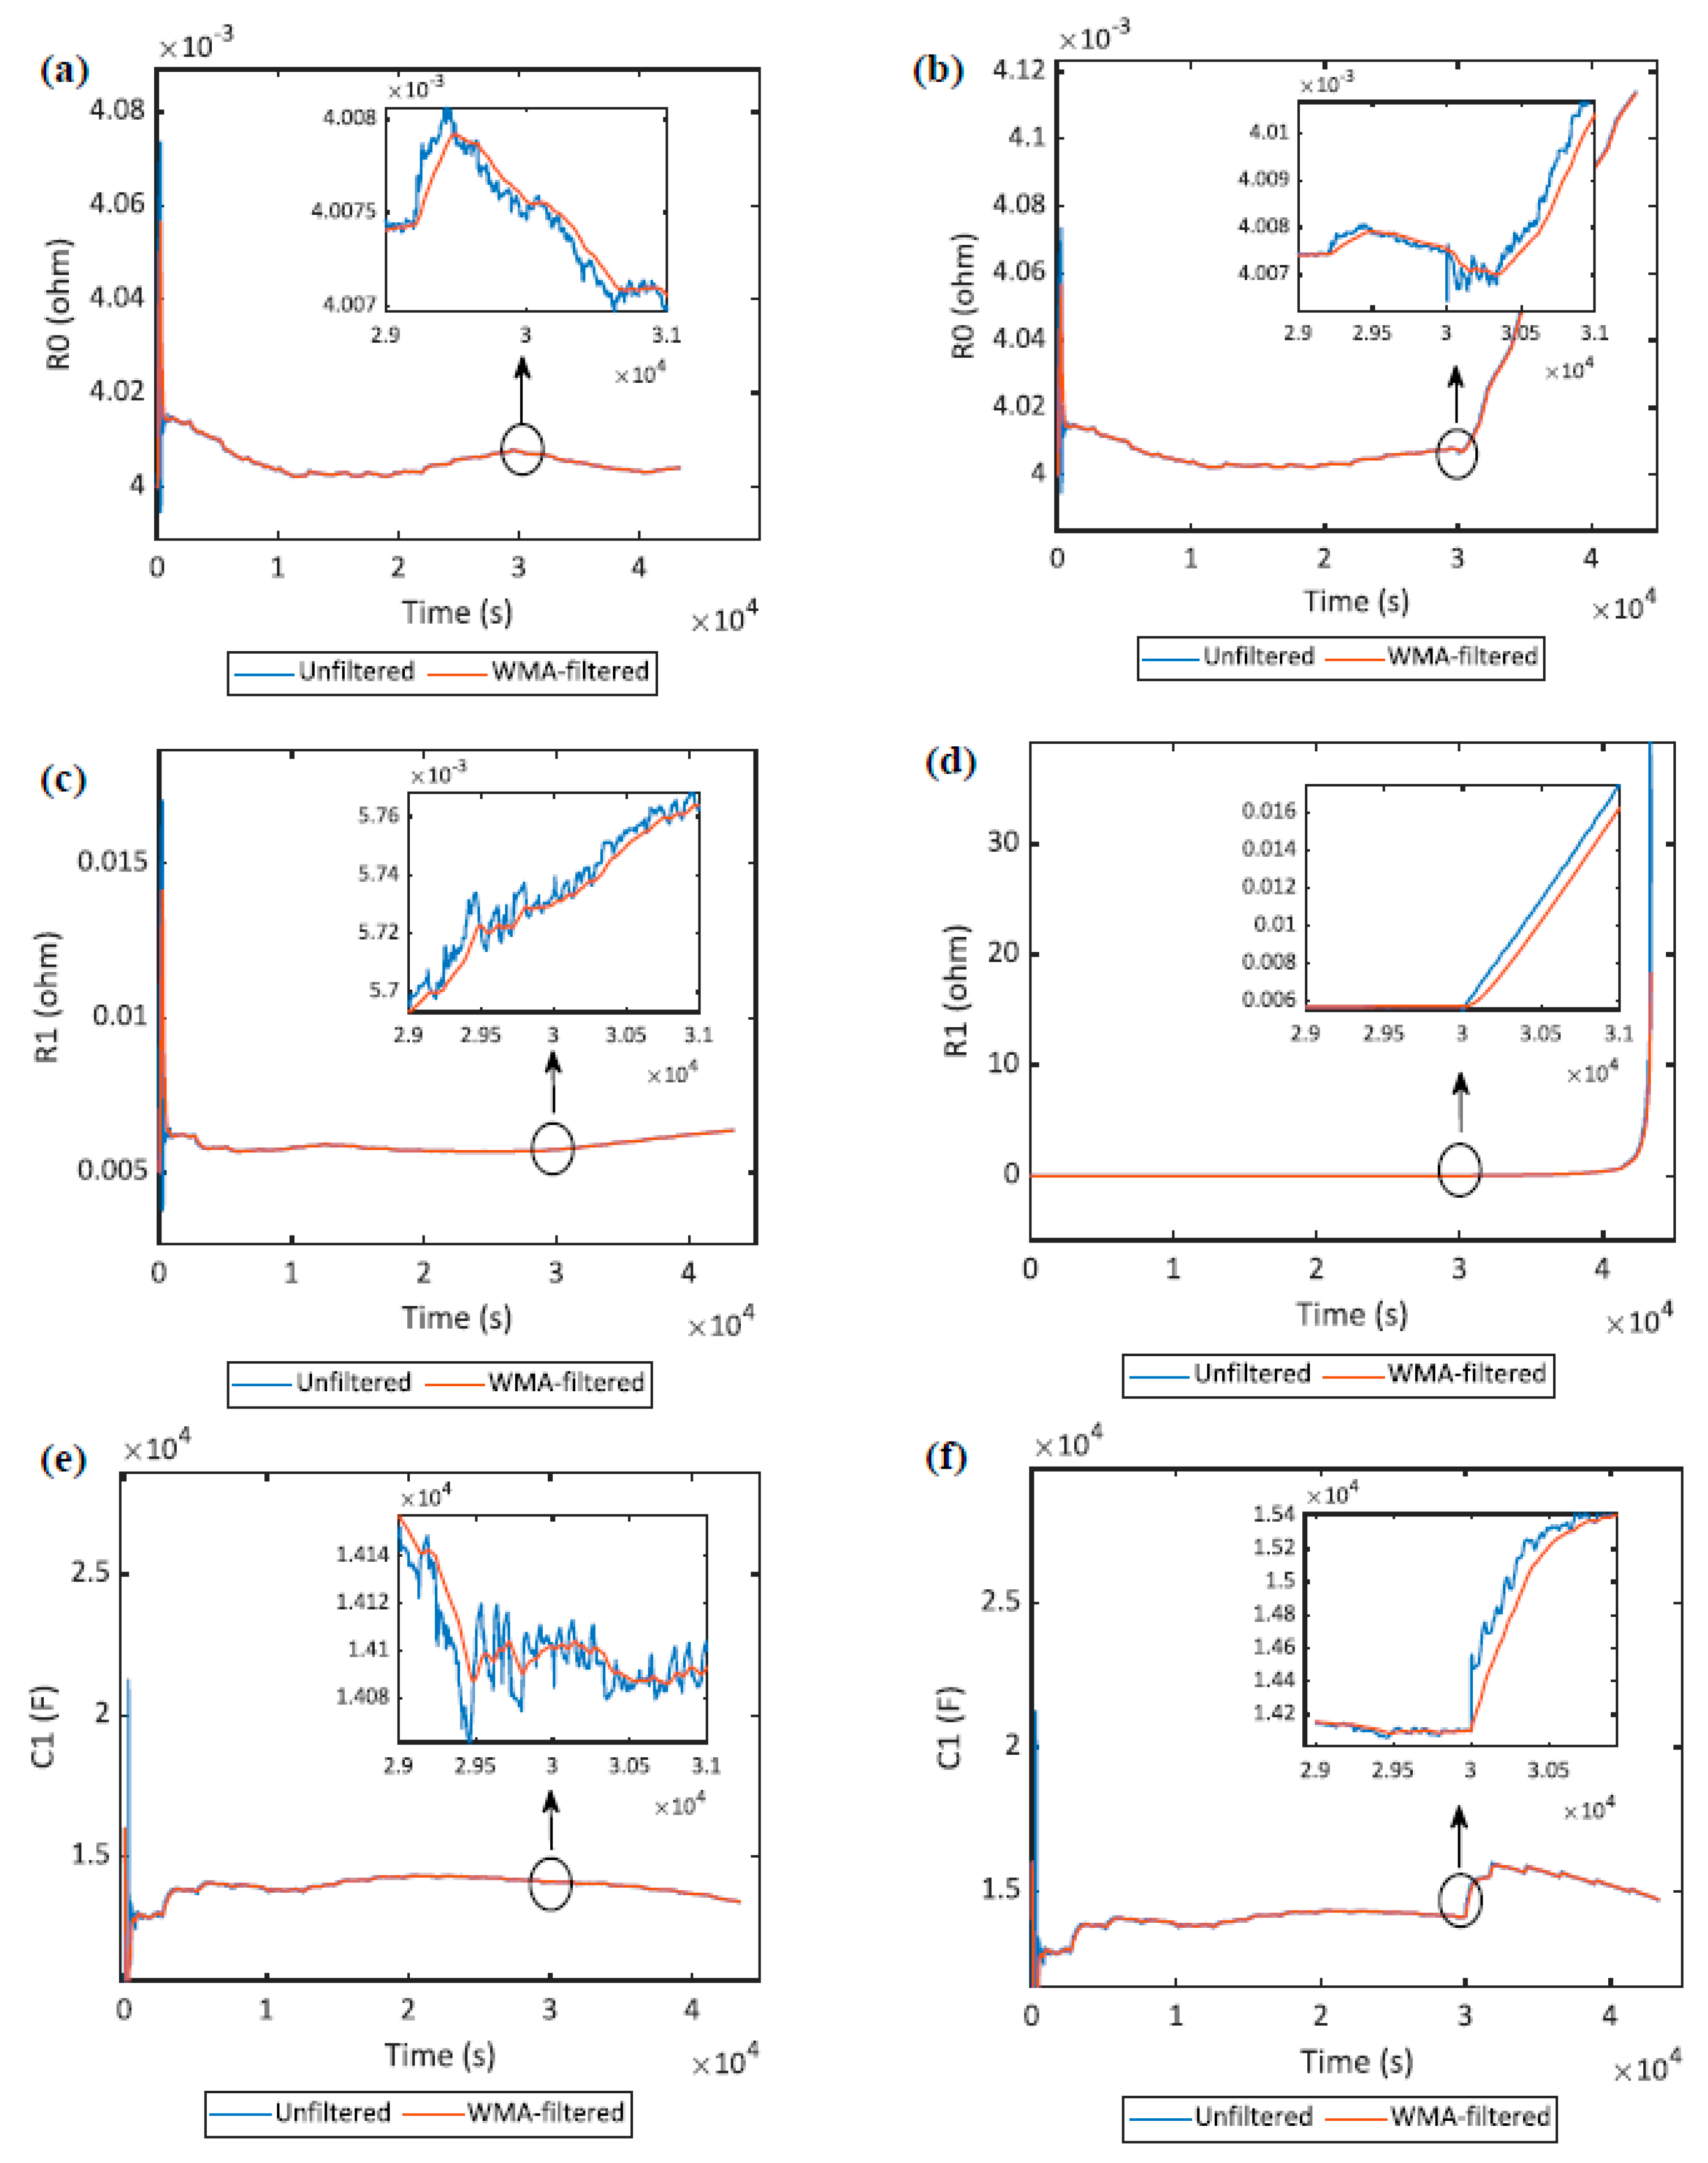
4.3. Effect of Degradation on ECM Parameters

The RLS estimation was used to estimate the ECM parameters for the UDDS driving cycle at different cell capacities. The selected value for λ is 0.9999, as it gives optimal estimation accuracy for the LFP cell tested. Figure 6 shows how degradation affects these parameters. The effect of degradation on R 0 does not show any clear trend. However, it can be clearly seen that R 1 increases, while C 1 decreases, with degradation. This makes sense as the RC pair represents the charge-transfer phenomenon, and degradation can affect the amount of available charge in the battery, which is simply capacity. The changes in these parameters are not significant over a short amount of time, i.e., a few drive cycles, but can be very prominent over the lifetime of the battery. These results confirm that the assumption about the parameters being constant in existing state observer FDI methods, is not valid. Therefore, a reliable FDI scheme should take into consideration the changes in the ECM parameters due to cell degradation.

4.4. Effect of Faults on ECM Parameters

Bias and gain faults were injected into the UDDS driving cycles at various cell capacities, times, and sizes. The effects of the faults were found to be similar across fault types, regardless of the injection time and fault size. The changes in the parameters when the fault is injected can be seen to be more significant, than changes with SOC and temperature [25]. An example is shown in Figure 7, where a voltage gain fault of +10% was injected at the time 30,000 s. When this fault occurs, as shown in Figure 7b,d,f, the parameters diverge away from their original trends. It can also be seen from Figure 7a,c,e that the unfiltered values follow the WMA-filtered line closely during normal operation, while Figure 7b,d,f show that the two lines deviate significantly at the time the fault occurs. This confirms the workability of the proposed change-point detection method using WMA and CUSUM. It is noted that the ECM parameters estimated by RLS require some time to converge. This can be seen at the beginning of Figure 7a–f. Therefore, the proposed FDI scheme would not be able to detect sensor faults for the first hour of battery operation. Considering the long lifespan of Li-ion batteries and the unlikelihood of sensor faults happening within the first hour of operation, it is reasonable to assume there is no fault during the converging period of the RLS algorithm.

4.5. Isolation of Faults

Through multiple simulations, it was found that R 0 responds the fastest to current sensor faults, while either R 1 or C 1 responds the fastest to voltage sensor faults. From these findings, it is possible to establish a fault isolation schematic to complement the proposed fault detection method. It is uncertain whether these faults would have the same effects on a different type of cell, but this will be focused on and further validated in future studies. For this paper, the FDI scheme will be based on the observations from the tested LFP cell. The full FDI scheme is shown in Figure 8. This scheme will be used to diagnose faults, and validated through simulation in the next section.

5. Diagnostic Implementation and Evaluation

This section shows the validation results of the proposed FDI scheme. The UDDS was selected for use in validation, as it is a realistic daily driving cycle. The experimental runs consisted of multiple UDDS cycles. The experimental setup is described in Section 4.1. The same set of data obtained in Section 4 was also used for the simulations in this section. The simulations started at an SOC of 95% and ended at 20%, and was conducted at various decreasing cell capacities. Faults were injected at random time points. The FDI scheme was validated at all tested capacities to ensure faults can be diagnosed while the cell underwent degradation.

5.1. Voltage Sensor Fault Detection

Multiple voltage sensor faults were injected at different cell capacities in simulation. One specific case will be shown as an example. At a cell capacity of 16.47 Ah, a bias fault of +0.5 V was added to the voltage sensor at the time 30,000 s. The diagnostic results are plotted in Figure 9. Figure 9a,c,e show the deviation between the filtered and unfiltered data. As can be seen, the error increases significantly at the fault injection time. Figure 9b,d,f show the corresponding CUSUM values for the errors. Both the CUSUM values for R 1 and C 1 exceed the threshold at 30,003 s, which is 3 s after the voltage sensor fault occurs. The CUSUM value for R 0 takes longer to respond to the fault, which is expected for voltage sensor faults, and also helps to achieve correct fault isolation. The detected voltage sensor fault signal is plotted in Figure 9g. Table 3 presents results for detection time of the voltage sensor faults of different fault sizes and cell capacities at an injection time of 30,000 s.

5.2. Current Sensor Fault Detection

Similar to the simulation done for voltage sensor fault diagnosis validation, current sensor faults of various sizes were injected at different available cell capacities. The case that will be shown as an example is at a cell capacity of 16.47 Ah, where a gain fault of +10% was injected at the time 30,000 s. The diagnostic results are plotted in Figure 10. The errors were also found to increase at the time of fault injection, as seen in Figure 10a,c,e. Figure 10b,d,f show that the CUSUM values all exceed their respective thresholds after the fault occurs. The CUSUM for the error of R 0 is the fastest to exceed the threshold, at 30,165 s; while the CUSUM values for R 1 and C 1 exceed their thresholds afterward. This indicates a current sensor fault, according to the proposed FDI scheme. Figure 10g shows the detected and isolated current sensor fault signal. The detection time for current sensor faults suffers from a delay, as the CUSUM values take longer to pass their thresholds. Lowering these thresholds should give faster detection time, but risks giving false detection, which is a common trade-off in practice [3]. Table 4 summarizes the results for detection time for the current sensor at an injection time of 30,000 s, with different fault sizes and at different cell capacities.
For both voltage and current sensors, more simulations were conducted at different injection times, sizes, and capacities to test the validity and effectiveness of the proposed FDI scheme; but it is impossible to show all the results individually, so a summary will be presented. The injection times were set at 10,000 s, 20,000 s, and 30,000 s. It should be noted that faults were not added at the beginning of the runs, due to the proposed FDI scheme’s aforementioned inability to detect faults during the converging period of the RLS algorithm, which typically lasts an hour at the start of the battery operation. The considered faults for the voltage sensor are [±0.1 V; ±0.5 V; ±10%], while the considered faults for the current sensor are [±4 A; ±7 A; ±10%]. Approximately 200 runs were simulated. Table 5 shows the results for maximum, minimum, and mean detection time (DT—time from fault occurrence to correct detection of fault), false detection rate (FDR—fraction of tests where fault is detected, but there is no fault) and missed detection rate (MDR—fraction of tests where fault is not detected, but there is a fault). The isolation time depends on the fault size; the larger the fault, the faster the isolation time. It is thus concluded that faults can be detected within a reasonable time using the proposed FDI scheme, with no false detection or missed detection.

6. Conclusions

This paper presented a model-based sensor FDI scheme for a Li-ion cell used in EVs with cell degradation consideration. The scheme uses the RLS algorithm to estimate the ECM parameters in real time, and the WMA filter coupled with CUSUM control chart to detect faults. Experiments and simulations were conducted on an LFP cell in a controlled environment, to verify that ECM parameters are affected by degradation and faults to different degrees; the latter having a more significant effect. It was also found that certain parameters respond faster to specific types of fault, enabling the isolation of faults. Finally, the UDDS driving cycles were used to validate the performance of the proposed FDI scheme. Various injection times, fault sizes, fault types, and cell capacities were considered. The validation results showed that the proposed scheme could detect and isolate voltage sensor faults and current sensor faults for an LFP cell within a reasonable time, with no false or missed detection.

Author Contributions

Conceptualization, M.-K.T. and M.F.; methodology, M.-K.T.; software, M.-K.T.; validation, M.-K.T.; formal analysis, M.-K.T.; investigation, M.-K.T.; resources, M.F.; data curation, M.-K.T.; writing—original draft preparation, M.-K.T.; writing—review and editing, M.-K.T. and M.F.; visualization, M.-K.T.; supervision, M.F.; project administration, M.-K.T.; funding acquisition, M.F. All authors have read and agreed to the published version of the manuscript.

Funding

This research received no external funding.

Acknowledgments

This work was supported by equipment and manpower from the Department of Chemical Engineering at the University of Waterloo.

Conflicts of Interest

The authors declare no conflict of interest.

References

  1. Ould Amrouche, S.; Rekioua, D.; Rekioua, T.; Bacha, S. Overview of energy storage in renewable energy systems. Int. J. Hydrog. Energy 2016, 41, 20914–20927. [Google Scholar] [CrossRef]
  2. Lu, L.; Han, X.; Li, J.; Hua, J.; Ouyang, M. A review on the key issues for lithium-ion battery management in electric vehicles. J. Power Sources 2013, 226, 272–288. [Google Scholar] [CrossRef]
  3. Liu, Z.; He, H. Sensor fault detection and isolation for a lithium-ion battery pack in electric vehicles using adaptive extended Kalman filter. Appl. Energy 2017, 185, 2033–2044. [Google Scholar] [CrossRef]
  4. Liu, Z.; He, H. Model-based Sensor Fault Diagnosis of a Lithium-ion Battery in Electric Vehicles. Energies 2015, 8, 6509–6527. [Google Scholar] [CrossRef]
  5. Wu, C.; Zhu, C.; Ge, Y.; Zhao, Y. A Review on Fault Mechanism and Diagnosis Approach for Li-Ion Batteries. J. Nanomater. 2015, 2015, 1–9. [Google Scholar] [CrossRef] [Green Version]
  6. Venkatasubramanian, V.; Rengaswamy, R.; Yin, K.; Ka, S.N. A review of process fault detection and diagnosis Part I: Quantitative model-based methods. Comput. Chem. Eng. 2003, 19, 293–311. [Google Scholar] [CrossRef]
  7. Marcicki, J.; Onori, S.; Rizzoni, G. Nonlinear Fault Detection and Isolation for a Lithium-Ion Battery Management System. In Proceedings of the ASME 2010 Dynamic Systems and Control Conference, 12–15 September 2010; ASMEDC: Cambridge, MA, USA, 2010; Volume 1, pp. 607–614. [Google Scholar]
  8. Chen, W.; Chen, W.-T.; Saif, M.; Li, M.-F.; Wu, H. Simultaneous Fault Isolation and Estimation of Lithium-Ion Batteries via Synthesized Design of Luenberger and Learning Observers. IEEE Trans. Control Syst. Technol. 2014, 22, 290–298. [Google Scholar] [CrossRef]
  9. Liu, Z.; Ahmed, Q.; Zhang, J.; Rizzoni, G.; He, H. Structural analysis based sensors fault detection and isolation of cylindrical lithium-ion batteries in automotive applications. Control Eng. Pract. 2016, 52, 46–58. [Google Scholar] [CrossRef] [Green Version]
  10. Dey, S.; Mohon, S.; Pisu, P.; Ayalew, B. Sensor Fault Detection, Isolation, and Estimation in Lithium-Ion Batteries. IEEE Trans. Control Syst. Technol. 2016, 24, 2141–2149. [Google Scholar] [CrossRef]
  11. Zhang, X.; Lu, J.; Yuan, S.; Yang, J.; Zhou, X. A novel method for identification of lithium-ion battery equivalent circuit model parameters considering electrochemical properties. J. Power Sources 2017, 345, 21–29. [Google Scholar] [CrossRef]
  12. Yang, G.; Li, J.; Fu, Z.; Guo, L. Adaptive state of charge estimation of Lithium-ion battery based on battery capacity degradation model. Energy Procedia 2018, 152, 514–519. [Google Scholar] [CrossRef]
  13. Dubarry, M.; Berecibar, M.; Devie, A.; Anseán, D.; Omar, N.; Villarreal, I. State of health battery estimator enabling degradation diagnosis: Model and algorithm description. J. Power Sources 2017, 360, 59–69. [Google Scholar] [CrossRef]
  14. Fleischer, C.; Waag, W.; Heyn, H.-M.; Sauer, D.U. On-Line adaptive battery impedance parameter and state estimation considering physical principles in reduced order equivalent circuit battery models part 2. Parameter and state estimation. J. Power Sources 2014, 262, 457–482. [Google Scholar] [CrossRef]
  15. Rahimi-Eichi, H.; Ojha, U.; Baronti, F.; Chow, M.-Y. Battery Management System: An Overview of Its Application in the Smart Grid and Electric Vehicles. EEE Ind. Electron. Mag. 2013, 7, 4–16. [Google Scholar] [CrossRef]
  16. Che Mid, E.; Dua, V. Model-Based Parameter Estimation for Fault Detection Using Multiparametric Programming. Ind. Eng. Chem. Res. 2017, 56, 8000–8015. [Google Scholar] [CrossRef]
  17. Duong, V.-H.; Bastawrous, H.A.; Lim, K.; See, K.W.; Zhang, P.; Dou, S.X. Online state of charge and model parameters estimation of the LiFePO 4 battery in electric vehicles using multiple adaptive forgetting factors recursive least-squares. J. Power Sources 2015, 296, 215–224. [Google Scholar] [CrossRef]
  18. Aminikhanghahi, S.; Cook, D.J. A survey of methods for time series change point detection. Knowl. Inf. Syst. 2017, 51, 339–367. [Google Scholar] [CrossRef] [Green Version]
  19. He, H.; Zhang, X.; Xiong, R.; Xu, Y.; Guo, H. Online model-based estimation of state-of-charge and open-circuit voltage of lithium-ion batteries in electric vehicles. Energy 2012, 39, 310–318. [Google Scholar] [CrossRef]
  20. Gao, Z.; Cecati, C.; Ding, S.X. A Survey of Fault Diagnosis and Fault-Tolerant Techniques—Part I: Fault Diagnosis With Model-Based and Signal-Based Approaches. IEEE Trans. Ind. Electron. 2015, 62, 3757–3767. [Google Scholar] [CrossRef] [Green Version]
  21. Lelie, M.; Braun, T.; Knips, M.; Nordmann, H.; Ringbeck, F.; Zappen, H.; Sauer, D. Battery Management System Hardware Concepts: An Overview. Appl. Sci. 2018, 8, 534. [Google Scholar] [CrossRef] [Green Version]
  22. Perry, M.B. The Weighted Moving Average Technique. In Wiley Encyclopedia of Operations Research and Management Science; John Wiley & Sons, Inc.: Hoboken, NJ, USA, 2011; p. eorms0964. ISBN 978-0-470-40053-1. [Google Scholar]
  23. Jeske, D.R.; Montes De Oca, V.; Bischoff, W.; Marvasti, M. Cusum techniques for timeslot sequences with applications to network surveillance. Comput. Stat. Data Anal. 2009, 53, 4332–4344. [Google Scholar] [CrossRef]
  24. Christopherson, J.P. Battery Test Manual for Electric Vehicles; Idaho National Laboratory: Idaho Falls, ID, USA, 2015.
  25. Gomez, J.; Nelson, R.; Kalu, E.E.; Weatherspoon, M.H.; Zheng, J.P. Equivalent circuit model parameters of a high-power Li-ion battery: Thermal and state of charge effects. J. Power Sources 2011, 196, 4826–4831. [Google Scholar] [CrossRef]
Figure 1. Schematic of a first order equivalent circuit model (ECM).
Batteries 06 00001 g001
Figure 2. Schematic diagram of the recursive least squares (RLS) algorithm.
Batteries 06 00001 g002
Figure 3. Experimental setup.
Batteries 06 00001 g003
Figure 4. Tested current profiles: (a) 1 UDDS cycle; (b) 1 degradation cycle.
Batteries 06 00001 g004aBatteries 06 00001 g004b
Figure 5. Experimental result for OCV–SOC relationship.
Batteries 06 00001 g005
Figure 6. Estimated ECM parameters at various cell capacities. (a) R0 estimation at different cell capacities; (b) R1 estimation at different cell capacities; (c) C1 estimation at different cell capacities.
Batteries 06 00001 g006
Figure 7. Unfiltered and WMA-filtered ECM parameters during normal operation versus when a fault occurs. (a) R0 during normal operation; (b) R0 when a fault occurs at time 30,000 s; (c) R1 during normal operation; (d) R1 when a fault occurs at time 30,000 s; (e) C1 during normal operation; (f) C1 when a fault occurs at time 30,000 s.
Batteries 06 00001 g007
Figure 8. Proposed fault detection and isolation scheme.
Batteries 06 00001 g008
Figure 9. Errors and diagnostic results in the case of voltage sensor fault. (a) Error from R0; (b) CUSUM control chart for R0; (c) Error from R1; (d) CUSUM control chart for R1; (e) Error from C1; (f) CUSUM control chart for C1; (g) Isolated voltage sensor fault FU signal.
Batteries 06 00001 g009
Figure 10. Errors and diagnostic results in the case of current sensor fault. (a) Error from R0; (b) CUSUM control chart for R0; (c) Error from R1; (d) CUSUM control chart for R1; (e) Error from C1; (f) CUSUM control chart for C1; (g) Isolated current sensor fault FI signal.
Batteries 06 00001 g010
Table 1. Lithium iron phosphate (LFP) cell specifications.
Cell Dimension (mm)7.25 × 160 × 227
Cell Weight (g)496
Nominal Cell Capacity (Ah)19
Nominal Cell Voltage (V)3.3
Voltage Limit (V)2.0 to 3.65
Operating Temperature (°C)−30 to 55
Table 2. Initial cell capacity for each test cycle.
Cycle1234
Capacity (Ah)18.2618.0117.8417.66
Cycle5678
Capacity (Ah)17.3216.9316.6116.47
Table 3. Summary of detection time for voltage sensor faults at different sizes and cell capacities.
Fault InjectedCapacity (Ah)18.2617.8416.9316.47
-0.1 V (bias)Detection Time (s)19271414
+0.5 V (bias)3333
+10% (gain)4544
Table 4. Summary of detection time for current sensor faults at different sizes and cell capacities.
Fault InjectedCapacity (Ah)18.2617.8416.9316.47
−4 A (bias)Detection Time (s)143190560179
+7 A (bias)45933837
+10% (gain)193181180165
Table 5. Summary of the performance evaluation metrics.
DTmax (s)DTmin (s)DTmean (s)FDR (%)MDR (%)
Voltage Sensor Fault12722800
Current Sensor Fault5602617200

