High-Yield Preparation of ZnO Nanoparticles on Exfoliated Graphite as Anode Material for Lithium Ion Batteries and the Effect of Particle Size as well as of Conductivity on the Electrochemical Performance of Such Composites


Abstract
:1. Introduction
2. Materials and Methods
2.1. Materials
2.2. ZnO@EG Composite Formation and Thermal Treatment
2.3. Characterization
2.4. Electrochemical Characterization
3. Results and Discussion
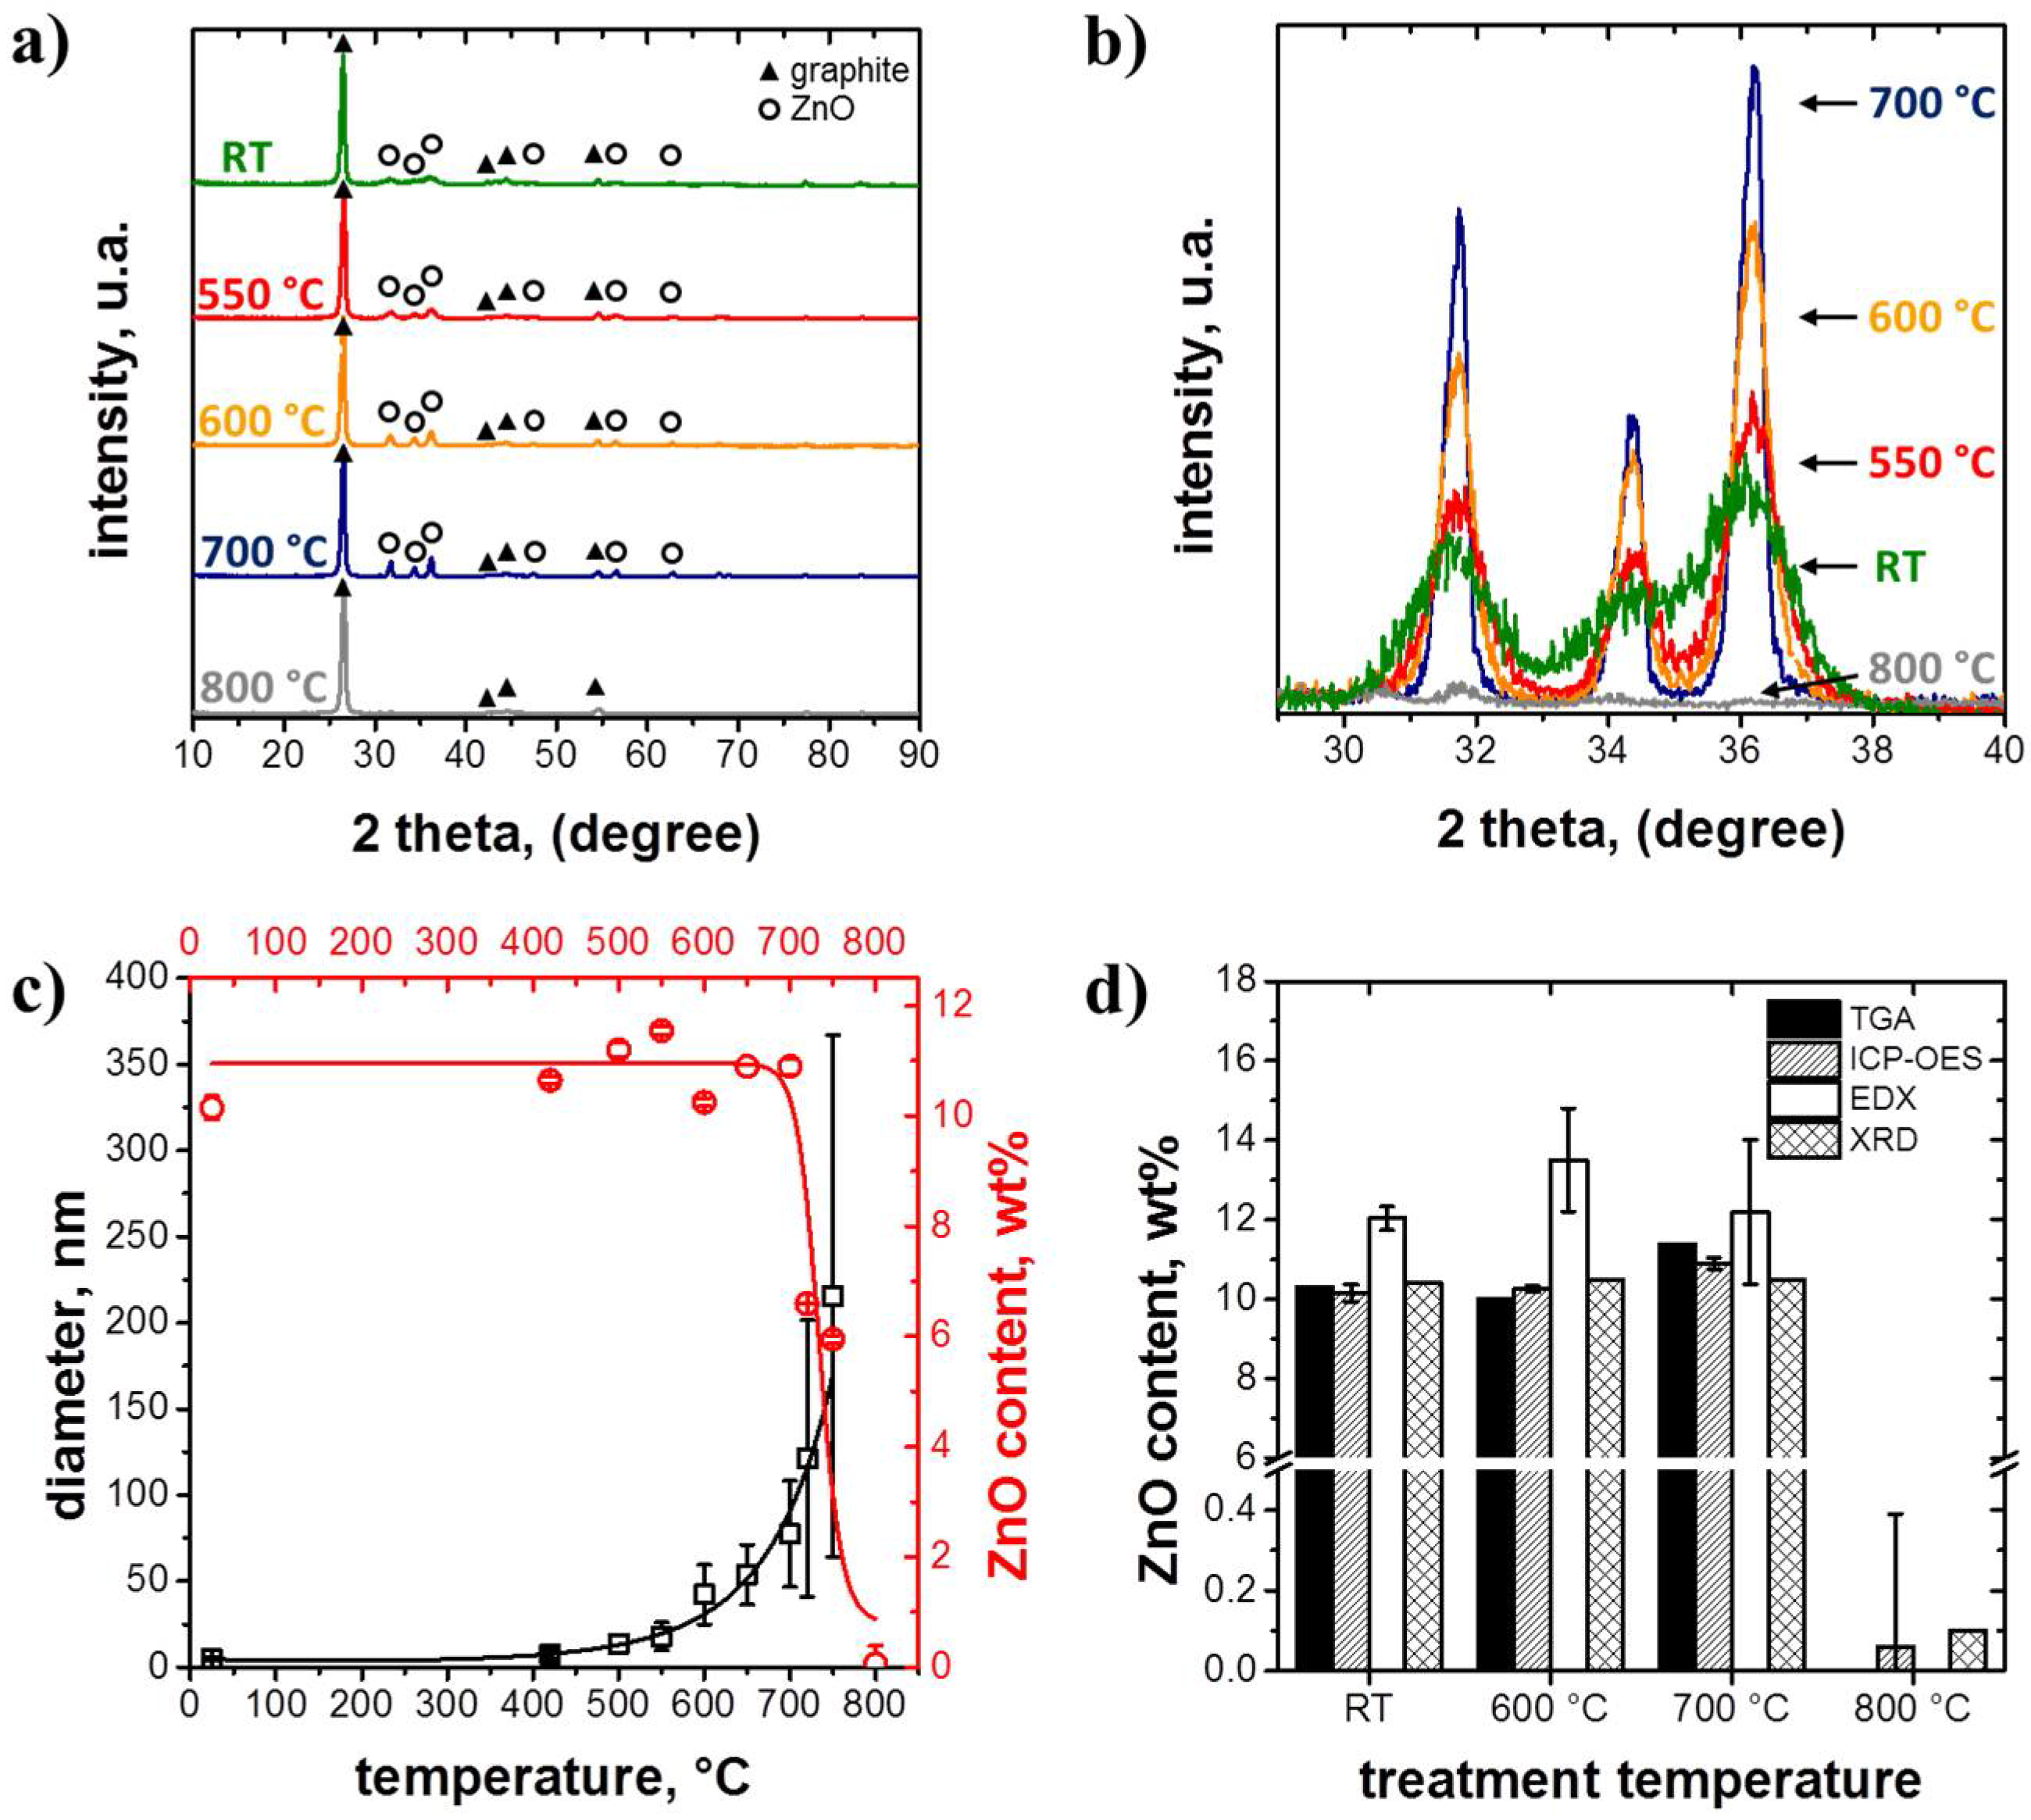
3.1. Structure and Morphology of the ZnO@EG Composites
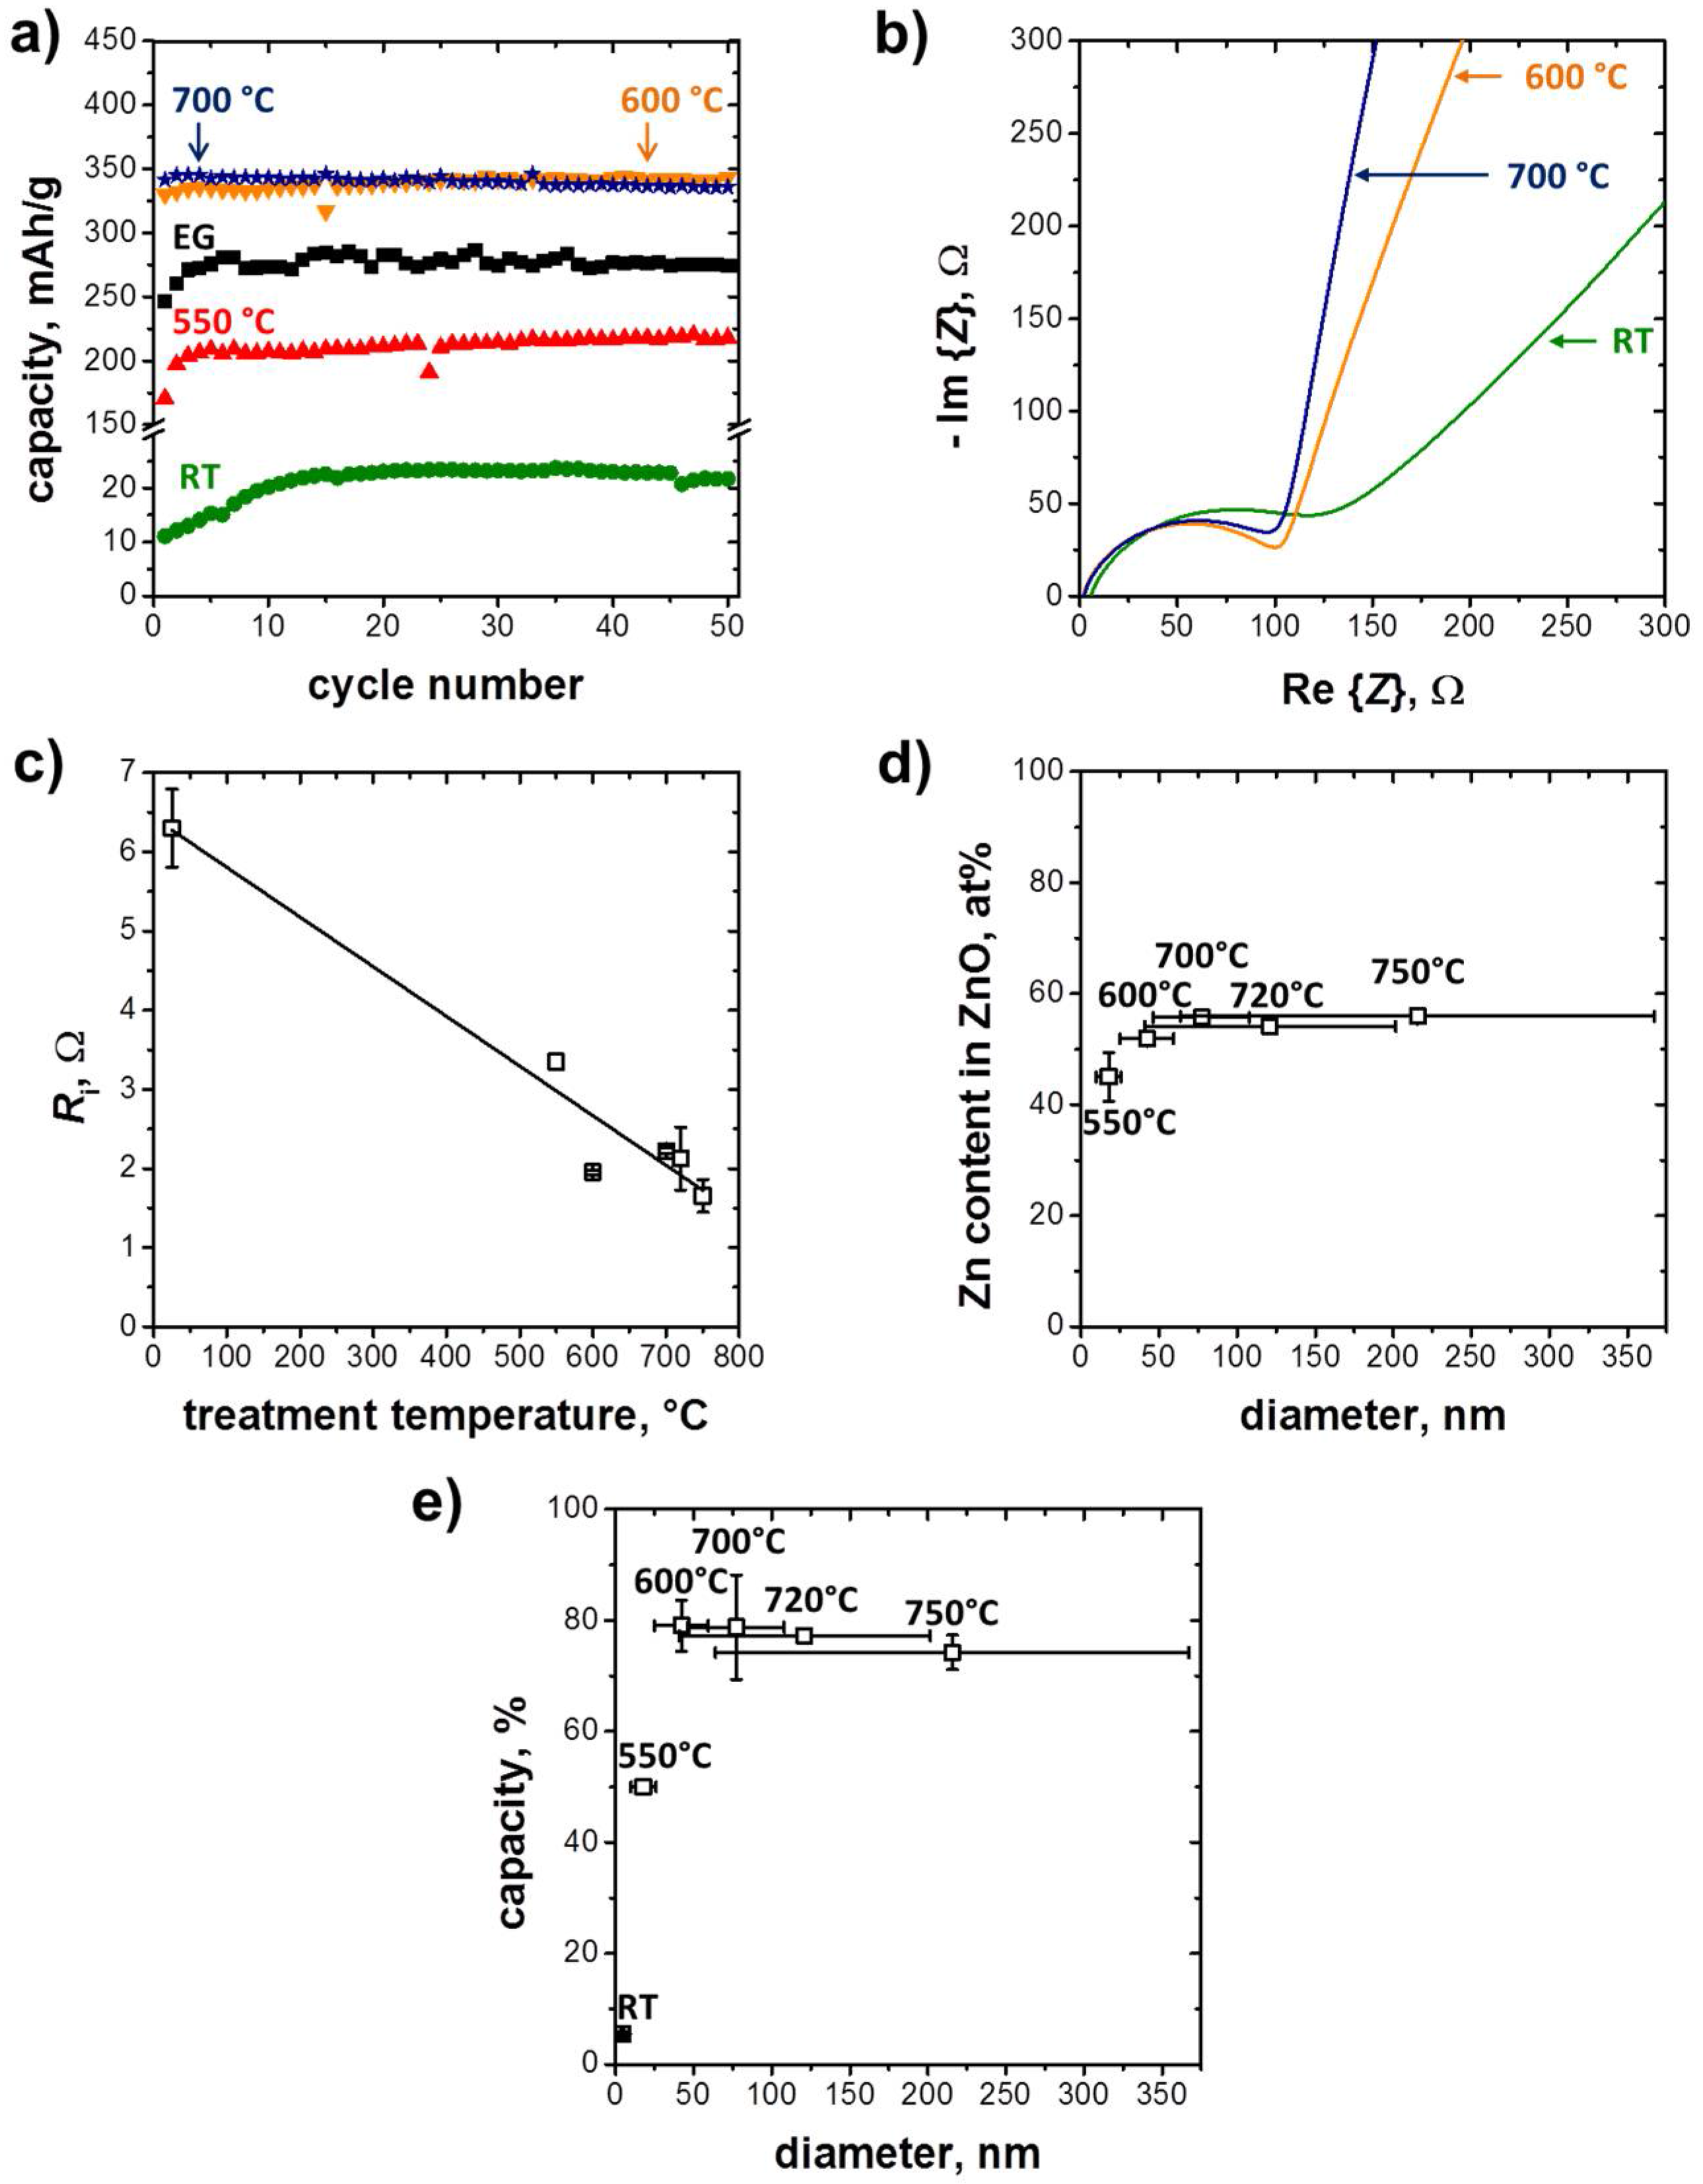
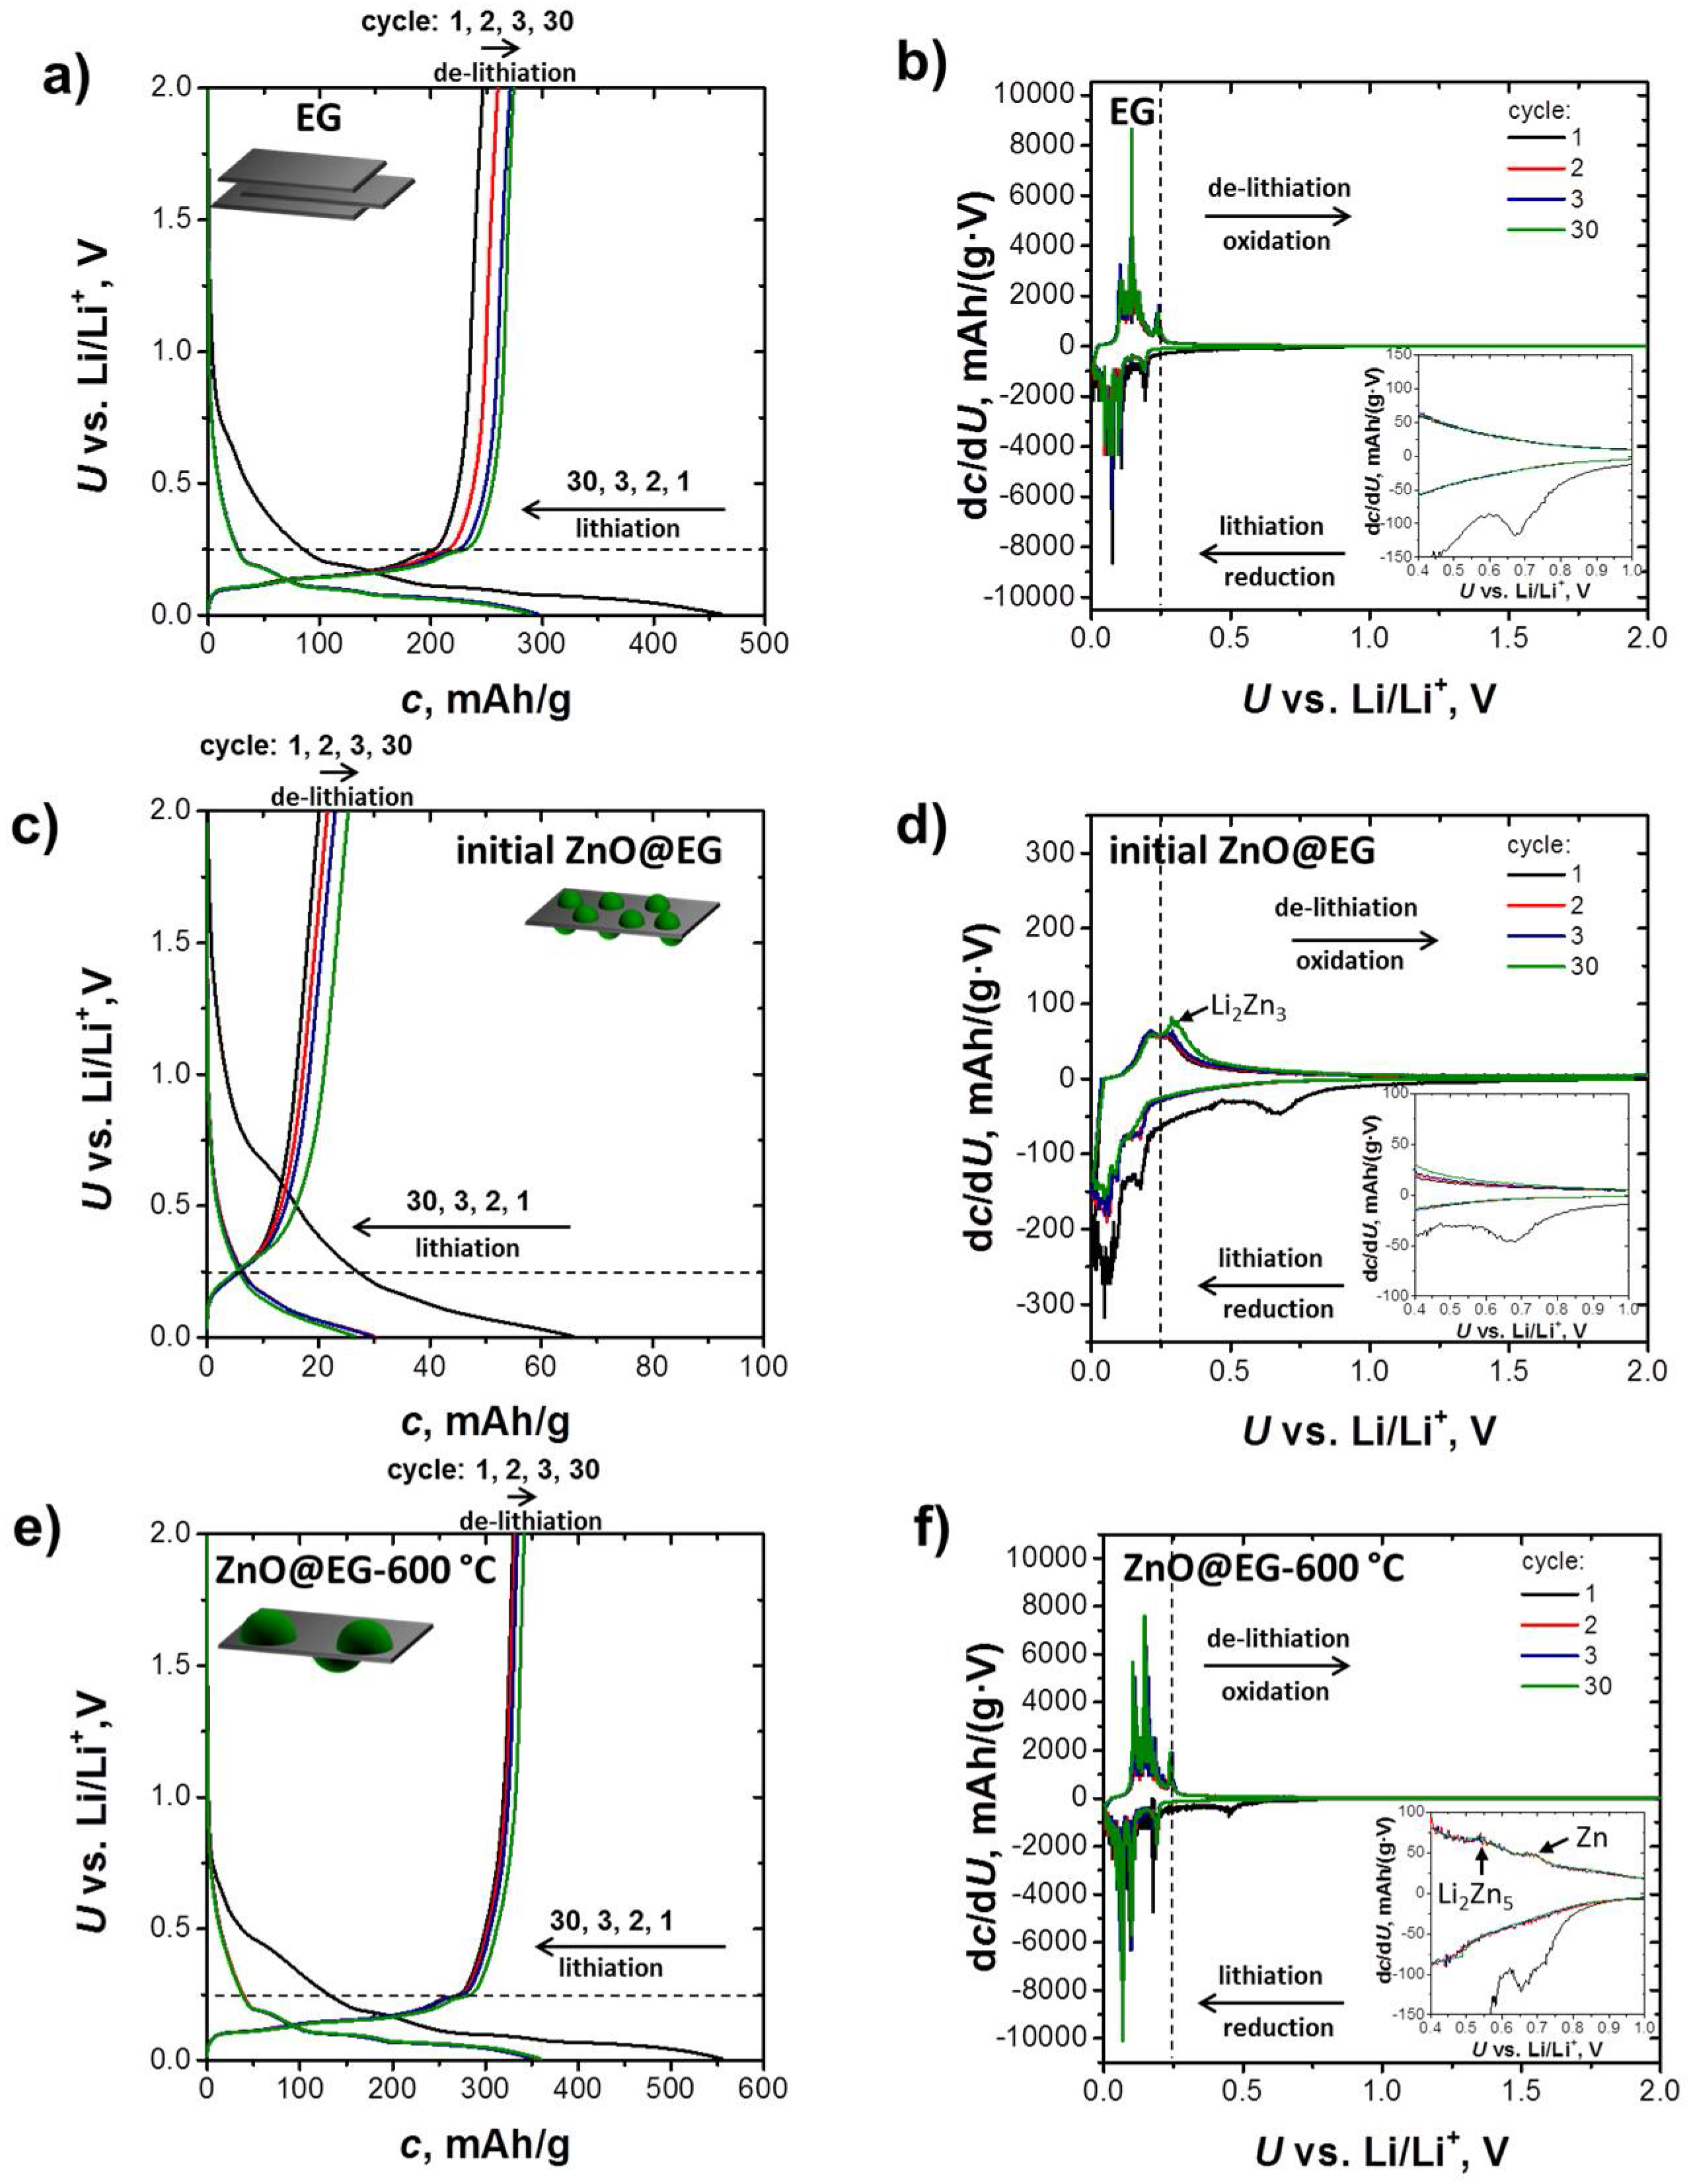
3.2. Electrochemical Performance
4. Conclusions
Supplementary Materials
Author Contributions
Acknowledgments
Conflicts of Interest
References
- Loeffler, N.; Bresser, D.; Passerini, S.; Copley, M. Secondary lithium-ion battery anodes: From first commercial batteries to recent research activities addressing the challenges in rechargeable lithium-ion battery technologies. Johns. Matthey Technol. Rev. 2015, 59, 34–44. [Google Scholar] [CrossRef]
- Yang, C.C.; Hung, Y.W.; Lue, S.J. The carbon additive effect on electrochemical performance of LiFe0.5Mn0.5PO4/C composites by a simple solid-state method for lithium ion batteries. Batteries 2016, 2, 18. [Google Scholar] [CrossRef]
- Tarascon, J.M.; Armand, M. Issues and challenges facing rechargeable lithium batteries. Nature 2001, 414, 359–367. [Google Scholar] [PubMed]
- Hsieh, C.T.; Lin, C.Y.; Chen, Y.F.; Lin, J.S. Synthesis of ZnO@Graphene composites as anode materials for lithium ion batteries. Electrochim. Acta 2013, 111, 359–365. [Google Scholar] [CrossRef]
- Singh, M.; Kaiser, J.; Hahn, H. Effect of porosity on the thick electrodes for high energy density lithium ion batteries for stationary applications. Batteries 2016, 2, 35. [Google Scholar] [CrossRef]
- Tatsumi, K.; Iwashita, N.; Sakaebe, H.; Shioyama, H.; Higuchi, S.; Mabuchi, A.; Fujimoto, H. The influence of the graphitic structure on the electrochemical characteristics for the anode of secondary lithium batteries. J. Electrochem. Soc. 1995, 142, 716–720. [Google Scholar]
- Sun, X.; Zhou, C.G.; Xie, M.; Sun, H.T.; Hu, T.; Lu, F.Y.; Scott, S.M.; George, S.M.; Lian, J. Synthesis of ZnO quantum dot/graphene nanocomposites by atomic layer deposition with high lithium storage capacity. J. Mater. Chem. A 2014, 2, 7319–7326. [Google Scholar] [CrossRef]
- Zhou, G.M.; Wang, D.W.; Li, F.; Zhang, L.L.; Li, N.; Wu, Z.S.; Wen, L.; Lu, G.Q.; Cheng, H.M. Graphene-wrapped Fe3O4 anode material with improved reversible capacity and cyclic stability for lithium ion batteries. Chem. Mat. 2010, 22, 5306–5313. [Google Scholar] [CrossRef]
- Wu, Z.S.; Ren, W.C.; Wen, L.; Gao, L.B.; Zhao, J.P.; Chen, Z.P.; Zhou, G.M.; Li, F.; Cheng, H.M. Graphene anchored with Co3O4 nanoparticles as anode of lithium ion batteries with enhanced reversible capacity and cyclic performance. ACS Nano 2010, 4, 3187–3194. [Google Scholar] [CrossRef] [PubMed]
- Bresser, D.; Paillard, E.; Niehoff, P.; Krueger, S.; Mueller, F.; Winter, M.; Passerini, S. Challenges of “Going Nano”: Enhanced electrochemical performance of cobalt oxide nanoparticles by carbothermal reduction and in situ carbon coating. ChemPhysChem 2014, 15, 2177–2185. [Google Scholar] [CrossRef] [PubMed]
- Xu, Y.; Yi, R.; Yuan, B.; Wu, X.F.; Dunwell, M.; Lin, Q.L.; Fei, L.; Deng, S.G.; Andersen, P.; Wang, D.H.; et al. High capacity MoO2/Graphite oxide composite anode for lithium-ion batteries. J. Phys. Chem. Lett. 2012, 3, 309–314. [Google Scholar] [CrossRef] [PubMed]
- Yao, J.; Shen, X.P.; Wang, B.; Liu, H.K.; Wang, G.X. In situ chemical synthesis of SnO2-graphene nanocomposite as anode materials for lithium-ion batteries. Electrochem. Commun. 2009, 11, 1849–1852. [Google Scholar] [CrossRef]
- Chen, Y.C.; Chen, J.M.; Huang, Y.H.; Lee, Y.R.; Shih, H.C. Size effect of tin oxide nanoparticles on high capacity lithium battery anode materials. Surf. Coat. Technol. 2007, 202, 1313–1318. [Google Scholar] [CrossRef]
- Zou, Y.Q.; Wang, Y. NiO nanosheets grown on graphene nanosheets as superior anode materials for Li-ion batteries. Nanoscale 2011, 3, 2615–2620. [Google Scholar] [CrossRef] [PubMed]
- Wang, B.; Wu, X.L.; Shu, C.Y.; Guo, Y.G.; Wang, C.R. Synthesis of CuO/graphene nanocomposite as a high-performance anode material for lithium-ion batteries. J. Mater. Chem. 2010, 20, 10661–10664. [Google Scholar] [CrossRef]
- Zhang, J.; Gu, P.; Xu, J.; Xue, H.G.; Pang, H. High performance of electrochemical lithium storage batteries: ZnO-based nanomaterials for lithium-ion and lithium-sulfur batteries. Nanoscale 2016, 8, 18578–18595. [Google Scholar] [CrossRef] [PubMed]
- Besenhard, C.D.; Besenhard, J.O. Handbook of Battery Materials; Wiley-VCH: Weinheim, Germany, 2011. [Google Scholar]
- Belliard, F.; Irvine, J.T.S. Electrochemical performance of ball-milled ZnO-SnO2 systems as anodes in lithium-ion battery. J. Power Sources 2001, 97–98, 219–222. [Google Scholar] [CrossRef]
- Quartarone, E.; Dall’Asta, V.; Resmini, A.; Tealdi, C.; Tredici, I.G.; Tamburini, U.A.; Mustarelli, P. Graphite-coated ZnO nanosheets as high-capacity, highly stable, and binder-free anodes for lithium-ion batteries. J. Power Sources 2016, 320, 314–321. [Google Scholar] [CrossRef]
- Guo, R.; Yue, W.B.; An, Y.M.; Ren, Y.; Yan, X. Graphene-encapsulated porous carbon-ZnO composites as high-performance anode materials for Li-ion batteries. Electrochim. Acta 2014, 135, 161–167. [Google Scholar] [CrossRef]
- Zhao, L.; Gao, M.M.; Yue, W.B.; Jiang, Y.; Wang, Y.; Ren, Y.; Hu, F.Q. Sandwich-structured graphene-Fe3O4@Carbon nanocomposites for high-performance lithium-ion batteries. ACS Appl. Mater. Interfaces 2015, 7, 9709–9715. [Google Scholar] [CrossRef] [PubMed]
- Stoller, M.D.; Park, S.J.; Zhu, Y.W.; An, J.H.; Ruoff, R.S. Graphene-based ultracapacitors. Nano Lett. 2008, 8, 3498–3502. [Google Scholar] [CrossRef] [PubMed]
- Zhu, Y.W.; Murali, S.; Cai, W.W.; Li, X.S.; Suk, J.W.; Potts, J.R.; Ruoff, R.S. Graphene and graphene oxide: Synthesis, properties, and applications. Adv. Mater. 2010, 22, 3906–3924. [Google Scholar] [CrossRef] [PubMed]
- Fang, H.M.; Zhao, L.; Yue, W.B.; Wang, Y.; Jiang, Y.; Zhang, Y. Facile and large-scale preparation of sandwich-structured graphene-metal oxide composites as anode materials for Li-ion batteries. Electrochim. Acta 2015, 186, 397–403. [Google Scholar] [CrossRef]
- Yoon, Y.S.; Jee, S.H.; Lee, S.H.; Nam, S.C. Nano Si-coated graphite composite anode synthesized by semi-mass production ball milling for lithium secondary batteries. Surf. Coat. Technol. 2011, 206, 553–558. [Google Scholar] [CrossRef]
- Song, W.T.; Xie, J.; Liu, S.Y.; Zheng, Y.X.; Cao, G.S.; Zhu, T.J.; Zhao, X.B. Graphene decorated with ZnO nanocrystals with improved electrochemical properties prepared by a facile in situ hydrothermal route. Int. J. Electrochem. Sci. 2012, 7, 2164–2174. [Google Scholar]
- Su, Q.M.; Dong, Z.M.; Zhang, J.; Du, G.H.; Xu, B.S. Visualizing the electrochemical reaction of ZnO nanoparticles with lithium by in situ TEM: Two reaction modes are revealed. Nanotechnology 2013, 24. [Google Scholar] [CrossRef] [PubMed]
- Bourlinos, A.B.; Gournis, D.; Petridis, D.; Szabo, T.; Szeri, A.; Dekany, I. Graphite oxide: Chemical reduction to graphite and surface modification with primary aliphatic amines and amino acids. Langmuir 2003, 19, 6050–6055. [Google Scholar] [CrossRef]
- Gilje, S.; Han, S.; Wang, M.; Wang, K.L.; Kaner, R.B. A chemical route to graphene for device applications. Nano Lett. 2007, 7, 3394–3398. [Google Scholar] [CrossRef] [PubMed]
- Simón, M.; Benítez, A.; Caballero, A.; Morales, J.; Vargas, O. Untreated natural graphite as a graphene source for high-performance li-ion batteries. Batteries 2018, 4, 13. [Google Scholar] [CrossRef]
- Wu, J.L.; Shen, X.P.; Jiang, L.; Wang, K.; Chen, K.M. Solvothermal synthesis and characterization of sandwich-like graphene/ZnO nanocomposites. Appl. Surf. Sci. 2010, 256, 2826–2830. [Google Scholar] [CrossRef]
- Kim, T.; Kim, H.; Han, J.-M.; Kim, J. ZnO-embedded N-doped porous carbon nanocomposite as a superior anode material for lithium-ion batteries. Electrochim. Acta 2017, 253, 190–199. [Google Scholar] [CrossRef]
- Isakin, O.; Schneider, R.; Ringl, M.; Struck, O.; Gerdes, T.; Willert-Porada, M.; Moos, R. High-yield synthesis of ZnO nanoparticles homogeneously coated on exfoliated graphite and simplified method to determine the surface coverage. Surf. Coat. Technol. 2017, 325, 445–453. [Google Scholar] [CrossRef]
- Isakin, O.; Hiltl, S.; Schneider, R.; Bleisteiner, J.; Struck, O.; Schindler, K.; Willert-Porada, M.; Moos, R. Ultrasound-assisted one-pot syntheses of ZnO nanoparticles that are homogeneously adsorbed on exfoliated graphite and a simplified method to determine the graphite layer thickness in such composites. J. Mater. Sci. 2018, 53, 6586–6601. [Google Scholar] [CrossRef]
- Paek, S.M.; Yoo, E.; Honma, I. Enhanced cyclic performance and lithium storage capacity of SnO2/Graphene nanoporous electrodes with three-dimensionally delaminated flexible structure. Nano Lett. 2009, 9, 72–75. [Google Scholar] [CrossRef] [PubMed]
- Rai, A.K.; Thi, T.V.; Paul, B.J.; Kim, J. Synthesis of nano-sized ZnCo2O4 anchored with graphene nanosheets as an anode material for secondary lithium ion batteries. Electrochim. Acta 2014, 146, 577–584. [Google Scholar] [CrossRef]
- Pierson, H.O. Handbook of Carbon, Graphite, Diamond and Fullerenes—Properties, Processing and Applications; Noyes Publications: Park Ridge, NJ, USA, 1993. [Google Scholar]
- Sankapal, B.R.; Gajare, H.B.; Karade, S.S.; Salunkhe, R.R.; Dubal, D.P. Zinc oxide encapsulated carbon nanotube thin films for energy storage applications. Electrochim. Acta 2016, 192, 377–384. [Google Scholar] [CrossRef]
- Gottstein, G.; Winning, M.; Friedrich, B. Metalle; Wiley-VCH: Weinheim, Germany, 2006. [Google Scholar]
- Hong, L.; Sohn, H.Y.; Sano, M. Kinetics of carbothermic reduction of magnesia and zinc oxide by thermogravimetric analysis technique. Scand. J. Metall. 2003, 32, 171–176. [Google Scholar] [CrossRef]
- Chen, H.K. Kinetic study on the carbothermic reduction of zinc oxide. Scand. J. Metall. 2001, 30, 292–296. [Google Scholar] [CrossRef]
- Contreras, C.S.; Salama, F. Laborarory investigations of polycyclic aromatic hydrocarbon formation and distrubution in the circumstellar outflows of carbon stars. Astrophys. J. Suppl. Ser. 2013. [Google Scholar] [CrossRef]
- Stein, S.E. Mass Spectra in NIST Chemistry WebBook; NIST Standard Reference Database Number 69; Linstrom, P.J., Mallard, W.G., Eds.; National Institute of Standards and Technology: Gaithersburg, MD, USA, 2012. Available online: http://webbook.nist.gov/cgi/cbook.cgi?Formula=Ar&NoIon=on&Units=SI&cMS=on (accessed on 7 January 2018).
- Zhang, C.; Geng, X.; Li, J.; Luo, Y.; Lu, P. Role of oxygen vacancy in tuning of optical, electrical and NO2 sensingproperties of ZnO1−x coatings at room temperature. Sens. Actuator B Chem. 2017, 248, 886–893. [Google Scholar] [CrossRef]
- Ou, G.; Li, D.K.; Pan, W.; Zhang, Q.H.; Xu, B.; Gu, L.; Nan, C.W.; Wu, H. Arc-melting to narrow the bandgap of oxide semiconductors. Adv. Mater. 2015, 27, 2589–2594. [Google Scholar] [CrossRef] [PubMed]
- Zhang, C.; Geng, X.; Liao, H.L.; Li, C.J.; Debliquy, M. Room-temperature nitrogen-dioxide sensors based on ZnO1−x coatings deposited by solution precursor plasma spray. Sens. Actuator B Chem. 2017, 242, 102–111. [Google Scholar] [CrossRef]
- Guo, Y.G.; Hu, J.S.; Wan, L.J. Nanostructured materials for electrochemical energy conversion and storage devices. Adv. Mater. 2008, 20, 2878–2887. [Google Scholar] [CrossRef]
- Aurbach, D.; Markovsky, B.; Weissman, I.; Levi, E.; Ein-Eli, Y. On the correlation between surface chemistry and performance of graphite negative electrodes for Li ion batteries. Electrochim. Acta 1999, 45, 67–86. [Google Scholar] [CrossRef]
- Ko, Y.; Cho, Y.G.; Song, H.K. Programming galvanostatic rates for fast-charging lithium ion batteries: A graphite case. RSC Adv. 2014, 4, 16545–16550. [Google Scholar] [CrossRef]
- Park, J.-K. Principles and Applications of Lithium Secondary Batteries; Wiley-VCH: Weinheim, Germany, 2012. [Google Scholar]
- Huang, X.H.; Xia, X.H.; Yuan, Y.F.; Zhou, F. Porous ZnO nanosheets grown on copper substrates as anodes for lithium ion batteries. Electrochim. Acta 2011, 56, 4960–4965. [Google Scholar] [CrossRef]
- Courtney, I.A.; Dahn, J.R. Electrochemical and in situ X-ray diffraction studies of the reaction of lithium with tin oxide composites. J. Electrochem. Soc. 1997, 144, 2045–2052. [Google Scholar] [CrossRef]
- Nitta, N.; Wu, F.X.; Lee, J.T.; Yushin, G. Li-ion battery materials: Present and future. Mater. Today 2015, 18, 252–264. [Google Scholar] [CrossRef]


© 2018 by the authors. Licensee MDPI, Basel, Switzerland. This article is an open access article distributed under the terms and conditions of the Creative Commons Attribution (CC BY) license (http://creativecommons.org/licenses/by/4.0/).
Share and Cite
Isakin, O.; Hiltl, S.; Struck, O.; Willert-Porada, M.; Moos, R. High-Yield Preparation of ZnO Nanoparticles on Exfoliated Graphite as Anode Material for Lithium Ion Batteries and the Effect of Particle Size as well as of Conductivity on the Electrochemical Performance of Such Composites. Batteries 2018, 4, 24. https://doi.org/10.3390/batteries4020024
Isakin O, Hiltl S, Struck O, Willert-Porada M, Moos R. High-Yield Preparation of ZnO Nanoparticles on Exfoliated Graphite as Anode Material for Lithium Ion Batteries and the Effect of Particle Size as well as of Conductivity on the Electrochemical Performance of Such Composites. Batteries. 2018; 4(2):24. https://doi.org/10.3390/batteries4020024
Chicago/Turabian StyleIsakin, Olga, Stephanie Hiltl, Oliver Struck, Monika Willert-Porada, and Ralf Moos. 2018. "High-Yield Preparation of ZnO Nanoparticles on Exfoliated Graphite as Anode Material for Lithium Ion Batteries and the Effect of Particle Size as well as of Conductivity on the Electrochemical Performance of Such Composites" Batteries 4, no. 2: 24. https://doi.org/10.3390/batteries4020024
APA StyleIsakin, O., Hiltl, S., Struck, O., Willert-Porada, M., & Moos, R. (2018). High-Yield Preparation of ZnO Nanoparticles on Exfoliated Graphite as Anode Material for Lithium Ion Batteries and the Effect of Particle Size as well as of Conductivity on the Electrochemical Performance of Such Composites. Batteries, 4(2), 24. https://doi.org/10.3390/batteries4020024