1. Introduction
Lithium-ion batteries (LIBs) have found widespread application across diverse fields [
1,
2,
3] owing to their prominent advantages, such as a high energy density [
4] and long cycle life [
5]. Nevertheless, unexpected incidents occurring during their operational lifespan present a multitude of challenges. As a result, real-time anomaly detection for batteries has emerged as an imperative requirement [
6]. The operational stability of lithium-ion batteries (LIBs) can be compromised by multiple factors, including impacts, shocks, vibrations, deformation, lithium plating, the formation of a solid electrolyte interphase (SEI) layer [
7], and lithium dendrite formation [
8], among others [
9]. Battery failures can be broadly categorized into external and internal types [
10,
11,
12,
13,
14]. External failures predominantly originate from operation under extreme environmental conditions, such as elevated ambient temperatures or excessive pressures [
15]. These severe operational environments markedly escalate the probability of internal failures, including overcharging, over-discharging [
9,
15], internal/external short circuits [
8], localized overheating, accelerated capacity degradation, and thermal runaway events. These failures may lead to severe hazardous consequences, substantially increasing the risks of battery combustion and explosion [
16]. Moreover, although contemporary battery manufacturing has attained sophisticated production benchmarks, inherent variability in cell-to-cell manufacturing consistency persists. Consequently, researchers must implement proactive safety monitoring based on operational charging and discharging data [
17,
18].
Both academic and industrial communities have undertaken preliminary research on proactive early-warning systems for lithium-ion batteries (LIBs), exploring the evolution patterns of relevant characteristic signals during battery operation. Ref. [
19] investigates the correlation between temperature ranges and thermal runaway progression stages through a material-level temporal sequence analysis, enabling the early detection of thermal runaway in batteries. The thermal abuse testing conducted in Ref. [
20] reveals that CO
2 and H
2 constitute the dominant gaseous species emitted during thermal venting processes in both NCM and LFP battery cells. Ref. [
21] proposes a short-circuit fault detection method integrating voltage curve correlation coefficients with a recursive moving window correlation analysis, effectively addressing the challenges due to battery pack aging and cell imbalances in practical applications while enabling precise fault localization. Ref. [
22] establishes a real-time multi-fault diagnosis technique for incipient battery failures based on an enhanced sample entropy (ESE) analysis within adaptive observation windows.
Recent years have witnessed remarkable progress in machine learning, particularly in deep learning, which has been widely adopted across various disciplines. In proactive early-warning systems and anomalous cell detection for batteries, deep neural networks automatically extract and learn features from historical operational data, eliminating the need for predefined knowledge or complex physical models. As an ensemble learning algorithm, Random Forests (RFs) have demonstrated significant advantages in feature extraction [
23,
24,
25], exhibiting particular efficacy in processing high-dimensional nonlinear data while maintaining high efficiency, robustness, and interpretability. Ref. [
26] establishes the efficacy of Random Forests (RFs) in handling complex multidimensional datasets by automatically extracting salient features from voltage profiles and integrating them into machine learning pipelines. Furthermore, Long Short-Term Memory (LSTM) networks [
27]—a specialized architecture of Recurrent Neural Networks (RNNs)—address the vanishing/exploding gradient problems inherent in conventional RNNs through gating mechanisms. This architecture facilitates effective modeling of the long-term dependencies in temporal sequences, making LSTMs particularly advantageous for analyzing lithium-ion battery charge/discharge profiles, characterized by complex sequential characteristics. Ref. [
28] proposes an innovative battery fault detection framework that synergistically combines Long Short-Term Memory Recurrent Neural Networks (LSTM-RNNs) with Equivalent Circuit Models (ECMs). The experimental results demonstrate that this hybrid approach achieves accurate diagnoses of potential failures in individual battery cells. Ref. [
29] proposes an adaptive ensemble prediction framework that integrates mean-difference modeling with Bidirectional Long Short-Term Memory (Bi-LSTM) neural networks, achieving high-fidelity approximations of cell-level voltage predictions. Ref. [
25] proposes a rapid internal short-circuit diagnostic method based on Local Gravitational Outlier Factor (LGOF) detection.
In this study, we introduce a novel multi-model detection framework designed to address cell-level anomalies in battery energy storage systems during routine operation. Recognizing the inherent complex nonlinearity in historical battery cell data, we synergistically integrate three complementary baseline methodologies: isolation forests perform rapid feature screening and dimensionality reduction; LSTM autoencoders capture the long-term dependencies to learn temporal representations of normal behavior; and the functional principal component analysis–Mahalanobis distance (FPCA-MD) provides statistically rigorous anomaly validation through a functional data analysis. This framework pioneers a fully automated workflow encompassing feature screening, temporal modeling, and anomaly verification, effectively resolving the practical challenges in cell-level detection in grid-scale BESS installations.
The main contributions of this paper are as follows:
- (1)
Our algorithm maintains a high detection accuracy despite asynchronous sensor operation and sampling anomalies in historical battery data—common issues arising due to unsynchronized or faulty sensors during data acquisition.
- (2)
We extract multi-dimensional features from the operational histories of batteries for anomaly detection, overcoming the limitations of traditional voltage-curve-only approaches that often discard critical information. This methodology optimizes the utilization of historical data through tight integration of the battery characteristics with anomaly signatures.
- (3)
We introduce an unsupervised outlier detection framework based on multi-model fusion. By synergistically combining isolation forests, LSTM autoencoders, and a functional principal component analysis (FPCA)—three algorithms with distinct operating principles—this framework achieves complementary advantages and an enhanced detection performance.
The subsequent sections of this study are organized as follows.
Section 2 details the proposed methodology and experimental procedures.
Section 3 demonstrates the performance of our framework through benchmarking experiments on grid-scale BESS datasets. Finally,
Section 4 presents concluding remarks and outlines future research directions.
2. Materials and Methods
2.1. Energy Storage System Data Analysis and Preprocessing
The operational data employed in this study originates from real-time monitoring systems for grid-scale battery energy storage systems (BESSs), featuring characteristic series-connected battery pack configurations. Within each battery string, individual cells maintain an identical current flow. However, due to manufacturing tolerances, heterogeneous aging patterns, and microenvironmental variations across cells, distinct dynamic characteristics emerge in critical parameters such as the voltage differentials and surface temperature distributions.
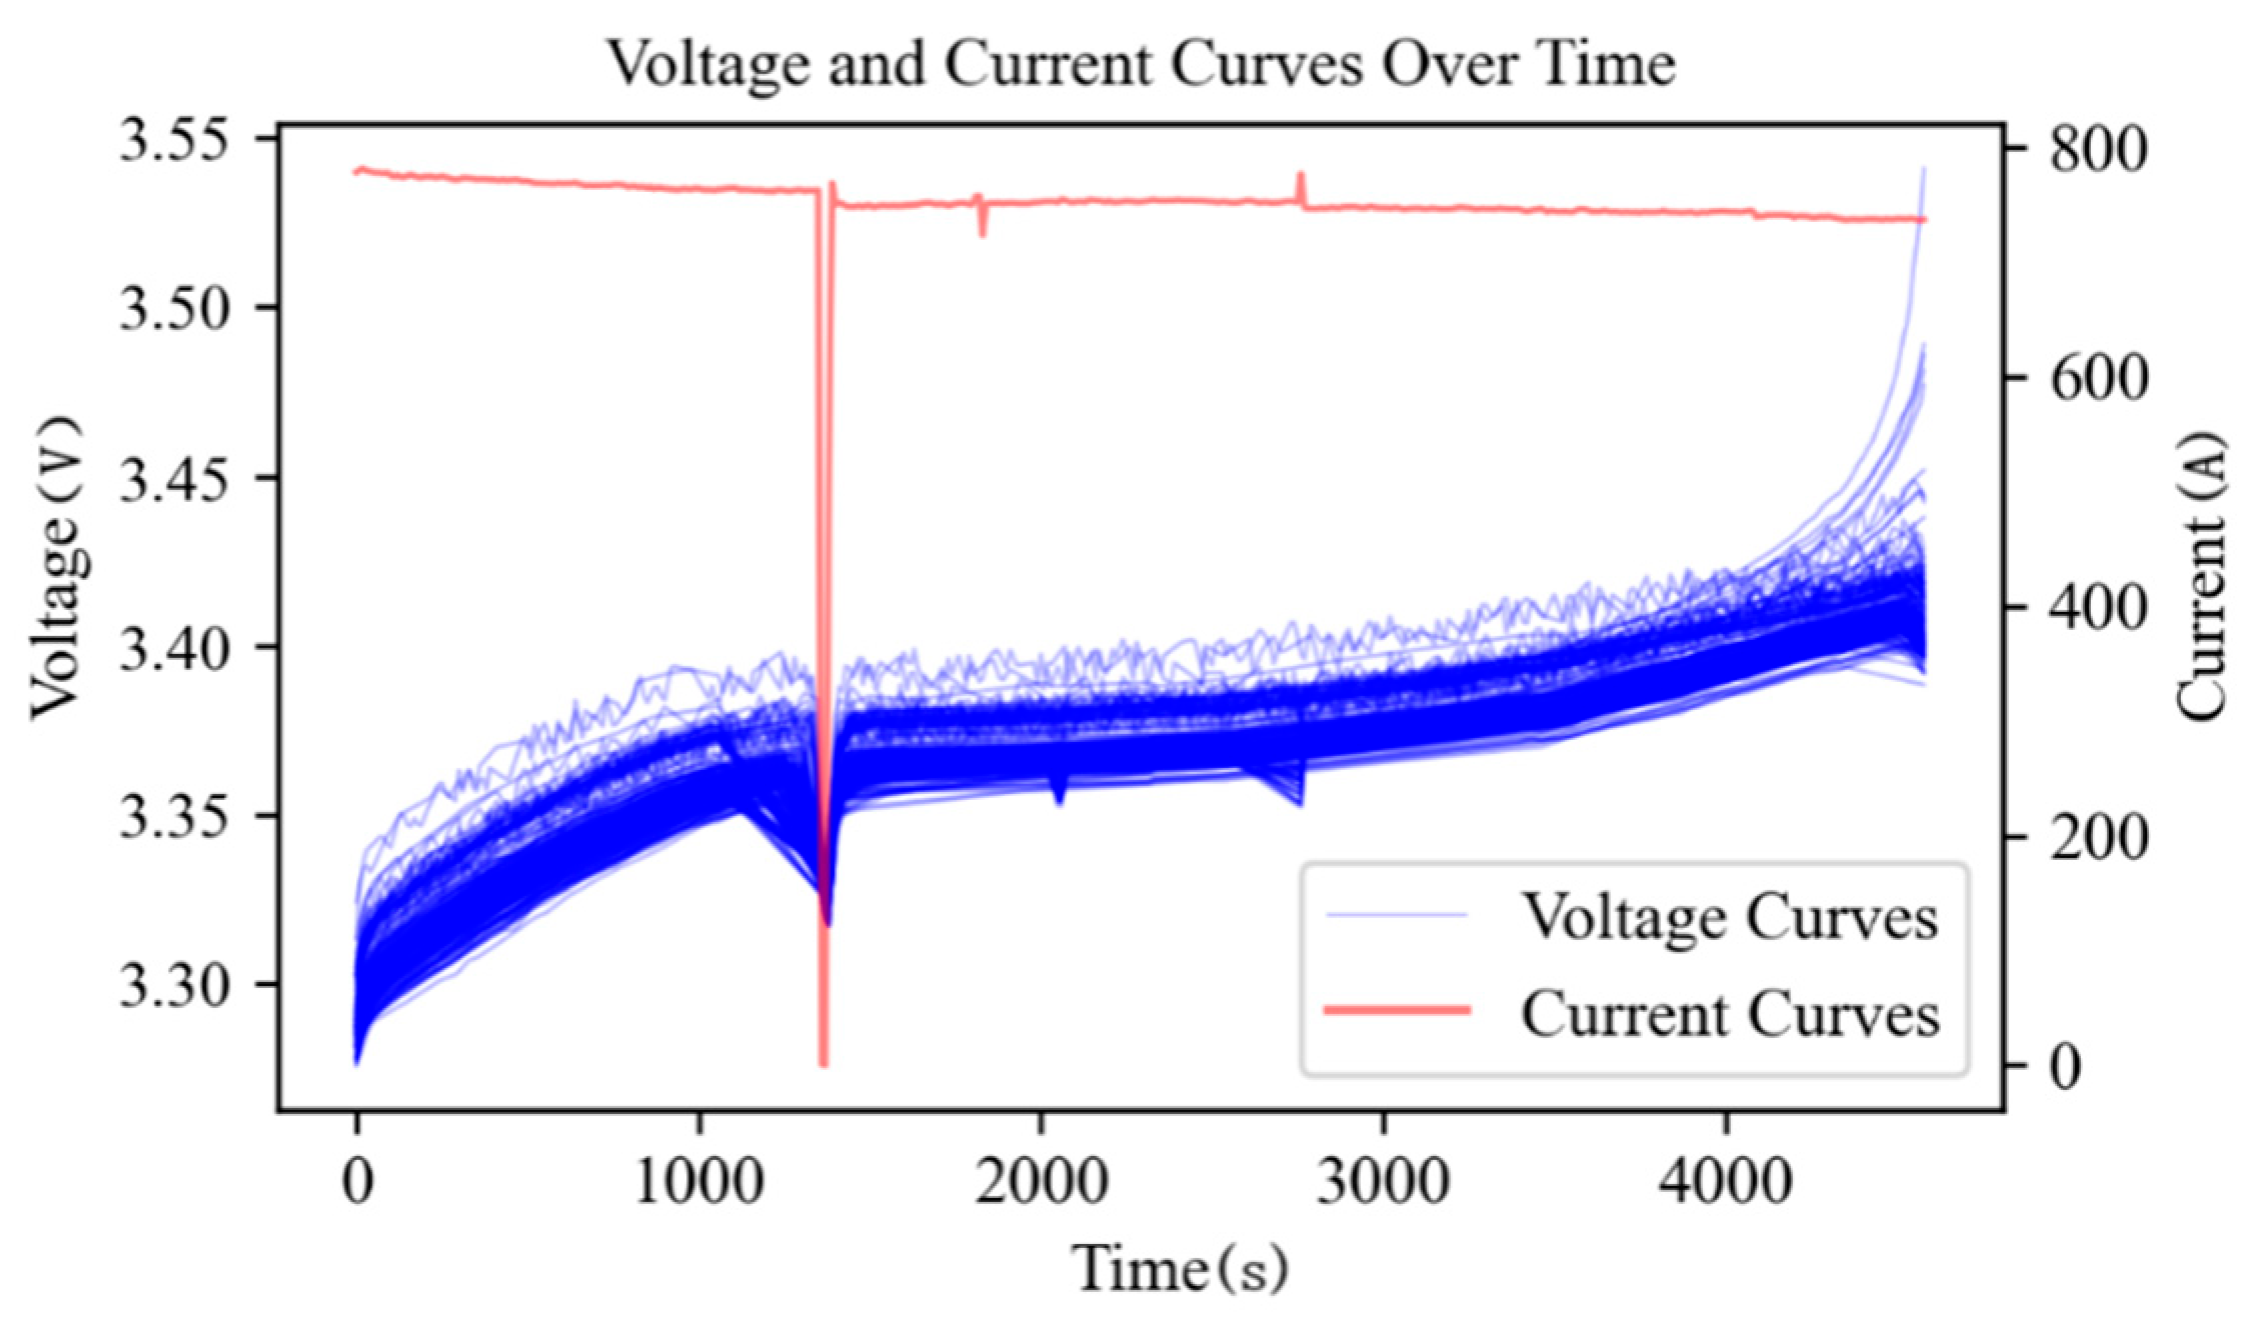
As illustrated in
Figure 1, the raw battery operational dataset exhibits the following significant characteristics: First, these data possess obvious temporal features, containing multi-dimensional information such as voltage variations during charging and discharging processes and capacity degradation, which directly reflect the health status and performance of the batteries. Second, field-collected data frequently contains irregularities such as non-uniform sampling intervals, missing values, and noise contamination, presenting substantial challenges for reliable anomaly detection.
To improve the data quality and the accuracy of anomaly detection, this study employs an incremental capacity analysis (ICA) to preprocess the raw operational data. The ICA amplifies characteristic signals of the electrochemical reactions inside batteries by calculating dQ/dV during the battery charging and discharging processes, serving as an important tool for battery health assessments. The significance of ICA preprocessing is threefold: First, it enables enhancement of the electrochemical features by amplifying the phase transition processes through differential operations. These transitions, often obscured in conventional voltage–time profiles, emerge as distinct peak characteristics in the dQ/dV curves. Second, it facilitates aging state identification, where battery aging leads to active material loss and impedance increases, with these changes manifesting as peak position shifts, peak amplitude reductions, or the appearance of new peaks in the ICA curves, providing sensitive feature indicators for anomaly detection. Third, it supports anomaly pattern recognition, as different failure modes generate unique signatures in the ICA curves, thereby enabling effective anomaly classification.
The specific calculation process for the incremental capacity analysis can be calculated using Equation (1):
where Q represents capacity, and V represents voltage. Through differential calculation of the voltage–capacity data during charging and discharging processes, the incremental capacity curve is obtained.
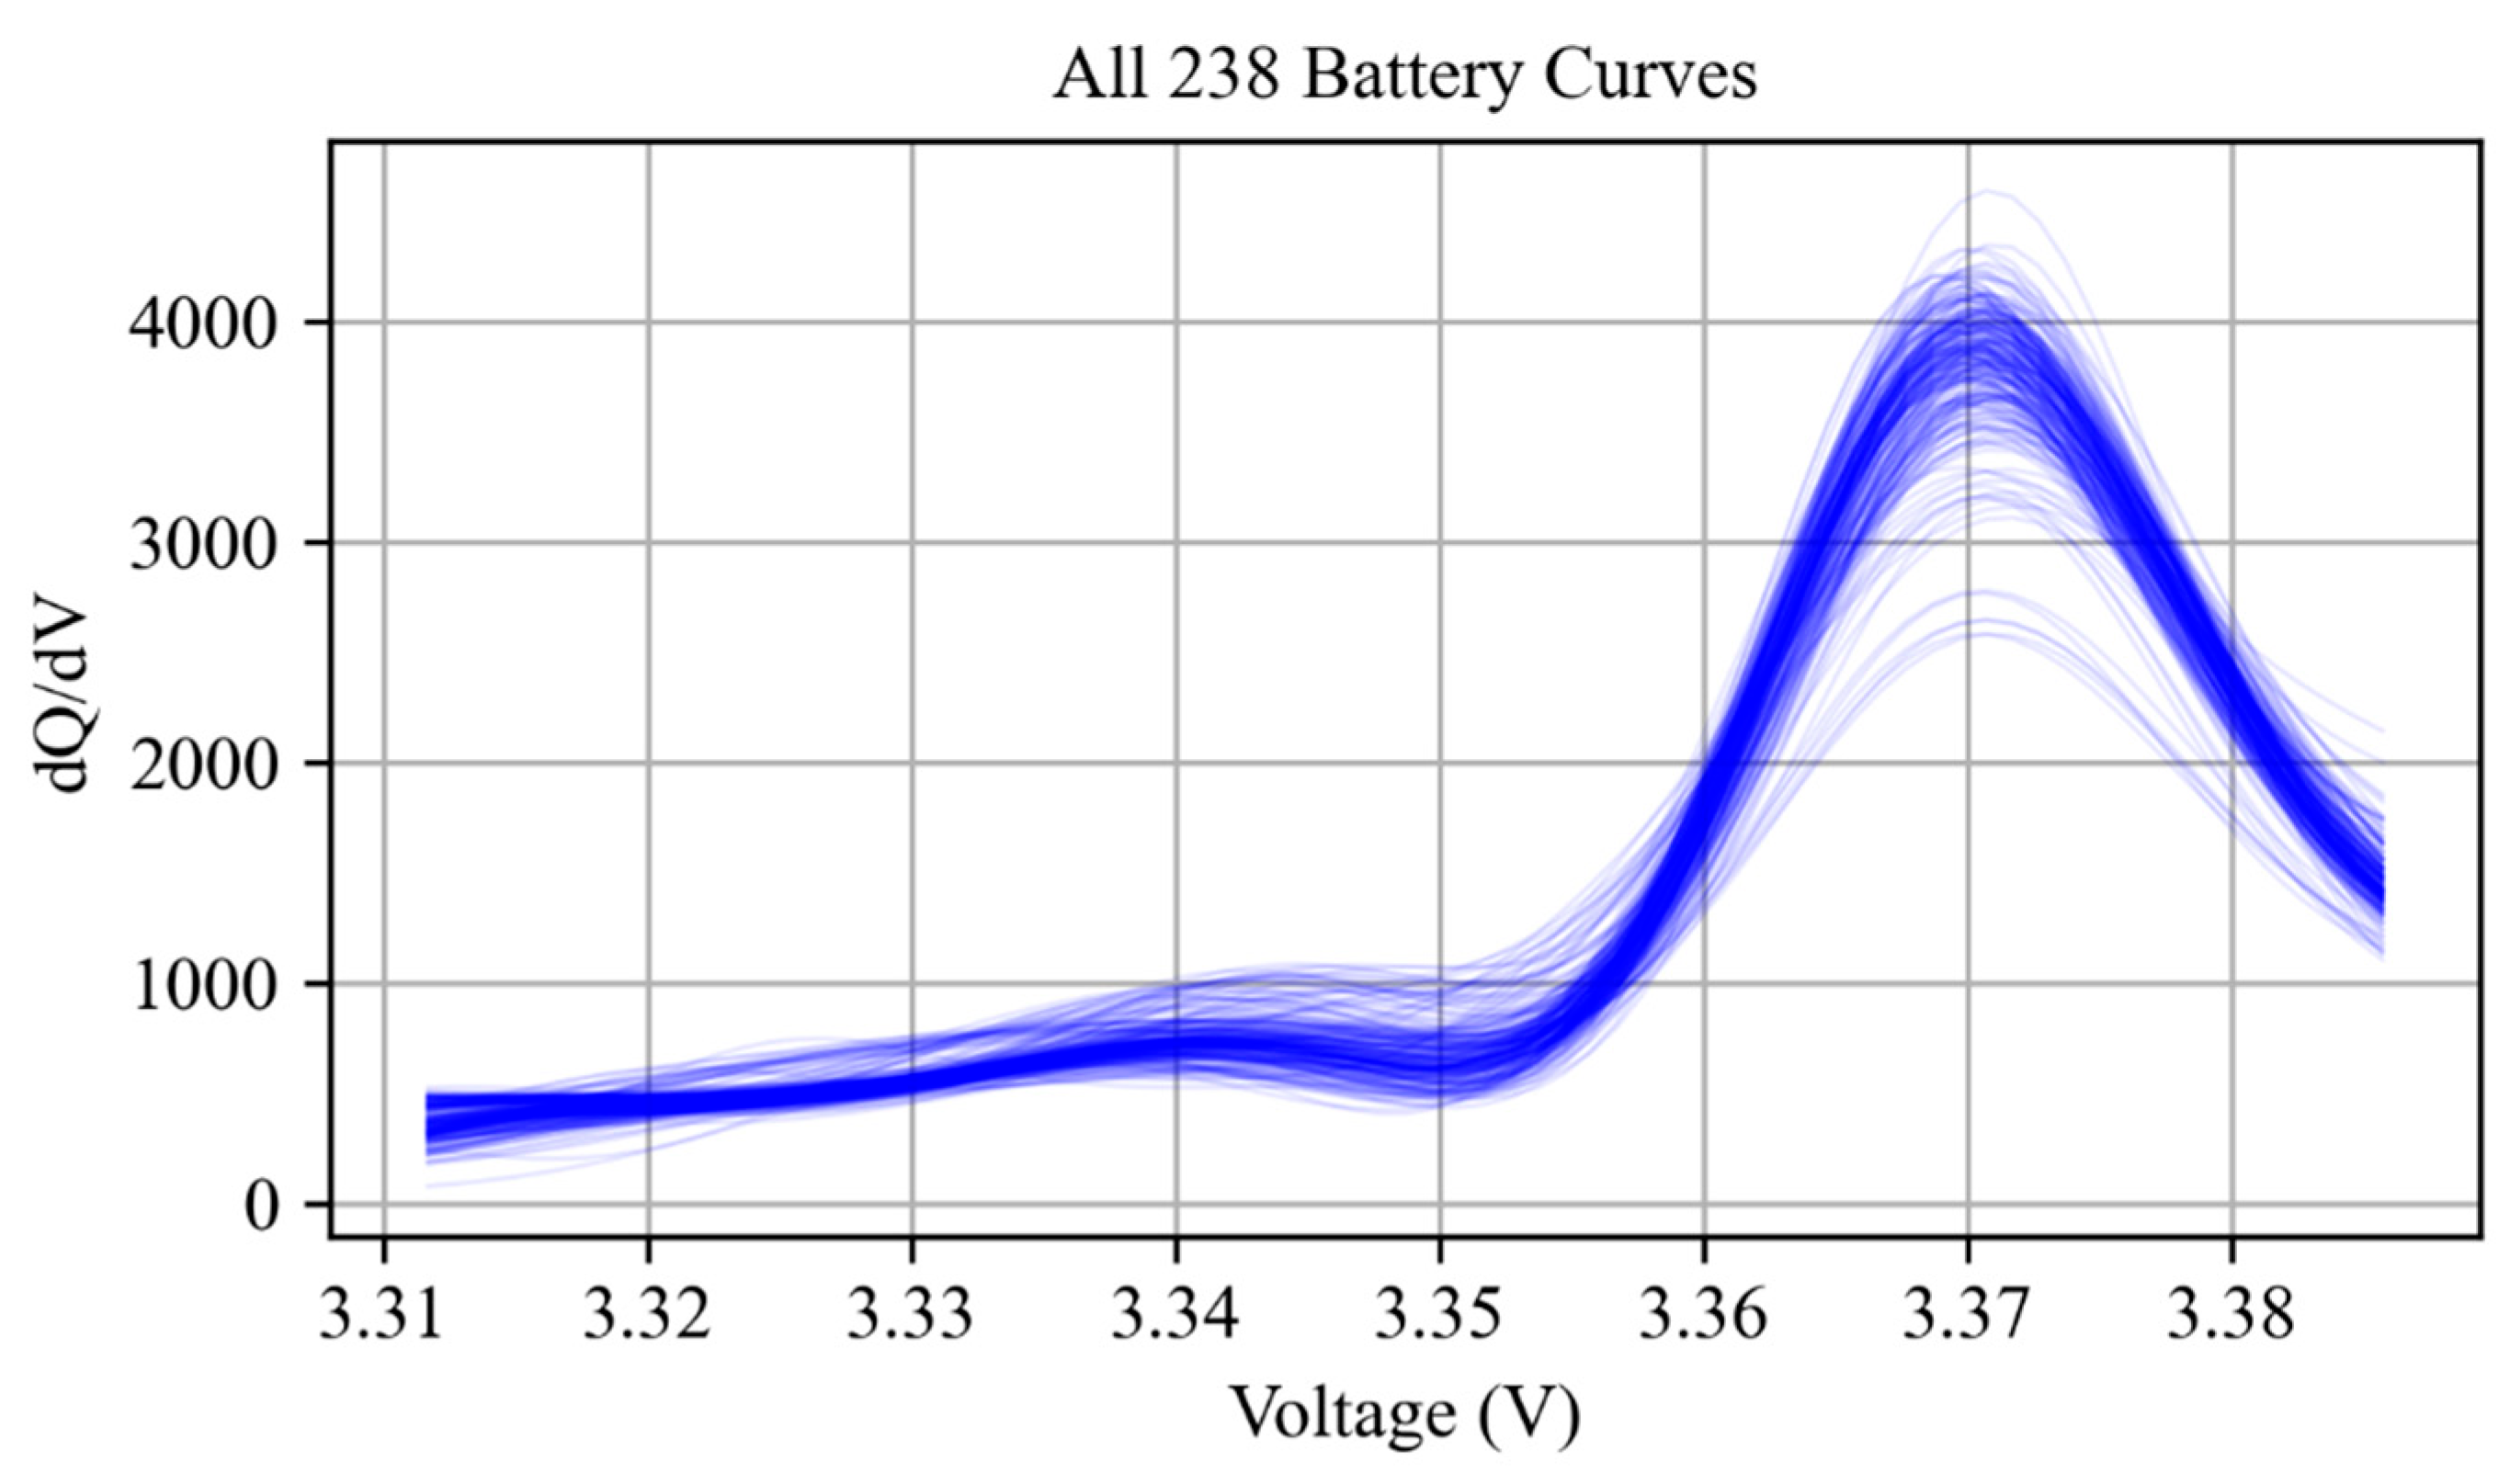
As shown in
Figure 2, after ICA processing, the data exhibits clearer pattern characteristics, with noise effectively suppressed and the differences between different battery cells becoming more apparent.
In the actual operation of energy storage systems, the charge/discharge curves for individual battery cells frequently exhibit temporal misalignment due to variations in the startup timing and minor discrepancies in the charging and discharging rates. Given that cells within the same battery pack share similar electrochemical properties, their charge/discharge curves demonstrate high morphological similarity, with the main differences reflected in time shifts and amplitude scaling. This characteristic provides a theoretical basis for implementing curve alignment techniques. This study employs the dynamic time warping (DTW) algorithm to perform curve alignment, which effectively compensates for nonlinear temporal distortions by identifying optimal time-warping paths. This approach ensures temporal synchronization of charge/discharge profiles across different battery cells while preserving their intrinsic electrochemical characteristics.
Based on the above data characteristics and preprocessing results, this study proposes three anomaly detection methods with different principles, extracting anomaly patterns from different perspectives: the feature extraction and isolation-forest-based method converts time series data into combinations of statistical features and temporal features, utilizing the unsupervised learning capability of the isolation forest algorithm to identify samples that deviate from normal patterns in the feature space; the LSTM autoencoder-based method directly processes time series data, learning the temporal patterns of normal charge/discharge curves through deep learning models and identifying anomalous samples using reconstruction errors; and the functional principal component analysis (FPCA)- and Mahalanobis-distance-based method treats the charge/discharge curves as continuous functions, extracting the main variation patterns in the curves through the functional principal component analysis and measuring the degree of anomaly in the samples in the principal component space using the Mahalanobis distance. This multi-modal fusion-based anomaly detection strategy achieves complementary advantages and performance improvement by combining three algorithms with different principles.
2.2. Anomaly Detection Based on Feature Extraction and Isolation Forests
Following ICA preprocessing and curve alignment, the energy storage system data still exhibits characteristics of high-dimensional time series. Direct anomaly detection in these high-dimensional data faces challenges such as high computational complexity and feature redundancy. Furthermore, given the diversity of the operating modes in energy storage systems, the anomaly patterns often manifest as comprehensive deviations across multiple feature dimensions, making a single-dimensional analysis insufficient to comprehensively identify these complex anomalous behaviors. To address these challenges, this study adopts an anomaly detection method based on feature extraction and isolation forests, converting original high-dimensional time series data into a low-dimensional feature space through feature engineering and then utilizing the isolation forest algorithm to identify anomalous samples.
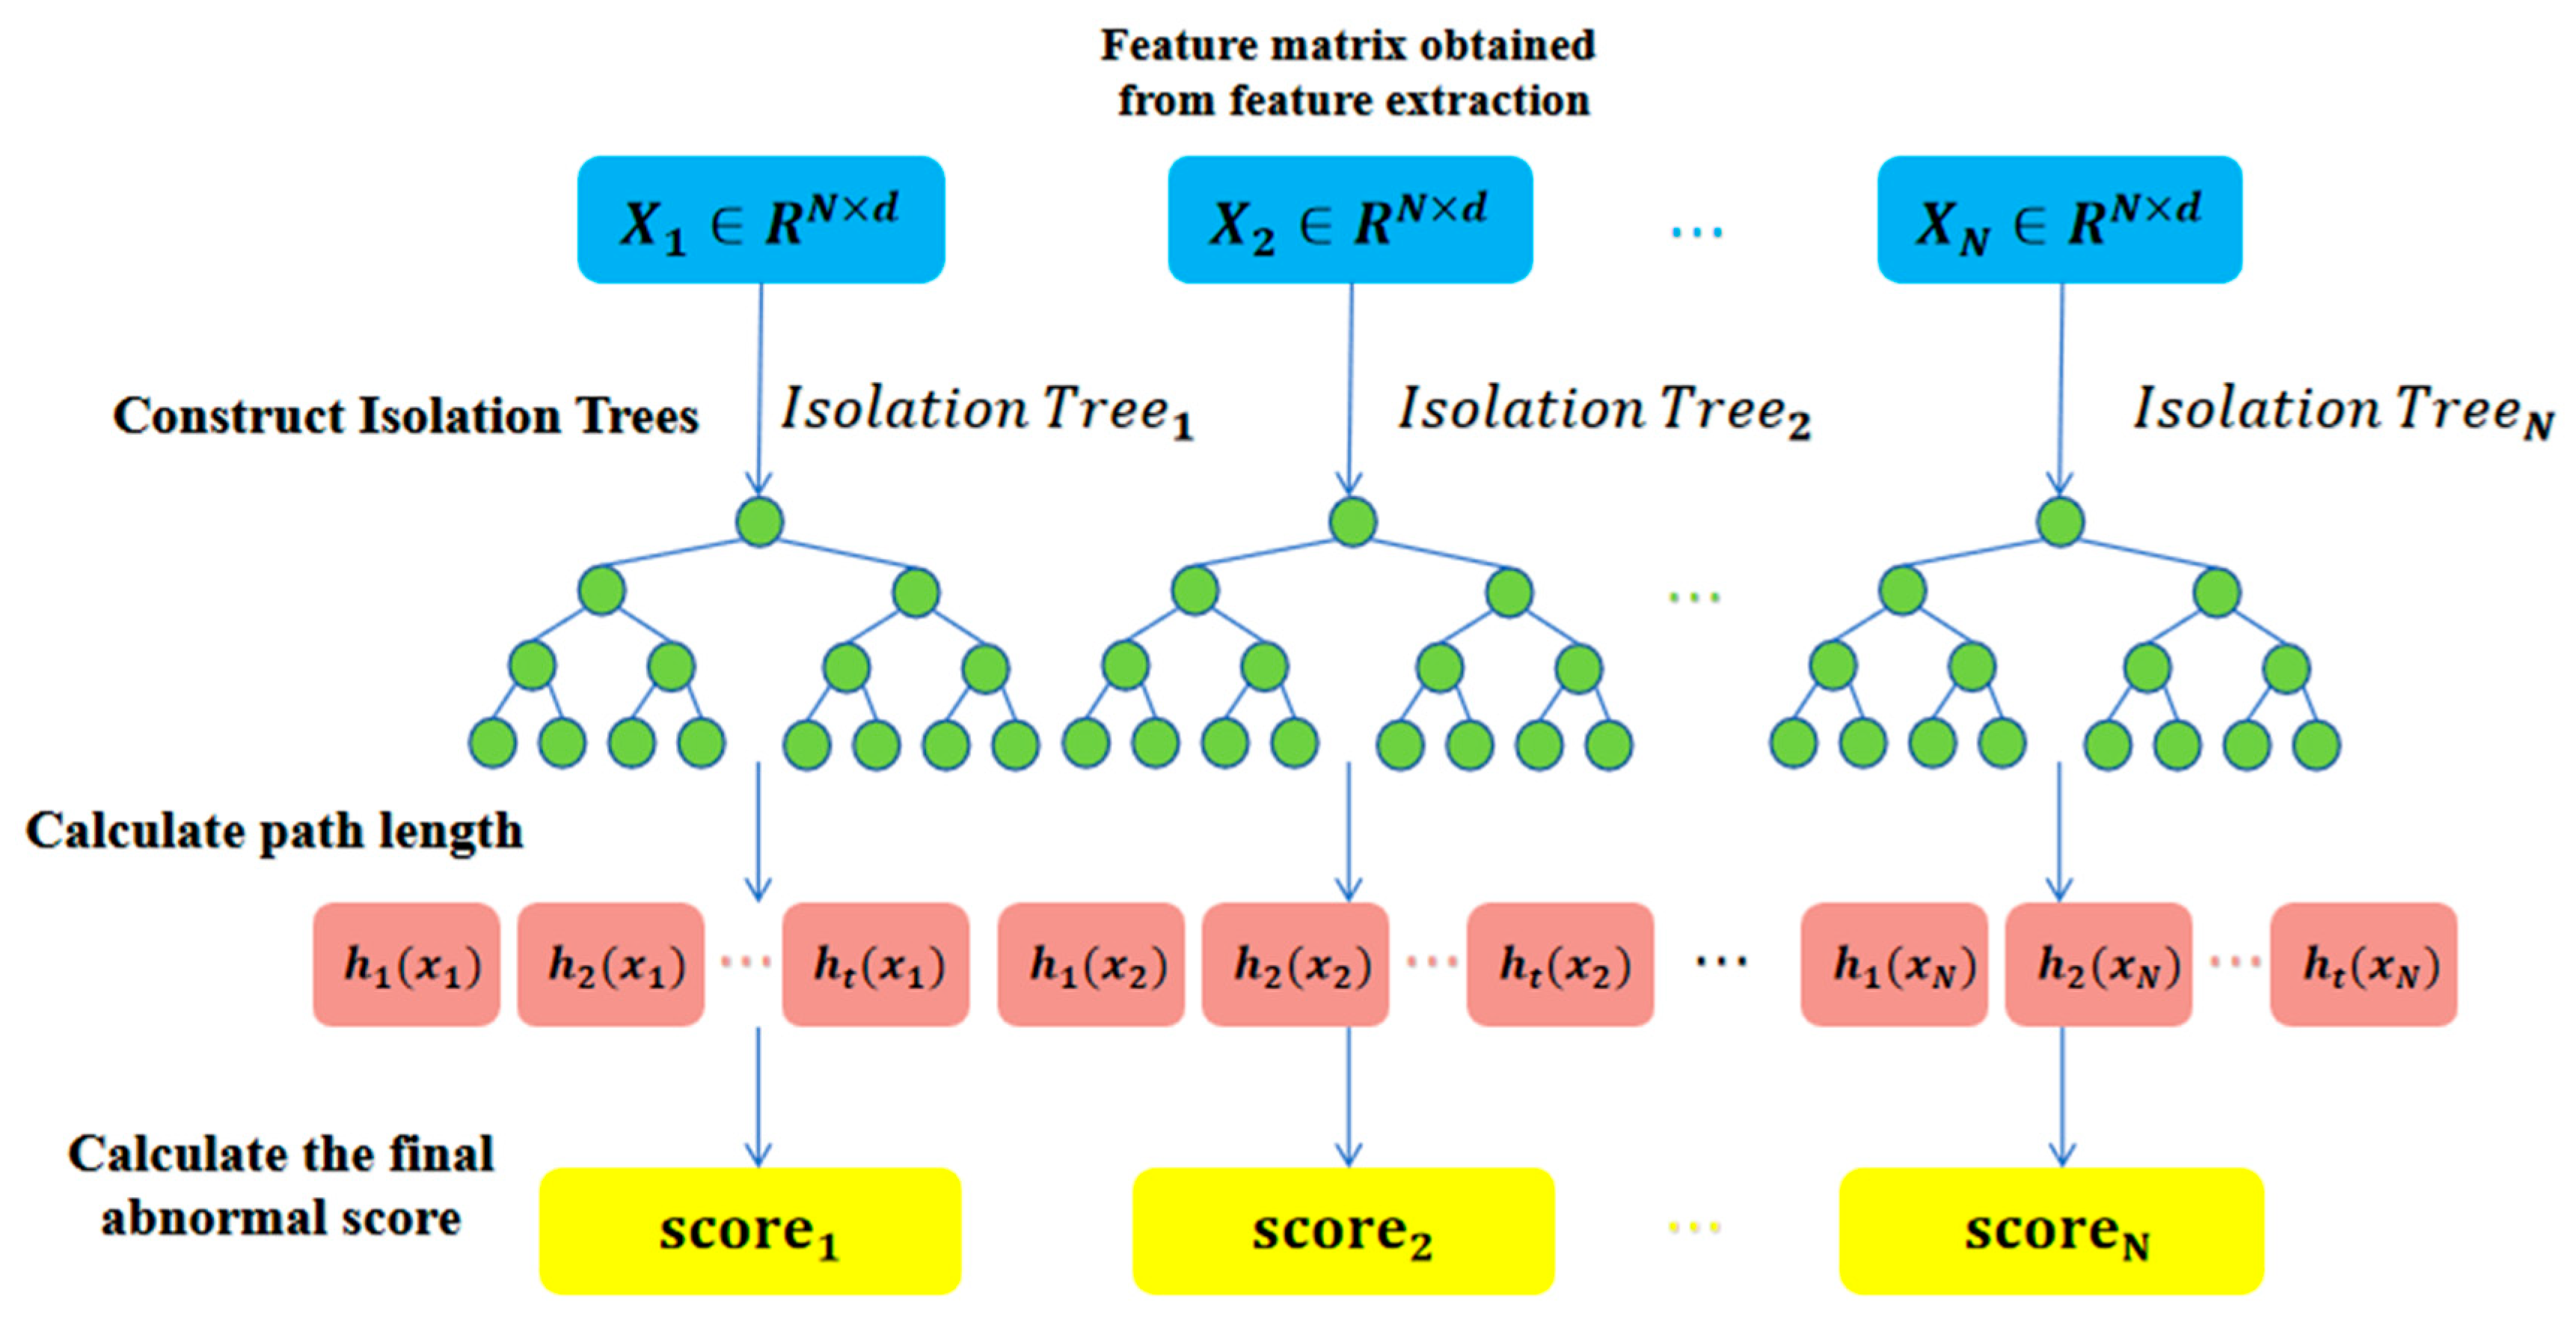
The specific algorithm flow is shown in
Figure 3. First, for the charging and discharging curve data obtained for N lithium battery, each curve can be represented as
, where N is the number of curves and d is the dimension of each curve. To improve the accuracy of anomaly detection, this article utilizes raw battery curve data to extract multiple statistical and temporal features for each curve, aiming to capture the different manifestations of electrochemical anomalies across time, statistics, and functional domains. These features include statistical features (mean, variance, maximum, minimum, range, etc.) and temporal features (utilizing the temporal feature extraction tool tsfresh to automatically extract variation trends, periodicity, and other features for each curve). The quality of feature extraction directly affects the effectiveness of subsequent anomaly detection, and these features can comprehensively reflect the morphology of and dynamic changes in the lithium battery curves, providing a rich foundation of information for anomaly detection models.
Then, the isolation forest algorithm is applied to detecting outliers in the feature matrix. This algorithm achieves anomaly detection by constructing multiple isolation trees, where each isolation tree is a binary tree structure that isolates data points through recursive partitioning of the feature space. In the figure, the nodes of these trees are represented by green circles, indicating decision points that perform data segmentation based on randomly selected features and thresholds. After constructing all isolation trees, for each data point X
i, its path length h
t(X
N) is calculated in each tree t. The average path length of anomalous samples is typically shorter, making them easier to isolate at the edges of the data distribution. Calculation of the final anomaly score is based on the average path length across all isolation trees, defined as Equation(2):
In Equation (2), C (ψ) is the normalization factor, where ψ is the number of training samples, used to eliminate the impact of sample size on path length. Eh(x) is the average path length and can be calculated using Equation (3):
where T is the total number of isolation trees in the isolation forest, and
represents the path length of sample x in the i-th isolation tree. To eliminate the impact of sample size on path length, Equation (4) introduces the normalization factor C(n), representing the average path length of unsuccessful searches in the isolation trees containing n samples, which can be calculated using Equation (4):
respectively, where
represents the harmonic number containing n elements, which can be calculated using Equation (5):
where γ is the Euler constant.
The anomaly score S(x) in Equation (2) ranges from 0 to 1: the closer the anomaly score is to 1, the more likely it is that the sample is anomalous; the closer the anomaly score is to 0, the more likely it is that the sample is normal data. Finally, the top 5% of samples with the highest anomaly scores are adopted as outlier samples.
2.3. LSTM-Autoencoder-Based Anomaly Detection
The charge/discharge processes in energy storage systems demonstrate complex temporal dynamics and nonlinear behavior that are often inadequately captured by conventional statistical feature extraction approaches. Furthermore, manually engineered features may fail to comprehensively represent potential anomaly patterns, leading to insufficient feature representation. To more effectively preserve and exploit the complete temporal information, this study proposes an anomaly detection approach based on an LSTM autoencoder, which directly learns the intrinsic patterns and dynamic behaviors of the time series through a deep learning model.
Before implementing this method, systematic preprocessing of the raw data is required to ensure the quality and consistency of the input data. The first step is multi-dimensional integration, where multiple physical quantities, such as the voltage and current, involved in the charging and discharging process for lithium batteries are concatenated into multi-dimensional sequences in chronological order to maintain the temporal correlation. Next, sequence alignment is performed by padding or truncating the data to ensure that all curves input into the LSTM autoencoder have the same time step length. Additionally, to eliminate the impact of dimensionality, the data is normalized by mapping it to the [0, 1] range, as detailed in Equation (6):
where
and
represent the maximum and minimum values in the sequence, and
represents the normalized value.
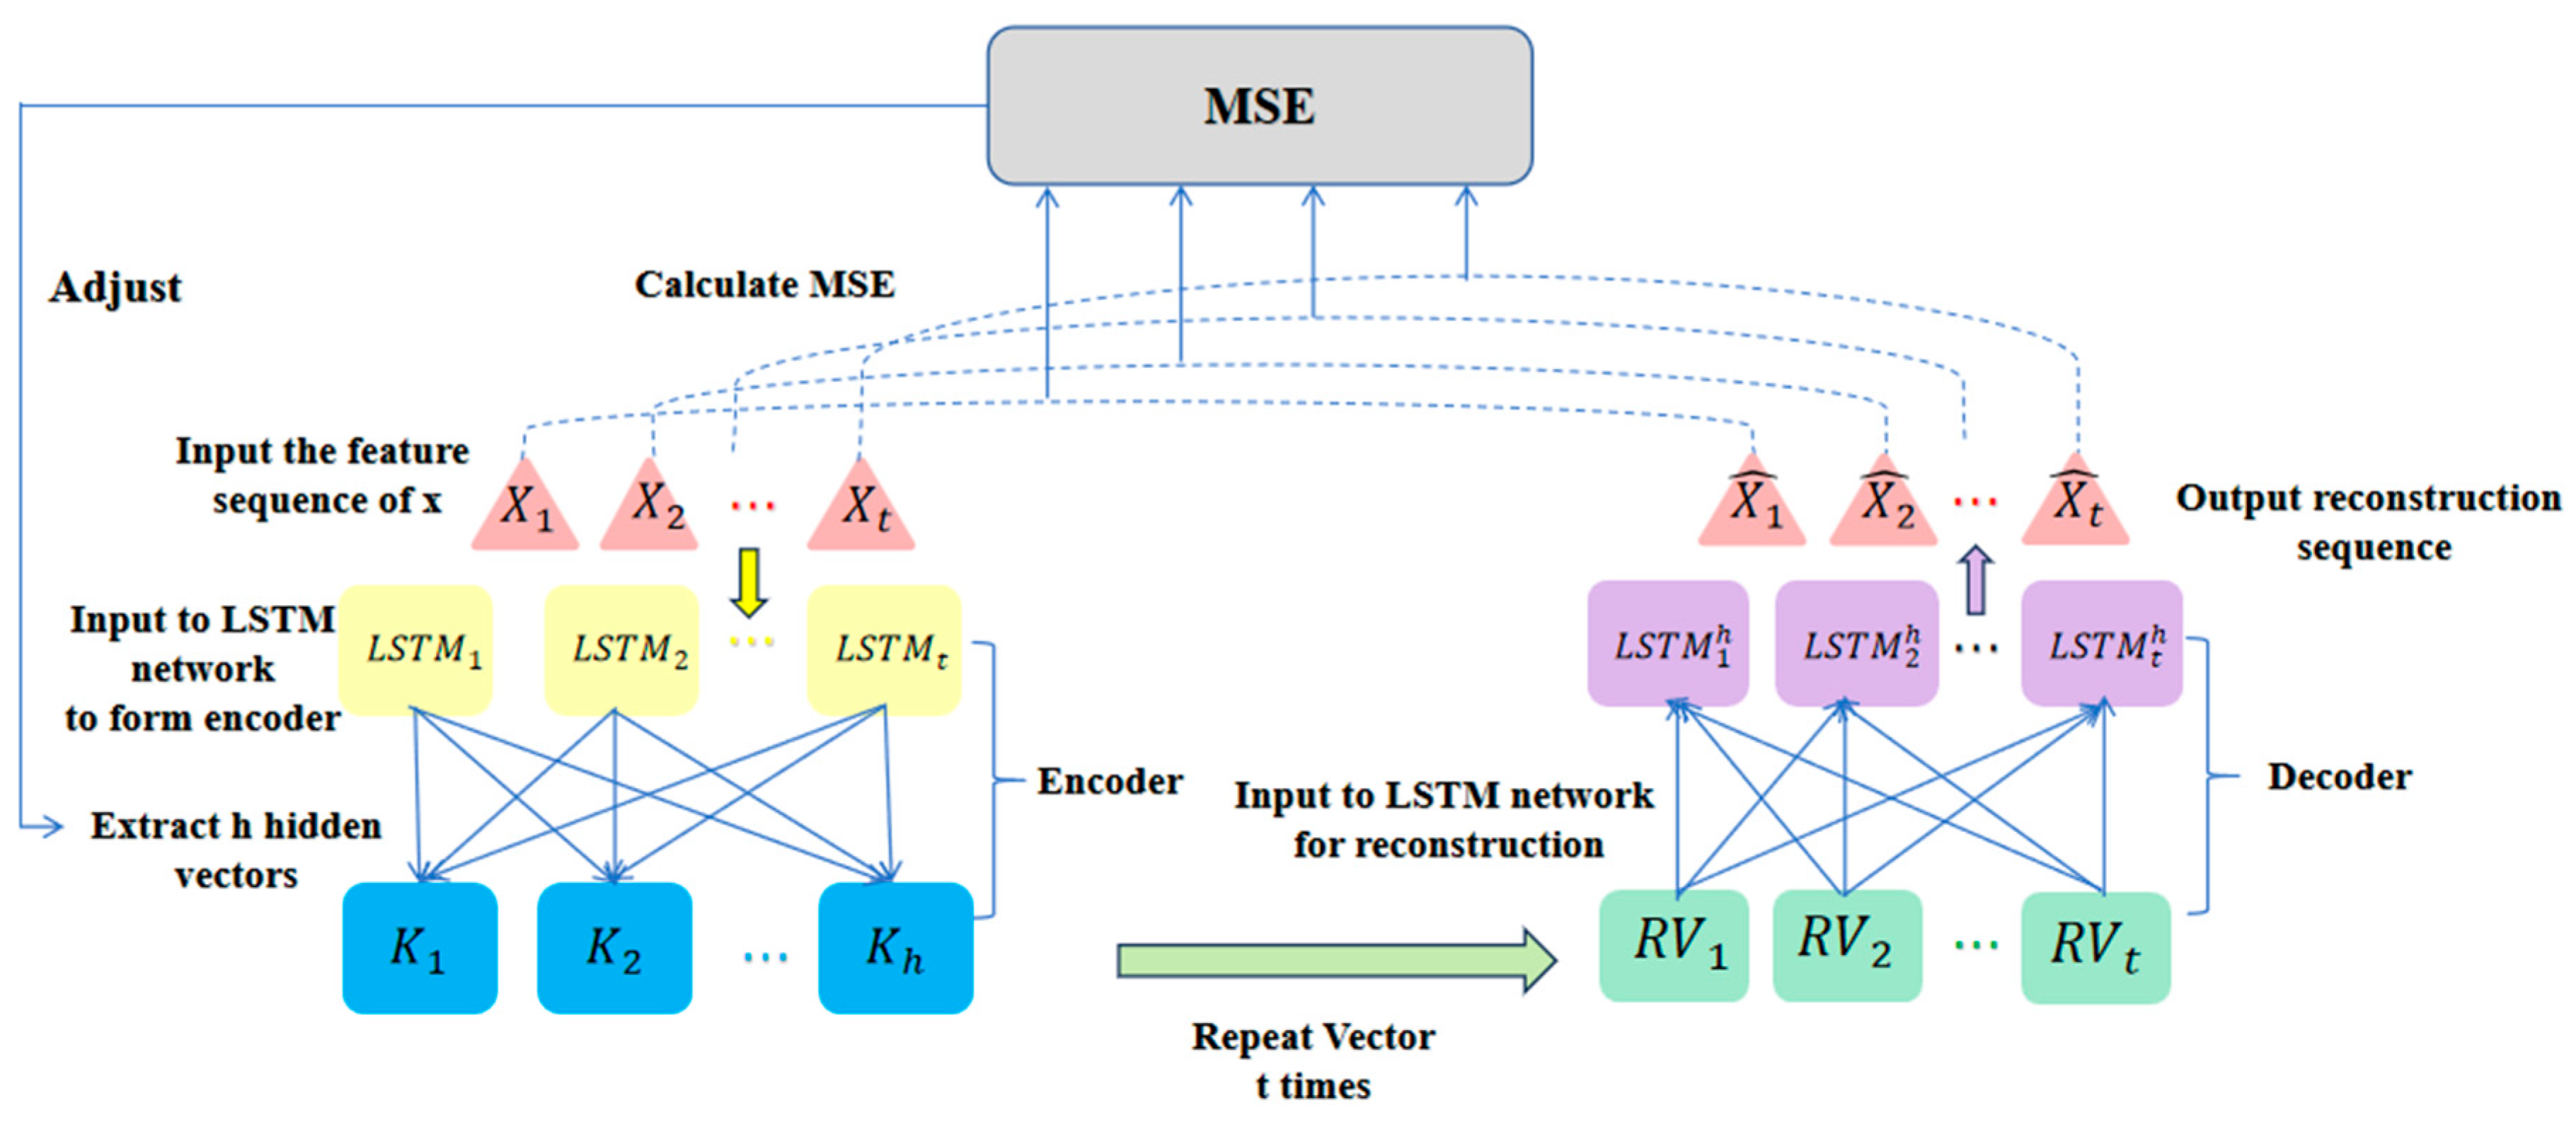
The detailed workflow is illustrated in
Figure 4. Preprocessed data is fed into the LSTM autoencoder architecture. The encoder component employs an LSTM network structure, where sequential processing of the input sequence X = {X
1, X
2, …, Xₜ} through multiple LSTM units outputs h hidden state vectors K
1, K
2, …, Kₕ. These vectors form a compressed representation of the input sequence, encapsulating critical information and features from the original multivariate time series data. Subsequently, the decoder replicates these hidden vectors t times to align temporally with the original sequence. The replicated vectors are processed through another LSTM network to progressively reconstruct the output sequence {
1,
2 …,
t}, computed as Equation (7):
To measure the difference between the reconstruction and the original input, this study uses the Mean Squared Error (MSE) as the loss function. The MSE intuitively reflects the average error at each time step and the feature dimension between the two time series. The calculation method for the MSE follows Equation (8):
where
and
denote the original and reconstructed sequence values at time step t and feature dimension f, respectively. During model training, the LSTM autoencoder’s parameters are adjusted via backpropagation to minimize the MSE loss function. Normal samples, which conform to the distribution and temporal characteristics of the training data, will have small reconstruction errors, whereas anomalous samples, which differ significantly from normal data either in single physical quantities or in the joint variation patterns for multiple physical quantities, will exhibit large reconstruction errors.
Finally, by establishing an appropriate threshold, curves with reconstruction errors above the threshold are identified as outliers. This study employs the 3σ criterion, which assumes that the reconstruction errors in normal data follow a normal distribution. Under this statistical principle, approximately 99.7% of the data points fall within the range of in a normal distribution. Thus, the threshold is defined as . Curves with MSE values exceeding this threshold are classified as outliers, while those within the range are considered normal.
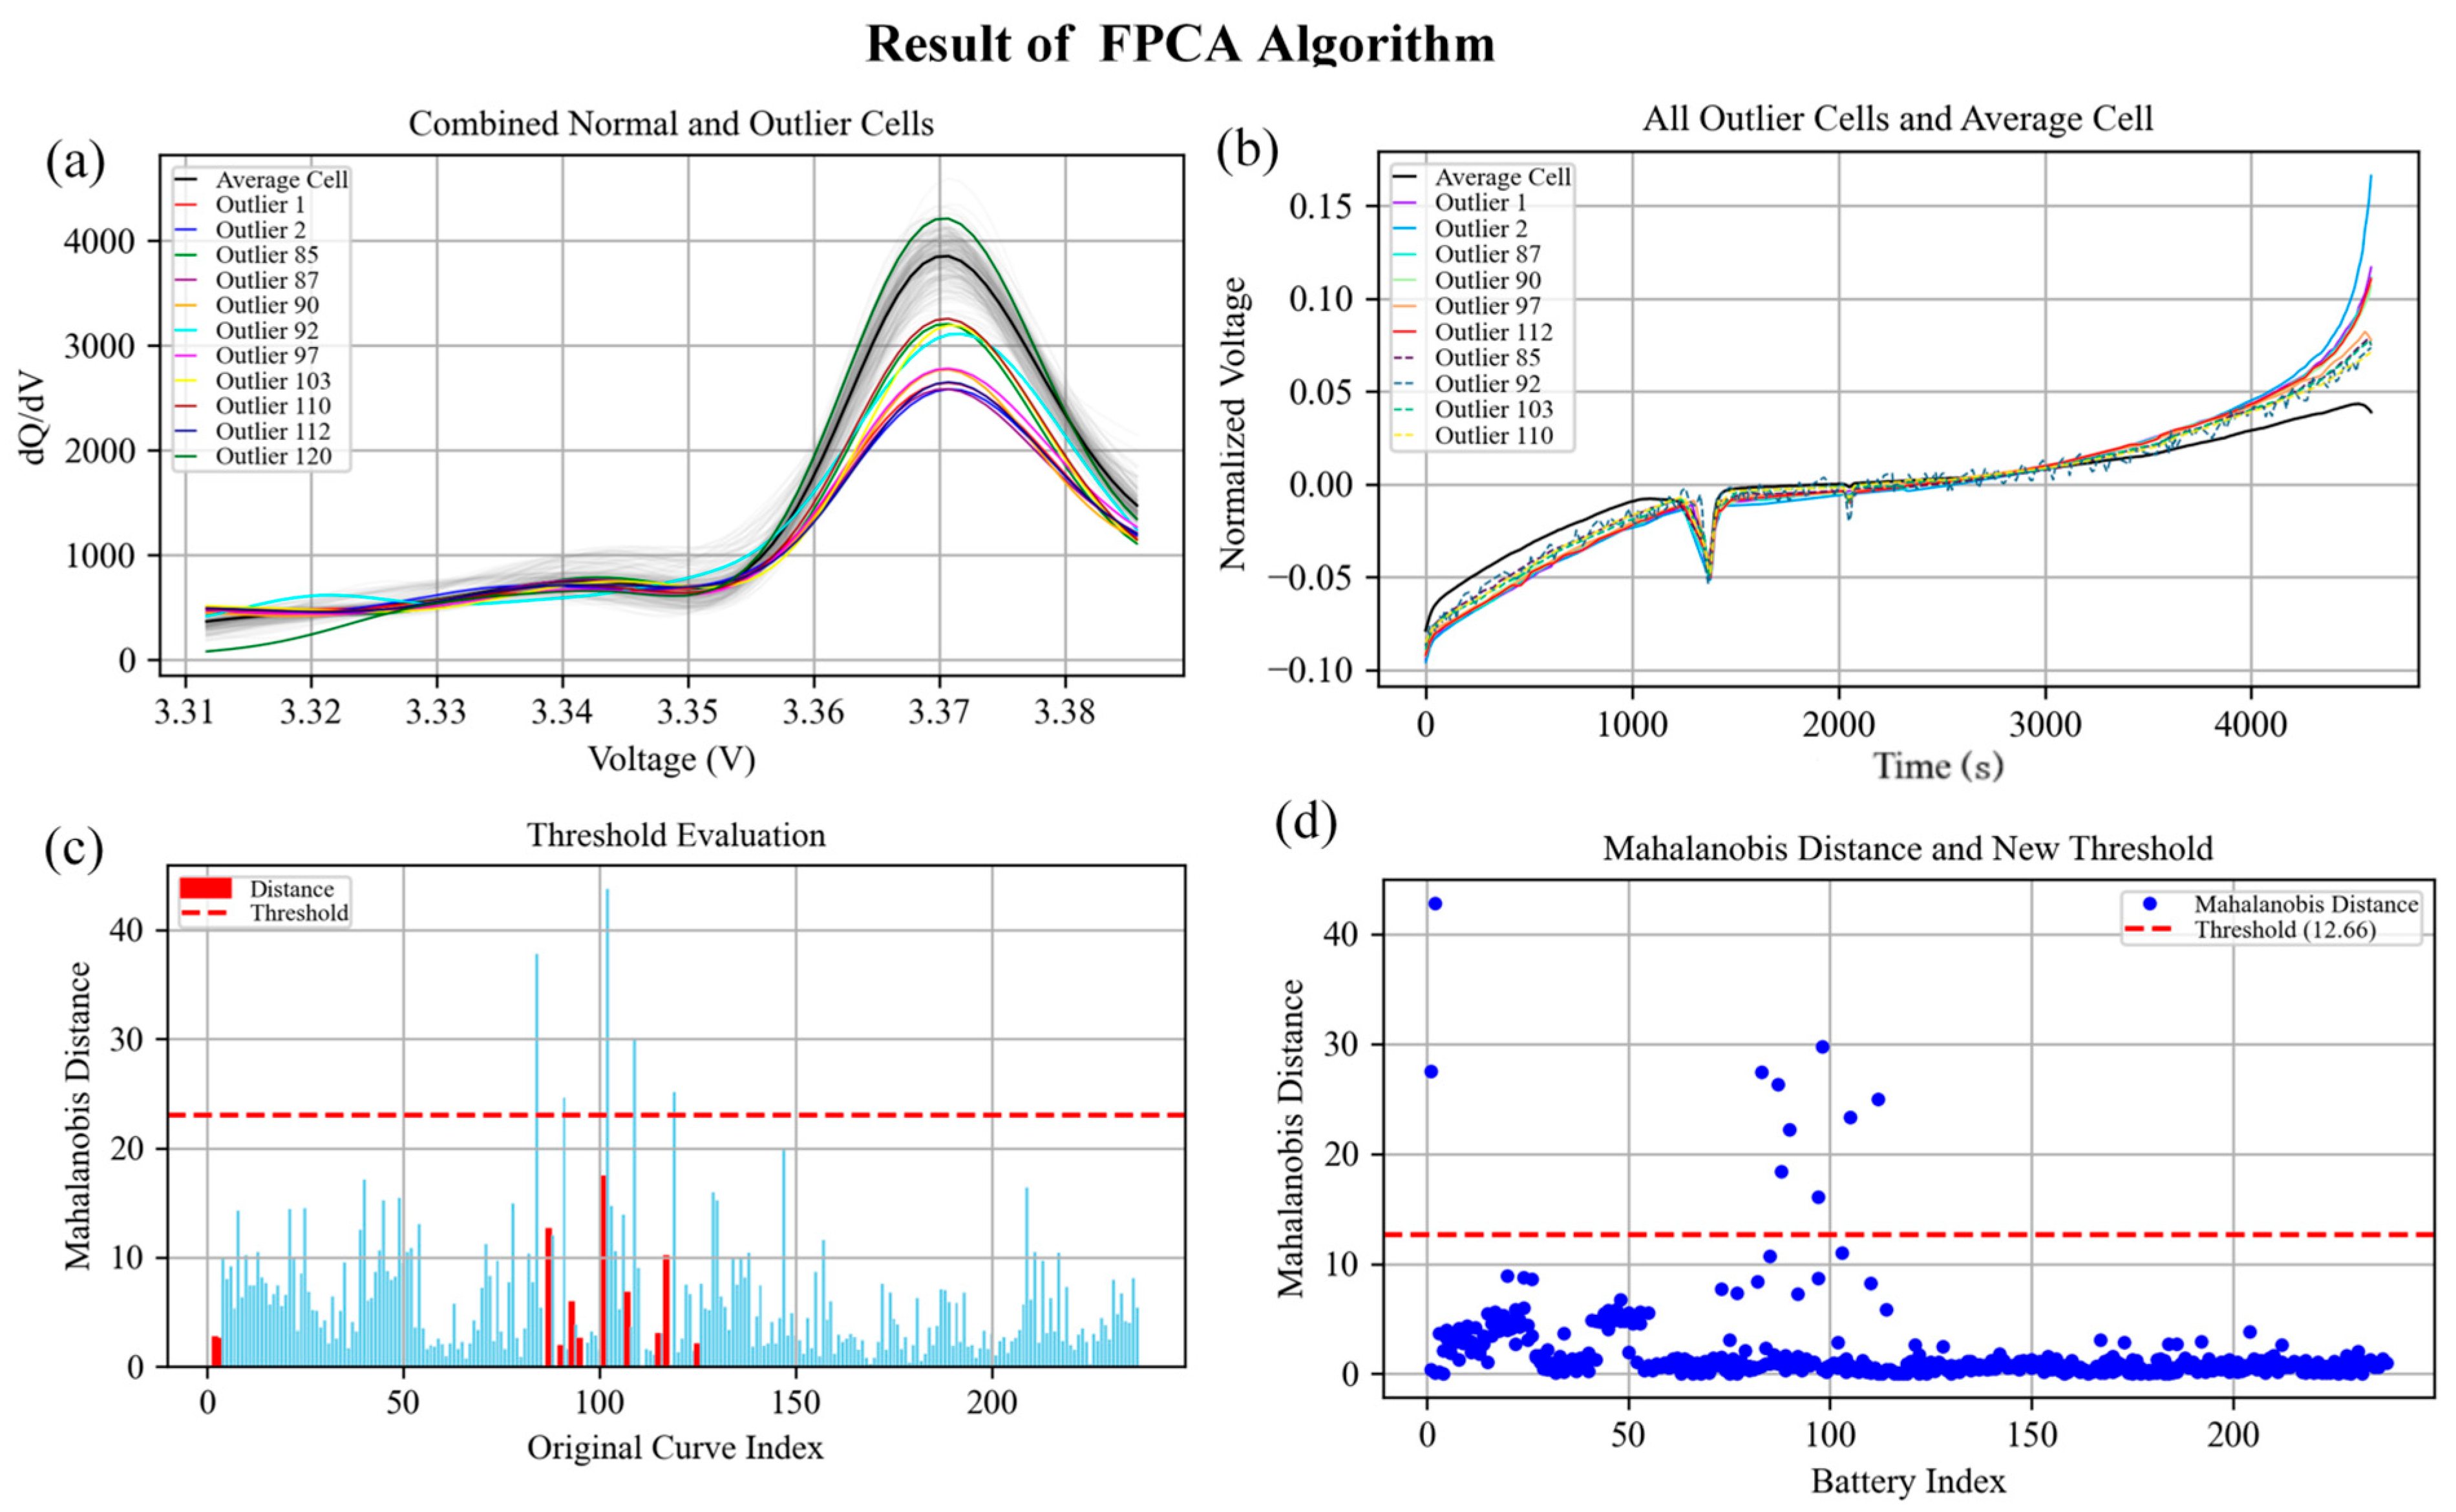
2.4. Anomaly Detection Leveraging a Functional Principal Component Analysis and the Mahalanobis Distance
Certain anomalies in energy storage systems may exhibit subtle morphological variations in charge/discharge profiles. While these variations may be imperceptible at discrete time points, they demonstrate statistically significant deviations in the overall curve geometry. Traditional discrete-time point-based analysis methods struggle to capture such continuous shape anomalies and are susceptible to the sampling frequency and data noise. To more effectively characterize and analyze these functional curve characteristics, this study employs an anomaly detection method based on a functional principal component analysis (FPCA) and the Mahalanobis distance, modeling the charge/discharge curves as continuous functions.
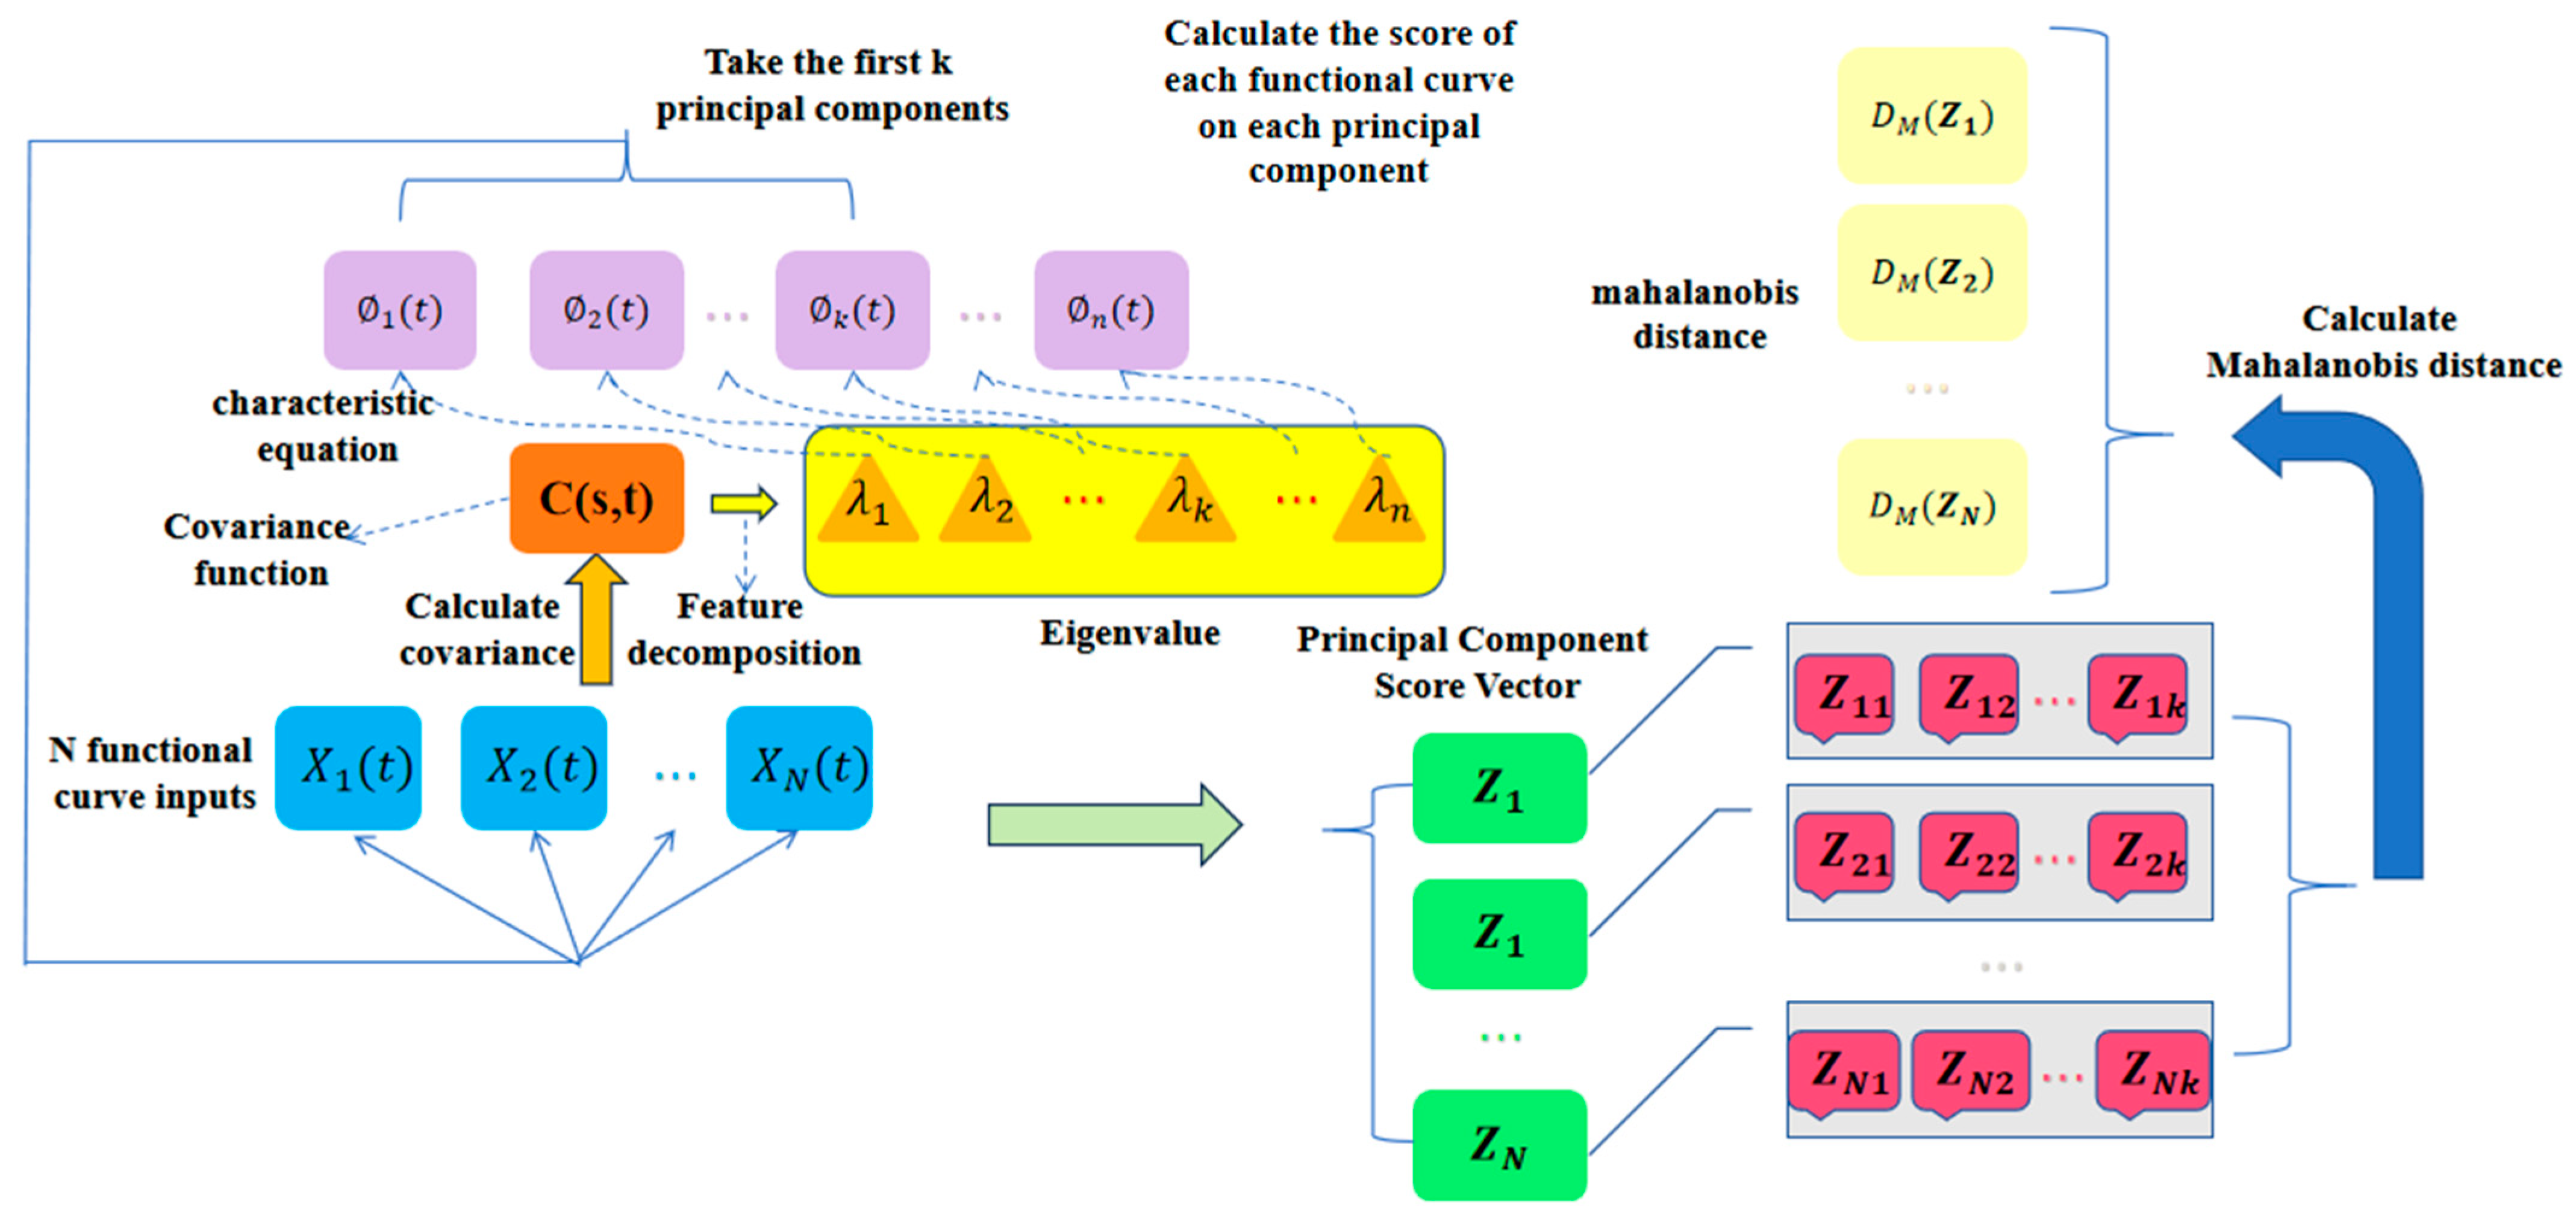
As illustrated in
Figure 5, the FPCA-MD methodology comprises the following key steps. First, the input
N lithium battery voltage curves
are processed as functional data within a unified temporal domain. Unlike a conventional multivariate analysis, the functional data analysis incorporates temporal continuity and functional correlations between data points, thereby more effectively capturing the global shape characteristics and local variation patterns in the curves. Subsequently, the covariance function
C(s, t) is computed across all sample curves to characterize the correlation structure between distinct time points, defined as Equation (9):
where
denotes the mean function across all curves at time t. Through eigen decomposition of the covariance function, the eigenvalues
and corresponding eigenfunctions
are obtained.
The eigenvalues are sorted in descending order, indicating the relative contribution of each principal component to the total variance. Higher eigenvalues correspond to dominant variation patterns that capture the most significant data features. The eigenfunctions φₖ(t) characterize the functional form of the k-th principal component, forming an orthonormal basis in the function space where each eigenfunction represents a distinct variation pattern. Based on the cumulative contribution rate criterion, the first k principal components are selected to preserve the most informative data features while accounting for the predominant portion of the total variance. The principal component scores are computed by projecting original curve data onto the functional principal component space, with the score for the i-th curve for the k-th principal component given by Equation (10):
This dimensionality reduction process transforms the high-dimensional functional data into low-dimensional principal component score vectors , preserving essential information while significantly simplifying the subsequent anomaly detection computations.
Calculation of the Mahalanobis distance serves as the core anomaly detection mechanism, which inherently incorporates both inter-component correlations and differential weighting of the principal components based on their variance contributions. Let
μ denote the mean vector of all principal component score vectors and
C their covariance matrix. The Mahalanobis distance
for a score vector
Z is computed as Equation (11):
The determination process for anomaly detection is based on the statistical properties of the Mahalanobis distance. Under the assumption of a multivariate normal distribution, the square of the Mahalanobis distance follows a chi-square distribution, and the threshold for anomaly detection can be determined by setting a confidence level. If DM(Zi) for a certain curve exceeds the preset threshold, the curve will be marked as an abnormal one.
2.5. The Multi-Model Weighted Fusion-Based Anomaly Detection Method
2.5.1. Calculating the Fusion Weights
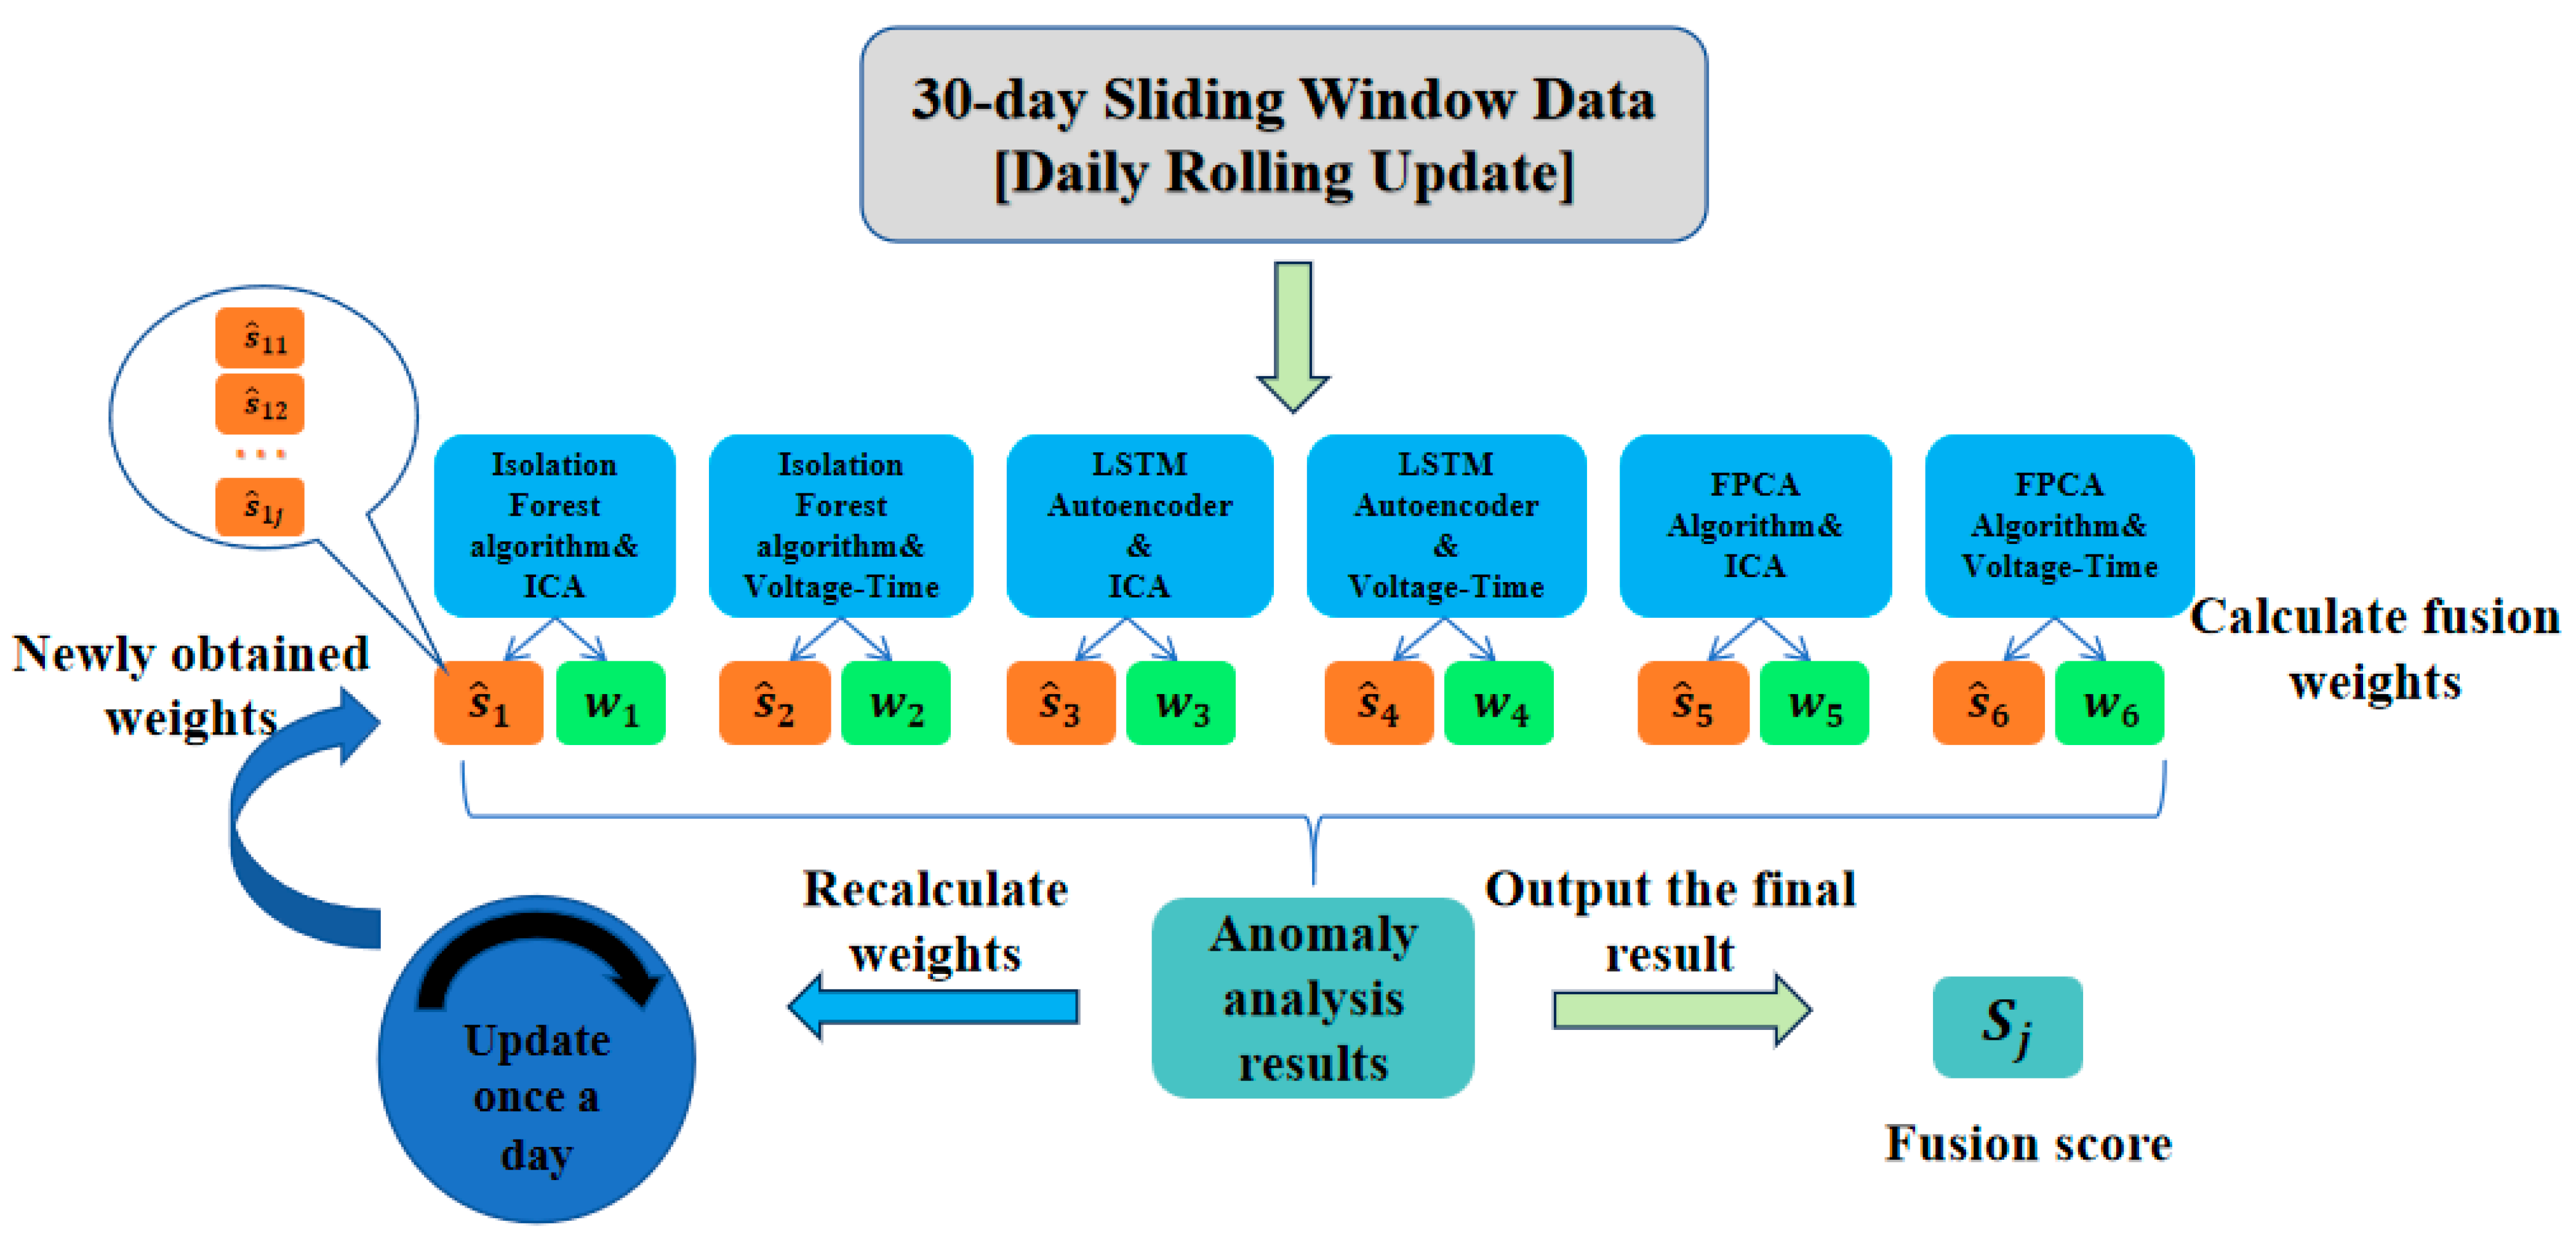
In anomaly detection for energy storage systems, individual detection algorithms frequently exhibit a limited capability in addressing diverse and complex anomaly patterns, leading to risks of misjudgment or missed detection. To enhance the model’s robustness and detection accuracy, this study proposes a multi-model weighted fusion-based anomaly detection strategy. This method integrates detection results from three distinct algorithms—isolation forests, LSTM autoencoders, and the FPCA with the Mahalanobis distance—each applied to both the original and ICA-preprocessed datasets, thereby generating six complementary detection outcomes. This weighted fusion strategy enables a robust multi-perspective anomaly assessment through the systematic integration of complementary detection results.
The specific implementation process is as follows: First, based on historical data from the past month for the same battery cluster (with identical current), three algorithms, respectively, are applied to the original voltage data and the ICA-preprocessed data for anomaly detection, generating six detection results in total. Each algorithm–data combination can identify anomalous behavior in individual battery cells from different perspectives, where the original voltage data preserves the complete physical information while the ICA-preprocessed data highlights key features after denoising.
In the fusion decision stage, a majority voting mechanism is employed to determine anomalous samples. If a battery cell is identified as anomalous in four or more of the six detection results, it is considered anomalous. This decision mechanism effectively reduces misjudgments from single algorithms and improves the reliability of the detection results.
Let each detection method be denoted as . Each detection method outputs a set of anomaly scores for all samples to be detected , where represents the anomaly score of method for the sample, ranging from [0, 1], with values closer to 1 indicating a higher likelihood of an anomaly.
To reflect the differences in the contribution of different methods to anomaly identification, this study assigns weights to each method based on its historical data detection performance, calculating the recall rate
and the precision rate
for each algorithm–data combination. Combinations with higher performance indicators are assigned greater weights. The F1 score is calculated as the performance evaluation metric for method
and can be expressed as Equation (12).
Subsequently, the F1 scores for the six methods are normalized to obtain the fusion weight
for each method and can be expressed as Equation (13).
This dynamic weight adjustment mechanism can adaptively optimize the contribution of each algorithm, maintaining a good detection performance under different operating conditions and anomaly types.
Considering that the anomaly scores generated by different methods may have scale inconsistencies or distribution shift issues, standardization processing of each method’s score sequence
is required. This study employs Z-score standardization to linearly map scores to the [0, 1] interval, which can be calculated using Equation (14):
where
and
are the mean and standard deviation of the method’s scores for all samples, respectively, and
is the standardized anomaly score. Subsequently, for each sample
, its final anomaly score
under the fusion model is calculated as Equation (15):
This fusion score comprehensively integrates the judgment results and weight information from multiple methods, providing a more comprehensive reflection of the sample’s degree of anomaly.
2.5.2. The Dynamic Weight Adaptation Mechanism
To address the temporal evolution of the battery characteristics in continuously operating BESSs, a dynamic weight adaptation mechanism is incorporated into the multi-model fusion framework. This approach recognizes that the relative effectiveness of individual detection algorithms may shift as the batteries undergo aging-induced changes in their electrochemical behavior patterns.
The dynamic weight updating operates on a 30-day sliding window principle, as illustrated in
Figure 6. Each day, the framework processes the most recent 30-day operational history through all six algorithm–data combinations (S
1 through S
6), generating both anomaly detection results and performance metrics for weight recalibration. This daily recalibration process ensures that the fusion weights continuously adapt to evolving battery characteristics, maintaining the optimal detection performance throughout the system’s operational lifetime.
The physical justification for this adaptive approach lies in the evolving nature of the battery degradation mechanisms, where early-phase anomalies may favor statistical detection methods, while advanced aging patterns enhance the effectiveness of temporal and functional analysis approaches.
This dynamic adaptation capability addresses the fundamental challenge of maintaining detection accuracy in the presence of gradual shifts in normal battery behavior patterns.
3. Results
3.1. The Experimental Procedure
This study investigates real-world charge/discharge datasets collected from operational battery energy storage systems. Constant-current (CC) charging data were extracted from the datasets, along with the corresponding voltage–time profiles and incremental capacity analysis (ICA) curves. The results reveal that the ICA effectively mitigates the influences of sensor bias and data noise on abnormal cell detection. Furthermore, to evaluate the performance of the three proposed algorithms (the isolation forest, LSTM autoencoder, and FPCA-MD) and their fused ensemble, anomaly detection was conducted on the dataset using each individual algorithm, as well as the integrated approach. The experimental procedure comprises the following key steps:
Step 1. Process the constant-current charging data to obtain the corresponding voltage–time data and ICA curve data;
Step 2. Apply the isolation forest algorithm to the data obtained in Step 1 for abnormal cell detection, and record the detection results for anomalous cells;
Step 3. Apply the LSTM autoencoder algorithm to the data obtained in Step 1 for abnormal cell detection, and record the detection results for anomalous cells;
Step 4. Apply the functional principal component analysis algorithm to the data obtained in Step 1 for abnormal cell detection, and record the detection results for anomalous cells;
Step 5. Apply the fusion algorithm to the data obtained in Step 1 for abnormal cell detection, record the numbers of abnormal cells, and generate the final battery anomaly scores.
3.2. The Experimental Results
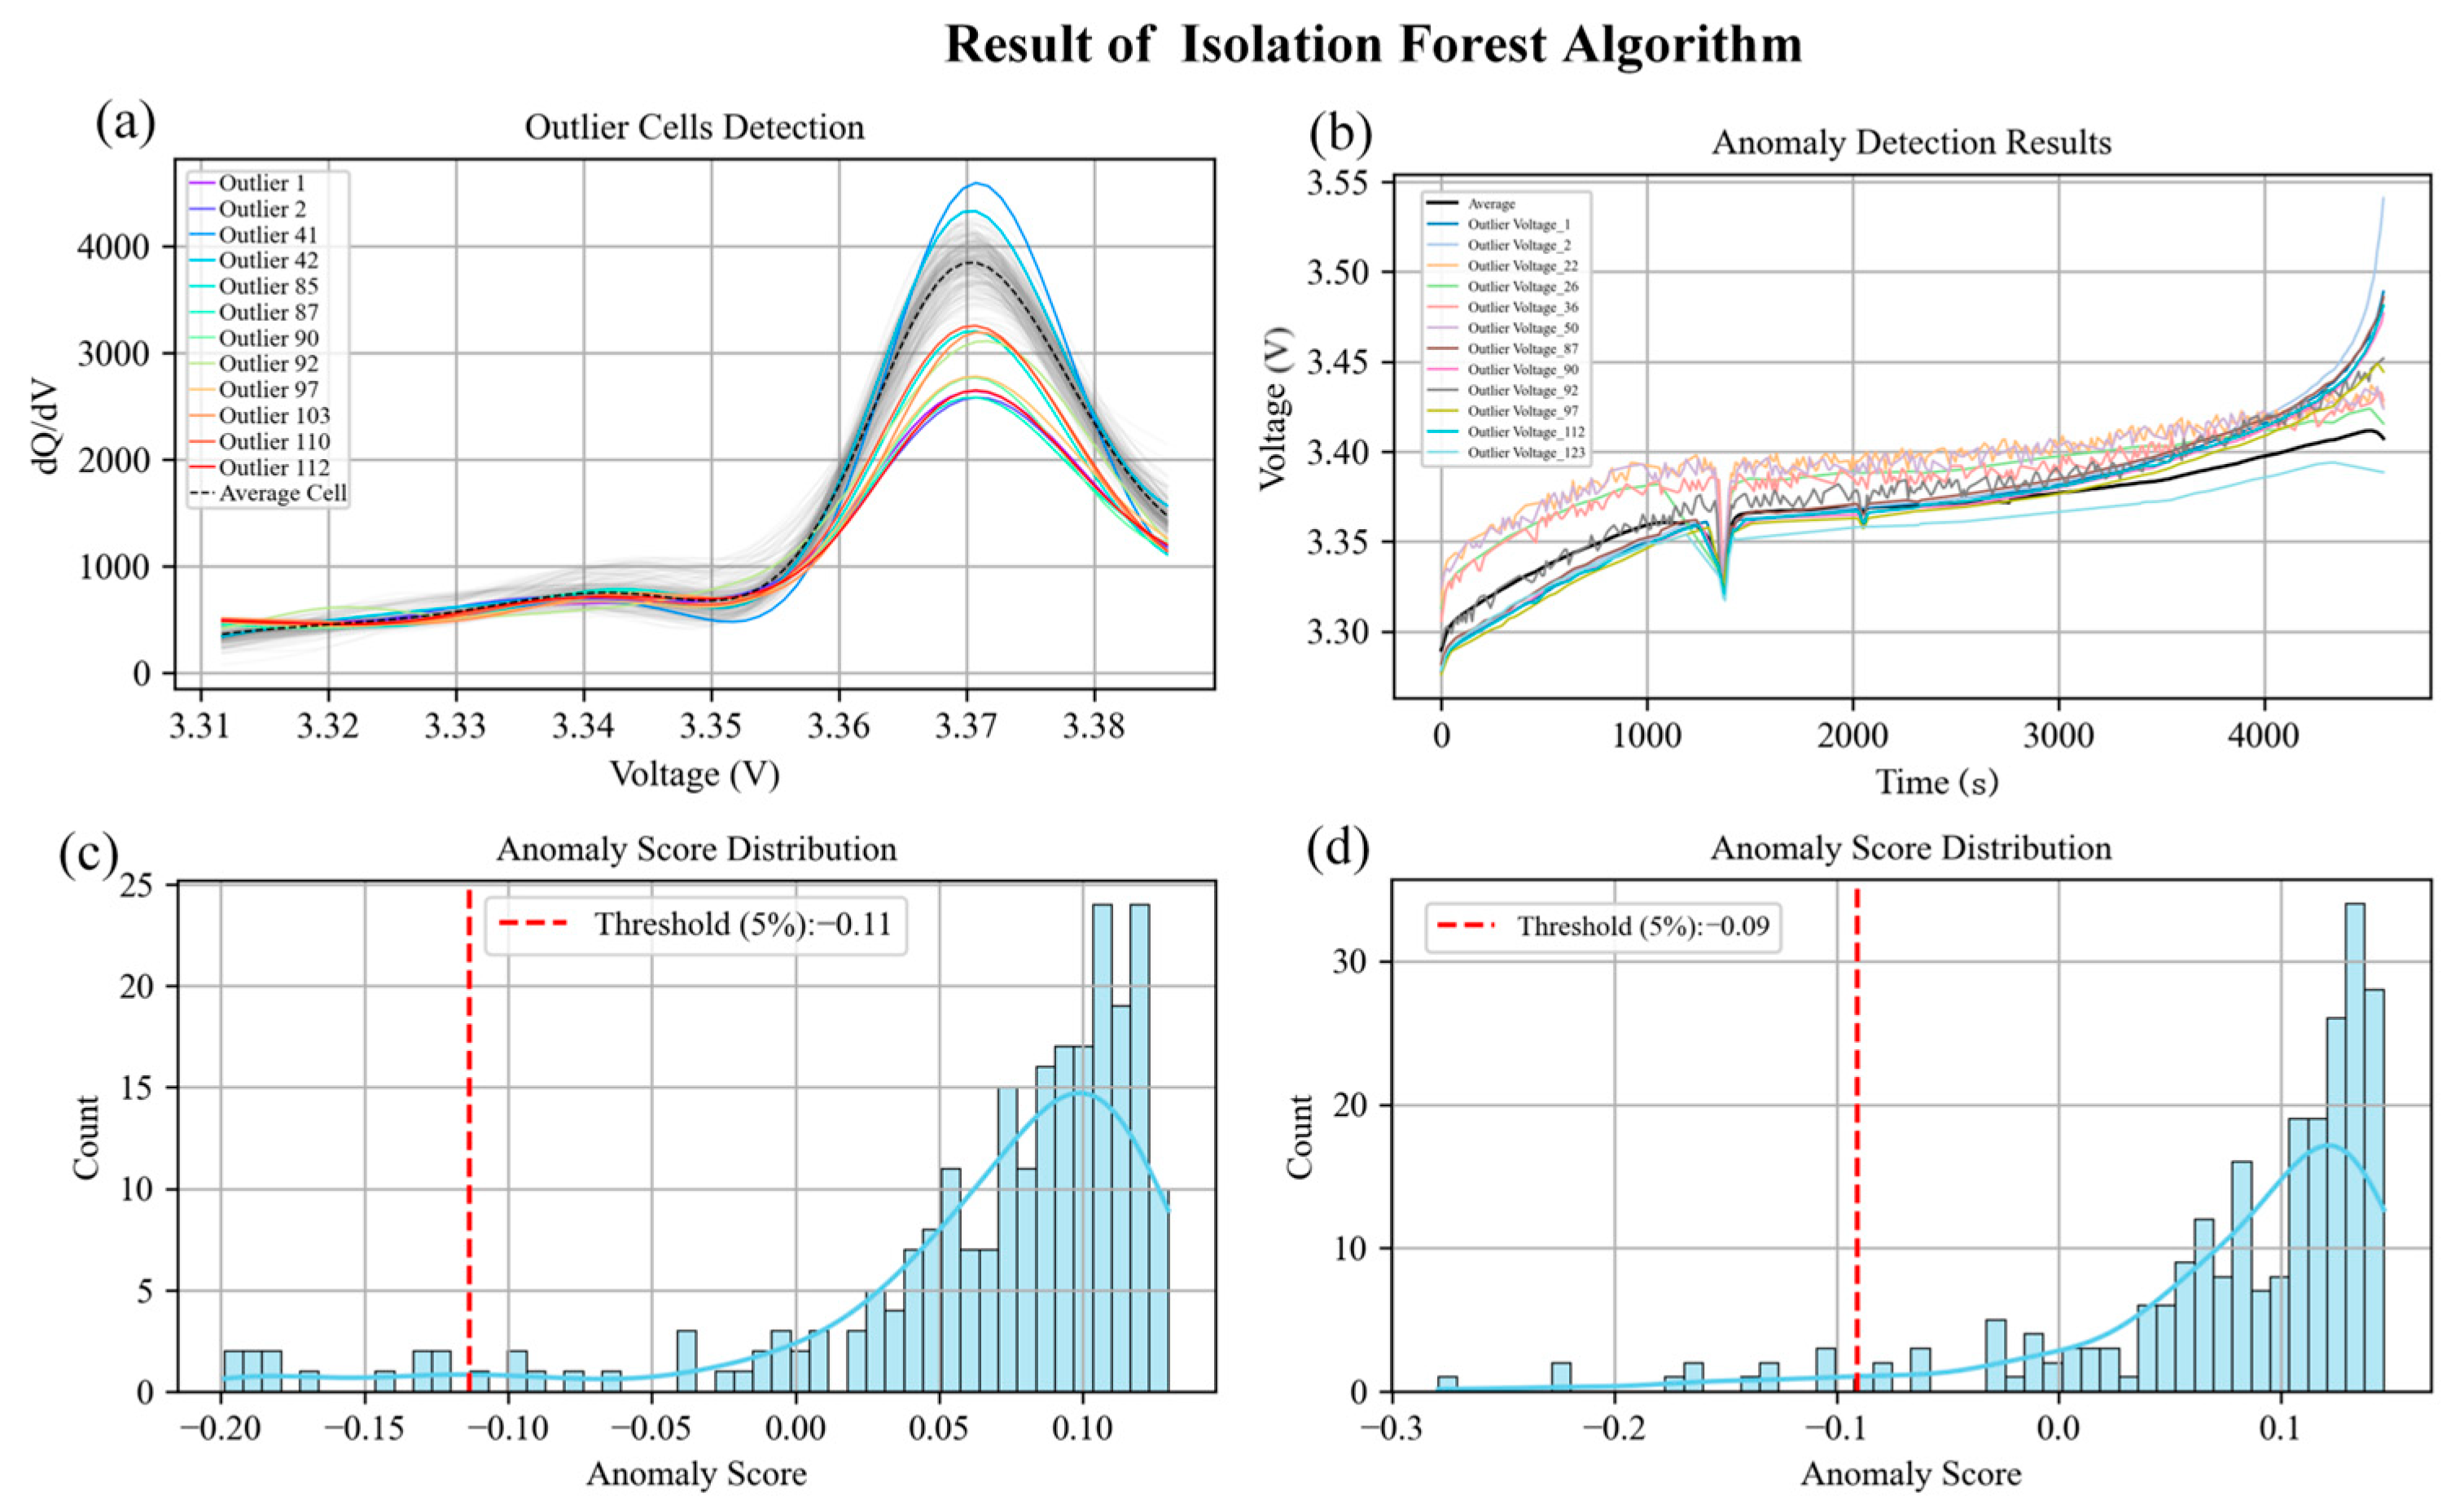
Figure 7 shows the results of detecting anomalous cells in the ICA curve dataset and the voltage–time dataset for a certain battery cluster, respectively, based on feature extraction and the isolation forest algorithm. When the ICA curve dataset was used for detection, the detected anomalous cells were the batteries numbered 1, 2, 41, 42, 85, 87, 90, 92, 97, 103, 110, and 112. When the voltage–time dataset was used for detection, the detected anomalous cells were the batteries numbered 1, 2, 22, 26, 36, 50, 85, 87, 90, 92, 97, 112, and 123.
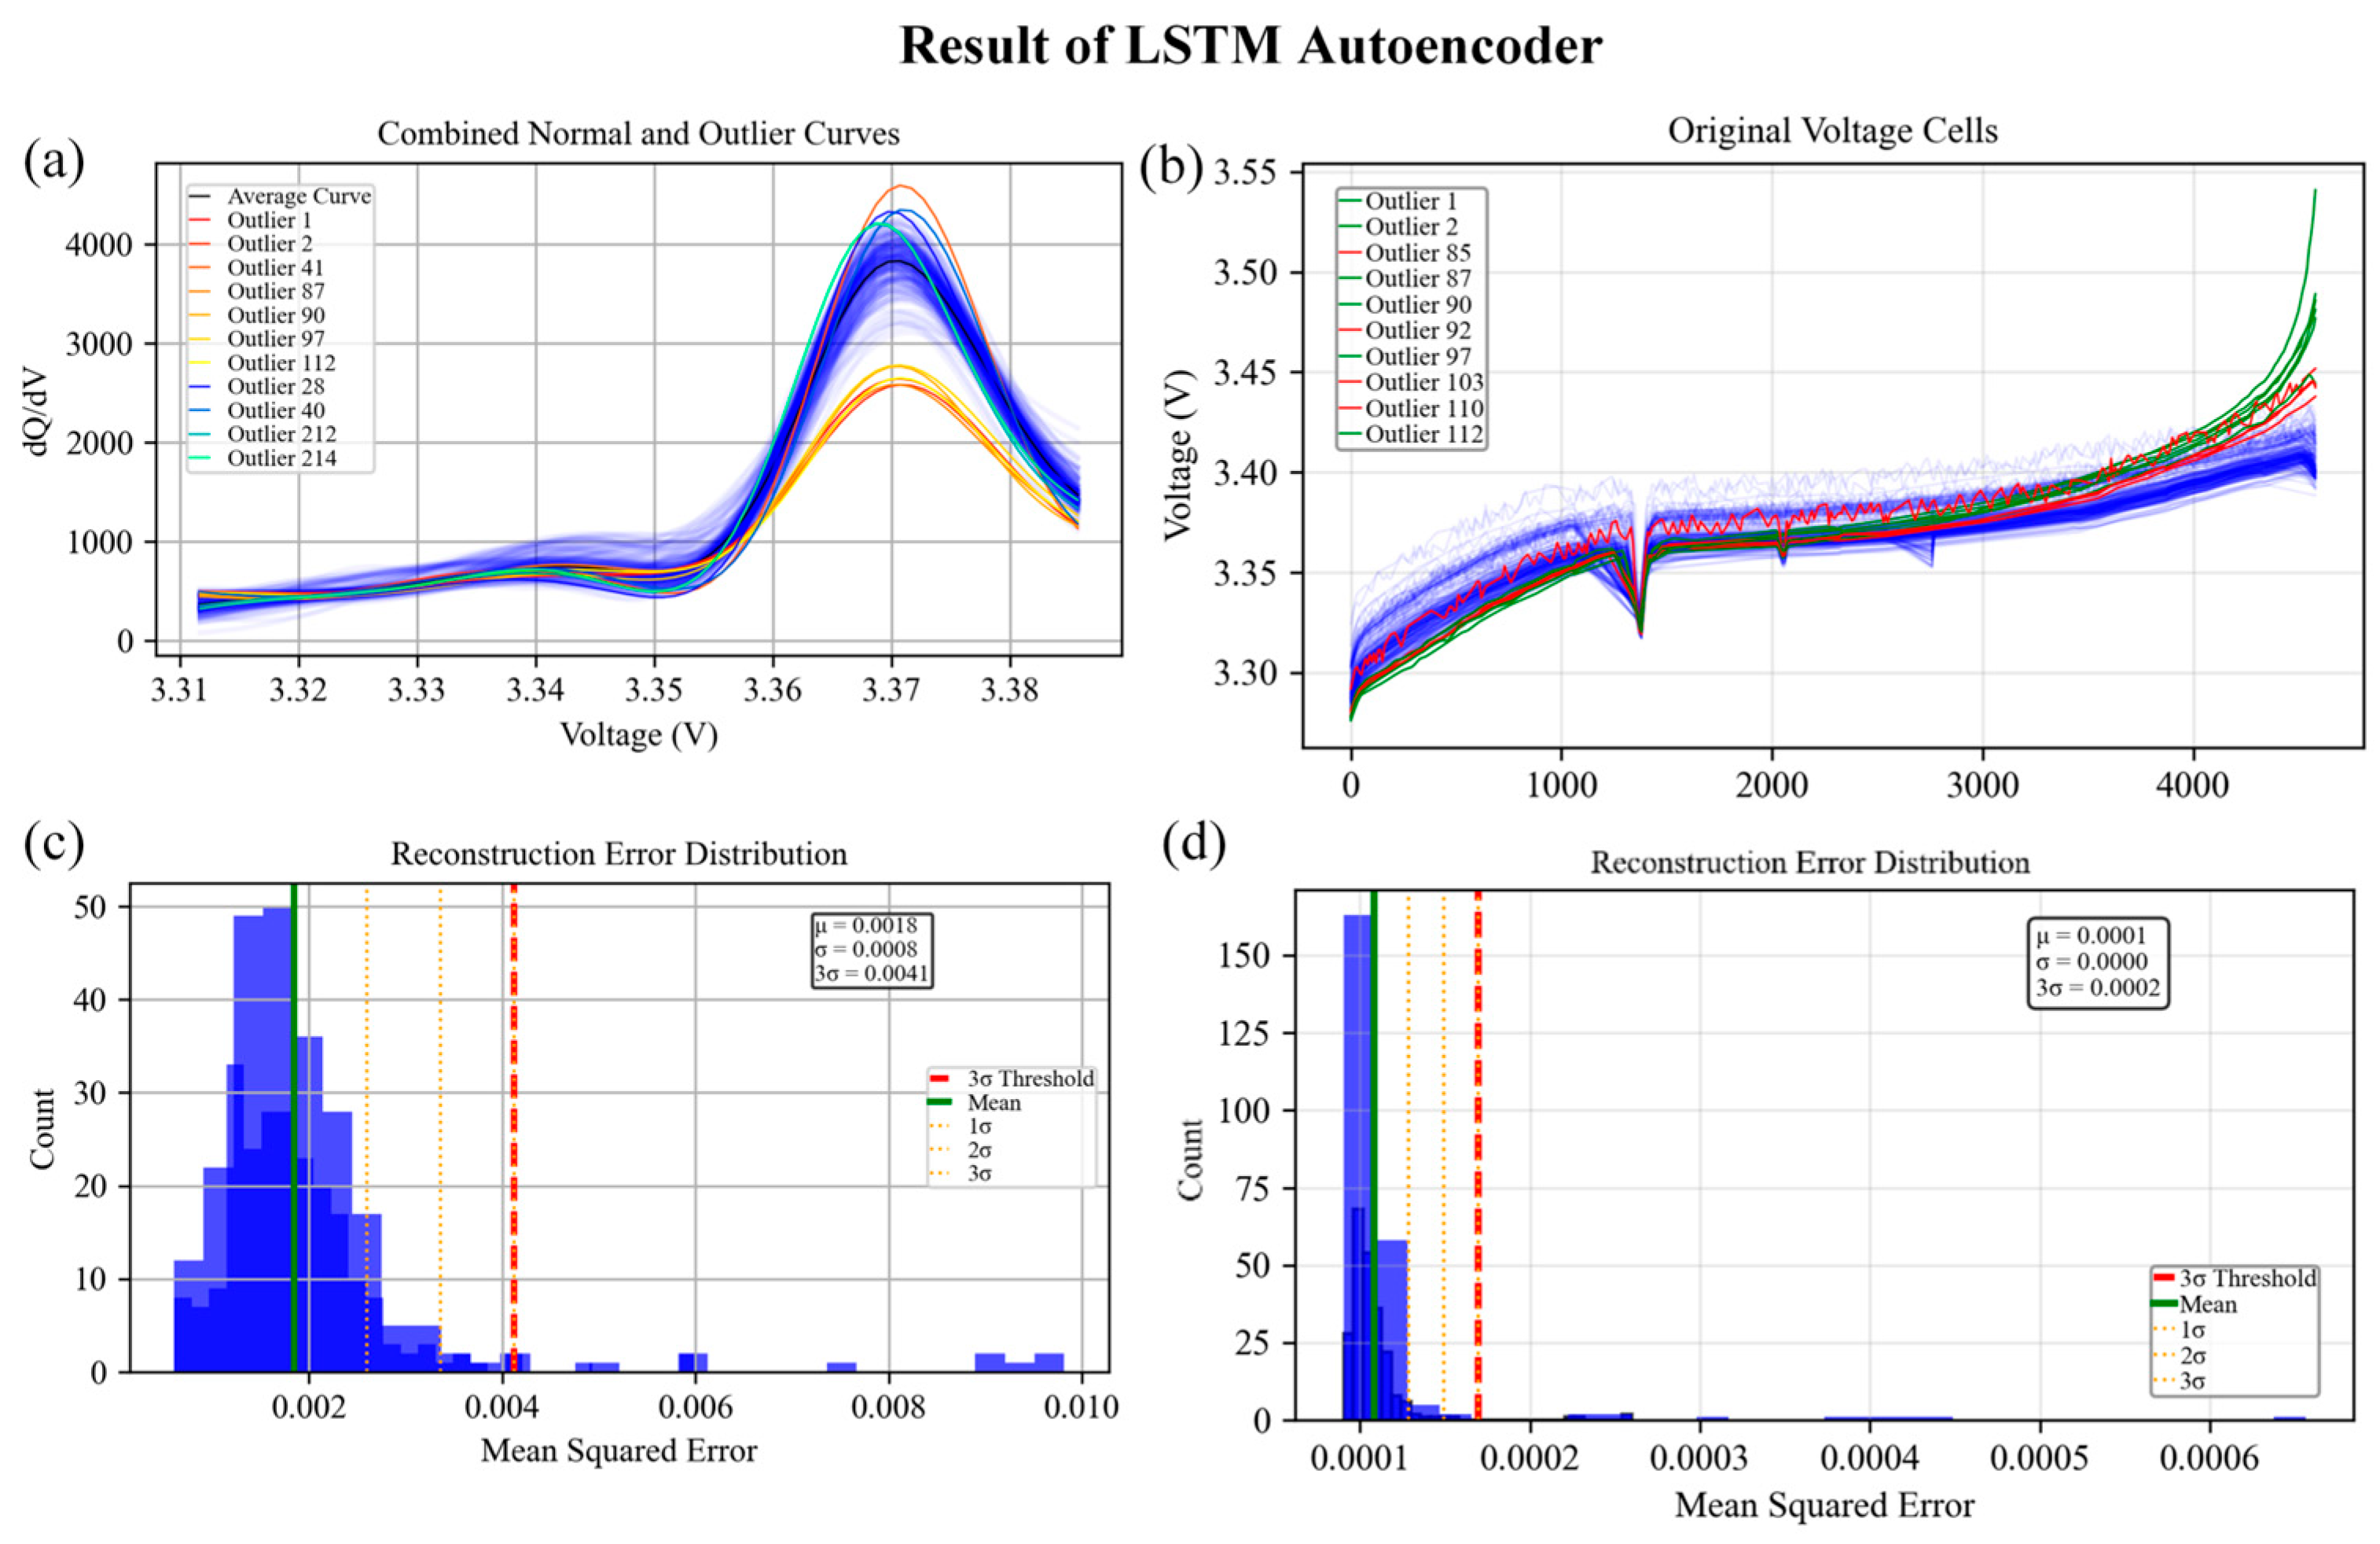
Figure 8 shows the results for anomalous cells based on the LSTM self-encoder algorithm for the ICA curve dataset and the voltage–time dataset of a certain battery cluster, respectively: the anomalous cells detected using the ICA curve dataset are the batteries numbered 1, 2, 41, 85, 87, 90, 97, 103, 110, and 112, and the anomalous cells detected using the voltage–time dataset are the batteries numbered 1, 2, 85, 87, 90, 92, 97, 103, 110, and 112.
Figure 9 shows the results of the functional principal component analysis algorithm based on the ICA curve dataset and the voltage–time dataset of a cell cluster for the detection of anomalous cells: when the ICA curve dataset is used for detection, the anomalous cells detected are the batteries numbered 1, 2, 85, 87, 90, 92, 97, 103, 110, 112, and 120; when the voltage–time dataset is used for detection, the detected anomalies are the cells numbered 1, 2, 85, 87, 90, 92, 97, 103, 110, and 112.
By conducting anomalous singleton detection experiments on two battery datasets from the past month, the anomalous singleton detection results for the three algorithms are derived, and the final fusion of the anomaly weights of the three algorithms is calculated according to Equation (15), as shown in
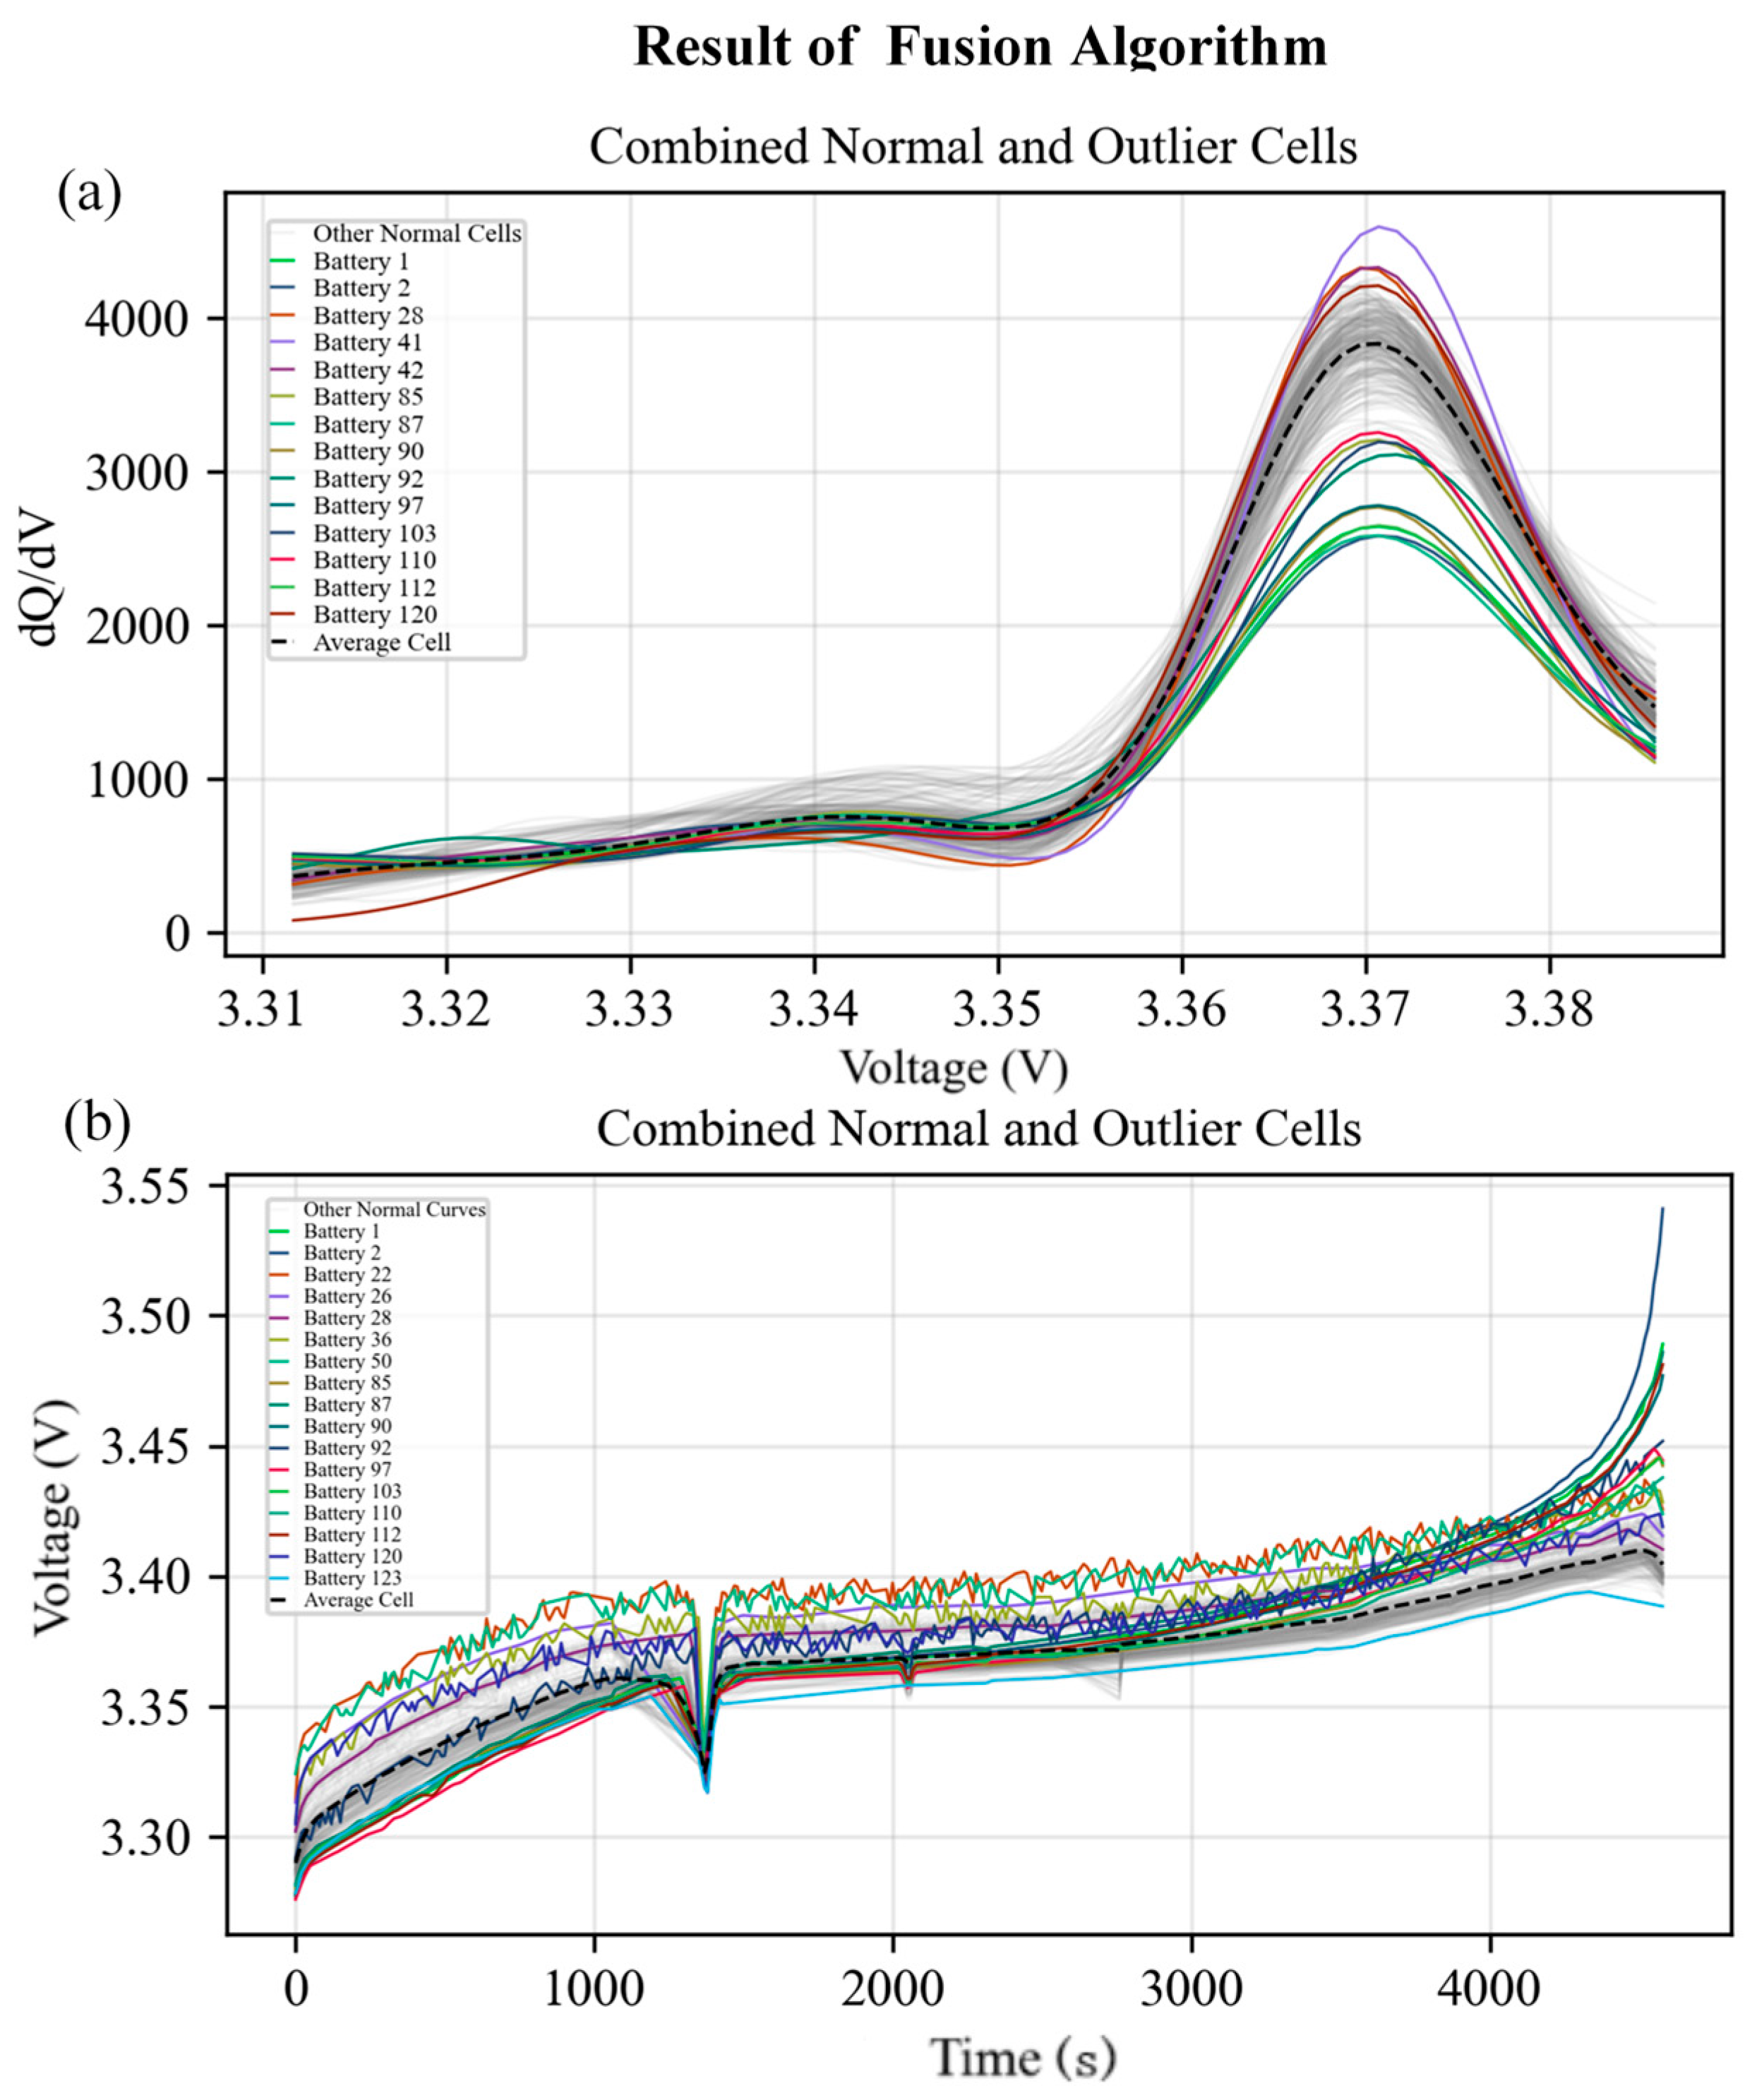
Table 1, while
Figure 10 demonstrates the results of the fusion algorithms for detecting the anomalous cells from an ICA curve dataset and a voltage–time dataset for a certain battery cluster, respectively: when the detection of anomalous cells is performed using the ICA curve dataset, the detected anomalous cells are the cells numbered 1, 2, 28, 41, 42, 85, 87, 90, 92, 97, 103, 110, 112, and 120; using the voltage–time dataset, the detected anomalous cells are the cells numbered 1, 2, 22, 26, 28, 36, 50, 85, 87, 90, 92, 97, 103, 110, 112, 120, and 123, respectively.
3.3. Analysis of the Results
In analyzing the anomalous single cell detection results, as reported in
Section 3.1, the isolation forest algorithm exhibits proficiency in identifying anomalous data through noise interference—for instance, the single cells with cell numbers 22, 26, 36, 50, etc.; combined with the ICA curve analysis, the fusion algorithm can detect cells with a better performance within each cluster, such as the single cell with cell number 41; meanwhile, all three algorithms proposed in this study can accurately detect abnormal single cells with a poor performance in the battery cluster, including cells with cell numbers 1, 2, 85, 87, etc.
Table 2 shows the output of the fusion algorithm as the abnormal probability score for the detected anomalous single cells, where a higher score corresponds to a greater likelihood of cellular abnormality. The comprehensive experimental results demonstrate that the three algorithms proposed in this study can achieve accurate abnormal single cell detection for lithium-ion batteries, Notably, the fusion algorithm effectively mitigates risks such as missed detections and misdetections—common limitations of individual algorithms—and other potential adverse scenarios.
The experimental results demonstrate the framework’s capability to identify distinct categories of electrochemical anomalies through their unique signatures across the three algorithmic components. The cells exhibiting a gradual fade in capacity, such as units 85, 87, 90, and 97, were consistently identified across all detection methods, indicating the presence of systematic degradation patterns detectable through multiple analytical perspectives. The unanimous detection of these cells reflects the manifestation of aging-related phenomena across statistical (altered voltage distributions), temporal (charge/discharge dynamics), and functional (modified curve shapes) domains.
In contrast, the cells detected primarily by individual algorithms reveal mode-specific anomalies. The units identified exclusively by the isolation forest approach (cells 22, 26, 36, and 50) exhibit statistical outlier behavior suggestive of manufacturing inconsistencies or sensor drift, while cell 120, detected solely through the FPCA, demonstrates subtle functional shape anomalies that may indicate early-stage degradation not yet apparent in the conventional metrics. This differential detection pattern validates the complementary nature of the integrated algorithmic approaches and demonstrates the framework’s ability to distinguish between diverse failure mechanisms based on their characteristic electrochemical signatures.
4. Conclusions
This study developed and validated a novel unsupervised multi-model fusion framework for cell-level anomaly detection in battery energy storage systems (BESSs), with key conclusions as follows: The framework demonstrates strong robustness to data imperfections, maintaining a high detection accuracy even for historical operational data affected by asynchronous sensor operation and sampling anomalies. It effectively utilizes multi-dimensional features from the batteries’ operational histories, overcoming the limitations of the conventional voltage-curve-reliant approaches to comprehensively leverage data by coupling the battery characteristics with anomaly signatures. Through the complementary fusion of isolation forests (for rapid feature screening), LSTM autoencoders (to model the temporal dynamics of normal behavior), and the FPCA-MD (for statistically grounded functional data validation), this framework achieves an enhanced overall detection performance compared to that with individual methods. It exhibits a comprehensive anomaly detection capability, accurately identifying diverse cell-level anomalies (e.g., noise interference, subtle cluster deviations, severe degradation) and quantifying the severity of anomalies via interpretable probability scores. Additionally, the multi-model fusion approach significantly reduces the false negatives and false positives inherent in single-algorithm methods, boosting detection system reliability. In summary, this work advances reliable, automated cell-level monitoring in grid-scale BESSs, offering a robust, accurate, and practical solution for early anomaly detection to improve BESS safety, reliability, and longevity.
The current study has certain limitations: its applicability across different battery chemistries and dynamic operational scenarios remains to be verified; the computational efficiency of multi-model fusion may struggle to meet the requirements for real-time deployment in large-scale battery energy storage systems; the correlation between the quantification of anomaly severity and the physical degradation mechanisms in the batteries is not yet clear; and research on its robustness to long-term drifts in normal behavior is insufficient. Future work could advance in several directions, including enhancing the cross-scenario adaptability through transfer learning, improving the real-time processing capabilities using lightweight architectures, integrating physical models to interpret anomaly severity, developing online learning modules to adapt to long-term drifts, conducting industrial-grade field validation, and extending this framework to inter-cell correlation analyses to enable system-level risk early warnings.
