Article

Investigation of Pr3+ and Nd3+ Doping Effects on Sodium Gadolinium Silicate Ceramics as Fast Na+ Conductors

by
Abinaya Sivakumaran
1,
Shantel Butler
2,
Samuel Reid
3 and
Venkataraman Thangadurai
1,4,*
1
Department of Chemistry, University of Calgary, Calgary, AB T2N 1N4, Canada
2
Elektra Industries, 2700-225 6 Ave SW, Calgary, AB T2P 1N2, Canada
3
Geometric Energy Corporation, 1400–3507 Ave SW, Calgary, AB T2P 3N9, Canada
4
School of Chemistry, University of St Andrews, Scotland KY16 9AJ, UK
*
Author to whom correspondence should be addressed.
Batteries 2025, 11(10), 354; https://doi.org/10.3390/batteries11100354
Submission received: 23 July 2025 / Revised: 18 September 2025 / Accepted: 23 September 2025 / Published: 27 September 2025

Abstract

Sodium metal batteries (SMBs) with ceramic solid electrolytes offer a promising route to improve the energy density of conventional Na-ion batteries (SIBs). Silicate-based ceramics have recently gained attention for their favourable properties, including better ionic conduction and wider stability windows. In this study, 10% Pr3+ and Nd3+ were doped into sodium gadolinium silicate ceramics to examine the effects on phase purity, ionic conductivity, and interfacial compatibility with sodium metal anodes. The materials were synthesized via solid-state methods and sintered at 950–1075 °C to study the impact of sintering temperature on densification and microstructure. Na5Gd0.9Pr0.1Si4O12 (NGPS) and Na5Gd0.9Nd0.1Si4O12 (NGNS) sintered at 1075 °C showed the highest room temperature total ionic conductivities of 1.64 and 1.74 mS cm−1, respectively. The highest critical current density of 0.5 mA cm−2 is achieved with a low interfacial area-specific resistance of 29.47 Ω cm2 for NGPS and 22.88 Ω cm2 for NGNS after Na plating/stripping experiments. These results highlight how doping enhances phase purity, ionic conductivity, and interfacial stability of silicates with Na metal anodes.

Graphical Abstract

1. Introduction

All-solid-state sodium batteries (ASSSBs) present a promising alternative to conventional lithium-ion batteries (LIBs), primarily due to the abundance and lower cost of sodium resources compared to lithium [1,2]. Incorporating solid electrolytes in ASSSBs further enhances battery safety and enables higher energy densities [3]. Among various solid electrolytes, silicate-based materials offer notable advantages, including three-dimensional sodium-ion transport pathways, relatively high ionic conductivities (10−3–10−4 S cm−1 at room temperature), excellent chemical and thermal stability, and broad electrochemical stability windows extending up to 10 V vs. Na+/Na [4,5,6]. Despite these advantages, the practical deployment of ceramic electrolytes is hindered by their lower ionic conductivity compared to liquid electrolytes and high interfacial resistance at the electrode-electrolyte interface [7]. Extensive research has focused on compositional modifications such as doping and ionic substitution to address the limitation of ion conduction. These strategies enhance Na+ mobility by creating sodium vacancies or increasing sodium content within the crystal structure, thereby significantly boosting ionic conductivity [8]. On the other side, research is also ongoing to improve both the anode/solid electrolyte and cathode/solid electrolyte interfaces [9,10].
Ceramic electrolytes such as sodium β-Al2O3 and NASICONs (Na1+xZr2SixP3-xO12, (0 < x < 3), Sodium Superionic Conductors) have shown significant improvements in ionic conductivity through crystal structure modifications. For example, doping β-Al2O3 can induce a phase transition to β″-Al2O3, enabling greater sodium-ion accommodation and enhanced conductivity [11]. Dopants like Mg2+, NiO, and TiO2 have also contributed to further conductivity improvements [11]. For NASICONs, strategies including single ion doping [12,13], co-doping [14,15,16], and both anionic and cationic substitutions [17,18,19,20] with transition metals have been used to boost Na+ transport [3,8]. In the case of silicates, they face structural instability when prepared with larger rare-earth ions such as Nd3+, Pr3+, and La3+ [8]. Therefore, these rare-earth elements and others were doped onto the structure in small amounts to enhance the ion conduction. The silicate structures with various elemental substitutions are explained in the results and discussion section. For example, Sun et al. developed high-entropy silicates using multiple rare-earth and multivalent elements (Sm, Y, Gd, La, Al, Zr), achieving a composition of Na4.9Sm0.3Y0.2Gd0.2La0.1Al0.1Zr0.2Si4O12 with a room-temperature ionic conductivity of 6.7 × 10⁻⁴ S cm−1 [21]. Another work by Abdelaal et al., on La-doped Na5YSi4O12, led to the enhancement of the lattice parameter, resulting in a higher ionic conductivity of 4.3 × 10⁻⁴ S cm−1, higher than the undoped composition [22].
In this study, small amounts of heavier rare-earth elements were doped into the sodium gadolinium silicate (NGS) framework to enhance its performance further, building on the promising ionic conductivity and electrochemical stability reported in our previous work [23]. Specifically, 10 mol% of Pr3+ and Nd3+ were incorporated into the NGS structure to systematically investigate their influence on phase formation, ionic conductivity, microstructure, and electrochemical performance. The resulting compositions, Na5Gd0.9Pr0.1Si4O12 (NGPS) and Na5Gd0.9Nd0.1Si4O12 (NGNS) exhibited room-temperature ionic conductivities in the (mS cm−1) range, reflecting efficient Na+ transport pathways. Long-term symmetric cell cycling at 0.1 mA cm−2 with a fixed areal capacity of 0.1 mAh cm−2 confirmed the excellent interfacial compatibility of both NGPS and NGNS with sodium metal. Additionally, both electrolytes displayed low interfacial area-specific resistance (ASRinterface), suggesting improved electrode-electrolyte contact and reduced interfacial polarization. These findings underscore the potential of Pr3+- and Nd3-doped sodium gadolinium silicates as promising solid electrolytes for next-generation solid-state sodium batteries.

2. Materials and Methods

2.1. Preparation of Silicates

Sodium rare-earth silicates with the nominal composition Na5M′0.9M″0.1Si4O12 (M′ = Gd; M″ = Pr, Nd) were synthesized via a conventional solid-state method using stoichiometric amounts of NaNO3, SiO2 (Sigma-Aldrich, St. Louis, MO, USA), and rare-earth oxides (Thermo Fisher Scientific, Waltham, MA, USA). A 15% excess of NaNO3 was added to offset sodium loss during high-temperature sintering. Before synthesis, Gd2O3, Pr2O3, and Nd2O3 were preheated at 900 °C for 6 h to remove moisture. The precursor powders were ball-milled (Pulverisette, Fritsch, Germany) at 200 rpm for 6 h in 2-propanol, then calcined at 900 °C for 6 h to decompose the nitrates. After calcination, the powders were milled at 200 rpm for 12 h to enhance homogeneity, dried, and isostatically pressed into 13 mm pellets. Sintering was performed at 950–1075 °C for 6 h in alumina crucibles covered with mother powder to minimize sodium loss.

2.2. Structural and Sample Analysis

The crystallographic information relating to all the samples prepared was explored using powder X-ray diffraction (D8 advance powder X-ray diffractometer in Bragg–Brentano geometry (CuKα radiation (λ = 1.54 Å, 40 kV and 40 mA) at a step size of 0.02° and range of 10–40°). Scanning electron microscopy (SEM; Quanta FEG250, Thermo Fisher, Hillsboro, Oregon, USA) was used to obtain cross-sectional microstructural images of silicates. An energy-dispersive X-ray detector on the SEM instrument provided quantitative information and elemental mapping of the elements in the samples.

2.3. Electrochemical Preparation and Measurements

2.3.1. Electrochemical Impedance Spectroscopy (EIS)

The impedance analyses were performed using a Solartron SI 1260. The silicate pellets (~0.8–1 mm thick and ~9–11 mm in diameter) were coated with gold electrodes on both sides. The Au electrodes were applied using a gold paste and subsequently cured at 700 °C for 1 h in the air to eliminate the organic binder. These gold layers function as ion-blocking electrodes during impedance analysis, ensuring the accurate measurement of ionic conductivity. The impedance was measured at 100 mV amplitude and a frequency range of 1 Hz to 1 MHz. The obtained impedance spectra were analyzed using the Z-View4 software by fitting the data to appropriate equivalent circuit models. This approach enabled the extraction of total resistance and electrode effect, providing insight into the conductive behaviour of the materials.
The total ionic conductivity is calculated from Ohm’s law as described below in Equation (1):
σ i = l R A
where l is the thickness of the pellet, R refers to the resistance obtained from the approximation of the end of the arc, which is then used to calculate the total ionic conductivity, and A is the area of the blocking electrode. The impedance spectra are carried out at higher temperatures from 25 to 150 °C to calculate the activation energy from Equation (2):
σ = σ 0 e x p ( E a K b T )
where σ0 is the pre-exponential factor, Ea is the activation energy, Kb is the Boltzmann constant (1.38 × 10⁻²³ JK−1), and T is the absolute temperature.
The obtained impedance spectra at RT were fitted with an equivalent circuit (Rb + Rgb//CPE1 + CPE2) using Z-view software, where Rb and Rgb refer to resistance at 1 MHz and grain boundary resistance, and CPE1 and CPE2 refer to the constant phase elements associated with the grain boundary and blocking electrode. The capacitance values can be calculated according to Equation (3) below.
C = R 1 n n Q ( 1 n )
where R is the resistance, Q is the constant phase element (CPE), and n is the parameter with a value close to 1.

2.3.2. Direct Current (DC) Polarization Experiment

The electronic conductivity of the silicate pellets was evaluated using DC polarization experiments. A constant voltage of 0.1 V was applied across the pellets, which were coated with ion-blocking gold electrodes on both sides. The resulting current was monitored over several hours until a steady-state value was achieved, indicating the suppression of ionic contribution and allowing for the accurate determination of the electronic component of the total conductivity. The electronic conductivity was then calculated using Ohm’s law based on the measured steady-state current and the geometrical dimensions of the pellet. Detailed methodology and results are provided in our previous work [24].

2.3.3. Galvanostatic Sodium Symmetric Cell Experiments

Sodium plating/stripping experiments were conducted using symmetric Na‖SE‖Na cells assembled in a CR2032 coin cell configuration. Thin sodium metal foils (~0.1 mm thick, 10 mm in diameter, ~8 mg) were pressed onto both faces of the sintered silicate electrolyte pellets (~0.8–1 mm thick, 9–11 mm in diameter) under ambient conditions inside an argon-filled glove box (O2 and H2O < 0.1 ppm). After cell assembly, a constant current density of 0.01 mA cm−2 was applied to initiate sodium plating with a fixed capacity, followed by polarity reversal to enable stripping. This plating/stripping cycle was repeated while progressively increasing the current density. The voltage response was monitored to identify the onset of a short circuit, indicated by a sudden voltage drop, which defines the critical current density (CCD). For long-term cycling studies, the symmetric cells were operated at a fixed current density of 0.1 mA cm−2 with a capacity of 0.1 mAh cm−2 to evaluate the interfacial stability and cycling durability of the electrolyte.

3. Results and Discussion

3.1. Synthesis of Pr and Nd-Doped Sodium Gadolinium Silicates (NGPS and NGNS)

Due to the larger ionic radii of Pr3+ (0.99 Å) and Nd3+ (0.98 Å) compared to Gd3+ (0.93 Å), substitution with these dopants is anticipated to expand the bottleneck size within the crystal structure, potentially facilitating Na+ migration and enhancing overall ionic conductivity. In addition, Pr- and Nd-based silicate systems are known to exhibit relatively lower sintering onset temperatures (above 950 °C), and their partial melting at higher temperatures (>1000 °C) may aid in reducing grain boundary resistance through improved particle coalescence and densification. In this study, Na5Gd0.9Pr0.1Si4O12 (NGPS) and Na5Gd0.9Nd0.1Si4O12 (NGNS) were synthesized via a conventional solid-state reaction route, as described in the Materials and Methods section. To compensate for sodium volatilization during high-temperature processing, a 15% excess of NaNO3 was introduced, consistent with prior reports demonstrating its effectiveness in preserving stoichiometry and optimizing ionic transport properties [23]. The effect of sintering temperature on phase formation and microstructure was systematically investigated at 950, 1000, 1050, and 1075 °C.

3.2. Phase Evolution of Pr and Nd-Doped Sodium Gadolinium Silicates (NGPS and NGNS)

The powder X-ray diffraction (PXRD) patterns of NGPS and NGNS samples sintered at various temperatures are presented in Figure 1a,b, respectively. In both systems, the dominant reflections correspond to the targeted Na5GdSi4O12 phase (PDF No. 00-035-0141), confirming the successful formation of the desired structure. However, secondary phases such as Na9GdSi6O18 (PDF No. 00-056-0122) and NaGdSiO4 (PDF No. 00-035-0013) were also detected, indicating incomplete phase purity under certain synthesis conditions. For the NGPS series, a progressive increase in the intensity of these secondary phase peaks was observed as the sintering temperature increased from 950 °C to 1075 °C. This suggests that higher temperatures may promote the formation or crystallization of impurity phases in the presence of Pr dopants. In contrast, the NGNS series exhibited an opposite trend: the secondary phase peaks diminished with increasing sintering temperature, with near-phase-pure Na5GdSi4O12 obtained at 1075 °C. This contrasting behaviour may be attributed to the distinct redox characteristics of the dopants. While Gd remains in a stable trivalent state (Gd3+), Pr can fluctuate between Pr3+ and Pr4+, and Nd between Nd2+ and Nd3+, depending on the sintering atmosphere and temperature. These variable oxidation states can influence the local stoichiometry, lattice stability, and, ultimately, the phase evolution during high-temperature treatment under oxidative conditions.
For instance, Pr3+ is known to oxidize to Pr4+ (ionic radius ≈ 0.85 Å) under oxidative sintering conditions, which may induce local lattice distortions and thermodynamically favour the formation of secondary phases at elevated temperatures. Although the doping level in NGPS is relatively low (10 mol%), the oxidation of Pr2O3 to PrO2 may not be discernible by PXRD due to the detection limit for minor phases or subtle structural variations. In contrast, Nd in NGNS primarily exists in the trivalent state (Nd3+), which is more stable and does not undergo further oxidation under similar conditions. This redox stability likely suppresses impurity phases as the sintering temperature increases. Furthermore, due to the modest dopant concentrations in both NGPS and NGNS, no significant peak shifts were observed in the PXRD patterns relative to the undoped Na5GdSi4O12 reference, suggesting that the dopants are either well-incorporated into the host lattice without causing significant distortion or their structural influence is minimal at such doping levels. Overall, the doped compositions exhibit improved phase purity compared to the undoped counterpart reported in our previous study [23]. Notably, the secondary phases were almost entirely suppressed in NGNS at higher sintering temperatures, whereas NGPS exhibited the opposite trend, most likely due to the oxidative transformation of Pr3+ to Pr4+ during high-temperature treatment in air.

3.3. Morphological Analysis—Cross-Sectional SEM Images of NGPS and NGNS Ceramics

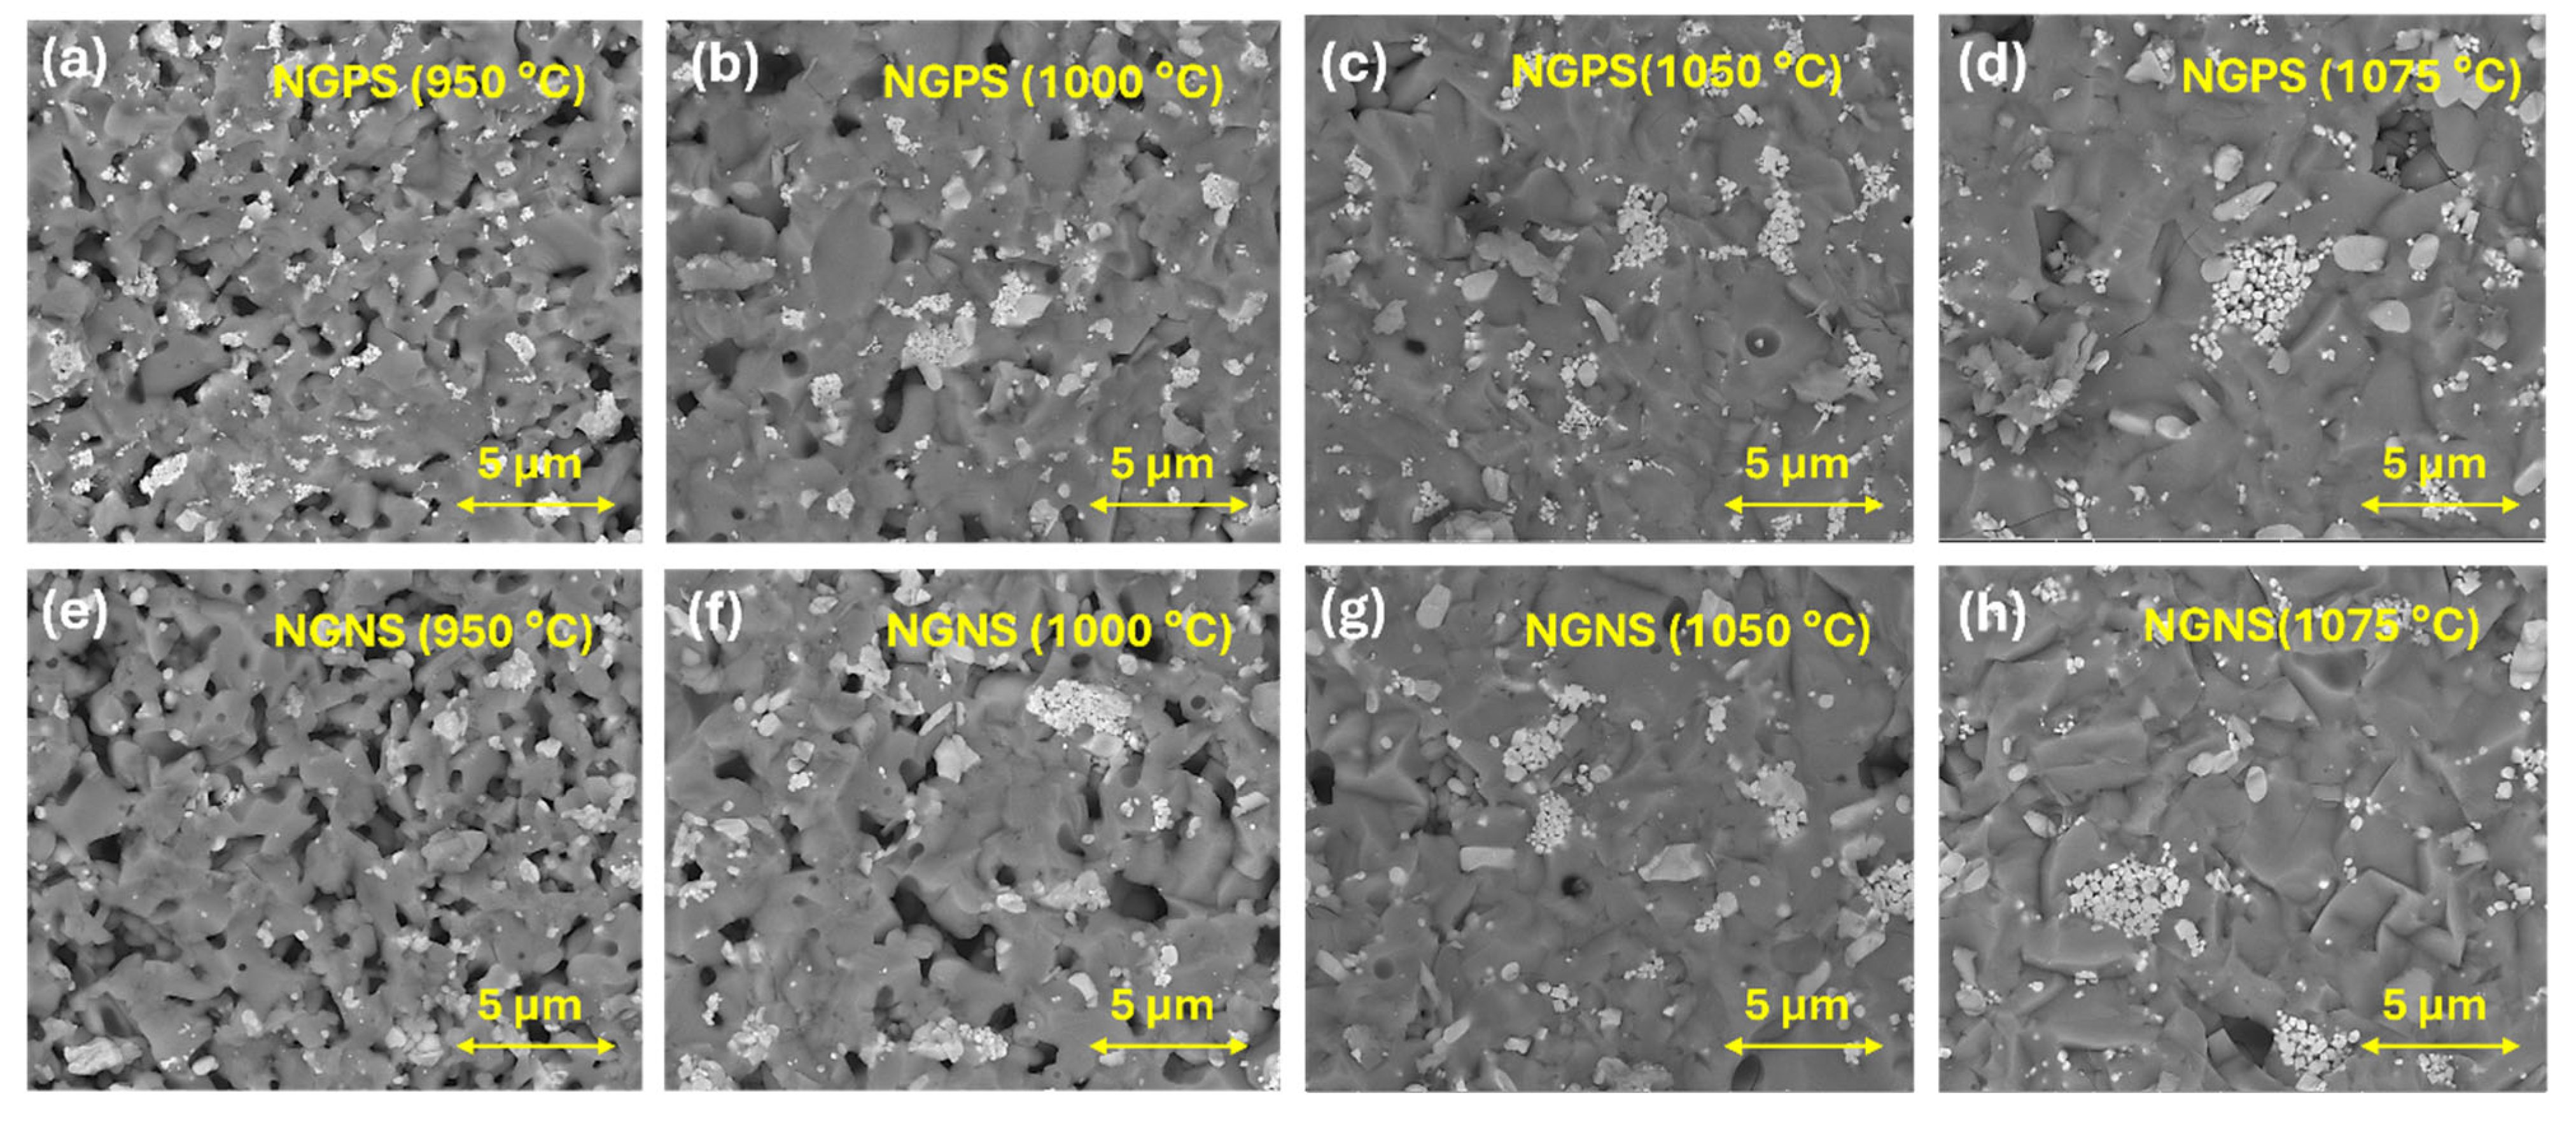
The microstructure of ceramic electrolytes is vital in determining their ion conduction behaviour, particularly in polycrystalline materials, where grain boundary conductivity significantly affects the overall total ionic conductivity for low-temperature applications [25]. Figure 2a–h show the cross-sectional SEM images of NGPS and NGNS ceramics sintered at 950, 1000, 1050, and 1075 °C, respectively. The sintered silicate pellets consist of densely packed micron-sized grains arranged in a disordered manner, exhibiting variations in densification and porosity depending on the sintering temperature. An apparent increase in sample densification with higher sintering temperatures is evident, marked by a substantial reduction in porosity from 950 to 1075 °C. The porous microstructure of the 950 and 1000 °C samples can serve as a nucleation site, promoting sodium dendrites and reducing their practical applications.
The dense microstructure observed above 1000 °C is likely due to partial melting of dopants, which may enhance grain growth and densification, potentially improving sodium-ion conductivity, reducing dendrites and thus elevating battery performance. Although near-phase-pure compositions were achieved at higher temperatures based on phase analyses, all samples displayed a similar bulk microstructure, notably the presence of persistent small white particles or crystals. These features suggest inherent microstructural characteristics of the material system. Based on our previous work on sodium samarium silicates, these white particles or crystals had higher sodium and samarium content [24]. Similarly, in this study, we believe they might originate from secondary phases, such as NaGdSiO4 and Na9GdSi6O18, as indicated by the PXRD pattern. Further research is needed on these materials to understand their microstructure and its relationship to ionic conductivity.
Figure 3a,b present EDX elemental maps of Na, Gd, Pr, Nd, Si, and O for NGPS and NGNS ceramics, respectively. The maps confirm the uniform distribution of all elements across the surface, with localized enrichment of Gd, Pr, and Nd in specific regions (white particles). This might be because Gd, Pr and Nd are uniformly doped into the structure or are present in a finely dispersed phase that is not spatially segregated or affected by pores. As a result, its distribution remains visually homogeneous, even in regions where Na, Si, and O are missing due to porosity.

3.4. Electrochemical Impedance Spectroscopy (EIS) Results

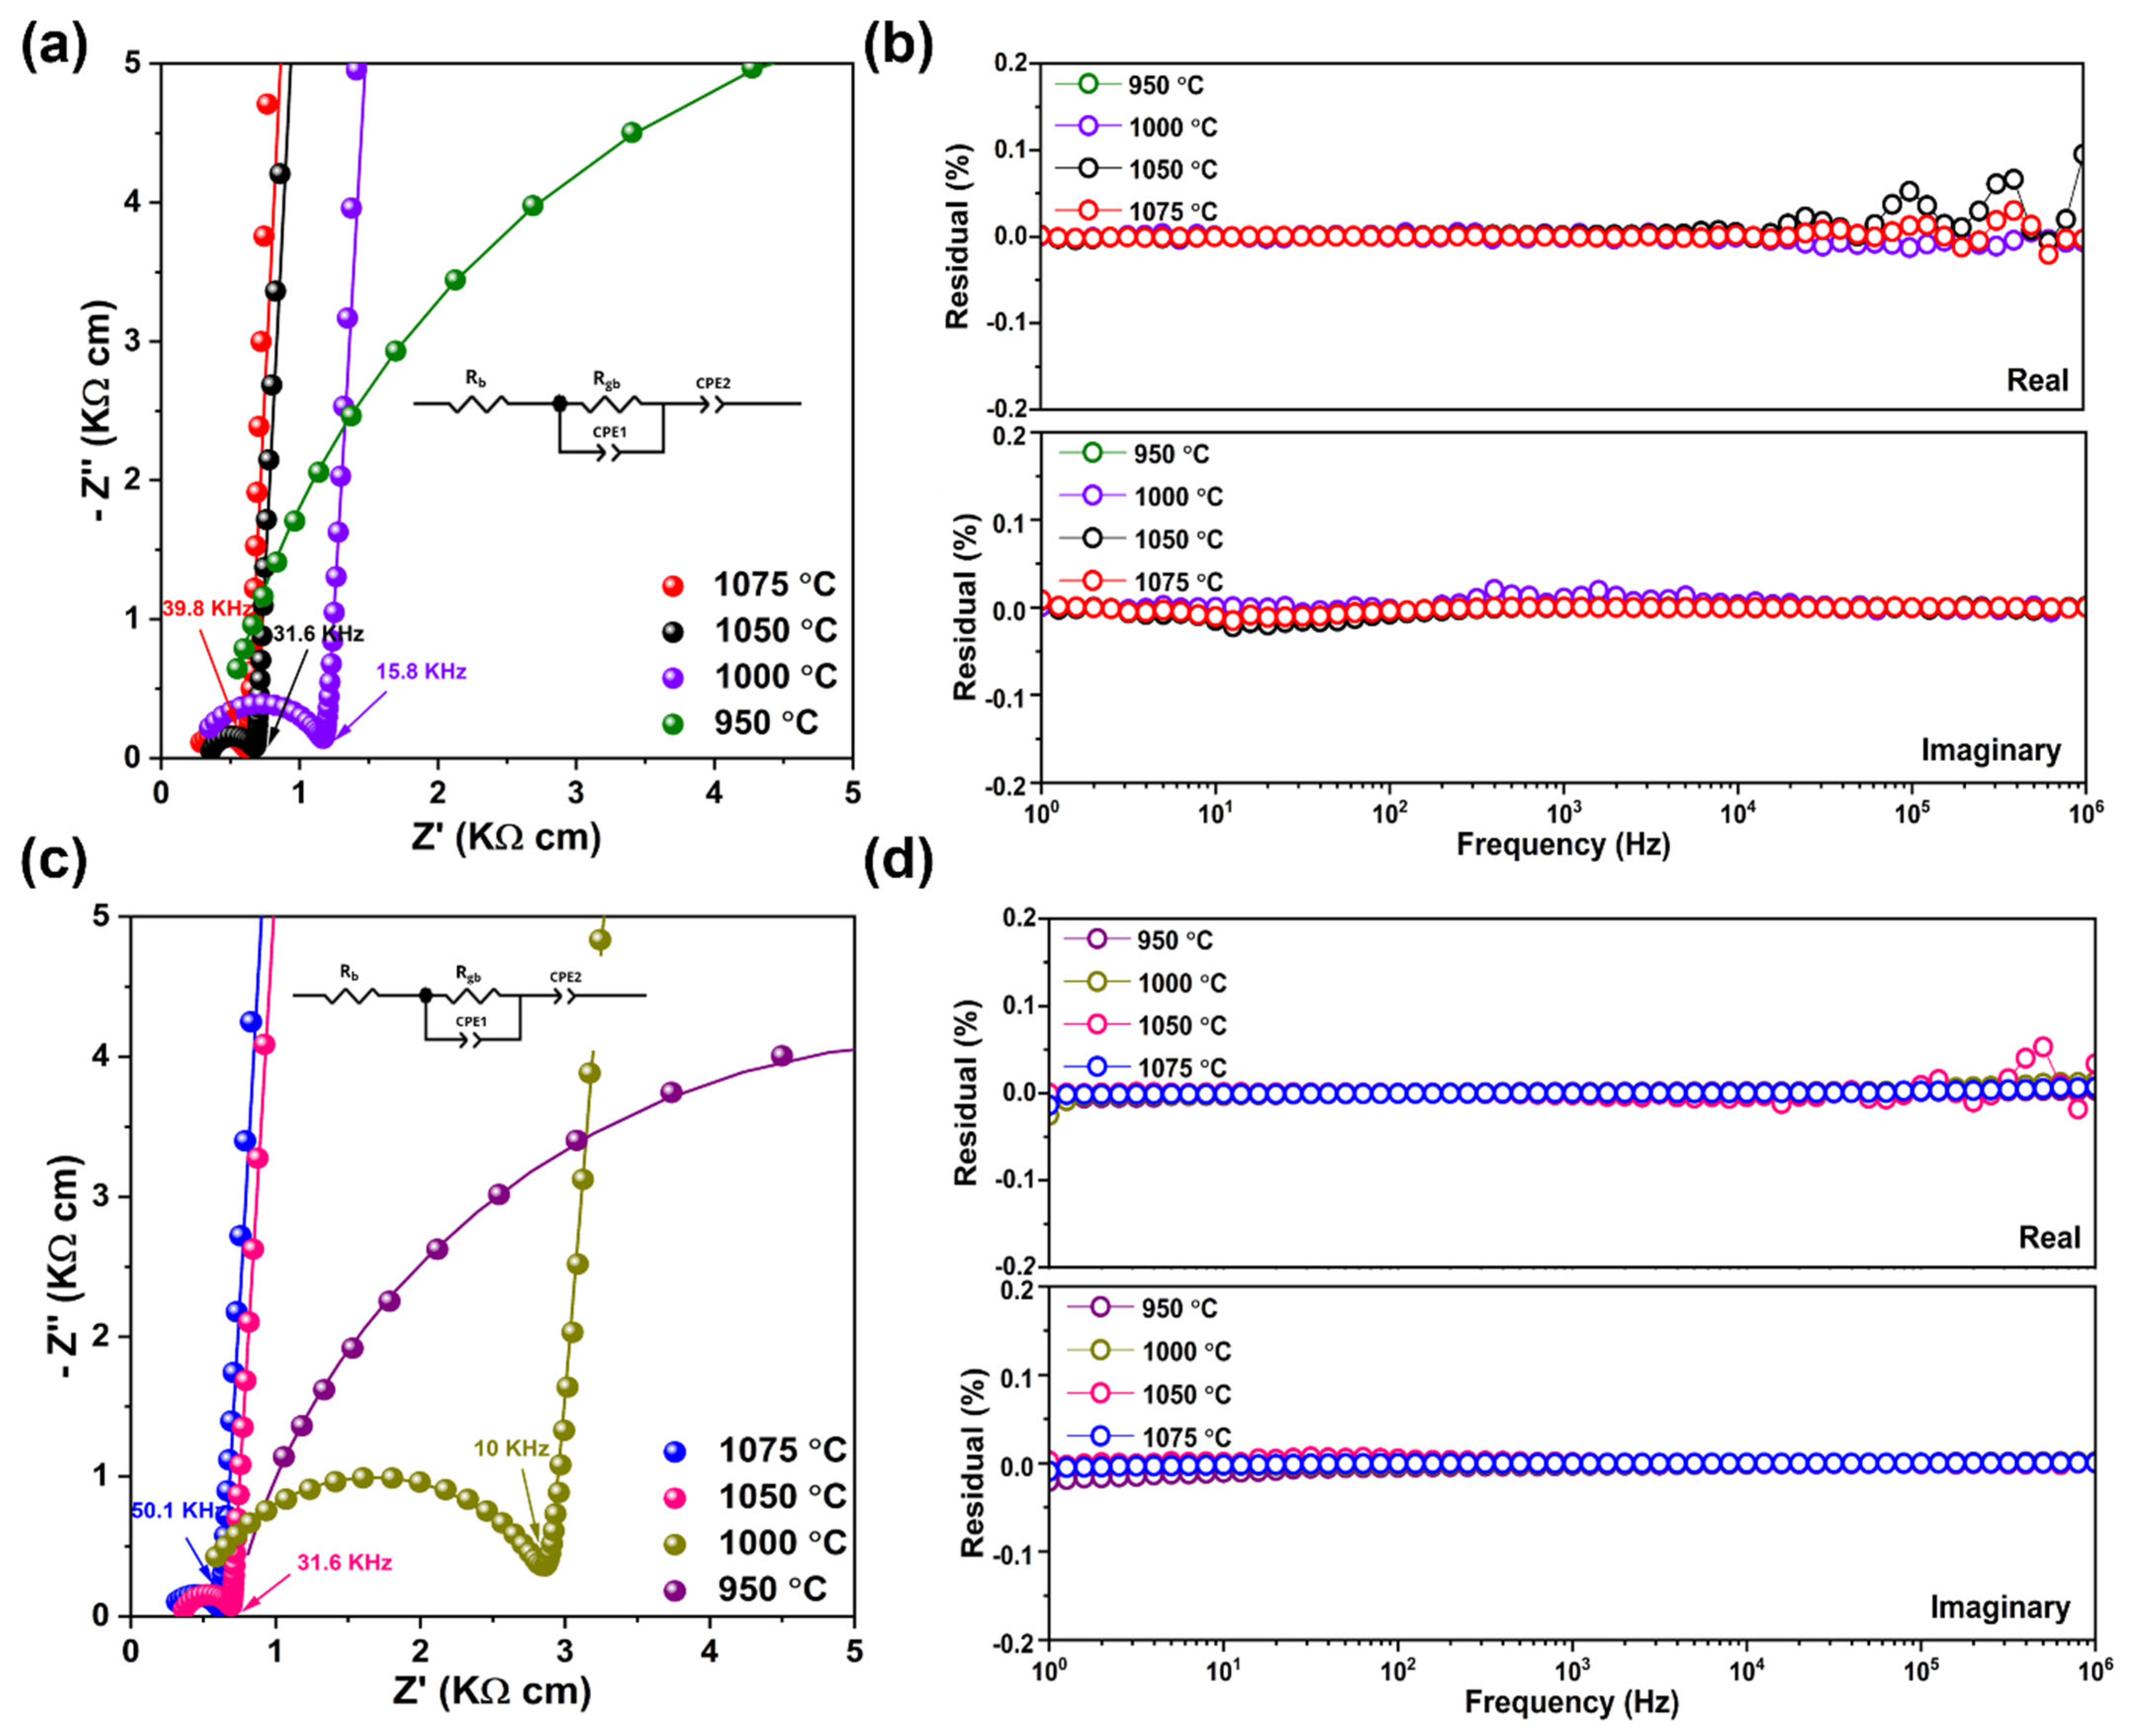
Electrochemical impedance spectroscopy was employed to determine the ionic conductivity of all eight silicates. The sample preparation details are provided in the Materials and Methods section. The Nyquist plots of NGPS and NGNS at different sintering temperatures are presented in Figure 4a,c, respectively. Both impedance spectra were analyzed using the equivalent circuit (Rb + Rgb ||CPE1 + CPE2), which is also included in the inset of Figure 4a,c and was selected based on the observed semicircle and blocking electrode response. Due to instrumental limitations, extending the frequency range was not feasible, preventing a precise observation of the bulk response from the solid electrolytes [6]. To access the reliability of the Nyquist spectra, a linear Kramers–Kronig (K-K) validity test was performed on all eight impedance data using the Lin-KK software Version 1.3 (16.12.2015) as found here (https://www.iam.kit.edu/et/english/Lin-KK.php) [26]. The real (Z′) and imaginary (Z″) residual (%) vs. frequency plots are presented in Figure 4b,d for NGPS and NGNS, respectively. In both cases, all data points for (Z′) and (Z″) fall within 0.1% of their expected values, as calculated using Equation (4) [26].
Z = Z Z K K Z K K , Z = Z Z K K Z K K
here ∆Z′ and ∆Z″ represent the real and imaginary residuals, while Z′ and Z″ correspond to the experimentally determined real and imaginary values. Z′KK and Z″KK are the expected values calculated from the Kramers–Kronig relations. As shown in Figure 4b,d, all residuals are below 0.1%, indicates that the Nyquist data are of high quality [27].
Frequency-dependent Bode plots are presented in Figure 5 in order to understand the relaxation process with frequency. Figure 5a,b shows log |Z| versus log frequency, while Figure 5c,d depict phase angle versus log frequency for NGPS and NGNS, respectively. The impedance magnitude (log |Z|) is higher at low frequency and decreases with increasing frequency, reflecting electrode polarization effects. This is followed by a relatively flat region at mid-high frequencies, relating to the RC circuit for grain boundary, and bulk contribution is not seen within this range. Correspondingly, the phase angle plots exhibit a single broad maximum in the mid-to-high frequency range, consistent with a single dominant relaxation process possibly linked to grain boundaries [28]. The maximum angle shifts to a higher frequency for the samples sintered at higher temperatures from 950 °C to 1075 °C for both Pr and Nd doped silicates. With a slight increase in frequency, it would have resulted in one more RC circuit corresponding to the bulk. These observations support the equivalent circuit model used to fit the data, where grain-boundary resistance and capacitance dominate the impedance response.
Table 1 summarizes the ionic conductivities and fitting parameters derived from the Nyquist plots of all eight samples. Both NGPS and NGNS exhibited a characteristic single semicircle, followed by a low-frequency spike corresponding to grain boundary resistance (with the capacitance calculated from Equation (3) being approximately 10−8–10−9 F) and the blocking electrode response, respectively [29]. Total ionic conductivity increases consistently with sintering temperature from 950 to 1075 °C, with samples at 1050 and 1075 °C exhibiting the highest conductivities, correlating with progressive densification and reduced porosity evident in SEM cross-sections. The grain boundary resistance (Rgb) decreases sharply with increasing temperature, reflecting improved grain-to-grain contact and the formation of continuous ion-conduction pathways, and remains low at 1075 °C, consistent with nearly fully dense microstructures. The grain-boundary capacitance (CPE1) increases up to 1050 °C, reflecting thinner and more effective grain boundaries enhancing dielectric coupling, but decreases slightly at 1075 °C also matches with Figure 5c,d, where the peak for 1075 °C sintered sample shifted and was slightly lower than at 1050 °C. This minor reduction is likely attributed to grain growth, which reduces the total grain-boundary area per unit volume, and to a narrowing of the boundary relaxation distribution in the highly densified microstructure, in agreement with SEM and PXRD observations of improved phase purity at higher sintering temperatures.
In contrast, the blocking-electrode capacitance (CPE2) decreases monotonically with sintering temperature. Lower sintering temperatures create surface roughness, porosity, and heterogeneous ion accumulation that inflate apparent pseudo-capacitance, whereas higher sintering temperatures produce smoother, denser, and more uniform surfaces with reduced interfacial inhomogeneity. Therefore, CPE exponent nel approaching unity indicates a more ideal, less dispersive electrode response. The ngb values (0.85–0.96) confirm that the grain boundary semicircle is slightly depressed but close to capacitive, approaching 1 at higher sintering temperatures, consistent with reduced disorder and better grain connectivity, while nel values (0.90–0.97) confirm nearly ideal capacitive behaviour for the electrode polarization. Very low χ2 values indicate reliable fitting of the Nyquist data. Overall, these electrochemical observations align well with SEM results, which show progressive grain growth, densification, and pore elimination across the sintering range, explaining the trends in total conductivity, grain-boundary resistance, and capacitance parameters with increasing sintering temperature.
The highest total ionic conductivities at 25 °C were achieved by samples sintered at 1075 °C, which are 1.64 mS cm−1 for NGPS and 1.74 mS cm−1 for NGNS, both significantly surpassing that of undoped sodium gadolinium silicate (NGS, 7.24 × 10⁻⁴ S cm−1) synthesized under identical conditions in our previous work [23]. This improvement in conductivity can be attributed to the slight doping (10 mol%) of Pr3+ and Nd3+ for Gd3+, which enhanced Na-ion conduction by densifying the structure, reducing grain boundary resistance, and possibly enhancing the bottleneck size for facile Na+ movement. A recent study by Abdelaal et al. has investigated the effect of La3+ doping on the Na5YSi4O12 silicate structure, achieving a higher grain boundary Na+ conductivity than the undoped silicate due to the expansion of lattice parameters [22]. Comparing the PXRD patterns, NGNS exhibited an almost phase-pure composition, likely contributing to its slightly higher Na-ion conductivity compared to NGPS. This is because the presence of secondary phases, such as Na3MSi3O9 (N3) and Na9MSi6O18 (N9), has lower ionic conductivity, which reduces the overall conductivity of the Na5MSi4O12 (N5) silicate electrolytes [30].
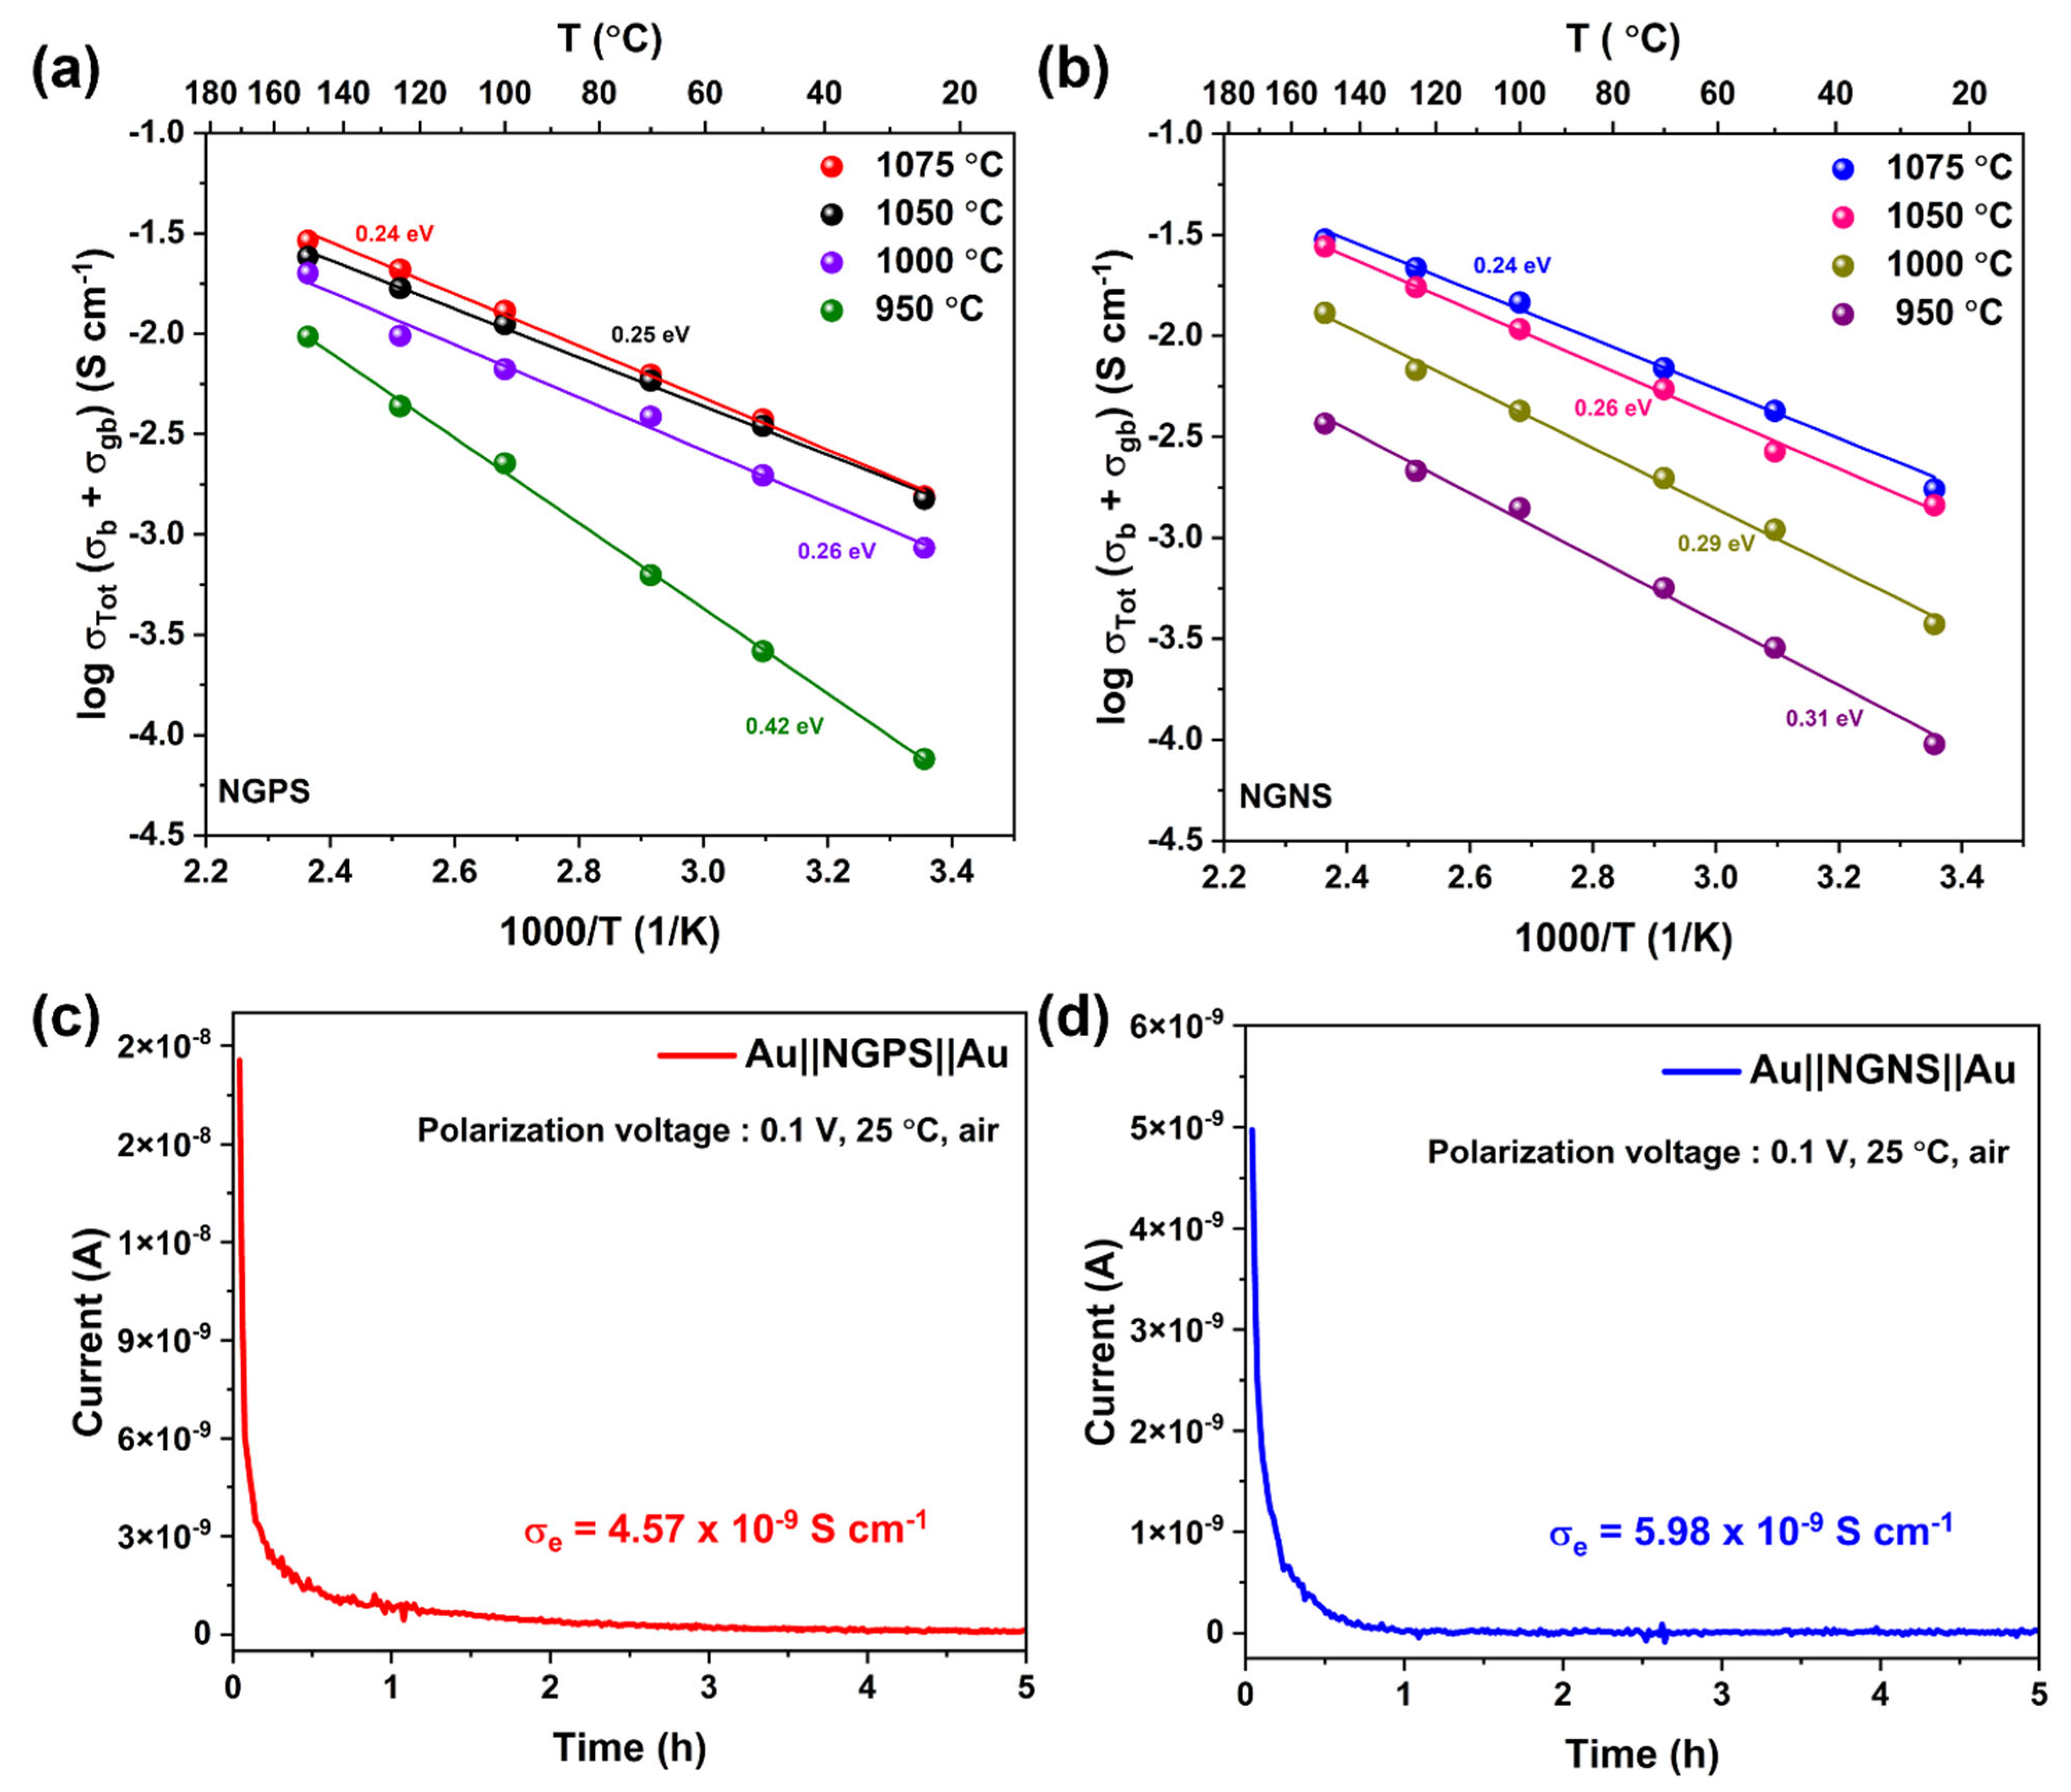
Temperature-dependent ionic conductivity measurements were conducted between 25 and 150 °C, and the total activation energies for NGPS and NGNS ceramics were determined from the Arrhenius plots in Figure 6a,b. Compared to other samples, both compositions at 1075 °C exhibited the lowest activation energy of 0.24 eV. This value is notably lower than that of undoped NGS ceramics (0.30 eV) reported in our previous work, indicating more efficient Na+ transport due to a reduced energy barrier for migration [23]. These findings further emphasize the improved ionic conductivity and fast Na-ion hopping enabled by Pr3+ and Nd3+ doping in the sodium gadolinium silicate system. The electronic conductivity of NGPS and NGNS was also determined through the DC polarization experiments, and the observed σe values are 4.57 × 10⁻⁹ and 5.98 × 10⁻⁹ S cm−1 at room temperature, respectively, as calculated using Ohm’s law [24]. The DC polarization curves for these silicates are given in Figure 6c,d. The electronic conductivities of doped silicates are in the same order of magnitude but slightly higher than the undoped sodium gadolinium silicates (1.83 × 10⁻⁹ S cm−1), which are not included. This lower electronic conductivity of silicates will provide higher Na+ transference (~1.0) and significantly reduce dendrite growth and self-discharge behaviour.
Table 2 summarizes a range of silicate-based solid electrolytes and their reported ionic conductivities [6,21,22,30,31,32,33,34]. In a systematic investigation, Shannon et al. developed a series of doped silicates, among which Gd-based compounds demonstrated superior ionic conductivities. Notably, Zr-doped Gd silicate, with the composition Na4.9Gd0.9Zr0.1Si4O12, exhibited the highest conductivity of 4 × 10⁻¹ S cm−1 at 300 °C [30]. Historically, many silicate electrolytes were optimized for high-temperature Na–S battery systems, with conductivity typically assessed at 300 °C. Earlier work has extensively investigated P substitution for Si. For instance, Horiuchi et al. reported a P-doped yttrium silicate, Na4.0Y0.6P0.2Si2.8O9, which reached a conductivity of 3.7 × 10⁻² S cm−1 at 300 °C [31]. Okura et al. explored various doped silicates by incorporating rare-earth elements, such as Sm, Gd, and Y, alongside P substitution for Si. Among these, the Sm-based compound Na3.9Sm0.6P0.3Si2.7O9 showed a relatively high conductivity of 1.3 × 10⁻² S cm−1 [32]. Other compositions incorporating Fe, P, and Ba exhibited relatively lower conductivities at elevated temperatures [25]. More recently, strategies focused on structural modifications have led to significant improvements. For example, a high-entropy silicate, Na4.9Sm0.3Y0.2Gd0.2La0.1Al0.1Zr0.1Si4O12, demonstrated an enhanced room-temperature ionic conductivity of 6.7 × 10⁻⁴ S cm−1 [21]. Michalak et al. synthesized a Zr-doped Gd silicate, Na4.9Gd0.9Zr0.1Si4O12, with a conductivity of 1.9 mS cm−1 [33]. The composition Na4.92Y0.92Zr0.08Si4O12, in which 8% Zr was substituted for Y, achieved a high ionic conductivity of 3.3 mS cm−1, as reported by Yang et al. in 2023 [6]. Two new works, including Na5SmSi4O12 by Lowack et al., exhibited ionic conductivity of 1.5 mS cm−1, and, as explained before, La3+ doped Na5YSi4O12 by Abdelaal et al., demonstrated sodium ion conductivity of 4.3 × 10⁻⁴ S cm−1 [22,34]. In our work, NGPS and NGNS sintered at 1075 °C exhibited higher room temperature total ionic conductivities of 1.64 and 1.74 mS cm−1, respectively. These conductivity values are comparable to those of recent works and can be further improved by optimizing the dopant levels.

3.5. Electrochemical Performance

3.5.1. NGPS/NGNS Ceramic Interface Compatibility with Na Anode

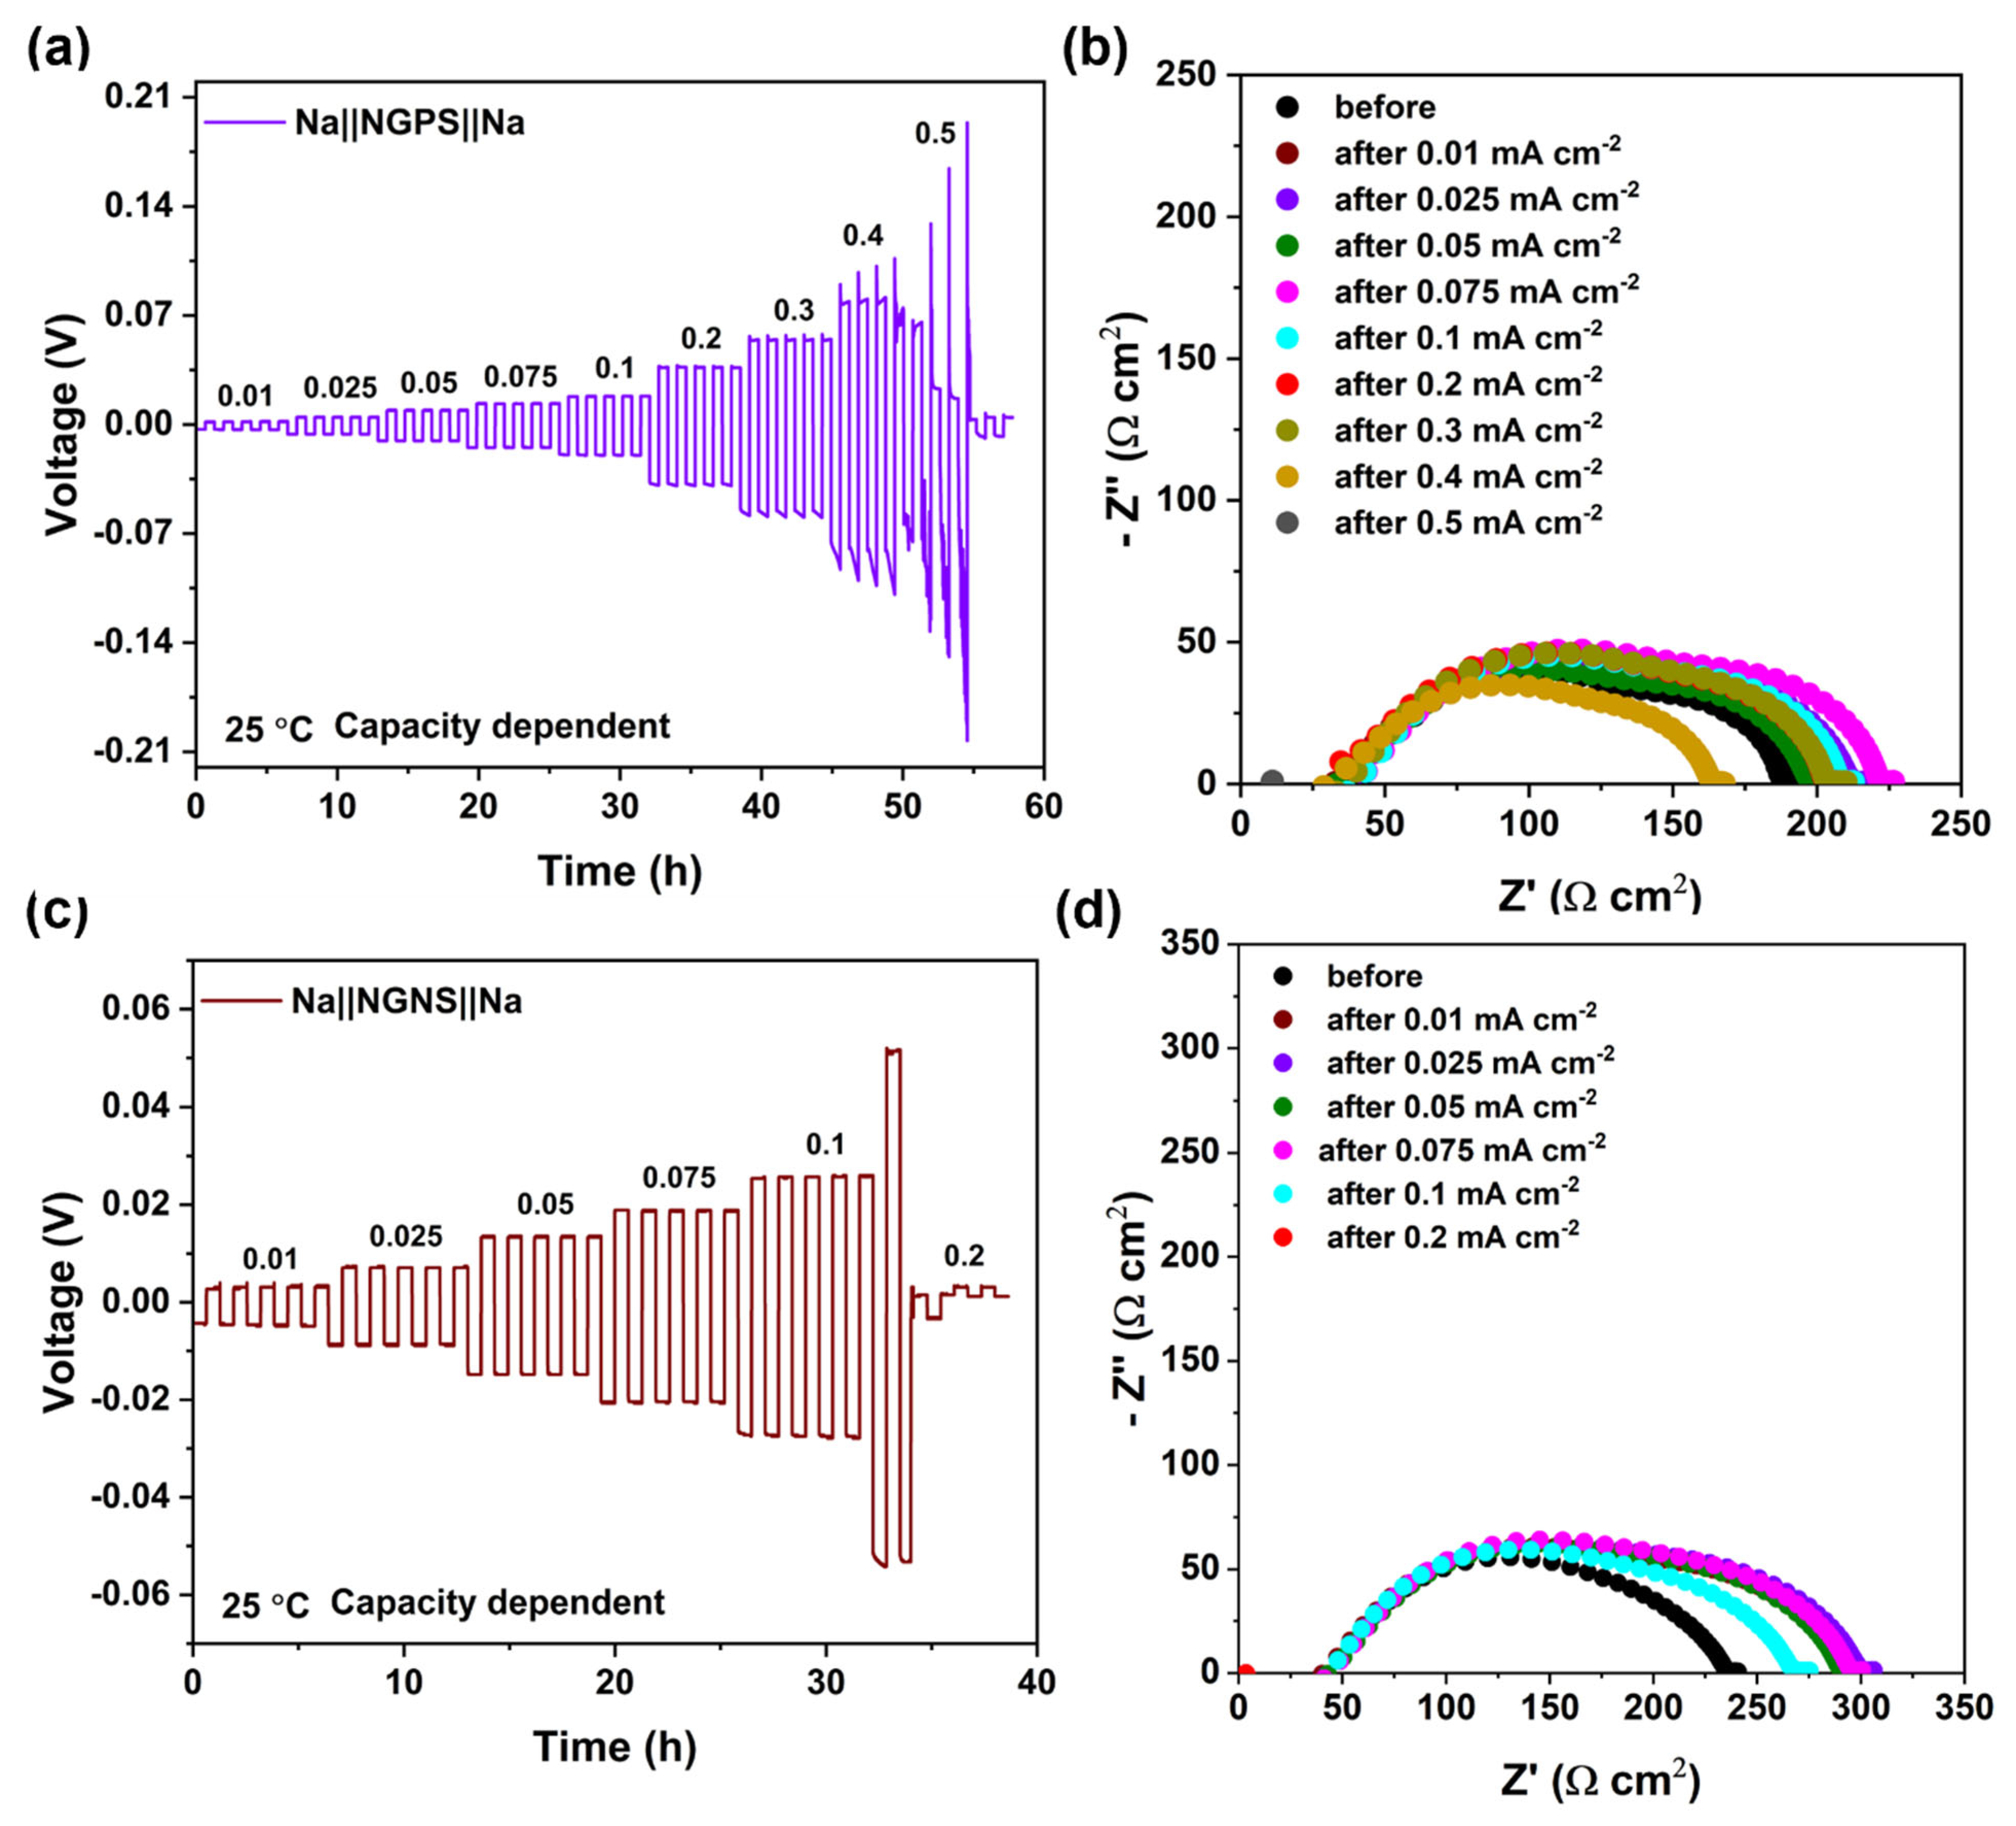
Galvanostatic cycling studies at increasing current densities were conducted on NGPS and NGNS electrolytes paired with a sodium metal anode at 25 °C to optimize the maximum current density the cell can withstand before shorting. Figure 7a,c display the critical current density (CCD) measurements with increasing current densities from 0.01 to 0.5 mA cm−2, using a fixed capacity. A constant capacity approach ensures a controlled and consistent amount of sodium deposition and stripping, which helps prevent premature cell failure. Before testing, as described in our previous work, the solid electrolyte pellets were preheated in an inert atmosphere to eliminate surface carbonate or hydroxide layers formed during sintering [24,35]. The EIS data before and after each current density step are shown in Figure 7b,d, respectively. In NGPS (Figure 7b), the electrolyte and interfacial resistances increased gradually at lower current densities, stabilizing at 0.1 mA cm−2. Dendritic growth is suspected at 0.4 mA cm−2, as evidenced by a decrease in interfacial resistance and fluctuating voltage profiles. At 0.5 mA cm−2, the total resistance dropped below 10 Ω, and the voltage profile exhibited signs of internal sodium deposition within the pellet, ultimately leading to short-circuit failure.
In contrast, NGNS exhibited different CCD behaviour (Figure 7d). The interfacial resistance initially increased from 0.01 mA cm−2, possibly due to minor contact loss between the sodium metal and the solid electrolyte but stabilized up to 0.075 mA cm−2. Voltage profiles remained steady across both electrodes (Figure 7c). However, a sudden short circuit occurred at 0.2 mA cm−2, notably lower than the CCD of NGPS. Unlike NGPS, which showed gradual dendritic progression, NGNS displayed a rapid failure mechanism, indicating abrupt internal breakdown. In summary, although NGNS demonstrated higher ionic conductivity and a phase-pure structure, NGPS achieved a higher CCD, likely due to improved wettability with the sodium metal anode.

3.5.2. Long-Term Stability Tests Between Sodium Metal and Silicate Electrolytes

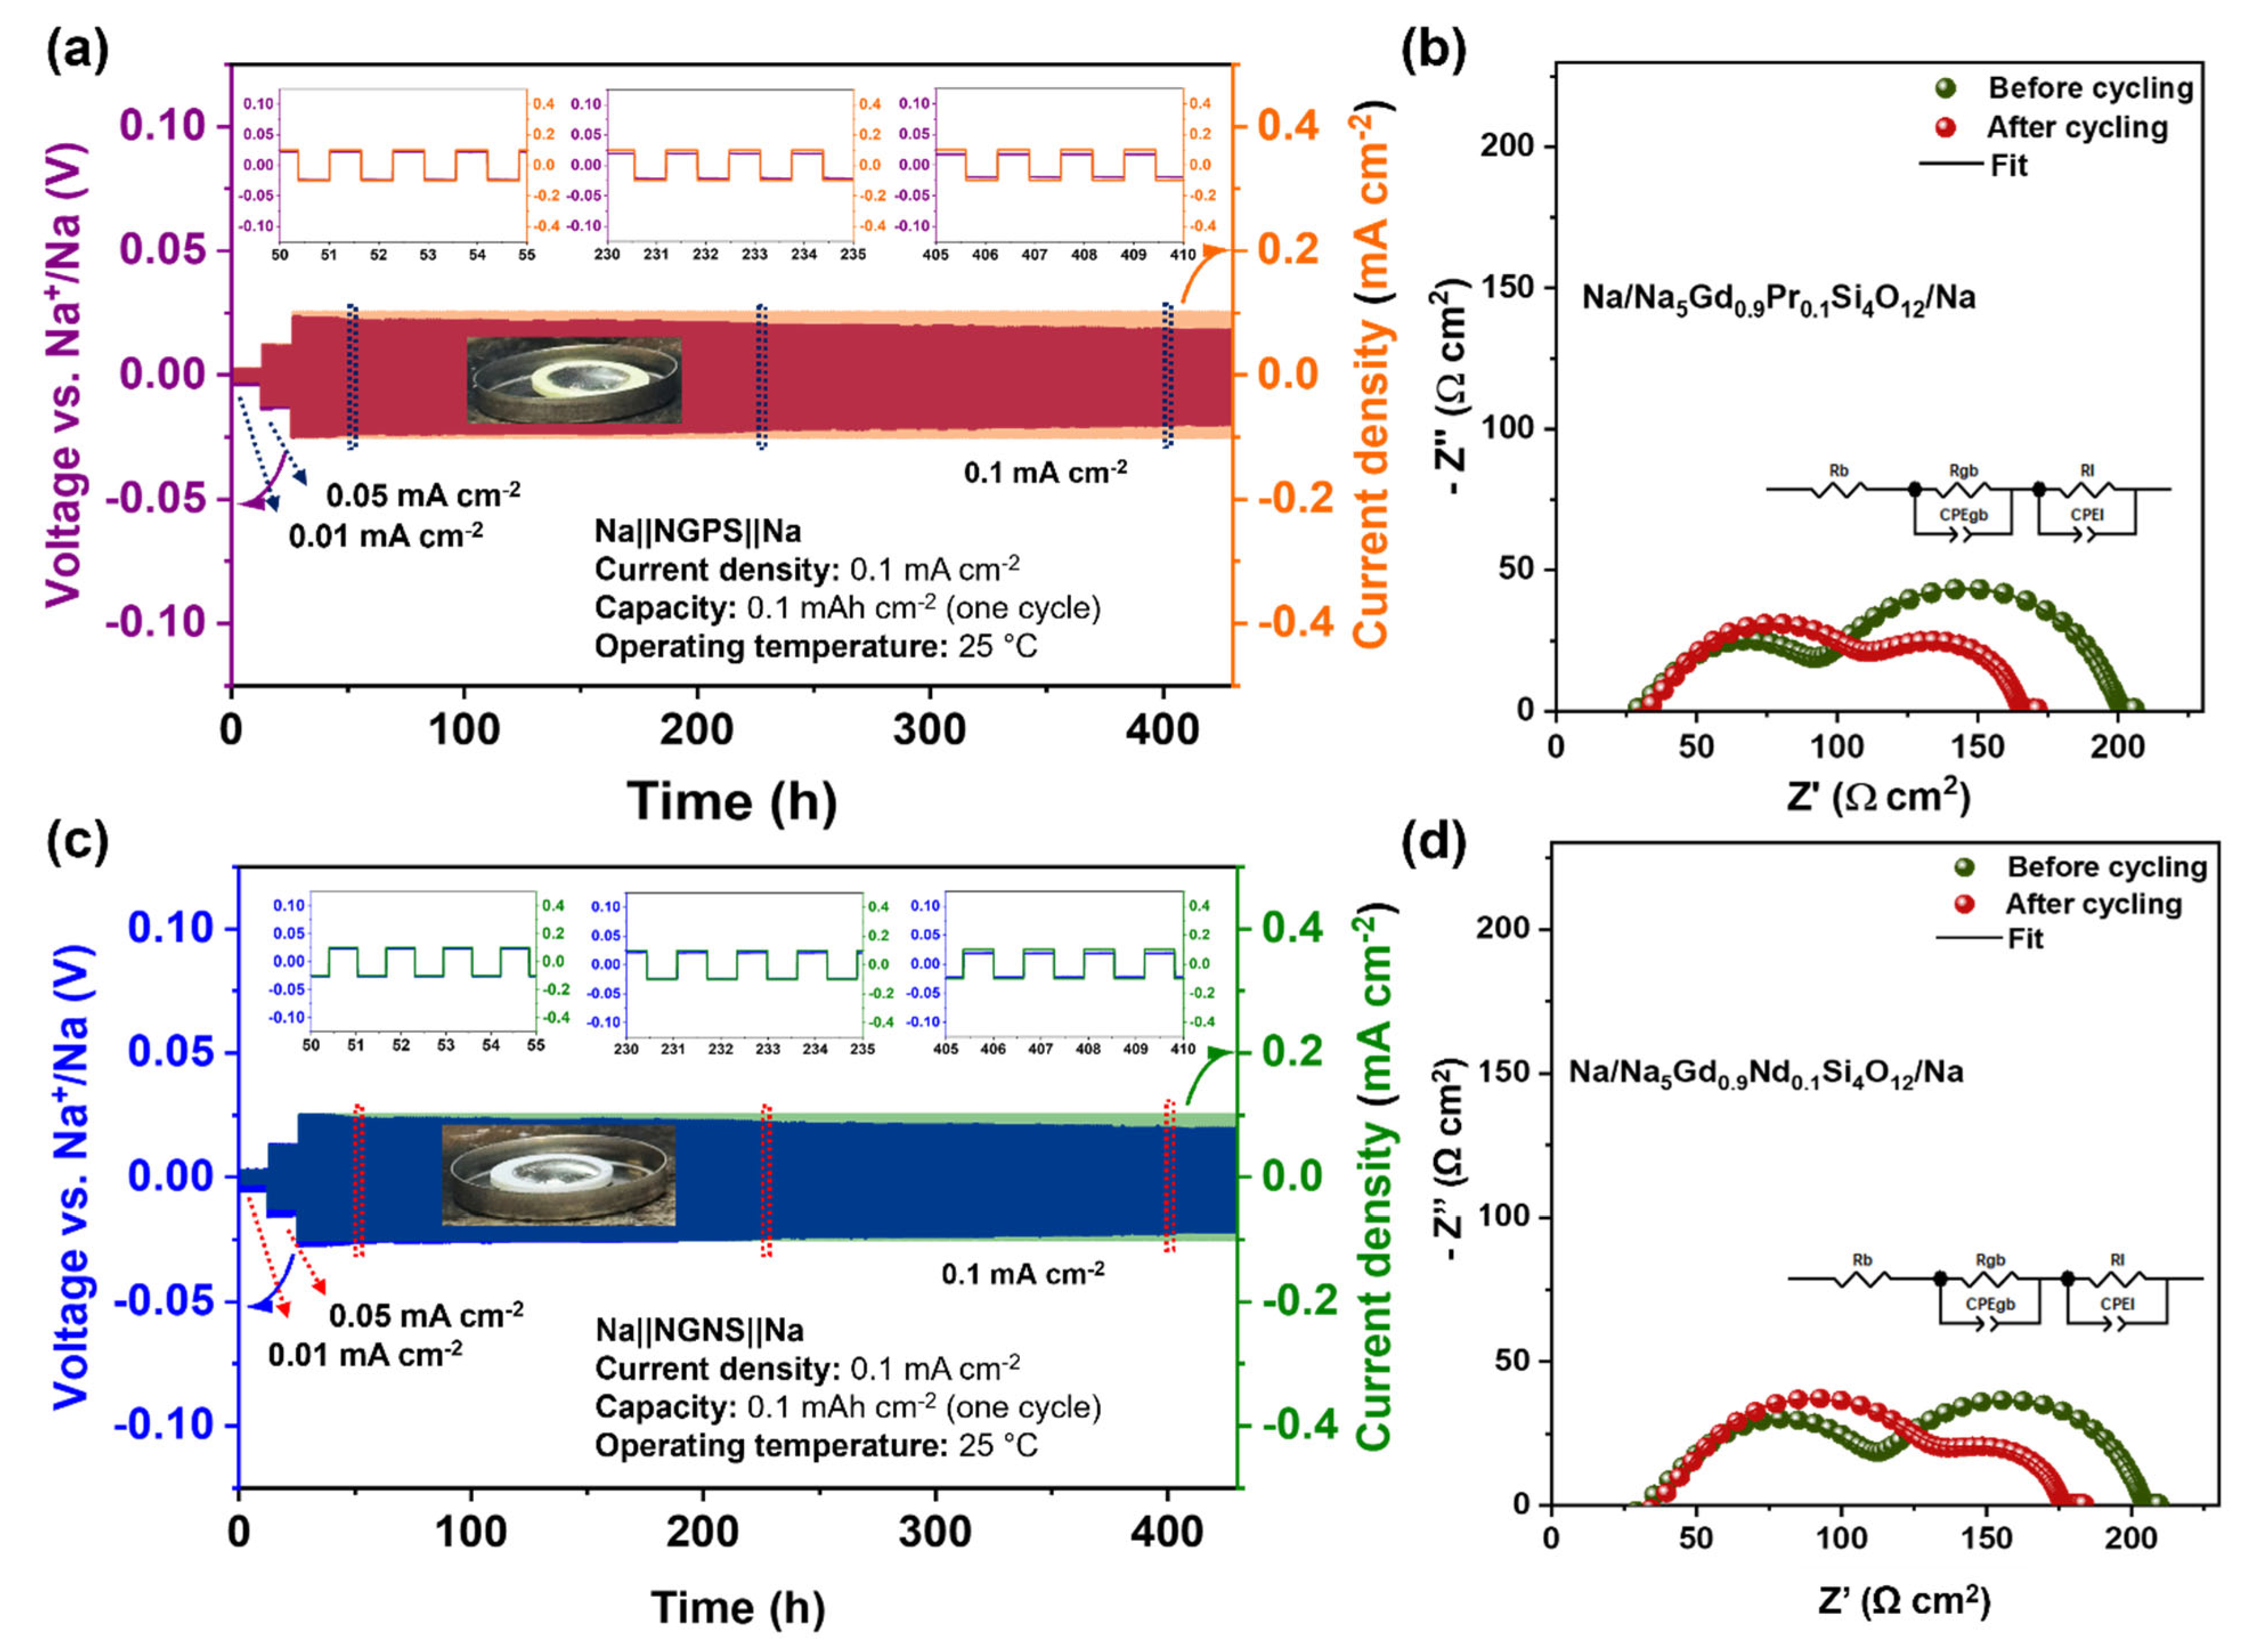
Long-term sodium plating/stripping tests were carried out at a current density of 0.1 mA cm−2 over 400 h, with a fixed areal capacity of 0.1 mAh cm−2 per cycle, as presented in Figure 8a,c for NGPS and NGNS, respectively. The inset in these figures displays sodium wetting behaviour, indicating improved wettability on both silicate electrolytes. Initial conditioning cycles were performed at lower current densities of 0.01 and 0.05 mA cm−2 before switching to 0.1 mA cm−2 to promote stable interfacial formation. Symmetric and stable voltage plateaus observed during cycling suggest uniform sodium deposition across the electrolyte surfaces. The inset also demonstrates flat voltage profiles at the beginning, midpoint, and end of cycling, underscoring consistent electrochemical behaviour. Notably, the voltage response (y1-axis) showed a gradual decline with cycling, relative to the applied current density (y2-axis), implying enhanced interfacial contact and possible mitigation of voids or pores.
The EIS measurements before and after cycling are shown in Figure 8b (NGPS) and 8d (NGNS) reveal a marked decrease in interfacial resistance for both electrolytes. This trend is corroborated by the overpotential evolution and is summarized in Table 3. The post-cycling interfacial area-specific resistances (ASRinterface) were calculated to be 29.47 Ω cm2 for NGPS and 22.88 Ω cm2 for NGNS, reflecting improved interfacial contact and reduced overpotentials. Overall, both NGPS and NGNS demonstrate good sodium wettability and enhanced interfacial stability, as evidenced by reduced interfacial resistance and uniform voltage responses during extended cycling.

4. Conclusions

In summary, Pr3+- and Nd3+-doped sodium gadolinium silicate ceramics were successfully synthesized via a conventional solid-state reaction route. Phase analysis revealed that nearly phase-pure NASICON-type silicates were obtained at higher sintering temperatures, with the Nd-doped composition, Na5Gd0.9Nd0.1Si4O12, showing particularly high phase purity. Out of the eight compositions investigated, pellets sintered at 1075 °C demonstrated the best electrochemical performance, achieving the highest sodium-ion conductivity (mS cm−1) range with low activation energy of 0.24 eV, indicative of facile Na+ transport. Furthermore, sodium metal exhibited good wettability with the silicate electrolyte, enabling stable Na plating/stripping for over 400 h without short-circuiting, which highlights the robust chemical and electrochemical compatibility of these materials. Overall, this study demonstrates that targeted rare-earth doping, coupled with optimized sintering, can significantly improve both phase purity and ionic conductivity in sodium gadolinium silicates, advancing their potential as solid electrolytes for next-generation sodium metal batteries.

Author Contributions

Conceptualization, methodology, experimental work, data analyses, validation, writing—original draft, review and editing—A.S.; draft review and editing—S.B.; draft review and editing—S.R.; visualization, supervision, project administration, funding acquisition, draft review and editing—V.T. All authors have read and agreed to the published version of the manuscript.

Funding

This research received no external funding.

Data Availability Statement

All data related to this work is included in the article.

Acknowledgments

A.S. acknowledges Todd C Sutherland for his continuous support and guidance during the graduate studies.

Conflicts of Interest

Author, Shantel Butler was employed by Elektra industries and Author, Samuel Reid was employed by Geometric energy corporation. The remaining authors declare that the research was conducted in the absence of any commercial or financial relationships that could be construed as a potential conflict of interest.

Abbreviations

The following abbreviations are used in this manuscript:
SMBSodium metal batteries
SIBSodium-ion batteries
ASSSBAll-solid-state-sodium batteries
LIBLithium-ion batteries
NASICONSodium superionic conductor
NGPSNa5Gd0.9Pr0.1Si4O12
NGNSNa5Gd0.9Nd0.1Si4O12
NGSSodium gadolinium silicate
ASRArea-specific resistance
PXRDPowder X-ray
SEMScanning electron microscopy
EDXEnergy dispersive X-ray
EISElectrochemical impedance spectroscopy
CCDCritical current density

References

  1. Yang, P.; Wu, Z.; Liang, Y.; Chen, H.; Lin, C.; Qiu, J.; Meng, J.; He, Y.; Zhang, S. Engineering Ion Transport in All-Solid-State Sodium-Ion Batteries: Fundamentals, Strategies, and Perspectives. Prog. Mater. Sci. 2025, 154, 101503. [Google Scholar] [CrossRef]
  2. Wu, J.; Zhang, R.; Fu, Q.; Zhang, J.; Zhou, X.; Gao, P.; Xu, C.; Liu, J.; Guo, X. Inorganic Solid Electrolytes for All-Solid-State Sodium Batteries: Fundamentals and Strategies for Battery Optimization. Adv. Funct. Mater. 2021, 31, 2008165. [Google Scholar] [CrossRef]
  3. Zhou, C.; Bag, S.; Thangadurai, V. Engineering Materials for Progressive All-Solid-State Na Batteries. ACS Energy Lett. 2018, 3, 2181–2198. [Google Scholar] [CrossRef]
  4. Sivakumaran, A.; Samson, A.J.; Thangadurai, V. Progress in Sodium Silicates for All-Solid-State Sodium Batteries—A Review. Energy Technol. 2023, 11, 2201323. [Google Scholar] [CrossRef]
  5. Yi, B.; Wei, Z.; Jia, W.; Sun, G.; Si, W.; Yao, S.; Chen, G.; Du, F. Nonstoichiometry Induced Amorphous Grain Boundary of Na5SmSi4O12 Solid-State Electrolyte for Long-Life Dendrite-Free Sodium Metal Battery. Nano Lett. 2024, 24, 8911–8919. [Google Scholar] [CrossRef]
  6. Yang, A.; Yao, K.; Schaller, M.; Dashjav, E.; Li, H.; Zhao, S.; Zhang, Q.; Etter, M.; Shen, X.; Song, H.; et al. Enhanced Room-Temperature Na+ Ionic Conductivity in Na4.92Y0.92Zr0.08Si4O12. eScience 2023, 3, 100175. [Google Scholar] [CrossRef]
  7. Hou, W.; Guo, X.; Shen, X.; Amine, K.; Yu, H.; Lu, J. Solid Electrolytes and Interfaces in All-Solid-State Sodium Batteries: Progress and Perspective. Nano Energy 2018, 52, 279–291. [Google Scholar] [CrossRef]
  8. Rizvi, S.; Aladhyani, I.; Ding, Y.; Zhang, Q. Recent Advances in Doping Na3Zr2Si2PO12 (NASICON) Solid-State Electrolyte for Sodium-Ion Batteries. Nano Energy 2024, 129, 110009. [Google Scholar] [CrossRef]
  9. Luo, W.; Lin, C.; Zhao, O.; Noked, M.; Zhang, Y.; Rubloff, G.W.; Hu, L. Ultrathin Surface Coating Enables the Stable Sodium Metal Anode. Adv. Energy Mater. 2017, 7, 1601526. [Google Scholar] [CrossRef]
  10. Liu, G.; Yang, J.; Wu, J.; Peng, Z.; Yao, X. Inorganic Sodium Solid Electrolytes: Structure Design, Interface Engineering and Application. Adv. Mater. 2024, 36, e2311475. [Google Scholar] [CrossRef]
  11. Lu, X.; Xia, G.; Lemmon, J.P.; Yang, Z. Advanced Materials for Sodium-Beta Alumina Batteries: Status, Challenges and Perspectives. J. Power Sources 2010, 195, 2431–2442. [Google Scholar] [CrossRef]
  12. Liu, Y.; Liu, L.; Peng, J.; Zhou, X.; Liang, D.; Zhao, L.; Su, J.; Zhang, B.; Li, S.; Zhang, N.; et al. A Niobium-Substituted Sodium Superionic Conductor with Conductivity Higher than 5.5 MS Cm−1 Prepared by Solution-Assisted Solid-State Reaction Method. J. Power Sources 2022, 518, 230765. [Google Scholar] [CrossRef]
  13. Zhang, Q.; Liang, F.; Qu, T.; Yao, Y.; Ma, W.; Yang, B.; Dai, Y. Effect on Ionic Conductivity of Na3+xZr2−xMxSi2PO12 (M=Y, La) by Doping Rare-Earth Elements. IOP Conf. Ser. Mater. Sci. Eng. 2018, 423, 012122. [Google Scholar] [CrossRef]
  14. Huang, T.; Xiong, W.; Ye, X.; Huang, Z.; Feng, Y.; Liang, J.; Ye, S.; Piao, J.; Wang, X.; Li, Y.; et al. A Cerium-Doped NASICON Chemically Coupled Poly(Vinylidene Fluoride-Hexafluoropropylene)-Based Polymer Electrolyte for High-Rate and High-Voltage Quasi-Solid-State Lithium Metal Batteries. J. Energy Chem. 2022, 73, 311–321. [Google Scholar] [CrossRef]
  15. Pal, S.K.; Saha, R.; Kumar, G.V.; Omar, S. Designing High Ionic Conducting NASICON-Type Na3 Zr2 Si2 PO12 Solid-Electrolytes for Na-Ion Batteries. J. Phys. Chem. C 2020, 124, 9161–9169. [Google Scholar] [CrossRef]
  16. Ran, L.; Baktash, A.; Li, M.; Yin, Y.; Demir, B.; Lin, T.; Li, M.; Rana, M.; Gentle, I.; Wang, L.; et al. Sc, Ge Co-Doping NASICON Boosts Solid-State Sodium Ion Batteries’ Performance. Energy Storage Mater. 2021, 40, 282–291. [Google Scholar] [CrossRef]
  17. Pratiwi, V.M.; Noerochim, L.; Purwaningsih, H.; Wibowo, A.A.; Maulana, F.A. Study of Addition Metal (Ti, Zn) Dopan on the Structure of NASICON as Solid Electrolyte Batteries. Eng. Chem. 2024, 5, 43–48. [Google Scholar] [CrossRef]
  18. Yu, Z.; Shang, S.; Seo, J.; Wang, D.; Luo, X.; Huang, Q.; Chen, S.; Lu, J.; Li, X.; Liu, Z.; et al. Exceptionally High Ionic Conductivity in Na3P0.62As0.38S4 with Improved Moisture Stability for Solid-State Sodium-Ion Batteries. Adv. Mater. 2017, 29, 1605561. [Google Scholar] [CrossRef]
  19. He, S.; Xu, Y.; Chen, Y.; Ma, X. Enhanced Ionic Conductivity of an F-Assisted Na3 Zr2 Si2 PO12 Solid Electrolyte for Solid-State Sodium Batteries. J. Mater. Chem. A 2020, 8, 12594–12602. [Google Scholar] [CrossRef]
  20. Zhao, S.; Che, H.; Chen, S.; Tao, H.; Liao, J.; Liao, X.-Z.; Ma, Z.-F. Research Progress on the Solid Electrolyte of Solid-State Sodium-Ion Batteries. Electrochem. Energy Rev. 2024, 7, 3. [Google Scholar] [CrossRef]
  21. Sun, G.; Lin, H.; Yao, S.; Wei, Z.; Chen, N.; Chen, G.; Zhao, H.; Du, F. High-Entropy Solid-State Na-Ion Conductor for Stable Sodium-Metal Batteries. Chem. Eur. J. 2023, 29, e202300413. [Google Scholar] [CrossRef]
  22. Abdelaal, M.M.; Wang, Z.; Shen, H.; Pan, Z.; Kotobuki, M. Electrochemical Properties of a La-Doped Na5YSi4O12 Ceramic Electrolyte. ACS Appl. Energy Mater. 2025, 8, 9656–9662. [Google Scholar] [CrossRef]
  23. Sivakumaran, A.; Samson, A.J.; Bristi, A.A.; Surendran, V.; Butler, S.; Reid, S.; Thangadurai, V. High Ionic Conducting Rare-Earth Silicate Electrolytes for Sodium Metal Batteries. J. Mater. Chem. A 2023, 11, 15792–15801. [Google Scholar] [CrossRef]
  24. Sivakumaran, A.; Surendran, V.; Butler, S.; Reid, S.; Thangadurai, V. Sodium Ion Conductivities in Na2O–Sm2O3–SiO2 Ceramics. EES Batter. 2025, 1, 287–297. [Google Scholar] [CrossRef]
  25. Okura, T.; Kawada, K.; Hashimoto, H.; Yamashita, K. Novel Fast Na+ Conducting Rare Earth-Free Na5YSi4O12-Type Borosilicate Glass-Ceramics. Ceram. Int. 2025, 51, 26078–26084. [Google Scholar] [CrossRef]
  26. Boukamp, B.A. A Linear Kronig-Kramers Transform Test for Immittance Data Validation. J. Electrochem. Soc. 1995, 142, 1885–1894. [Google Scholar] [CrossRef]
  27. Boukamp, B.A. Electrochemical Impedance Spectroscopy in Solid State Ionics: Recent Advances. Solid State Ionics 2004, 169, 65–73. [Google Scholar] [CrossRef]
  28. Park, H.; Jung, K.; Nezafati, M.; Kim, C.S.; Kang, B. Sodium Ion Diffusion in Nasicon (Na3Zr2Si2PO12) Solid Electrolytes: Effects of Excess Sodium. ACS Appl. Mater. Interfaces 2016, 8, 27814–27824. [Google Scholar] [CrossRef] [PubMed]
  29. Irvine, J.T.S.; Sinclair, D.C.; West, A.R. Electroceramics: Characterization by Impedance Spectroscopy. Adv. Mater. 1990, 2, 132–138. [Google Scholar] [CrossRef]
  30. Shannon, R.D.; Taylor, B.E.; Gier, T.E.; Chen, H.Y.; Berzins, T. Ionic Conductivity in Sodium Yttrium Silicon Oxide (Na5YSi4O12)-Type Silicates. Inorg. Chem. 1978, 17, 958–964. [Google Scholar] [CrossRef]
  31. Horiuchi, N.; Ryu, K.; Nagai, A.; Okura, T.; Yamashita, K. Sol–Gel Synthesis and Electrical Properties of Sodium Ion Conducting Solid Electrolyte with Na5YSi4O12-Type Structure. Open Ceram. 2021, 8, 100175. [Google Scholar] [CrossRef]
  32. Okura, T.; Yoshida, N.; Yamashita, K. Na+ Superionic Conducting Silicophosphate Glass-Ceramics—Review. Solid State Ionics 2016, 285, 143–154. [Google Scholar] [CrossRef]
  33. Michalak, A.; Behara, S.; Anji Reddy, M. Reinvestigation of Na5GdSi4O12: A Potentially Better Solid Electrolyte than Sodium β Alumina for Solid-State Sodium Batteries. ACS Appl. Mater. Interfaces 2024, 16, 7112–7118. [Google Scholar] [CrossRef]
  34. Lowack, A.; Nakum, Y.; Anton, R.; Nikolowski, K.; Partsch, M.; Michaelis, A. Quantifying Sodium Dendrite Formation in Na5SmSi4O12 Solid Electrolytes. Batter. Supercaps, 2025; early view. [Google Scholar] [CrossRef]
  35. Bay, M.; Wang, M.; Grissa, R.; Heinz, M.V.F.; Sakamoto, J.; Battaglia, C. Sodium Plating from Na-β″-Alumina Ceramics at Room Temperature, Paving the Way for Fast-Charging All-Solid-State Batteries. Adv. Energy Mater. 2020, 10, 1902899. [Google Scholar] [CrossRef]
Figure 1. PXRD patterns, (a) NGPS and (b) NGNS sintered at various temperatures (950–1075 °C). (The symbols, ♦ and ∗ refers to the patterns, NaGdSiO4 (# 00-035-0013) and Na9GdSi6O18 (# 00-056-0122), respectively).
Batteries 11 00354 g001
Figure 2. Cross-sectional SEM images, (ad) NGPS, and (eh) NGNS (pellets sintered at various temperatures (950–1075 °C)).
Batteries 11 00354 g002
Figure 3. Cross-sectional SEM image along with elemental mapping, (a) NGPS and (b) NGNS (elements including Na, Gd, Pr, Nd, Si, and O) for the best composition sintered at 1075 °C.
Batteries 11 00354 g003
Figure 4. Nyquist plots at 25 °C, (a) NGPS, and (c) NGNS. Linear Kramers–Kronig validity test performed on the Nyquist data, (b) NGPS, and (d) NGNS. (Both NGPS and NGNS are sintered at various temperatures, including 950, 1000, 1050 and 1075 °C).
Batteries 11 00354 g004
Figure 5. Log f vs. log |Z|, (a) NGPS, and (b) NGNS. Log f vs. phase angle, (c) NGPS and (d) NGNS. (Both NGPS and NGNS are sintered at various temperatures, including 950, 1000, 1050 and 1075 °C).
Batteries 11 00354 g005
Figure 6. Arrhenius plots of (a) NGPS and (b) NGNS (25–150 °C with total activation energies included). DC polarization curves at 0.1 V for 5 h, (c) Au/NGPS/Au and (d) Au/NGNS/Au.
Batteries 11 00354 g006
Figure 7. Critical current density (CCD) graphs. (a) Na/NGPS/Na, and (c) Na/NGNS/Na (carried out at increasing current densities). EIS data before and after each current density of (b) Na/NGPS/Na, and (d) Na/NGNS/Na.
Batteries 11 00354 g007
Figure 8. Long-term galvanostatic Na plating/stripping cycling profiles, (a) Na//NGPS//Na and (c) Na//NGNS//Na at a constant current density of 0.1 mA cm−2 with a capacity of 0.1 mAh cm−2. EIS before and after cycling with a suitable equivalent circuit fit, (b) NGPS, and (d) NGNS. (The wettability of sodium on the surface of NGPS and NGNS is given in the inset of respective Figure 7a,c).
Batteries 11 00354 g008
Table 1. AC impedance data of NGPS and NGNS with ionic conductivities and equivalent circuit fit parameters sintered at various temperatures (950, 1000, 1050, and 1075 °C).
SampleSintering Temperature (°C)Total Ionic Conductivity (σi) (S cm−1)Rgb (Ω)ngbCPE 1 (Fs[n−1])
(10−8)
nelCPE 2 (Fs[n−1])
(10−6)
X2
9507.61 × 10−511010.891.480.942.77 0.0009
10007.93 × 10−479.940.884.340.962.390.0006
NGPS10501.50 × 10−332.940.945.260.971.930.0012
10751.64 × 10−333.410.943.190.971.760.0002
9509.52 × 10−5835.10.871.090.902.410.0045
10003.74 × 10−4207.90.853.640.952.230.0019
NGNS10501.45 × 10−330.040.963.230.962.260.0010
10751.74 × 10−331.290.962.350.962.010.0015
Table 2. Comparison of ionic conductivities of doped-silicate electrolytes developed [6,21,22,30,31,32,33,34].
CompositionIonic Conductivity
i) (S cm−1)
Temperature (°C)References
Na5GdSi3.75Ge0.25O0.23 × 10−1300[30]
Na5Gd0.8La0.2Si4O123 × 10−1300[30]
Na4.9Gd0.9Zr0.1Si4O124 × 10−1300[30]
Na4.0Y0.6P0.2Si2.8O93.7 × 10−2300[31]
Na3.9Y0.6P0.3Si2.7O96.6 × 10−3300[32]
Na3.9Sm0.6P0.3Si2.7O91.3 × 10−2300[32]
Na3.9Gd0.6P0.3Si2.7O96.3 × 10−3300[32]
Na4.92Y0.92Zr0.08Si4O123.3 × 10−325[6]
Na4.9Sm0.3Y0.2Gd0.2La0.1Al0.1Zr0.1Si4O126.7 × 10−425[21]
Na4.9Gd0.9Zr0.1Si4O121.9 × 10−325[33]
Na5.2FeBa0.2Si0.8O123.05 × 10−3300[25]
Na5SmSi4O121.5 × 10−330[34]
Na5La0.1Y0.9Si4O124.3 × 10−425[22]
Na5Gd0.9Pr0.1Si4O121.64 × 10−325This work
Na5Gd0.9Nd0.1Si4O121.74 × 10−325This work
Table 3. Applied current density, observed overpotential, and ASRinterface comparison before and after cycling for (NGPS) and (NGNS) are provided.
Applied Current Density (mA cm−2)Expected Voltage (mV)Observed Voltage (mV)Overvoltage (mV)Total
Interfacial Resistance (Ω)
One Side Interfacial Resistance (Ω)Area
Specific Resistance (Ω cm2)
NGPS
(0.1 mA cm−2)
4.22521141.7
(before cycling)
70.8555.65
75.03
(after
cycling)
37.5229.47
NGNS
(0.1 mA cm−2)
4.62520122.7
(before cycling)
61.3548.18
58.26
(after
cycling)
29.1322.88
Disclaimer/Publisher’s Note: The statements, opinions and data contained in all publications are solely those of the individual author(s) and contributor(s) and not of MDPI and/or the editor(s). MDPI and/or the editor(s) disclaim responsibility for any injury to people or property resulting from any ideas, methods, instructions or products referred to in the content.