Article

Classification of the Crystal Structures of Orthosilicate Cathode Materials for Li-Ion Batteries by Artificial Neural Networks

by
Mookala Premasudha
1,†,
Bhumi Reddy Srinivasulu Reddy
1,†,
Kwon-Koo Cho
1,
Ahn Hyo-Jun
1,
Jae-Kyung Sung
1,* and
Nagireddy Gari Subba Reddy
2,*
1
Department of Materials Engineering and Convergence Technology, Gyeongsang National University, 501 Jinju-Daero, Jinju 52828, Republic of Korea
2
School of Materials Science and Engineering, Engineering Research Institute, Gyeongsang National University, 501 Jinju-Daero, Jinju 52828, Republic of Korea
*
Authors to whom correspondence should be addressed.
These authors contributed equally to this work.
Batteries 2025, 11(1), 13; https://doi.org/10.3390/batteries11010013
Submission received: 7 November 2024 / Revised: 23 December 2024 / Accepted: 27 December 2024 / Published: 31 December 2024
(This article belongs to the Section Battery Modelling, Simulation, Management and Application)

Abstract

:
The crystal structures of orthosilicate cathode materials play a critical role in determining the physical and chemical properties of Li-ion batteries. Accurate predictions of these crystal structures are essential for estimating key properties of cathode materials in battery applications. In this study, we utilized crystal structure data from density functional theory (DFT) calculations, sourced from the Materials Project, to predict monoclinic and orthorhombic crystal systems in orthosilicate-based cathode-based materials with Li–Si–(Fe, Mn, Co)–O compositions. An artificial neural network (ANN) model with a 6-22-22-22-1 architecture was trained on 85% of the data and tested on the remaining 15%, achieving an impressive accuracy of 97.3%. The model demonstrated strong predictive capability, with only seven misclassifications from 267 datasets, highlighting its robustness and reliability in predicting the crystal structure of orthosilicate cathodes. To enhance interpretability and model reliability, we employed the Index of Relative Importance (IRI) to identify critical features influencing predictions. Additionally, a user-friendly graphical user interface was also developed to facilitate rapid predictions, enabling researchers to explore structural configurations efficiently and accelerating advancements in battery materials research.

1. Introduction

Lithium-ion batteries have garnered significant attention as one of the most promising next-generation power sources [1]. Among various materials, lithium-ion cathode materials Li–Si–(Fe, Mn, Co)–O compositions are of particular research interest for Li-ion batteries due to low cost, environmental safety, high energy density, and stability capacity [2]. The crystal structure of cathode materials plays a crucial role in determining their physical and chemical properties. Therefore, developing and applying suitable experimental and computational methods for cathode material characterization is essential to improve understanding and optimization of these properties [3].
Recent advancements in cathode materials, such as high-capacity layered oxides, polyanionic compounds, and spinel-type structures, have significantly enhanced the performance and stability of Li-ion batteries. Chaozhu Shu [4,5,6] developed physical and chemical structural materials to boost the cycling stability of Li-ion batteries using Ni-rich cathodes. These developments underscore the need for a comprehensive approach combining experimental techniques and computational modeling to explore and optimize the physical and chemical properties of cathode materials. Such methods can provide deeper insights into the mechanisms that govern their performance and stability.
The Materials Project [3] provides open, web-based access to calculate the chemical and physical properties of identified and predicted materials using density functional theory (DFT) calculations. Researchers can freely extract substantial data on the material properties of the cathode. Advances in computational power have enabled rapid developments in calculating the electronic structures of cathode materials, allowing for assessing the physical and chemical properties of a wide range of novel and complex materials. DFT calculations are a robust approach to estimating materials’ electron density and band structure [7].
The vast amount of data on materials must be effectively analyzed to improve understanding of their properties. Usually, the multifaceted correlations between different physical properties are complex to learn using traditional statistical models. Typically, the complex and multifaceted correlations between various physical and chemical properties have been difficult to capture using conventional statistical models. However, recent advancements in machine learning have significantly improved our ability to identify and model these intricate relationships. Machine learning techniques have been applied to solve complex classification problems across various scientific fields, such as the prediction of the state of health in Li-ion batteries [8], specific volumes [9], crystal structures [10], and the prediction of battery cycle life [11]. These studies emphasize the need for robust models to accurately represent and understand the relationships among these properties.
The crystal systems often exhibit overlapping structural and chemical characteristics, such as similar unit cell volumes, bond angles, or energy levels, making accurate classification a challenging task. Traditional classification methods may struggle to capture these nuanced similarities and differences, particularly when structural parameters fall within overlapping ranges. For example, small variations in formation energy, density, or bandgap might not be sufficient to clearly separate monoclinic from orthorhombic structures, leading to potential misclassifications since the crystal structure of cathode materials plays a crucial role in determining the performance (i.e., lithium diffusion, structural and chemical stability, potential prediction, etc.) of lithium-ion batteries. Thus, advancing and refining computational and experimental techniques for orthosilicate cathode characterization is essential for gaining deeper insights into their physical and chemical attributes. These challenges highlight the need for advanced predictive models, like artificial neural networks (ANNs), which can effectively handle the complex, nonlinear relationships inherent in crystal structure data. Unlike conventional methods, ANNs can learn intricate patterns from large datasets, adapting to subtle distinctions within overlapping features and achieving higher classification accuracy. By leveraging advanced techniques such as deep learning, feature extraction, and sensitivity analysis, these models can better identify the unique properties that distinguish monoclinic and orthorhombic systems. This research employs an ANN to predict the monoclinic and orthorhombic crystal systems of Li–Si–(Fe, Mn, Co)–O cathode materials based on density functional theory calculations. The primary objectives of this study include:
  • To analyze the correlation between crystal structures determined by density functional theory (DFT) calculations.
  • To utilize an ANN model to predict crystal systems (monoclinic and orthorhombic) of orthosilicate cathodes.
  • To evaluate the performance of the ANN models using correlation coefficients.
  • To develop user-friendly software for classifying crystal structures.

2. Materials and Methods

2.1. Experimental Data

The data of the present work was collected from the Materials Project [3,12]. The dataset contains the results of DFT calculations for 267 cathode materials with Li–Si-(Fe, Mn, Co)–O compositions. The DFT calculations and optimizations are performed using VASP software for crystal structure data [13]. The dataset includes monoclinic and orthorhombic crystal structures of various compositions of cathode materials and respective constituents, i.e., the formation of energy (Ef), energy above hull (EH), bandgap (Eg), number of sites (Ns), density (D) and the volume of the unit cell (V). The 267 entries are split into 227 samples for training and 40 for testing to optimize the model architecture and assess its accuracy. The output values are encoded as 0 for monoclinic and 1 for orthorhombic. A statistical overview of crystal structure data: minimum, mean, and maximum values and the input data and ANN-predicted crystal structures for the six independent variables are available in Supplementary Tables S1 and S2.
This flowchart outlines the process for developing an ANN model to predict crystal structure properties using DFT data, as shown in Figure 1. After initial training, the model undergoes optimization cycles to maximize classification accuracy and refine the correlation between inputs and the predicted crystal structure. The finalized model offers predictions on new data and analyzes the relative importance of input variables, providing insights into how each property affects the output. Then, a graphical user interface (GUI) enables users to input data, obtain predictions, and interpret variable impacts, making the model practical and accessible for research and industry applications.
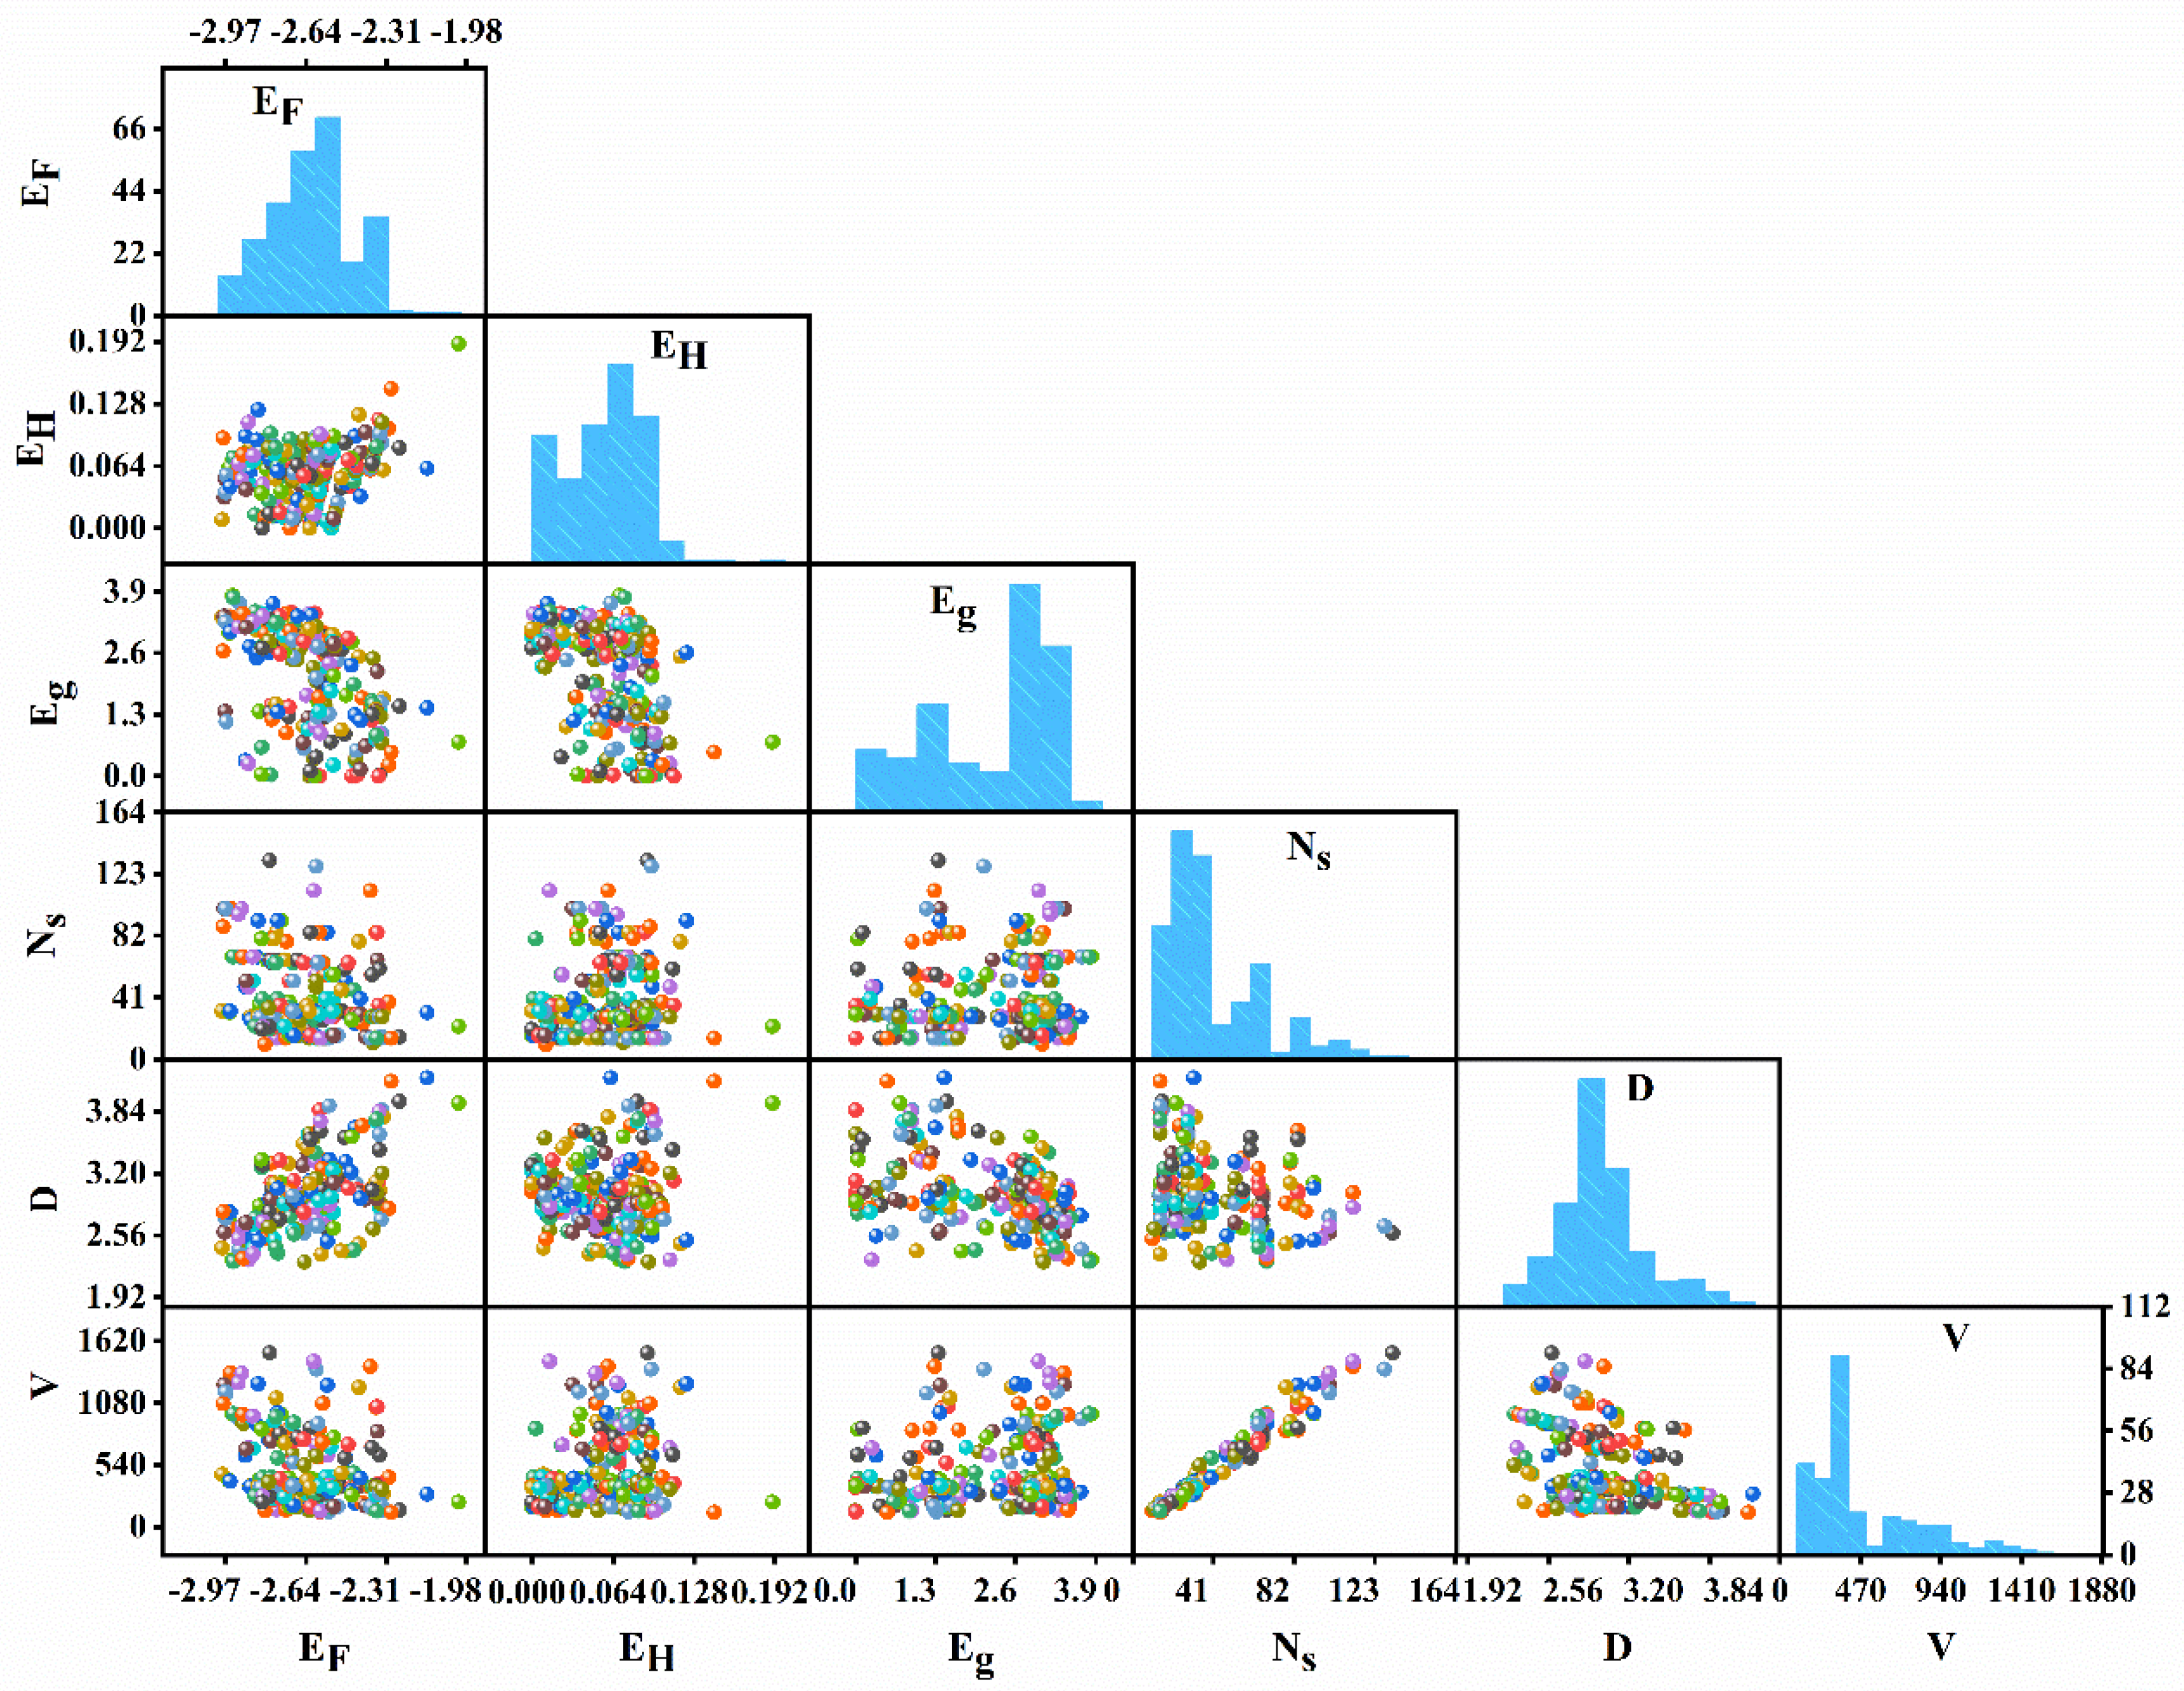
The pair plot presented in Figure 2 provides a comprehensive overview of the distributions and pairwise relationships among several variables: formation energy (EF), energy above the hull (EH), bandgap (Eg), number of sites (Ns), density (D), and volume of the unit cell (V). Each variable’s distribution is displayed along the diagonal cells as histograms, highlighting how values are spread for individual variables. For example, the variable Ns has a fairly uniform distribution, while the volume of unit cells is skewed with higher concentrations at lower values. The scatter plots in the off-diagonal cells illustrate the relationships between each pair of variables, revealing insights into possible correlations. A notable positive relationship appears between Ns and density, as indicated by a clear upward trend in their scatter plot, suggesting that as Ns increases, density tends to increase as well. Conversely, some pairs, such as EF and EH, exhibit more dispersed scatter patterns, implying weaker or more complex interactions. Additionally, the scatter plots use various colors, which likely correspond to different categories or groups within the dataset, adding a categorical dimension to the analysis. This pair plot effectively captures both the individual characteristics and the interdependencies within the dataset, facilitating the identification of patterns and possible correlations across variables.

2.2. ANN Model Development

The ANN model consists of six input neurons, EF, EH, Eg, Ns, D, and V, and a single output neuron representing crystal structure types (monoclinic and orthorhombic), as illustrated in Figure 1. We trained the feed-forward neural network with the backpropagation algorithm using the sigmoid function as an activation function [14]. During training, the model adjusts the connection weights to minimize the difference between the predicted and actual crystal structures for each input. By tuning the ANN’s hyperparameters, the best model for predicting crystal structure was selected based on the average error in test data. The optimal configuration, with three hidden layers containing twenty-two neurons each, a momentum term of 0.3, a learning rate of 0.6, and 40,000 iterations, resulted in only seven misclassifications out of 40 test samples while achieving zero misclassifications in the training set. Adjusting the hyperparameters of the ANN model allowed for the selection of optimal architecture for estimating the crystal structures. When using three hidden layers with 22 neurons in each, the model achieved an accuracy of 91%. By varying the momentum term and learning rate from 0.1 to 0.9 and at the values of 0.3 and 0.6, respectively, we achieved an accuracy of 93%. Finally, by increasing the number of iterations to 40,000, the model’s accuracy improved to 97%, as shown in Figure 3.
The graphs collectively illustrate the impact of various hyperparameters—hidden neurons, momentum term, learning rate, and iterations—on the accuracy of the ANN model for predicting crystal structures. Varying the hyperparameters of the ANN model allows for the selection of the most optimal architecture for estimating crystal structures. Figure 3a compares model accuracy with two versus three hidden layers as the number of neurons per layer varies. Accuracy generally increases with more neurons, reaching a peak of around 22 neurons for three hidden layers, achieving 91% accuracy indicating an effective configuration. Figure 3b illustrates the effect of the momentum term, where accuracy is highest at 0.3; increasing beyond this point leads to a decline, suggesting that a moderate momentum value strikes a balance between training speed and stability. When both the momentum term and learning rate were set at 0.3 and 0.6, respectively, accuracy improved to 93%. In Figure 3c, the learning rate is varied, with accuracy peaking around a rate of 0.6; very low or very high learning rates result in decreased accuracy, underscoring the need for a balanced rate for effective training. Finally, Figure 3d demonstrates that accuracy improves with an increasing number of iterations, stabilizing around 40,000 iterations, where the model achieved a high accuracy of 97%. These results highlight the importance of fine-tuning each hyperparameter to achieve optimal model performance. The final model configuration yielded only seven misclassifications in the test set, demonstrating the robustness and reliability of the ANN model.

3. Results and Discussion

3.1. Model Predictions for Crystal System Classification

We developed several ANN models using code written in the programming language C to estimate the class of the crystal structures. The classification capabilities of the ANN models were tested on a dataset of 267 samples, with 40 samples reserved for testing. We obtained a minimum of seven misclassifications by varying ANN parameters with the 6-22-22-22-1 architecture, a momentum term of 0.3, and a learning rate of 0.6.
Figure 4 illustrates the weight distribution in the ANN model with a 6-22-22-22-1 architecture at both the initial and optimal stages of training. Initially, the weights are randomly initialized within a narrow range of −0.5 to 0.5 (shown as light gray points), reflecting the untrained state of the model. After 40,000 iterations, the final weights (depicted in red) show a much broader range, spanning from −47.85 to 45.76. This significant expansion indicates the adjustments made during training to capture the complex relationships between input features and crystal structure classification. The wider distribution and increased dispersion of the weights demonstrate the model’s enhanced complexity and optimization, enabling improved classification performance and predictive accuracy.
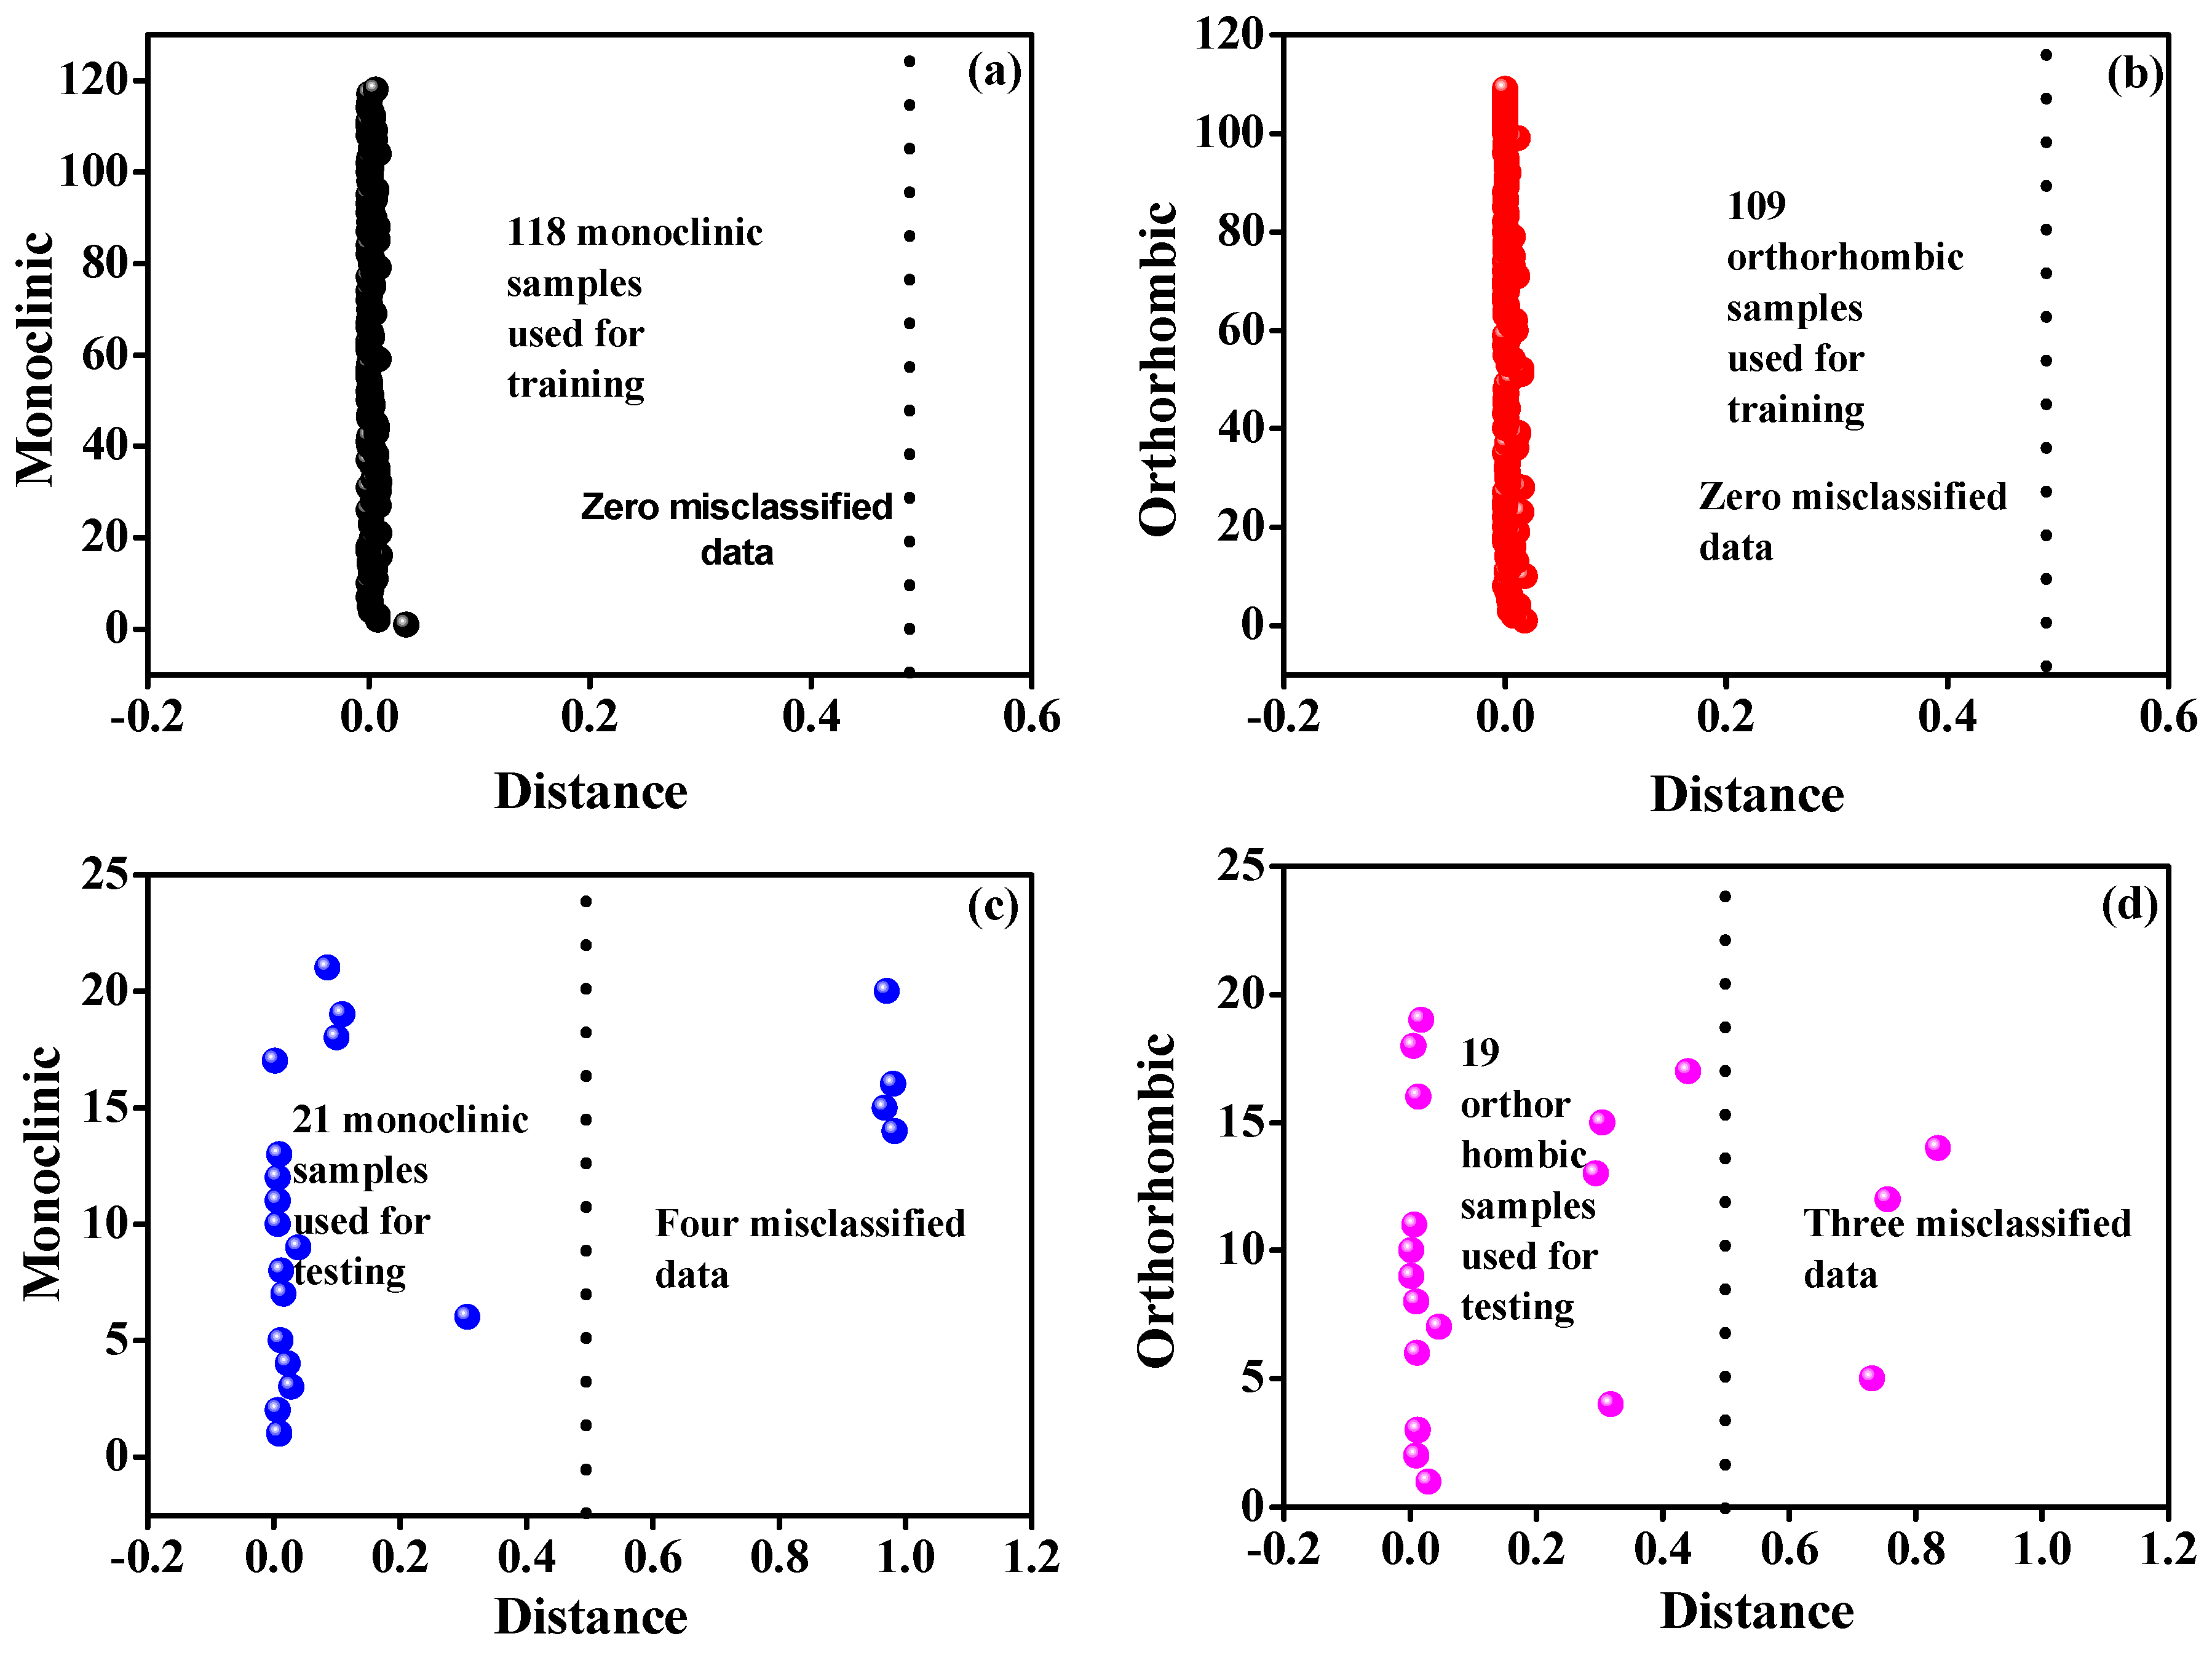
Monoclinic samples were labeled as 0, and orthorhombic samples as 1, with a cut-off value of 0.5 used for classification. Figure 5 illustrates the ANN model’s classification performance for monoclinic and orthorhombic crystal structures in both training and testing datasets using distance metrics.
Figure 5a shows the distribution of 118 monoclinic samples from the training set, which were clustered within a narrow distance range and resulted in zero misclassifications. Similarly, Figure 5b shows the distribution of 109 orthorhombic samples, which were also clustered within a narrow range and resulted in zero misclassifications.
For the testing dataset, slight classification challenges are observed. Figure 5c shows the distribution of 21 monoclinic samples, with most correctly classified near the origin, but four samples are misclassified because they fall outside the main cluster. Figure 5d shows the distribution of 19 orthorhombic samples, with most correctly classified, although three samples are misclassified because they deviate from the primary cluster.
Overall, these graphs highlight the ANN model’s high classification accuracy in training data, with perfect classification for both monoclinic and orthorhombic crystal structures. While minor misclassifications are observed in the testing data, they reveal areas for potential model refinement, as shown in Table 1. This classification performance is promising and comparable to or better than the results reported in the literature, demonstrating the robustness of the ANN model for crystal structure prediction.
In 40 test datasets, the seven bold datasets are indicated as misclassified data.
The structural and chemical similarities between monoclinic and orthorhombic crystal systems make distinguishing them difficult. Minor inaccuracies or overlapping patterns in the data can impact the model’s predictions. As ANNs are often considered “black boxes”, it can be difficult to understand exactly how they make these distinctions. However, sensitivity or feature importance analysis could help identify which features are most influential in distinguishing between these two structures, potentially revealing areas for data enhancement.
Table 2 highlights specific samples that illustrate these challenges. For instance, samples 5 and 12, both monoclinic, were misclassified as orthorhombic because their volumes closely match the average volumes of orthorhombic structures. Similarly, sample 14 was misclassified from monoclinic to orthorhombic due to its energy above the hull being close to orthorhombic averages. In contrast, samples 33 and 35, which are orthorhombic, were misclassified as monoclinic because their formation energy, site count, and density values resemble those typically observed in monoclinic structures. Lastly, samples 34 and 39, both orthorhombic, were misclassified as monoclinic due to similarities in bandgap and unit cell volume, which are close to typical monoclinic values.
These misclassifications arise from overlapping structural and physical parameters in volume, energy above the hull, formation energy, site density, and bandgap between monoclinic and orthorhombic systems. Such overlaps make it difficult for the ANN to differentiate between the two structures accurately. Although ANNs identify complex patterns well, they struggle with subtle, overlapping features. Thus, improving accuracy may involve introducing discriminative features like interatomic distances, bond angles, or symmetry-specific descriptors or applying ensemble methods and decision rules to address overlaps in monoclinic and orthorhombic systems.

3.2. Evaluation of ANN Model Performance Using Confusion Matrix

Table 3 presents the confusion matrix for the ANN model’s predictions. This matrix details the model’s performance, including true positives (TPs), false negatives (FNs), false positives (FPs), and true negatives (TNs). The ANN correctly predicted the crystal structure for 135 samples, classified as TPs, while four samples were misclassified as FNs despite being correct according to DFT data. Additionally, there were three FPs, where the ANN predicted a positive match incorrectly, and 125 TNs, where the model accurately identified samples that did not match the specified class in the DFT data. In total, 139 samples were predicted as positive (135 TPs + 4 FNs) and 128 as negative (3 FPs + 125 TNs).
The confusion matrix demonstrates the ANN model’s high accuracy and reliability in mirroring the DFT-calculated crystal structures, as reflected by the substantial number of true positive and true negative classifications. Based on the confusion matrix in Table 3, we calculated various performance metrics to evaluate the ANN model’s predictive accuracy. These metrics include accuracy, which reflects the overall correctness of the model’s predictions; Matthews correlation coefficient (MCC), which provides a balanced measure of the quality of binary classifications; recall, which indicates the model’s ability to identify positive cases correctly; specificity, assesses the model’s effectiveness in recognizing negative cases; F-score, which balances precision and recall to evaluate the model’s reliability. These metrics provide a comprehensive understanding of the ANN model’s performance and its capability to accurately distinguish between the crystal structures.
Accuracy = T P + T N ( T P + T N + F P + F N ) = 0.973
MCC = ( T P × T N F P × F N ) T P + F P × T P + F N × T N + F P × ( T N + F N ) = 0.951
Recall   ( RCC ) = T P ( T P + F N ) = 0.971
Specificity   ( precision   ( PRE ) ) = T P ( T P + F P ) = 0.978
F - score   ( F ) = 2 × R C C × P R E R E C + P R E = 0.974
Sensitivity   ( NPV ) = T N ( T N + F N ) = 0.970
The ANN model demonstrated strong performances across various evaluation metrics, indicating its robustness and reliability in predicting the crystal structure. An accuracy of 0.973 shows that the model correctly predicted 97.3% of the instances. A specificity of 0.978 measures the proportion of true negatives correctly identified by the model. A specificity of 0.978 means that the model accurately identified 97.8% of the negative cases, demonstrating its effectiveness in avoiding false positives.
A Matthews correlation coefficient of 0.951 is a comprehensive metric that considers true and false positives and negatives. An MCC of 0.951 suggests a strong correlation between the observed and predicted classifications, reflecting the model’s robustness and balanced performance across all classes. The F-score is the harmonic mean of precision and recall, providing a single metric that balances both. An F-score of 0.974 indicates that the model maintains high precision (correctly identifying positive cases) and recall (correctly identifying all relevant cases), making it highly effective overall. Recall (sensitivity) (0.971) measures the proportion of true positive cases correctly identified by the model. A recall of 0.971 means the model successfully identified 97.1% of the actual positive cases, ensuring minimal false negatives. Sensitivity (0.97), often used interchangeably with recall, also measures the model’s ability to identify actual positive cases. A sensitivity of 0.97 confirms the model’s high capability in detecting positive instances accurately. These metrics collectively demonstrate the ANN model’s high reliability and effectiveness in predicting the class of the crystal structures of materials.
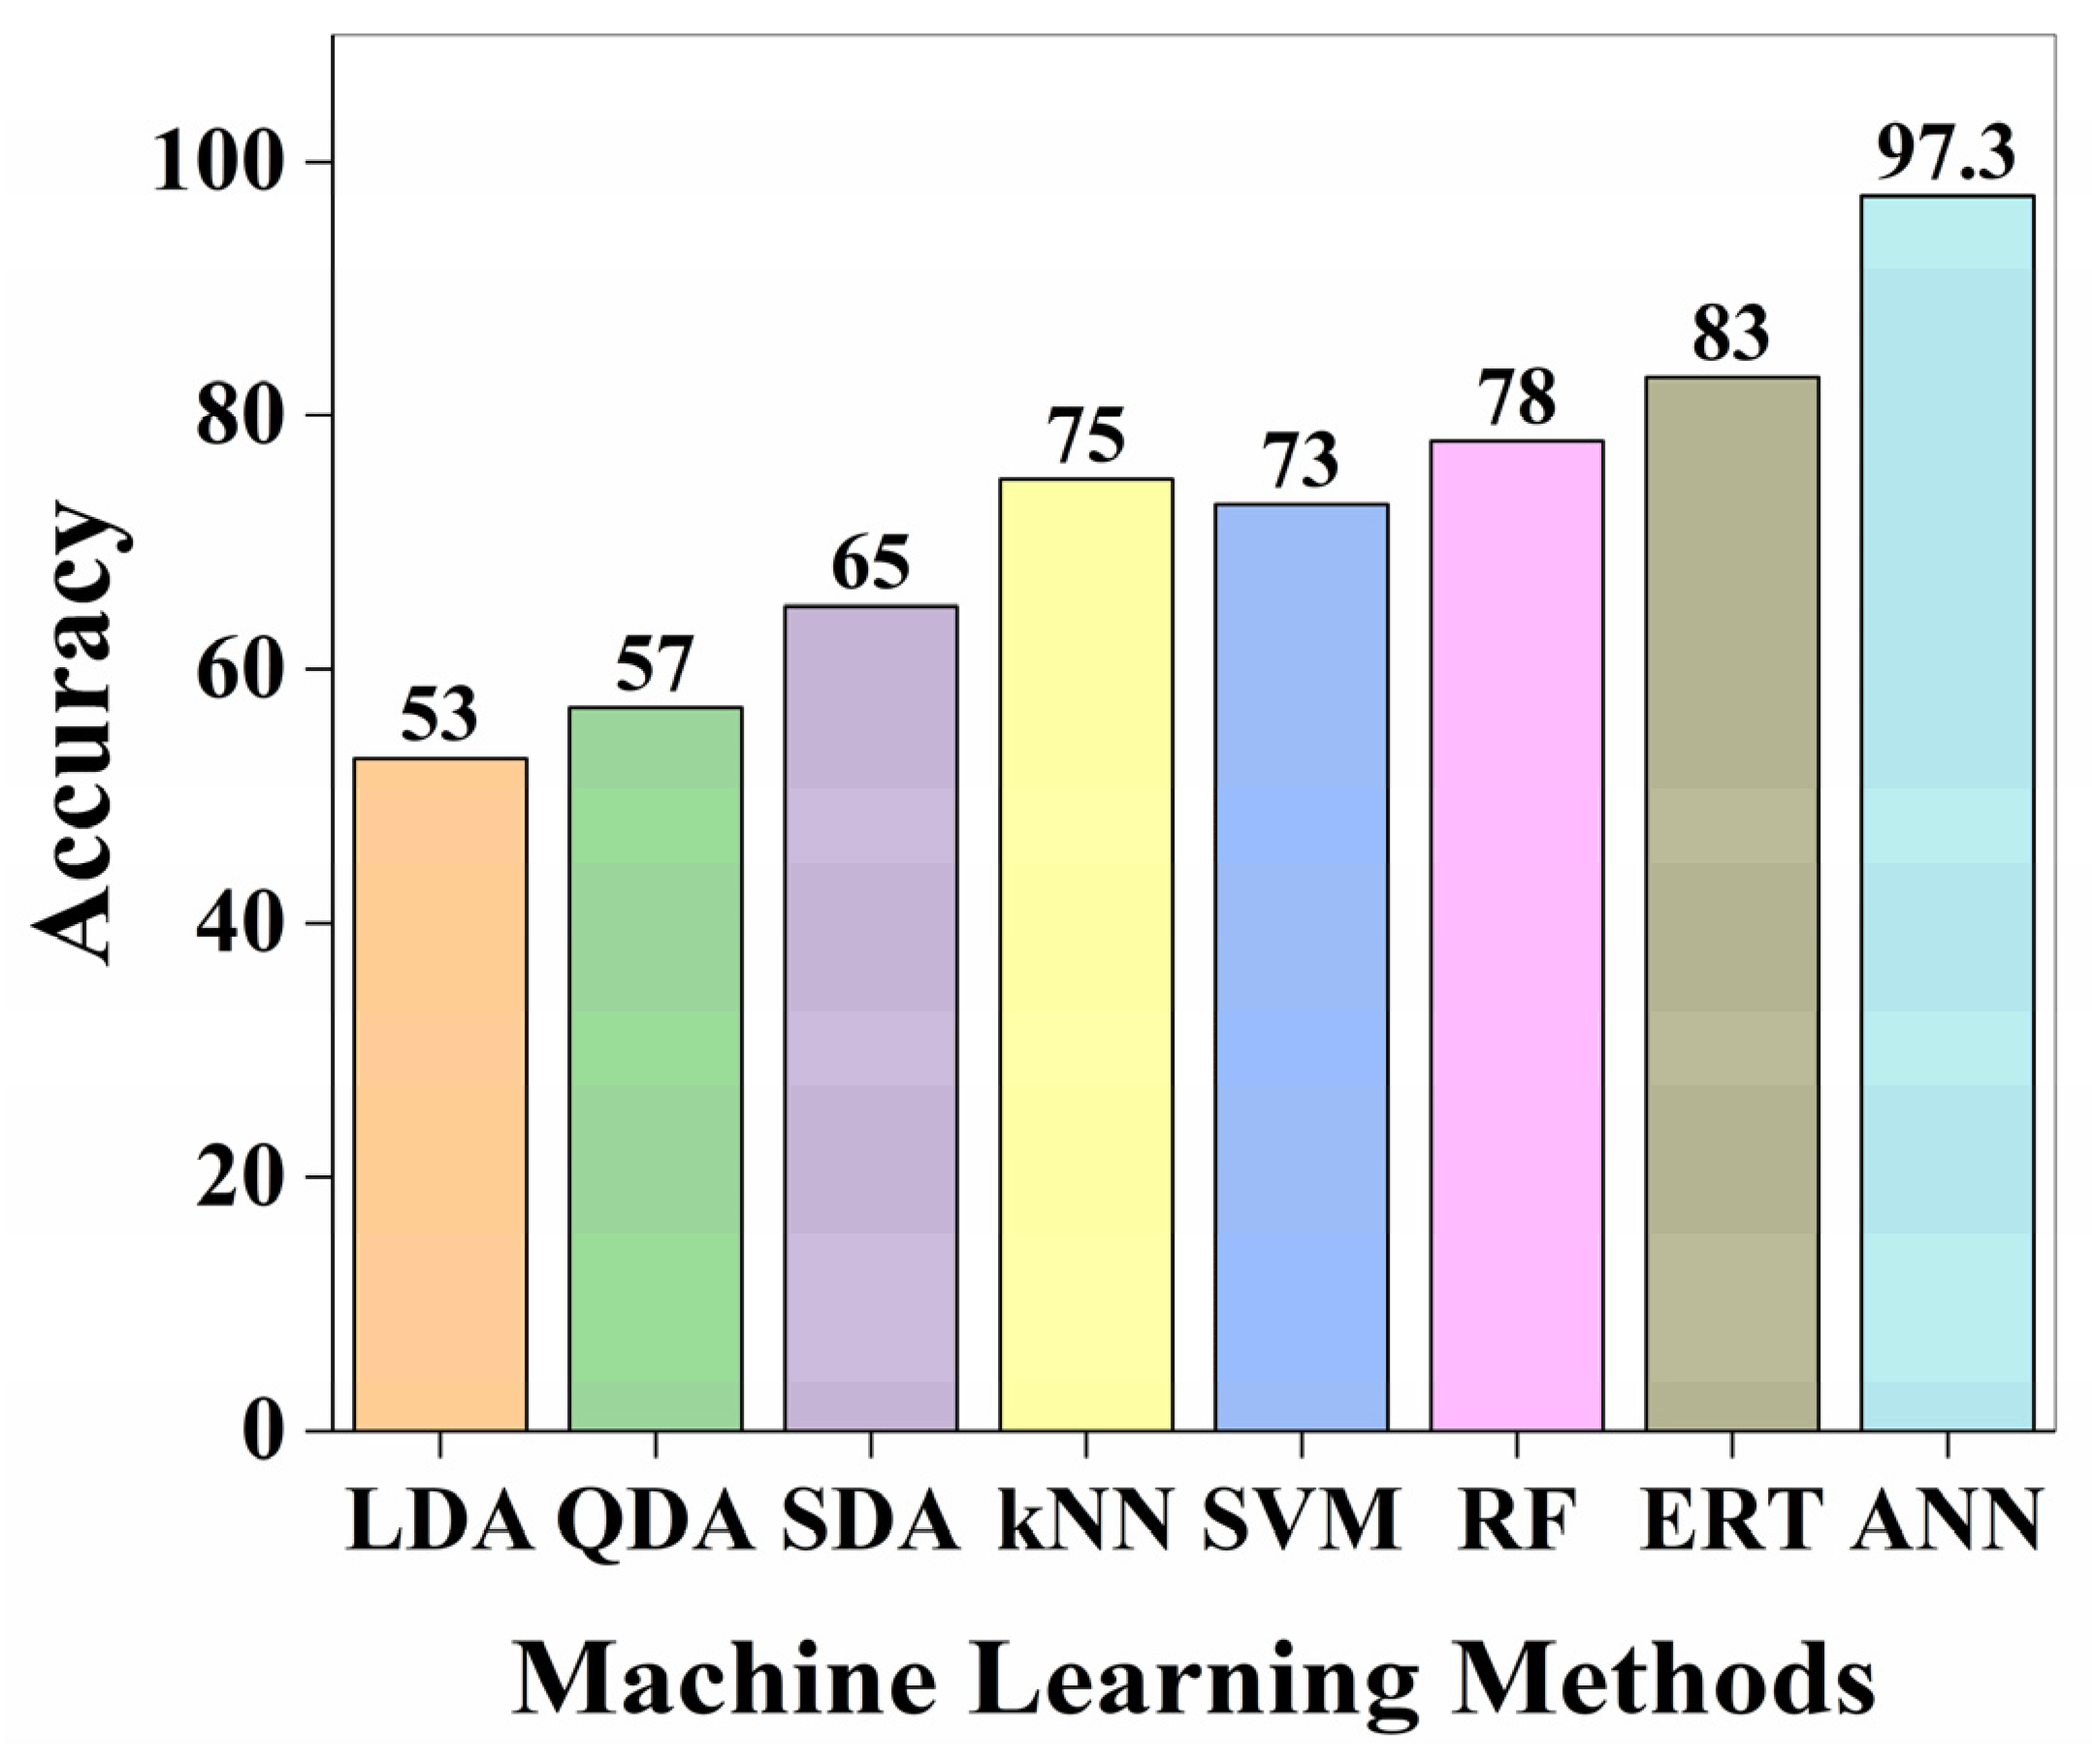
The proposed ANN model achieved an impressive prediction accuracy of 97.3%, as shown in Figure 6, significantly outperforming traditional machine learning methods depicted in the comparative analysis. Meanwhile, models such as k-nearest neighbors (kNN), neural network (NN), random forest (RF), and extremely randomized trees (ERTs) demonstrated respectable accuracy levels ranging from 75% to 83% at 85% training data; the performance of the ANN model highlights its ability to handle complex, nonlinear relationships in the dataset effectively. This high accuracy underscores the robustness and reliability of the 6-22-22-22-1 ANN architecture, optimized with a learning rate of 0.6 and a momentum term of 0.3. The ANN model’s superior classification capability and minimal misclassifications demonstrate its potential as a powerful tool for predicting crystal structures in orthosilicate cathode materials for lithium-ion batteries. Such exceptional performance makes it a valuable resource for accelerating advancements in battery materials research and development.
While the proposed ANN model achieves high accuracy (97.3%) and demonstrates superior capability in capturing nonlinear relationships in the dataset, it also has potential disadvantages, including risks of overfitting and computational complexity. Overfitting occurs when the model memorizes the training data but fails to generalize to new data. Cross-validation was employed during model training to mitigate overfitting and ensure robust performance. Regularization techniques, such as weight decay and dropout, are additional strategies that can be incorporated to enhance model generalization further.
Another challenge is the computational complexity associated with the 6-22-22-22-1 ANN architecture, which demands significant resources for training. However, this is counterbalanced by the model’s ability to effectively handle complex datasets where simpler models like kNN or RF may fall short. Future work will explore the use of ensemble methods and lightweight architectures to reduce computational requirements while maintaining high performance. These considerations present a fair assessment of the model’s advantages and limitations, providing a pathway for its continued refinement and application in material science research.

3.3. Graphical User Interface Design Based on ANN Model Synaptic Weights

As shown in Figure 7, we have developed an intuitive graphical user interface (GUI) powered by a carefully optimized 6-22-22-22-1 ANN model to facilitate crystal structure predictions for the Li–Si–Fe–O system. By leveraging synaptic weights derived from extensive training, the GUI provides users with a straightforward, interactive way to classify crystal structures as monoclinic or orthorhombic. The underlying ANN model, ideal for capturing complex patterns within DFT calculations, allows for precise structure identification, effectively bridging advanced computation with user-friendly application. This tool provides rapid, reliable predictions bypassing computationally demanding methods. Accessible format broadens predictive modeling, enabling researchers to explore the structural tendencies within the Li–Si–Fe–O system efficiently.

3.4. Identification of Feature Importance

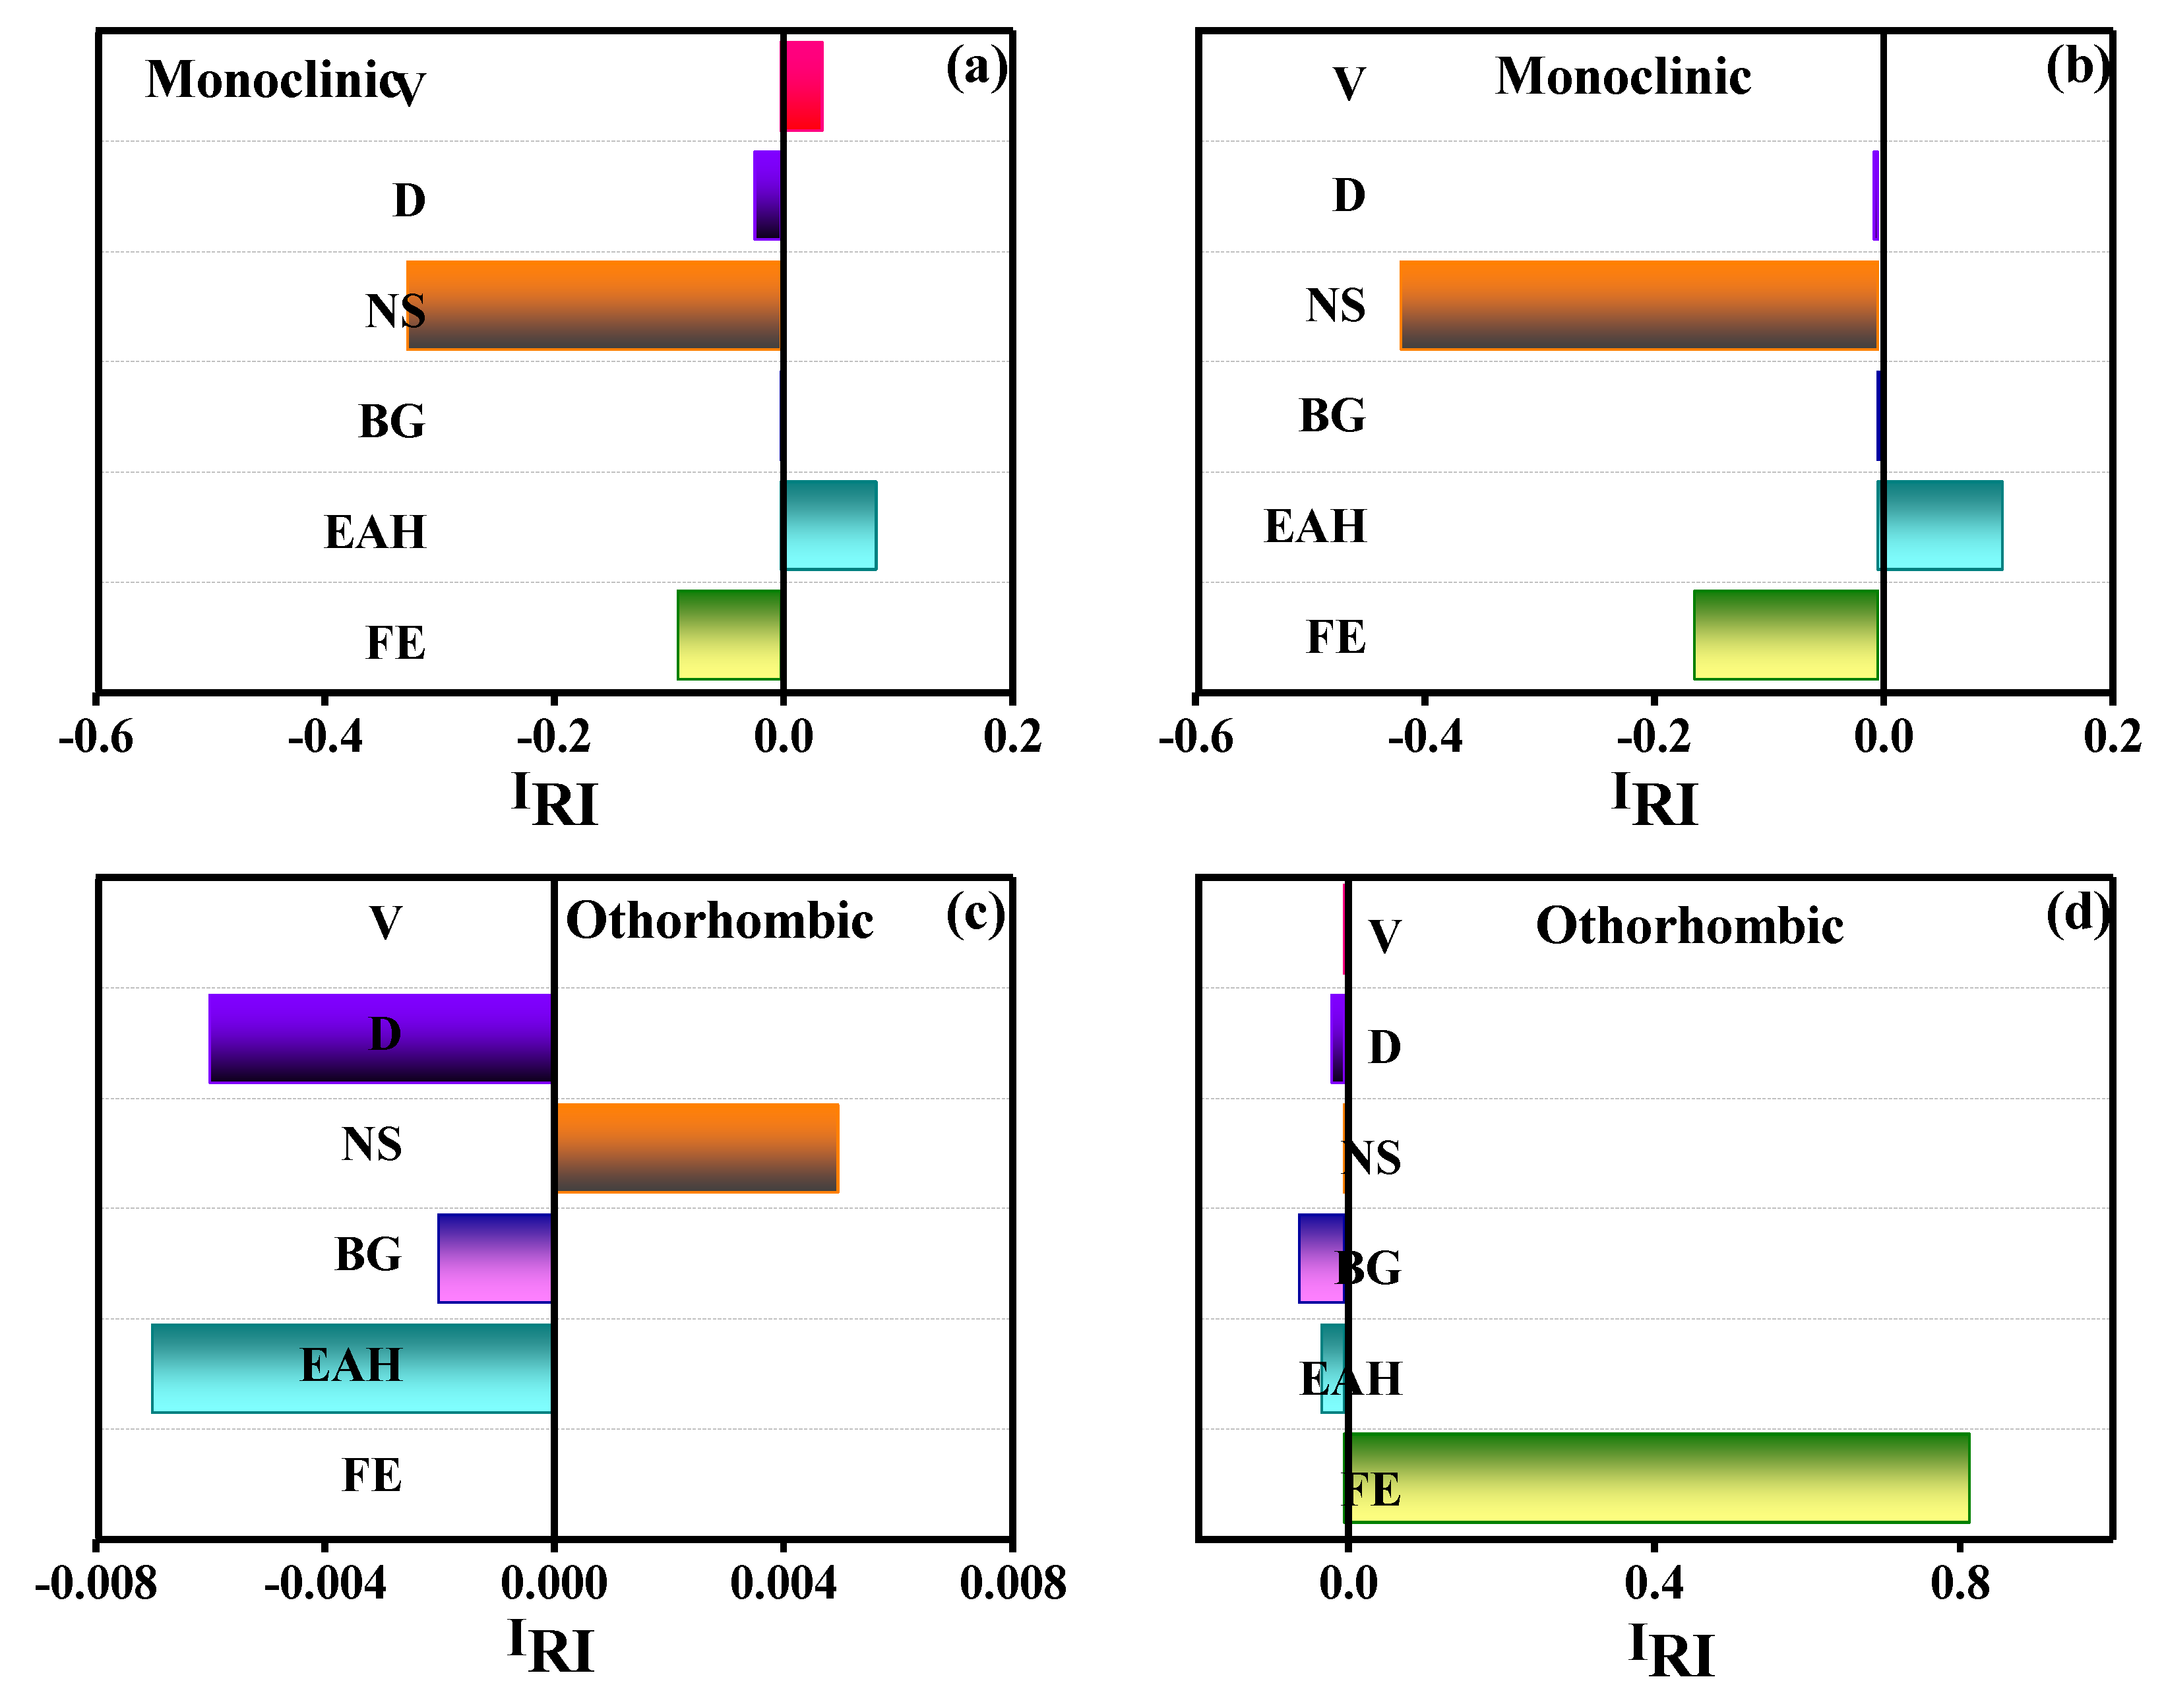
Figure 8 illustrates the Index of Relative Importance (IRI) [15,16] for input variables in predicting crystal structures within the Li–Si–Fe–O system, distinguishing between monoclinic and orthorhombic forms. Each input variable (V, D, NS, Eg, EH, EF) represents a distinct property influencing structural configuration. The IRI values quantify each variable’s influence, highlighting which factors dominate different structures.
Figure 8a presents IRI values for predicting the monoclinic structure, where NS and EF show vital positive contributions essential for identifying monoclinic structures in this system. Figure 8b also pertains to monoclinic classification but under a different condition, where D and EF show notable negative contributions, indicating their inverse relationship with this classification.
Figure 8c displays IRI values for orthorhombic structure predictions in the bottom row. Here, EH and EF contribute notably, though with less consistency in direction than the monoclinic classification. Figure 8d reveals a contrasting condition where EF has an overwhelmingly positive IRI value, suggesting it is the primary determinant for orthorhombic classification in this scenario. Overall, the figure highlights how EF, NS, and EH emerge as highly influential variables, with impacts varying between monoclinic and orthorhombic structures. This insight provides guidance on the critical atomic or electronic characteristics in structural determinations within complex oxide systems.

3.5. Study Limitations and Future Directions

While the ANN model effectively predicted crystal structures with an accuracy of 97.3%, certain limitations require attention. Overfitting remains a potential issue, particularly with complex architectures. Although cross-validation mitigated this, future work could explore regularization techniques to improve generalization. The computational demands of the 6-22-22-22-1 architecture may limit scalability, suggesting the need for lightweight models or ensemble approaches to balance performance and efficiency. Additionally, misclassifications due to overlapping material properties highlight the importance of incorporating additional descriptors, such as interatomic distances or symmetry-specific features, to enhance predictive accuracy. Expanding the dataset and applying the model to other material systems could further improve its applicability and advance the use of machine learning in material science.

4. Conclusions

We utilized an artificial neural network (ANN) model with a 6-22-22-22-1 architecture, optimized for predicting two primary crystal systems (monoclinic and orthorhombic) in orthosilicate cathodes with Li–Si–(Mn, Fe, Co)–O compositions. Our model achieved impressive results with a learning rate of 0.6, a momentum term of 0.3, and 40,000 iterations. Specifically, the ANN attained an accuracy of 97.3% and a Matthews correlation coefficient (MCC) of 0.951, highlighting its predictive solid performance and robustness.
To enhance usability, we developed a GUI that allows researchers to input parameters and obtain rapid predictions for crystal systems. This GUI enables researchers to explore structural configurations efficiently, facilitating quick and reliable crystal system classification.

Supplementary Materials

The following supporting information can be downloaded at: https://www.mdpi.com/article/10.3390/batteries11010013/s1; Table S1: Statistical summary of crystal structure data: minimum, mean, and maximum values; Table S2: The DFT calculated data and ANN-predicted crystal systems for six independent variables.

Author Contributions

Conceptualization, Writing—original draft preparation, M.P.; Conceptualization, Writing—original draft preparation, and modeling, B.R.S.R.; Investigation, K.-K.C.; Project administration and Funding, A.H.-J.; English corrections, review and editing, J.-K.S.; Conceptualization, Supervision, Writing—review and editing, N.G.S.R. All authors have read and agreed to the published version of the manuscript.

Funding

This work was supported by the fund of a research promotion program, Gyeongsang National University, 2024. This research was supported by Basic Science Research Program through the National Research Foundation of Korea(NRF) funded by the Ministry of Education (NRF-2020R1A6A1A03038697).

Data Availability Statement

The original contributions presented in this study are included in the article/Supplementary Material. Further inquiries can be directed to the corresponding authors.

Conflicts of Interest

The authors declare no conflict of interest.

References

  1. Taberna, P.-L.; Mitra, S.; Poizot, P.; Simon, P.; Tarascon, J.-M. High rate capabilities Fe3O4-based Cu nano-architectured electrodes for lithium-ion battery applications. Nat. Mater. 2006, 5, 567. [Google Scholar] [CrossRef] [PubMed]
  2. Gao, H.; Hu, Z.; Zhang, K.; Cheng, F.; Chen, J. Intergrown Li2FeSiO4·LiFePo4–C nanocomposites as high-capacity cathode materials for lithium-ion batteries. Chem. Commun. 2013, 49, 3040–3042. [Google Scholar] [CrossRef]
  3. Jain, A.; Ong, S.P.; Hautier, G.; Chen, W.; Richards, W.D.; Dacek, S.; Cholia, S.; Gunter, D.; Skinner, D.; Ceder, G. Commentary: The materials project: A materials genome approach to accelerating materials innovation. Apl Mater. 2013, 1, 011002. [Google Scholar] [CrossRef]
  4. Dominko, R.; Bele, M.; Gaberšček, M.; Meden, A.; Remškar, M.; Jamnik, J. Structure and electrochemical performance of Li2MnSiO4 and Li2FeSiO4 as potential Li-battery cathode materials. Electrochem. Commun. 2006, 8, 217–222. [Google Scholar] [CrossRef]
  5. Teixeira, R.S.D.; Calili, R.F.; Almeida, M.F.; Louzada, D.R. Recurrent neural networks for estimating the state of health of lithium-ion batteries. Batteries 2024, 10, 111. [Google Scholar] [CrossRef]
  6. Sözen, A.; Arcaklioǧlu, E.; Özalp, M. A new approach to thermodynamic analysis of ejector–absorption cycle: Artificial neural networks. Appl. Therm. Eng. 2003, 23, 937–952. [Google Scholar] [CrossRef]
  7. Wriggers, W.; Milligan, R.A.; McCammon, J.A. Situs: A package for docking crystal structures into low-resolution maps from electron microscopy. J. Struct. Biol. 1999, 125, 185–195. [Google Scholar] [CrossRef] [PubMed]
  8. Wang, Y.; Jiang, B. Attention mechanism-based neural network for prediction of battery cycle life in the presence of missing data. Batteries 2024, 10, 229. [Google Scholar] [CrossRef]
  9. Hautier, G.; Fischer, C.; Ehrlacher, V.; Jain, A.; Ceder, G. Data mined ionic substitutions for the discovery of new compounds. Inorg. Chem. 2010, 50, 656–663. [Google Scholar] [CrossRef]
  10. Zeng, C.; Zheng, R.; Fan, F.; Wang, X.; Tian, G.; Liu, S.; Liu, P.; Wang, C.; Wang, S.; Shu, C. Phase compatible surface engineering to boost the cycling stability of single-crystalline Ni-rich cathode for high energy density lithium-ion batteries. Energy Storage Mater. 2024, 72, 103788. [Google Scholar] [CrossRef]
  11. Fan, F.; Zheng, R.; Zeng, T.; Xu, H.; Wen, X.; Wang, X.; Tian, G.; Wang, S.; Zeng, C.; Xiang, W.; et al. Cation-ordered Ni-rich positive electrode material with superior chemical and structural stability enabled by atomic substitution for lithium-ion batteries. Chem. Eng. J. 2023, 477, 147181. [Google Scholar] [CrossRef]
  12. Zeng, C.; Fan, F.; Zheng, R.; Wang, X.; Tian, G.; Liu, S.; Liu, P.; Wang, C.; Wang, S.; Shu, C. Structure and Charge Regulation Strategy Enabling Superior Cycling Stability of Ni-Rich Cathode Materials. ACS Appl. Mater. Interfaces 2024, 16, 11377–11388. [Google Scholar] [CrossRef] [PubMed]
  13. Kresse, G.; Furthmüller, J. Efficient iterative schemes for ab initio total-energy calculations using a plane-wave basis set. Phys. Rev. B 1996, 54, 11169. [Google Scholar] [CrossRef]
  14. Lippmann, R.P. An introduction to computing with neural nets. IEEE Assp Mag. 1987, 4, 4–22. [Google Scholar] [CrossRef]
  15. Reddy, N.S.; Panigrahi, B.B.; Ho, C.M.; Kim, J.H.; Lee, C.S. Artificial neural network modeling on the relative importance of alloying elements and heat treatment temperature to the stability of α and β phase in titanium alloys. Comput. Mater. Sci. 2015, 107, 175–183. [Google Scholar] [CrossRef]
  16. Reddy, N.S.; Krishnaiah, J.; Young, H.B.; Lee, J.S. Design of medium carbon steels by computational intelligence techniques. Comput. Mater. Sci. 2015, 101, 120–126. [Google Scholar] [CrossRef]
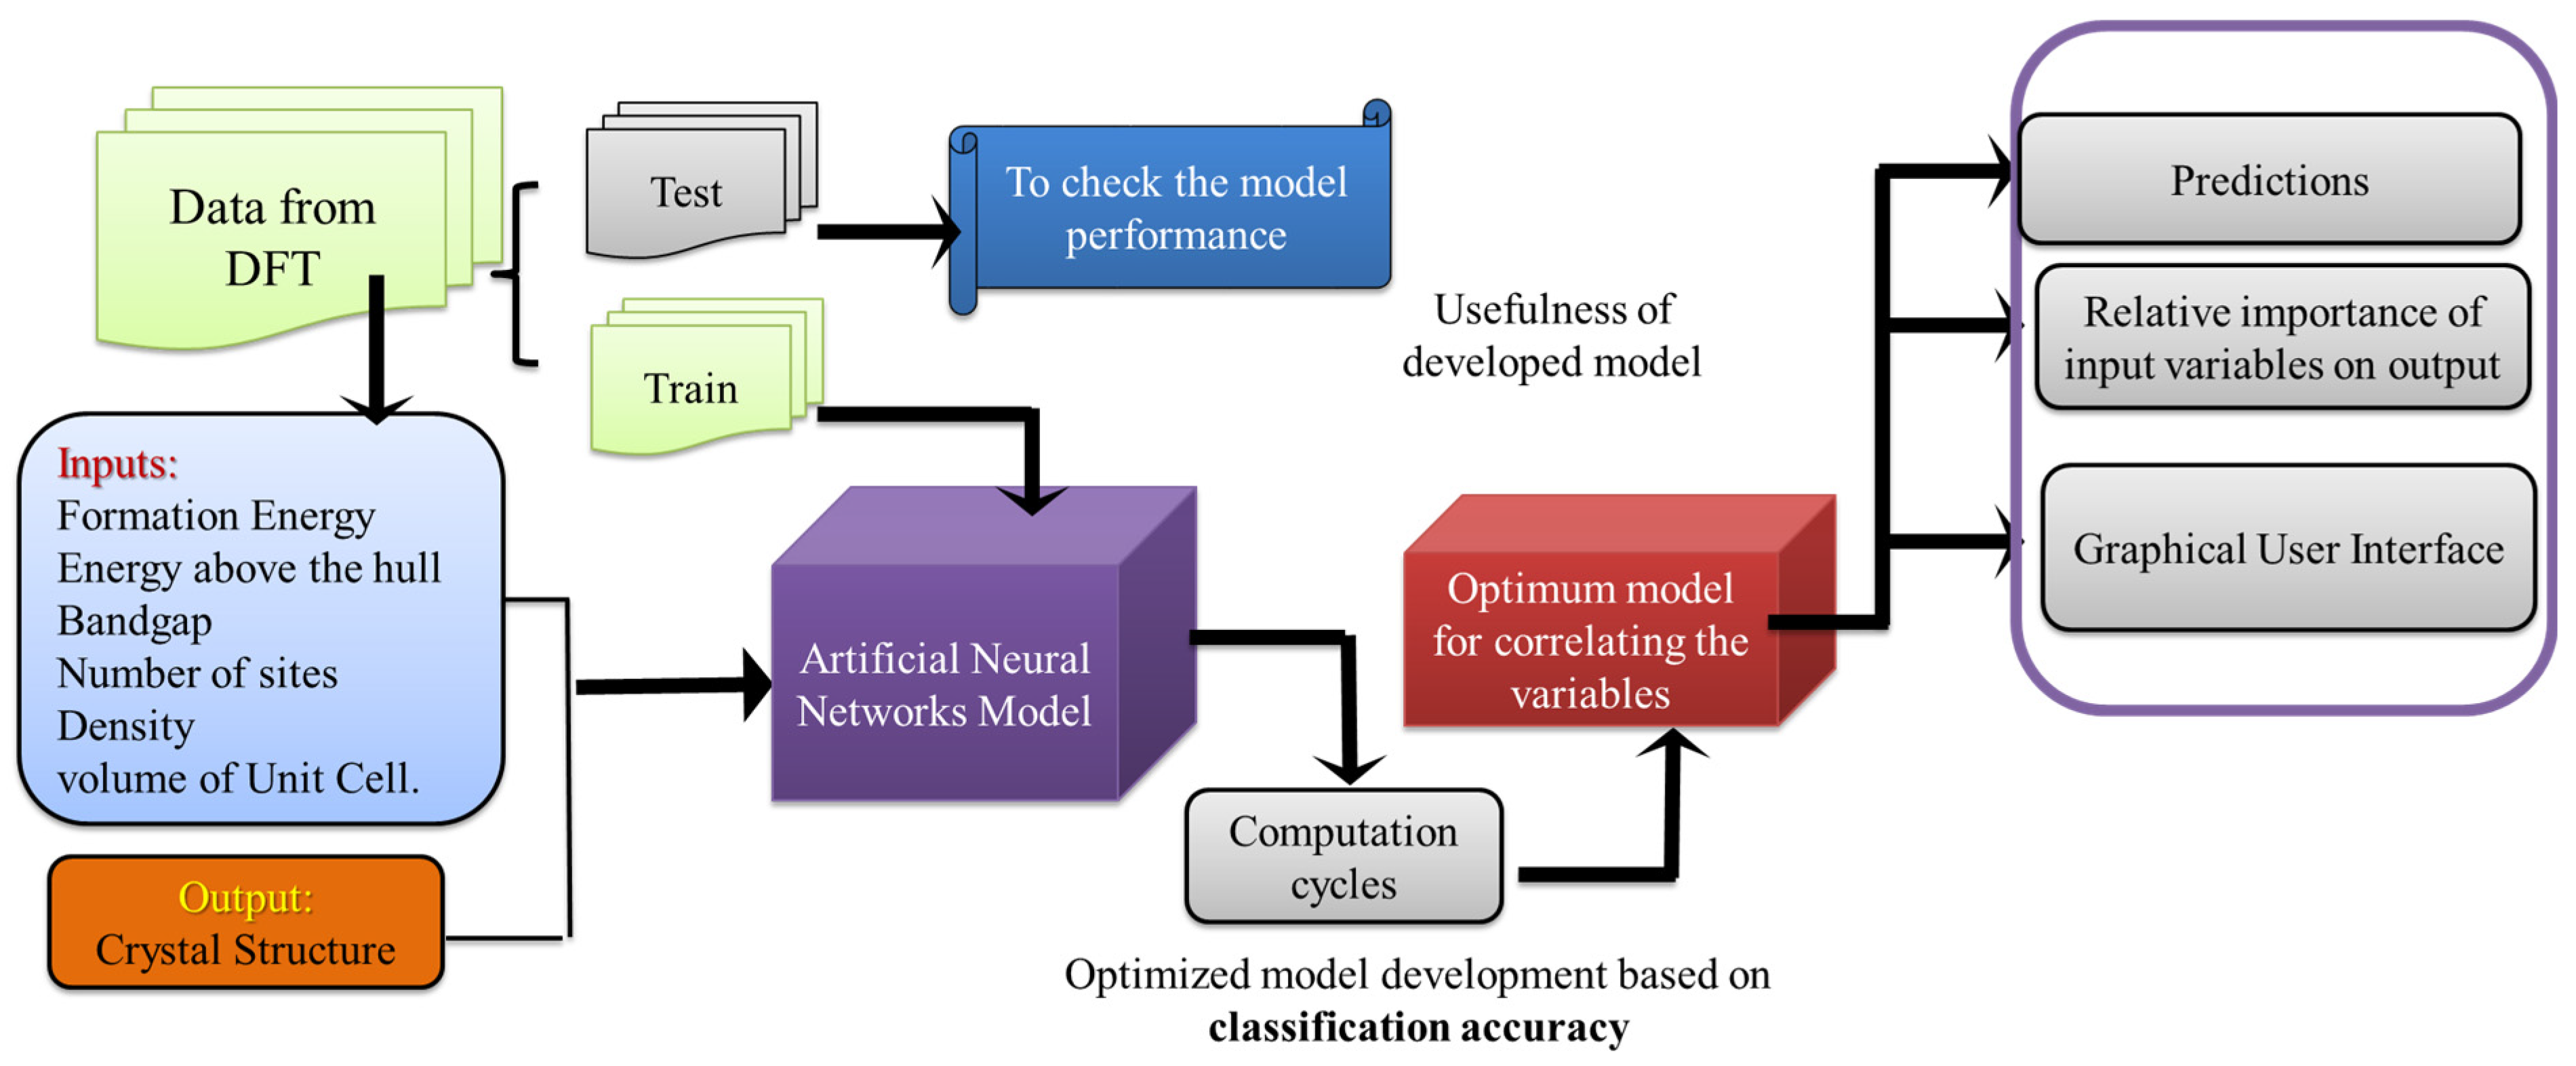
Figure 1. Workflow for predicting crystal structures using machine learning and DFT data.
Batteries 11 00013 g001
Figure 2. Pair plot of lithium cathode properties for Si–(Mn, Fe, Co)–O systems extracted from the Materials Project database.
Batteries 11 00013 g002
Figure 3. The predicted accuracy of the ANN model (a) hidden neurons, (b) momentum term, (c) learning rate, and (d) iterations.
Batteries 11 00013 g003
Figure 4. Weight distribution comparison in ANN model before and after training.
Batteries 11 00013 g004
Figure 5. (ad) Prediction of the class of crystal systems.
Batteries 11 00013 g005
Figure 6. Comparison of accuracies with published literature [3].
Batteries 11 00013 g006
Figure 7. The screenshots of ANN software for the prediction process of crystal structure.
Batteries 11 00013 g007
Figure 8. (ad) The relative importance of variables in the monoclinic and orthorhombic predictions.
Batteries 11 00013 g008
Table 1. The testing data of the crystal systems with the cathode formula and space group.
S. No.FormulaSpace GroupExperimentalAnn Predicted
1Li2MnSiO4PcmnOrthorhombicOrthorhombic
2Li2MnSiO4PmnbOrthorhombicOrthorhombic
3LiMn(SiO3)2PbcaOrthorhombicOrthorhombic
4LiMnSiO4Pna21OrthorhombicOrthorhombic
5Li2MnSiO4Pca21MonoclinicOrthorhombic
6Li4Mn2Si4O13Pna21OrthorhombicOrthorhombic
7Li2Mn2(SiO3)3PnmaOrthorhombicOrthorhombic
8LiMnSiO4ImmaOrthorhombicOrthorhombic
9Li2FeSiO4PcmnOrthorhombicOrthorhombic
10Li2CoSiO4PcmnOrthorhombicOrthorhombic
11Li2CoSiO4C2221OrthorhombicOrthorhombic
12LiCoSiO4P212121MonoclinicOrthorhombic
13LiCoSiO4ImcmOrthorhombicOrthorhombic
14LiMnSiO4Pna21MonoclinicOrthorhombic
15Li2Co2Si2O7C2cmOrthorhombicOrthorhombic
16LiCoSiO4Pb21aOrthorhombicOrthorhombic
17Li2CoSiO4Pca21OrthorhombicOrthorhombic
18Li3CoSiO5P21nbOrthorhombicOrthorhombic
19LiCoSiO4CmcmOrthorhombicOrthorhombic
20Li2MnSiO4P21/cMonoclinicMonoclinic
21Li4MnSi2O7CcMonoclinicMonoclinic
22Li4Mn2Si3O10C2/cMonoclinicMonoclinic
23Li2Mn3Si3O10C2/cMonoclinicMonoclinic
24Li4MnSi2O7C2MonoclinicMonoclinic
25LiMnSiO4P21MonoclinicMonoclinic
26Li2MnSiO4P21/cMonoclinicMonoclinic
27LiMn(SiO3)2C2/cMonoclinicMonoclinic
28Li2Mn(SiO3)2CcMonoclinicMonoclinic
29Li2MnSiO4P21/cMonoclinicMonoclinic
30Li2Mn(SiO3)2C2/cMonoclinicMonoclinic
31Li2Mn2Si2O7P21/cMonoclinicMonoclinic
32Li10Mn(SiO5)2C2/mMonoclinicMonoclinic
33Li3MnSi2O7P21OrthorhombicMonoclinic
34Li5Mn(SiO4)2C2OrthorhombicMonoclinic
35Li2Mn(Si2O5)2P21/cOrthorhombicMonoclinic
36Li2Mn2Si3O10CcMonoclinicMonoclinic
37Li2Mn2(SiO3)3P21/cMonoclinicMonoclinic
38LiMn(SiO3)2C2/cMonoclinicMonoclinic
39Li2MnSi3O8P21OrthorhombicMonoclinic
40Li3Mn2(SiO4)2P21MonoclinicMonoclinic
Table 2. The misclassified data from the total datasets and input values of the crystal system.
S. No.EfEHEgNsVDExpANN
241−2.620.0053.027163.073174.86201
242−2.6190.0073.407323.005357.64801
243−2.610.0123.026282.852360.72601
247−2.8870.043.144522.69679.1001
253−2.650.0542.582642.8763.32410
261−2.2910.1440.511144.15126.39510
263−2.4530.0722.84263.579278.30410
Table 3. Confusion matrix for ANN predicted, and DFT calculated data.
n = 267Actual Value
ANN model prediction135 TPs4 FNs139
3 FPs125 TNs128
138129267
Disclaimer/Publisher’s Note: The statements, opinions and data contained in all publications are solely those of the individual author(s) and contributor(s) and not of MDPI and/or the editor(s). MDPI and/or the editor(s) disclaim responsibility for any injury to people or property resulting from any ideas, methods, instructions or products referred to in the content.