Article

Experiment-Based Determination of Optimal Parameters in Constant Temperature–Constant Voltage Charging Technique for Lithium-Ion Batteries Using Taguchi Method

1
Department of Electrical Engineering, National Taiwan Ocean University, Keelung 202, Taiwan
2
Department of Automation Engineering, National Formosa University, Huwei 632, Taiwan
*
Author to whom correspondence should be addressed.
Batteries 2024, 10(6), 211; https://doi.org/10.3390/batteries10060211
Submission received: 25 April 2024 / Revised: 6 June 2024 / Accepted: 15 June 2024 / Published: 18 June 2024

Abstract

:
Charging methods significantly affect the performance and lifespan of lithium-ion batteries. Investigating charging techniques is crucial for optimizing the charging time, charging efficiency, and cycle life of the battery cells. This study introduces a real-time charging monitoring platform based on LabVIEW, enabling observation of battery parameters such as voltage, current, and temperature. The proposed system allows the precise control of charging parameters via a user-friendly interface. Utilizing a programmable DC power supply, it delivers specific charging waveforms, while data acquisition instruments record temperature changes. Key performance metrics, including charging time, efficiency, and temperature rise, are analyzed. Moreover, this paper conducts in-depth research on the constant temperature–constant voltage (CT-CV) charging technique and applies the Taguchi method to identify key parameter configurations that achieve the objectives of the shortest charging time, highest charging efficiency, and lowest average temperature rise. A comprehensive evaluation compares the optimized CT-CV method with conventional constant current–constant voltage (CC-CV) charging. The results demonstrate a 10.7% reduction in charging time compared to the 1C CC-CV method, indicating the efficacy of CT-CV in shortening charging duration while managing temperature rise.

Graphical Abstract

1. Introduction

Due to concerns about greenhouse gas emissions and global warming, governments worldwide are actively promoting policies aimed at achieving net-zero emissions, not only in the energy sector but also in transportation [1,2]. Among these initiatives, electric vehicles have garnered significant attention. Lithium-ion batteries, known for their high energy density and lack of memory effect, are widely used in electric vehicles as the primary power source [3]. It is important to note that the charging method of lithium-ion batteries directly impacts their charging time, efficiency, and overall lifespan [4]. To enhance lithium-ion batteries in the electric vehicle market, this paper intends to conduct an in-depth investigation into lithium-ion battery charging methods.
Basically, the constant current–constant voltage (CC-CV) charging method is the most widely adopted practice for lithium-ion batteries. The magnitude of the current in the CC mode and the internal resistance have a direct impact on the charging time and temperature rise [5]. With the high C-rates in the constant current mode, the charging time can be conserved, but the severe electrochemical reactions result in serious power loss and present a 3–7 °C temperature rise. On the other hand, the constant voltage mode of the CC-CV method of charging exhibits a current profile that gradually decreases, resembling a series of downward steps. This approach, to some degree, is similar to multi-stage constant current (MSCC) charging, which removes the necessity for output voltage control functionality in the charger’s power electronics. Through different optimization techniques, the magnitude and duration of each step in MSCC charging can be fine-tuned for optimal performance tailored to each cell or battery pack.
Therefore, to enhance the charging performance of lithium-ion batteries, many studies have investigated the charging strategies from typical CC-CV or MSCC charging methods to extensive or optimized approaches [6,7,8,9]. For example, ref. [6] utilized an electrical equivalent circuit model in conjunction with a temperature model and computational optimal control techniques to establish charging profiles that minimize charging time for a lithium-ion battery. Likewise, with direct collocation methods for optimal control, ref. [7] employed a simplified single-particle electrochemical model to determine a fast-charging profile for a lithium-ion battery. Both refs. [6] and [7] provided a solution to the battery’s fast-charging problem, which resembled the CC-CV charging protocol. For the optimization of the MSCC charging method, a charging method using a multi-stage constant current based on SOC is proposed in [8], and then the charging time, charging capacity, and temperature increase in the battery are optimized by a multi-objective particle swarm optimization (MOPSO) algorithm. Similarly, ref. [9] employed five bio-inspired optimization algorithms to find the optimal charging current profile for the MSCC charging method to ensure advantages such as rapid charging speed and high charging efficiency.
Apart from the long-term closed-loop charging protocols, i.e., the optimized charging method based on the CC-CV or MSCC method, a charging technique that can close the loop in shorter time frames, while using instantaneous cell voltage and/or temperature to modulate the charging current magnitude, i.e., the constant temperature–constant voltage (CT-CV) method, has attracted a lot of attention. For instance, ref. [10] introduced a closed-loop CT-CV method and validated its effectiveness in simultaneously shortening charging time and controlling temperature rise. In brief, the CT-CV charging method proposed in [10] uses the required time to reach the highest temperature to determine whether the charging process enters the constant temperature mode. Once this time is reached, the battery reaches its highest temperature and the charging current decreases by adjusting the output current using a PID controller to stabilize the battery temperature at the desired level. Until the terminal voltage reaches 4.2 V, the charging procedure would transit from the constant temperature mode to the constant voltage mode. The superior performances presented by [10] have attracted more attention to investigating the CT-CV methods. For example, ref. [11] also demonstrated a closed-loop CT-CV method and applied a particle swarm optimization (PSO) algorithm to determine the parameters of the PID controller to regulate the magnitude of the charging current. However, only simulation results were obtained and discussed. Similarly, ref. [12] focused on the CT-CV method and further optimized the transition time of each segment to achieve the minimum energy loss. But an equivalent circuit model of the investigated cell has to be ready in advance for optimization, which places some restrictions on the measuring equipment and parameterization process. Although both refs. [11] and [12] are based on the closed-loop CT-CV method and they attempt to improve the conventional CT-CV method, there is still a lack of detailed investigation into the parameters in the CT-CV method. Namely, how to determine the key parameters in the CT-CV method remains a problem.
To the best of our knowledge, regardless of the aforementioned optimized charging methods where the prior knowledge of the battery equivalent model or parameters is necessary, further investigation or optimization of the CT-CV method is rarely considered. In particular, temperature plays a major role in the electrochemical and mechanical degradation mechanisms of lithium-ion cells. The application of the CT-CV method shows its advantages in striking a balance between charging time and temperature rise.
This study firstly establishes a LabVIEW-based charging platform to easily implement different charging methods. The proposed system features a user-friendly control interface and high flexibility in configuring charging coefficients. Moreover, it is able to collect crucial data and thus displays important performance indicators, such as charging time, charging efficiency, maximum temperature rise, and average temperature rise for evaluation. With the proposed experimental platform, the focus is on the investigation of the CT-CV charging method. Initially, three trial cases of CT-CV methods were presented by enumeration to exhibit the effect of key parameters on the charging performance at the initial stage. Additionally, the Taguchi method is employed for the CT-CV charging method to obtain the optimal parameter settings, aiming to achieve the goals of the shortest charging time, highest charging efficiency, and lowest average temperature rise. Finally, various charging methods are comprehensively evaluated and discussed to explore their strengths and weaknesses. The highlights of this study are as follows:
(1)
Development of a charging test platform: A charging test platform is developed based on LabVIEW software version 2018, enabling easy setting of the charging parameters and monitoring of the charging process;
(2)
Investigation of the CT-CV charging method: Three trial cases of CT-CV methods are implemented by enumeration to exhibit the effect of key parameters on the charging performance at the initial stage;
(3)
Demonstration of the application of the Taguchi method on CT-CV optimization: The Taguchi method is used to find the optimal configurations of the CT-CV method. The results show that the optimized CT-CV method is able to maintain similar temperature rise and charging efficiency and achieve shorter charging time;
(4)
Comprehensive comparisons and discussion of the investigated charging methods: The results of the charging performances are revealed and discussed. This provides a clear overview when designing a CT-CV method.
In conclusion, this paper contributes to the study of charging methods for lithium-ion batteries and the development of charging test platforms, which is significant for further enhancement of the application of lithium-ion batteries.

2. Experimental Setup and Investigated Charging Strategies

2.1. Experimental Setup

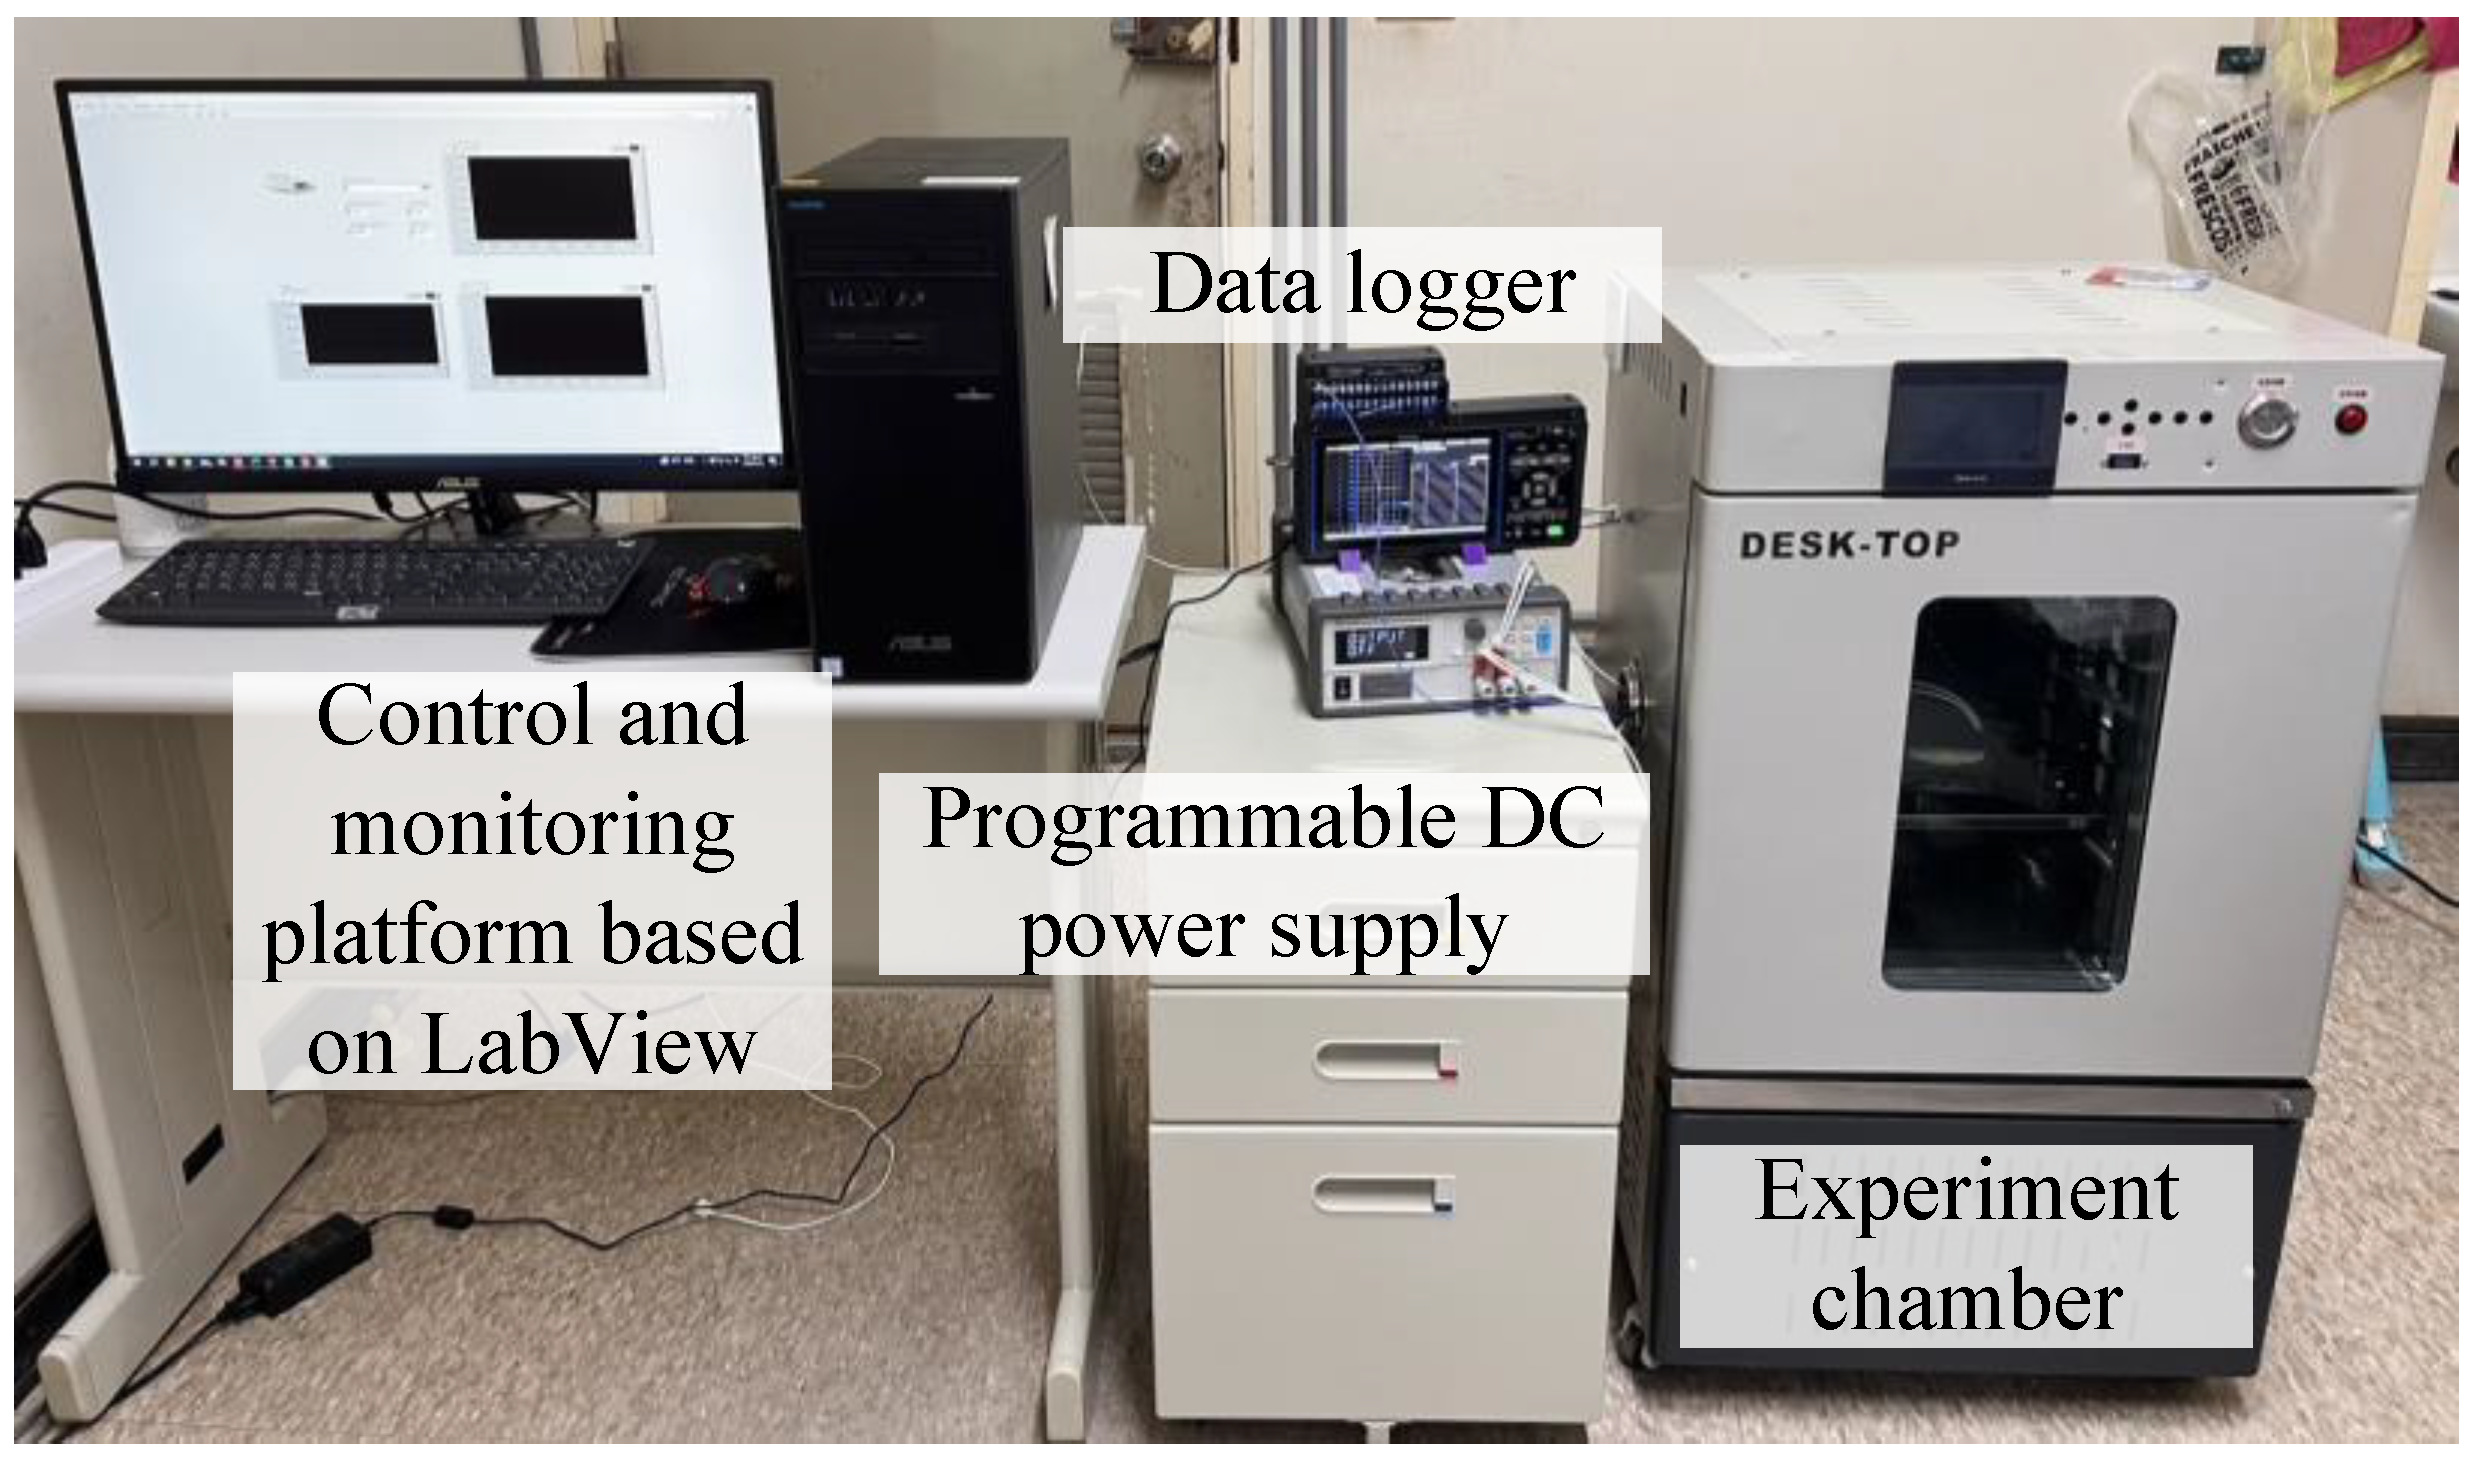
This paper has implemented a battery charging test bench to efficiently implement a variety of charging strategies and observe the corresponding evaluation metrics. To ensure a stable environmental temperature, the battery cell under test is placed in the temperature chamber at a constant 22 °C. The block diagram of the proposed experimental system is shown in Figure 1. To rapidly implement different charging configurations, a friendly human interface is realized by LabVIEW on a PC so that the operators can use it intuitively and efficiently [13,14]. A programmable DC power supply 62010L from Chroma corporation is controlled via USB with the LabVIEW software on PC, which enables the configurations or monitoring of voltage and current. On the other hand, a data logger LR8450 from the HIOKI corporation is employed to collect temperature data. Through the proposed battery charging system, all of the key indicators, i.e., voltage, current, and temperature, are instantaneously displayed on the LabVIEW user interface, and the configuration of the charging strategy can also be easily configured from the PC. After the battery cell is fully charged, it is discharged with a battery cycler until the discharge voltage reaches its lower limit. The specification of the investigated battery cell is given in Table 1.

2.2. CT-CV Charging Strategies

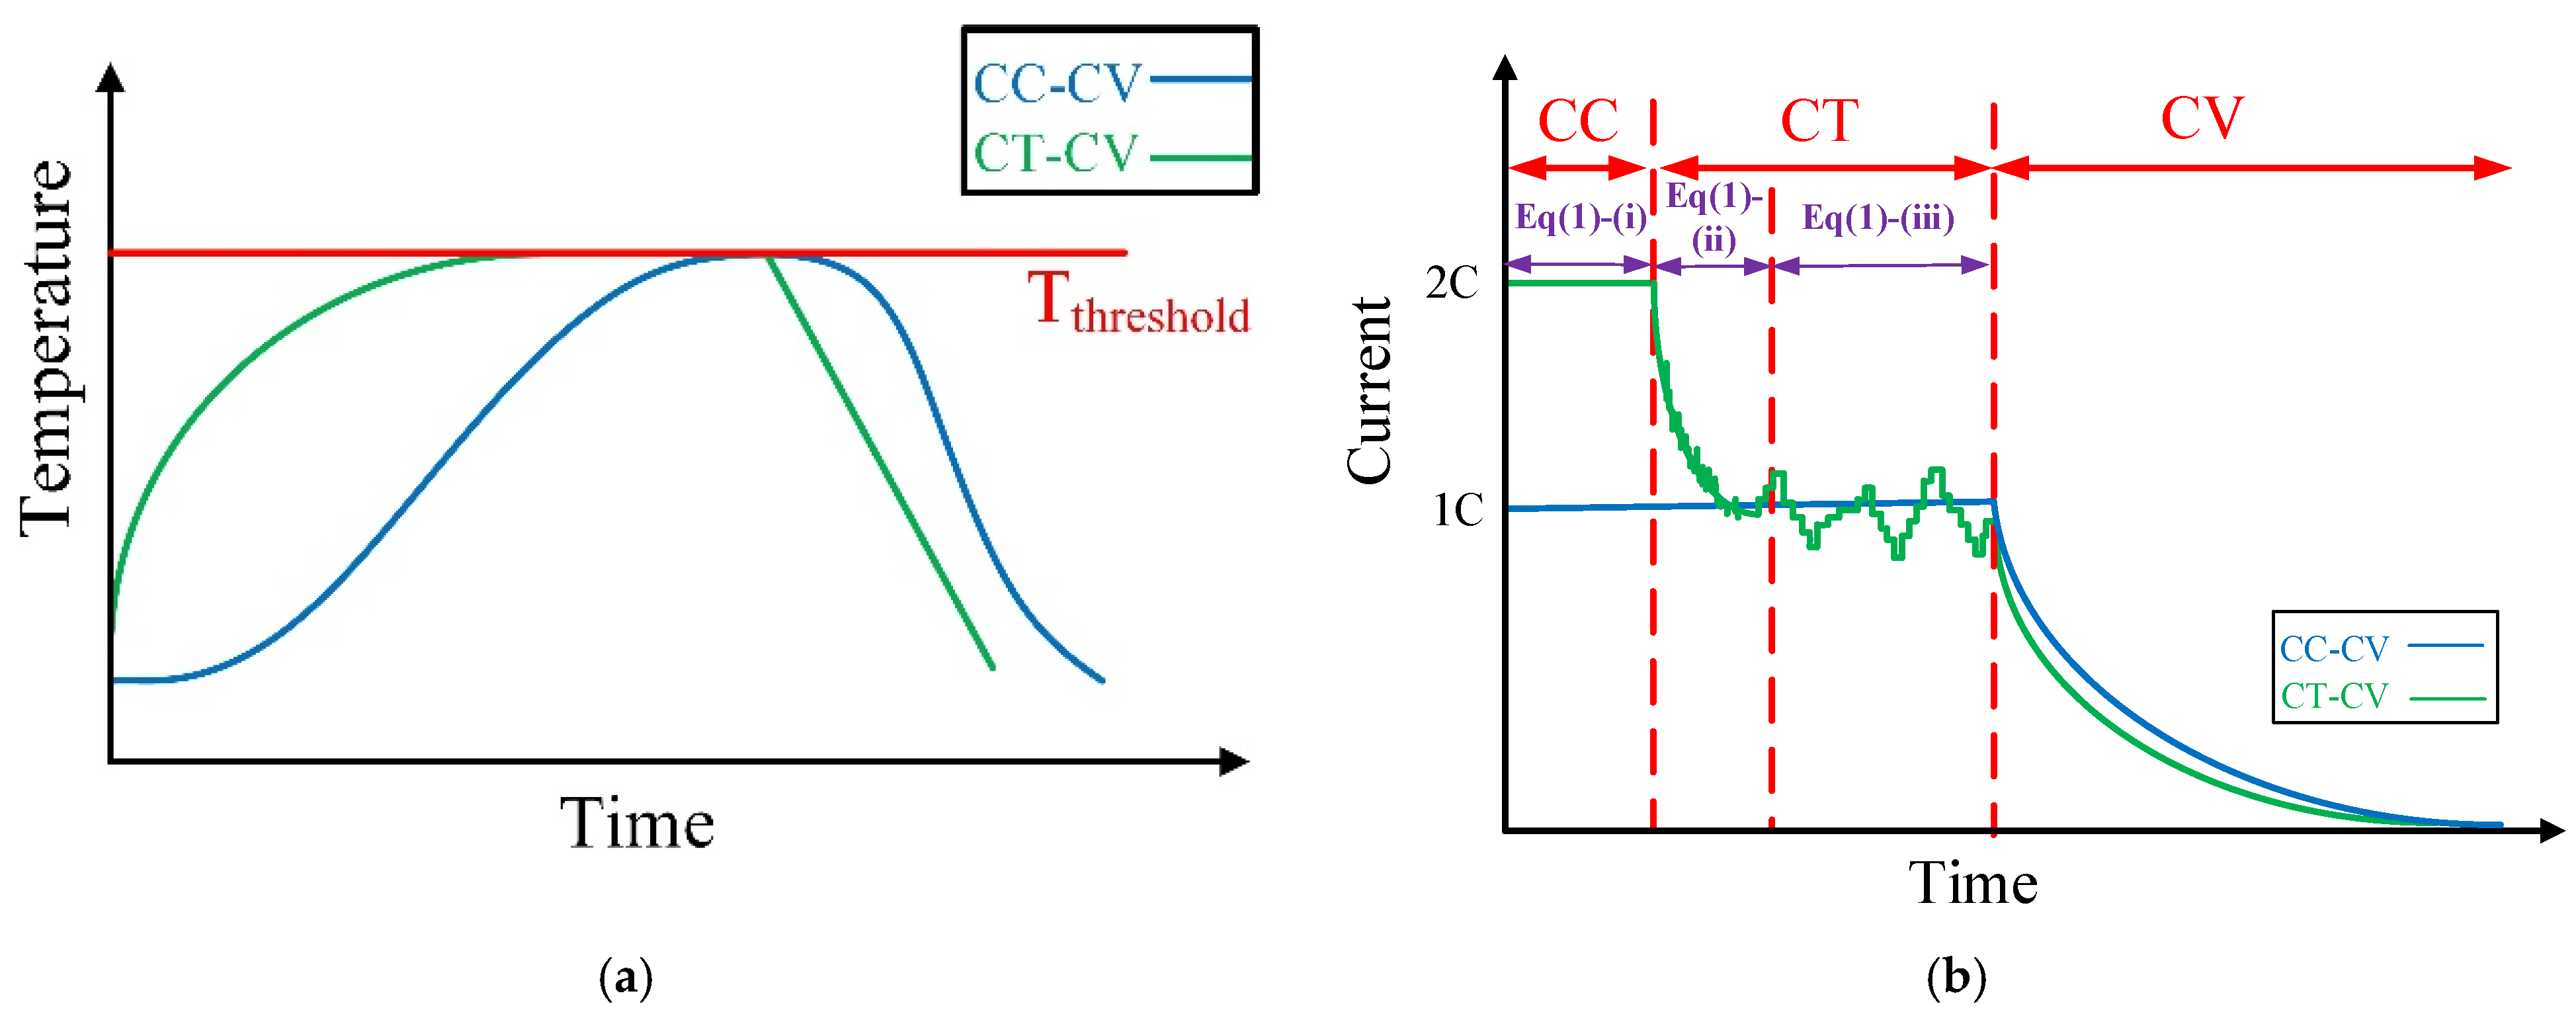
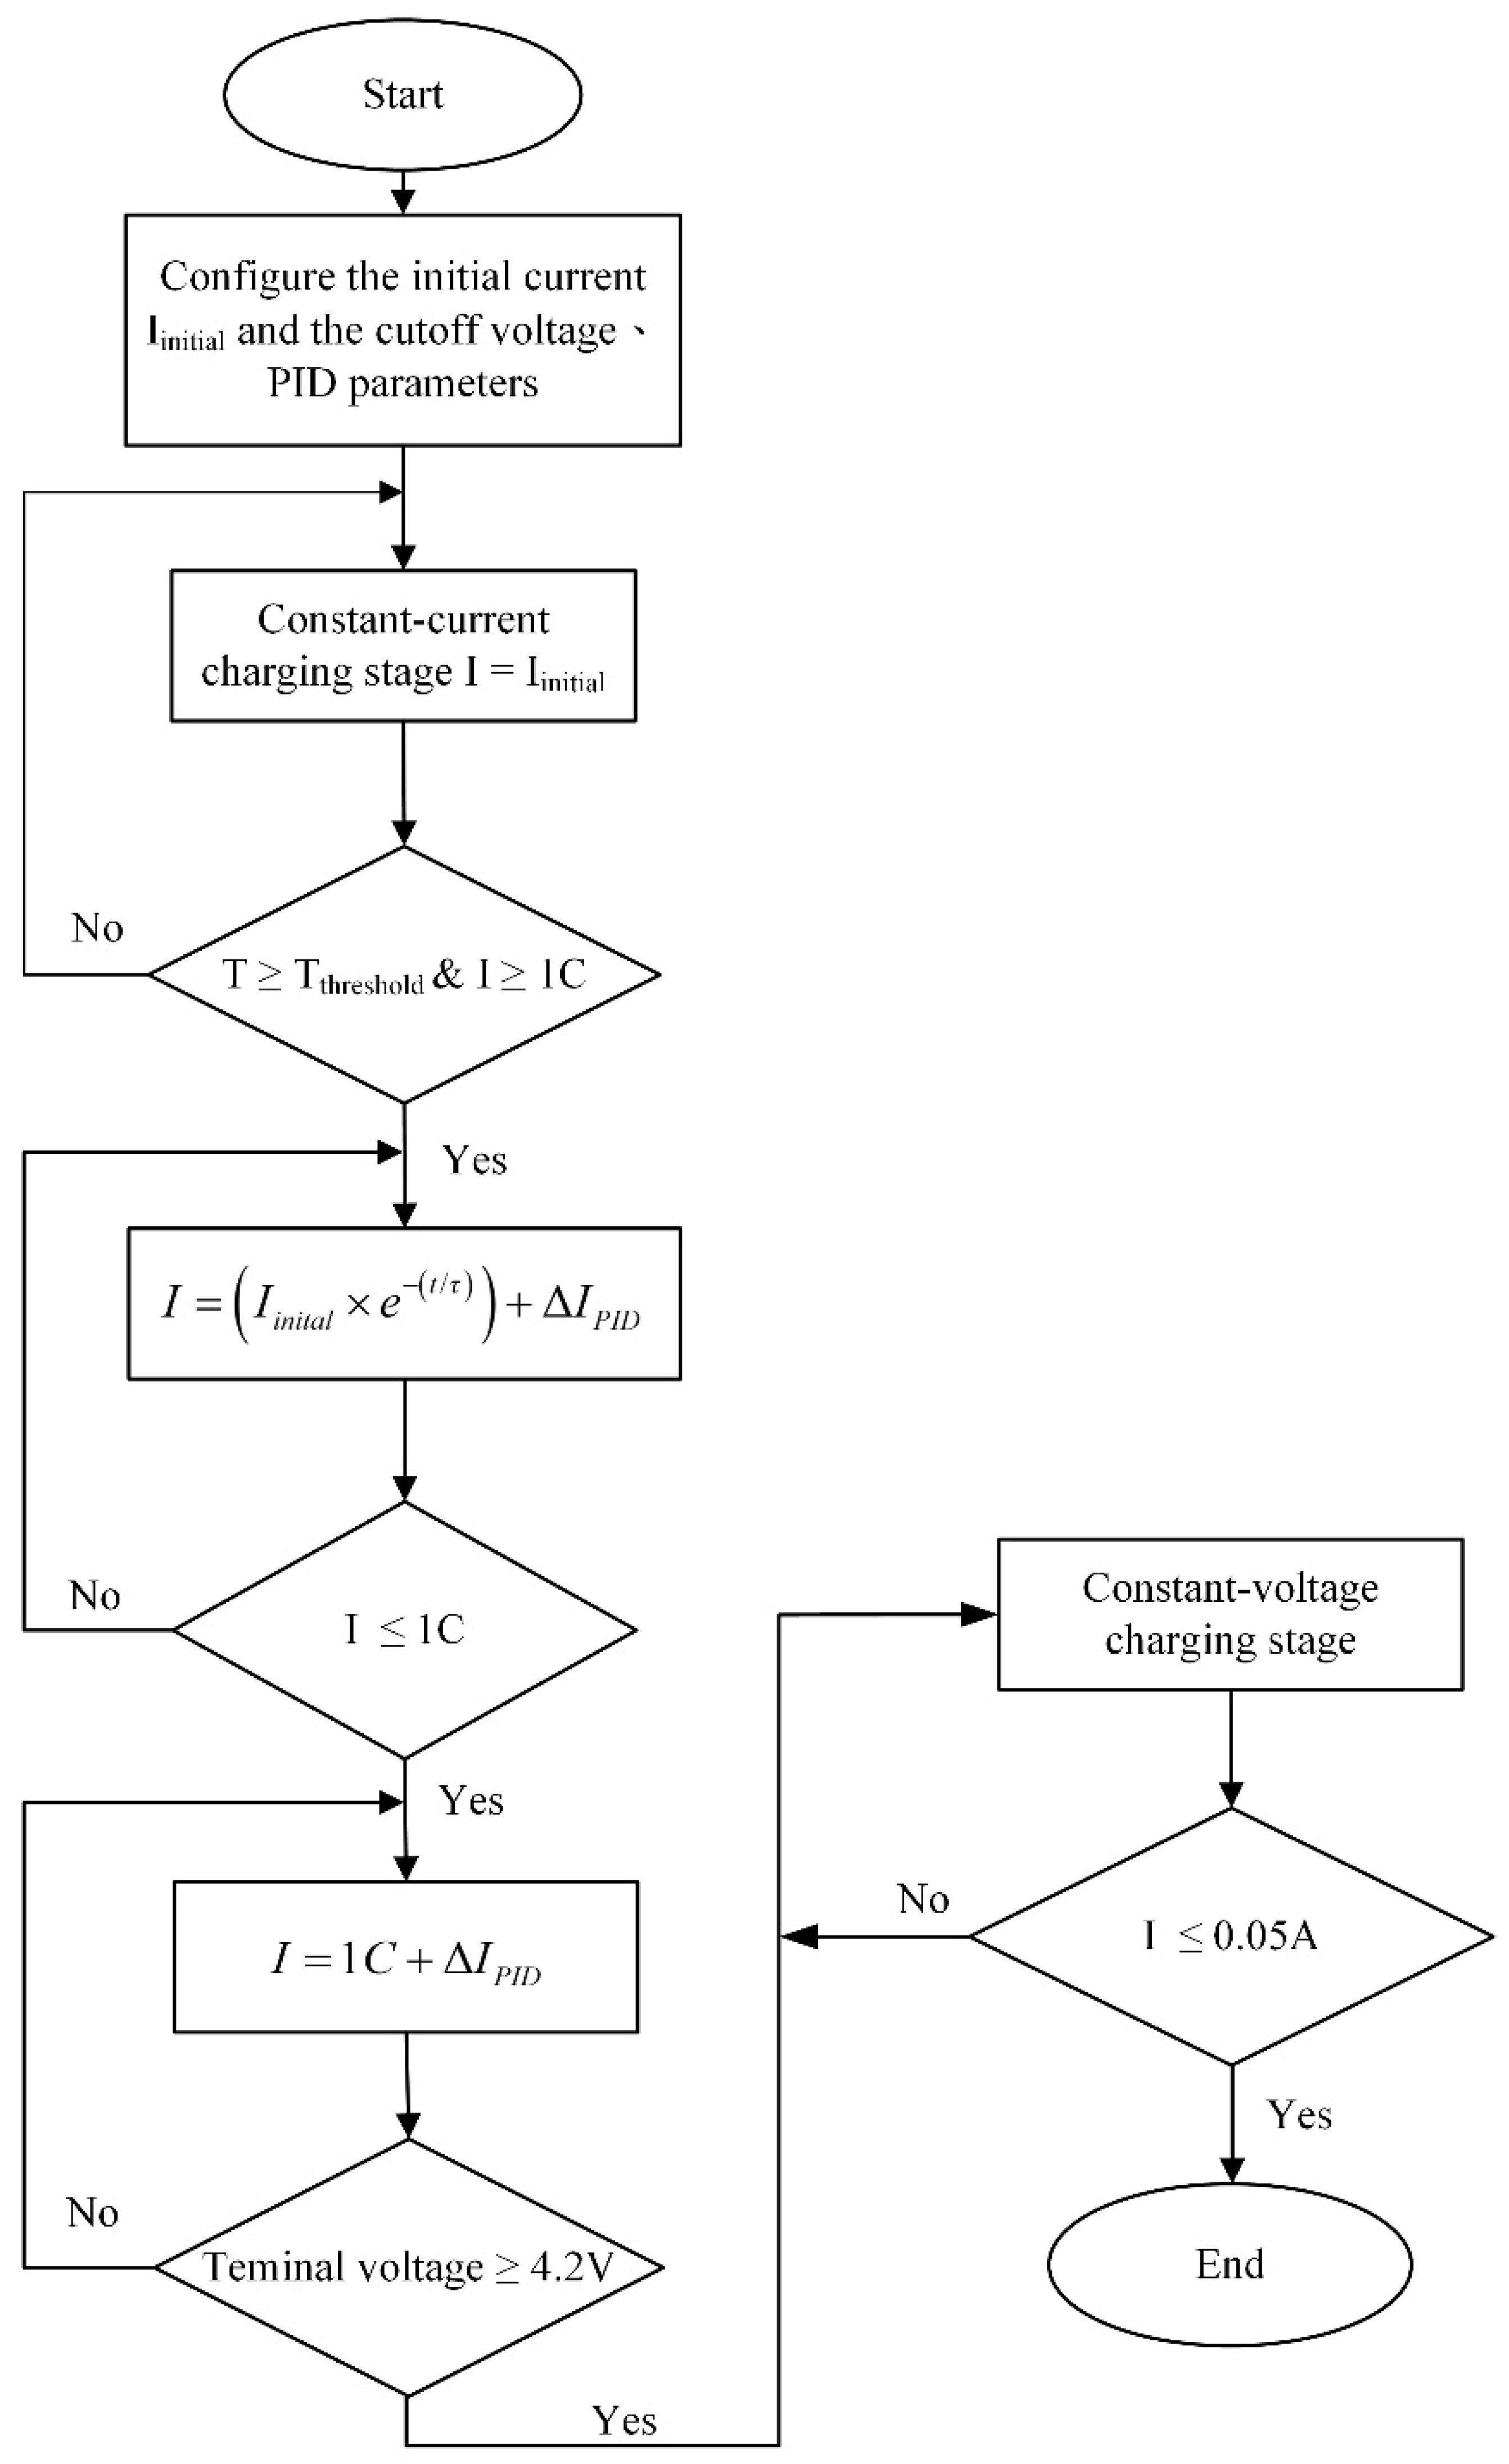
The CT-CV charging strategy is composed of three parts, namely, the constant current section, the constant temperature section, and the constant voltage section. Prior to the introduction of the CT-CV method, a 1C CC-CV method is shown in Figure 2, where the maximum temperature is 24.3 °C. The concept of the CT-CV method is to keep the maximum temperature rise the same while shortening the charging time with a larger charging current at the beginning stage of the charging process. As shown in Figure 2, the first section of the CT-CV method applies a large constant current, i.e., Iinitial in Equation (1)-(i), until the temperature reaches a threshold value Tthreshold. After that, it enters the constant temperature section in which the charging current is determined in Equation (1)-(ii) and Equation (1)-(iii). Initially, the current decreases exponentially with variation by a PID controller, as given in Equation (1)-(ii). The degree of the reducing current can be controlled by the time constant τ. When the charging current falls to 1C, it will be determined by Equation (1)-(iii) with the variation controlled by the PID controller to keep the temperature at Tthreshold. Eventually, the battery voltage rise to the maximum charging voltage, it would enter the constant voltage mode and terminates when the charging criterion is satisfied. The flowchart of the CT-CV method is presented in Figure 3. This paper preliminarily designs a CT-CV method based on the maximum temperature of 24.3 °C, referring to the 1C CC-CV method. In other words, Tthreshold is set to 24.3 °C in this case, and the maximum temperature rise is 2.3 °C.
I = I i n i t i a l ,   T T t h r e s h o l d I i n i t i a l × e ( t / τ ) + Δ I P I D ,   T T t h r e s h o l d   &   I 1 C 1 C + Δ I P I D ,   else ( i ) ( ii ) ( iii )
where t1 is time, τ is the time constant to control the degree of reducing the charging current, T is the temperature of the battery cell, and ∆IPID is the variation of the charging current determined by the PID control.
It can be observed from Equation (1)-(ii) and Equation (1)-(iii) that the charging procedure occurs in a constant temperature section. The charging current is required to decrease once the cell temperature reaches the threshold value. Thus, the charging current is controlled by PID control to adjust the proper magnitude while decreasing and around 1C rate. The PID controller is implemented based on Equations (2)–(6) [16]. In this way, a current adjustment Δ I P I D can be determined.
e ( n ) = T t h r e s h o l d ( n ) T ( n )
I P ( n ) = K P e ( n )
I I ( n ) = I i ( n 1 ) + K I e ( n )
I D ( n ) = K D [ e ( n ) e ( n 1 ) ]
Δ I P I D ( n ) = I P + I I + I D

2.3. Enumeration of the Configuration of CT-CV Charging Methods

The CT-CV charging method mainly achieves the goal of maintaining a fixed highest battery temperature through closed-loop control. This paper adopts PID control to adjust the charging current command. However, it can be observed from Equation (1) that several key parameters must be determined to implement the CC-CV method, including the magnitude of the initial current Iinitial, the time constant τ for the control of decreasing current, and the magnitude of the current variation ΔIPID. Therefore, this paper initially conducts three different parameter settings of the CC-CV method to observe the effects of these parameter settings on the charging performance, as shown in Table 2. In trial Case 1, for example, the detailed process is given as follows: the initial current of 1.5 C (3.9 A) is used for constant current charging, and when the battery temperature reaches 24.3 °C, the charging proceeds in the constant temperature mode where the current is determined by Equation (1)-(ii) with τ = 200 s. Once the charging current falls to 1 C, the charging current is then adjusted by Equation (1)-(iii) with the maximum variation set to be to ±0.25 A. When the battery terminal voltage is greater than or equal to 4.2 V, the power supply switches to the CV mode to charge the battery with a fixed voltage until the battery current is less than 0.05 A, indicating the completion of this charging cycle. For Case 1, the relevant key parameters are configured as follows: the initial current is 1.5 C, the time constant τ is set to 200 s, and the PID control output limit is set to ±0.25. Likewise, trial Cases 2 and 3 can be also implemented in a similar way.
The results of the abovementioned three trial cases are shown in Figure 4 and Figure 5. When the initial current is large (ex. 6 A in Case 3), the temperature rises more rapidly, taking only 110 s to switch from the constant current mode to the constant temperature mode with decreasing current. On the other hand, when the initial current is small (ex. 3.9 A in Case 1), the time to reach 24.3 °C is longer, taking 240 s to switch from the constant current mode to the constant temperature mode with the current reducing with time. Furthermore, observing the effect of the time constant (τ), it is evident that a longer time constant (ex. τ = 2000 s in Case 3) will result in a smoother decrease in current, indicating a larger magnitude of charging current, hence reducing the charging time and increasing the temperature rise. Conversely, a shorter time constant (ex. τ = 200 s in Case 1) will lead to a rapid decrease in current, indicating a smaller magnitude of charging current, resulting in a longer charging time and a smaller increase in temperature. Apart from the waveforms, the numerical results of the charging performances are given in Table 3. It is worth noting that the maximum temperature of both Case 2 and Case 3 exceed the pre-defined threshold value. This is because the large initial charging current makes the temperature rise rapidly. However, even when the threshold temperature is detected, it is too late to change the charging current to a decreasing one. From the charging results of the three trial CC-CV methods mentioned above, it is clear that the parameter settings will directly affect the experimental results. Therefore, this paper will further explore the configurations of the CT-CV charging method using the Taguchi method to optimize the key parameters, aiming to achieve the optimal parameter settings for the CT-CV charging method.

3. Optimized CT-CV Charging Strategy Based on Taguchi Method

3.1. Experiment Design Using Taguchi Method

In Section 2.3. Enumeration of the Configuration of CT-CV Charging Methods, it was first observed that the combination of the initial current (Iinitial) and time constant (τ) is a primary factor influencing the charging time, temperature rise, and charging efficiency. Through the process of trying various parameters, it was observed that when a high current is configured with a long time constant, the charging time is the shortest, but the temperature rise is the most significant, and the efficiency is reduced. This is because when the high charging current passes through the electrolyte and electrode materials, heat is generated due to internal resistance. An increase in temperature leads to more energy being converted into heat loss. Furthermore, due to the temperature response time of the battery, this study introduced a delay time (TD) as an additional factor to be investigated. Through the data acquisition instrument, a delayed time is introduced before each data sampling to ensure that the corresponding temperature changes can be accurately recorded. On the other hand, the current variation (ΔIPID) primarily affects the value of the charging current, therefore influencing the temperature rise. It is worth noting that setting a large ΔIPID variation may lead to an unstable temperature rise and result in temperature fluctuations, given that an excessive ΔIPID configured with a short delay time TD may result in a fluctuating temperature curve and may even fail to control the maximum temperature. This is because when the TD is kept too short, the actual resulting performance of the current variation fails to reflect this. At the same time, when the ΔIPID variation is too large, it causes a drastic change in the output current, resulting in an unstable battery temperature. Therefore, in this study, the Taguchi method is applied to identify the most appropriate configurations for the four parameters, i.e., the initial current (Iinitial), time constant (τ), delay time (TD), and current variation (ΔIPID).
The Taguchi method is a type of experimental design often applied in the fields of engineering, manufacturing, and science [17,18]. The primary objective of this method is to efficiently assess and optimize multivariate problems with limited experimental resources, aiming to enhance the quality and performance of products or processes. The core concept of the Taguchi method involves combining multiple factors (also known as variables) and their different levels into an orthogonal array. The orthogonal array is used to arrange combinations of factor levels for experiments [19,20]. Herein, the orthogonal array is named using the notation La(bc), where ‘a’ represents the number of experimental groups, with each group capable of accommodating ‘b’ factors at ‘c’ levels. Since each parameter is designed with three different levels and there are four parameters in total, the Taguchi orthogonal array L9(34) is used in this study to conduct nine sets of experiments with each factor having four levels and a total of four factors. Therefore, Table 4 lists the settings for each parameter, including the initial current, time constant, delayed time, and limit of ΔIPID. There are four factors in total, and each factor has three levels, ranging from low to high. Next, the orthogonal array L9(34) is applied to accommodate these parameters and arrange them in combinations for practical experiments. Eventually, nine experiments, as given in Table 5, will be carried out.

3.2. Experimental Results from the Orthogonal Array

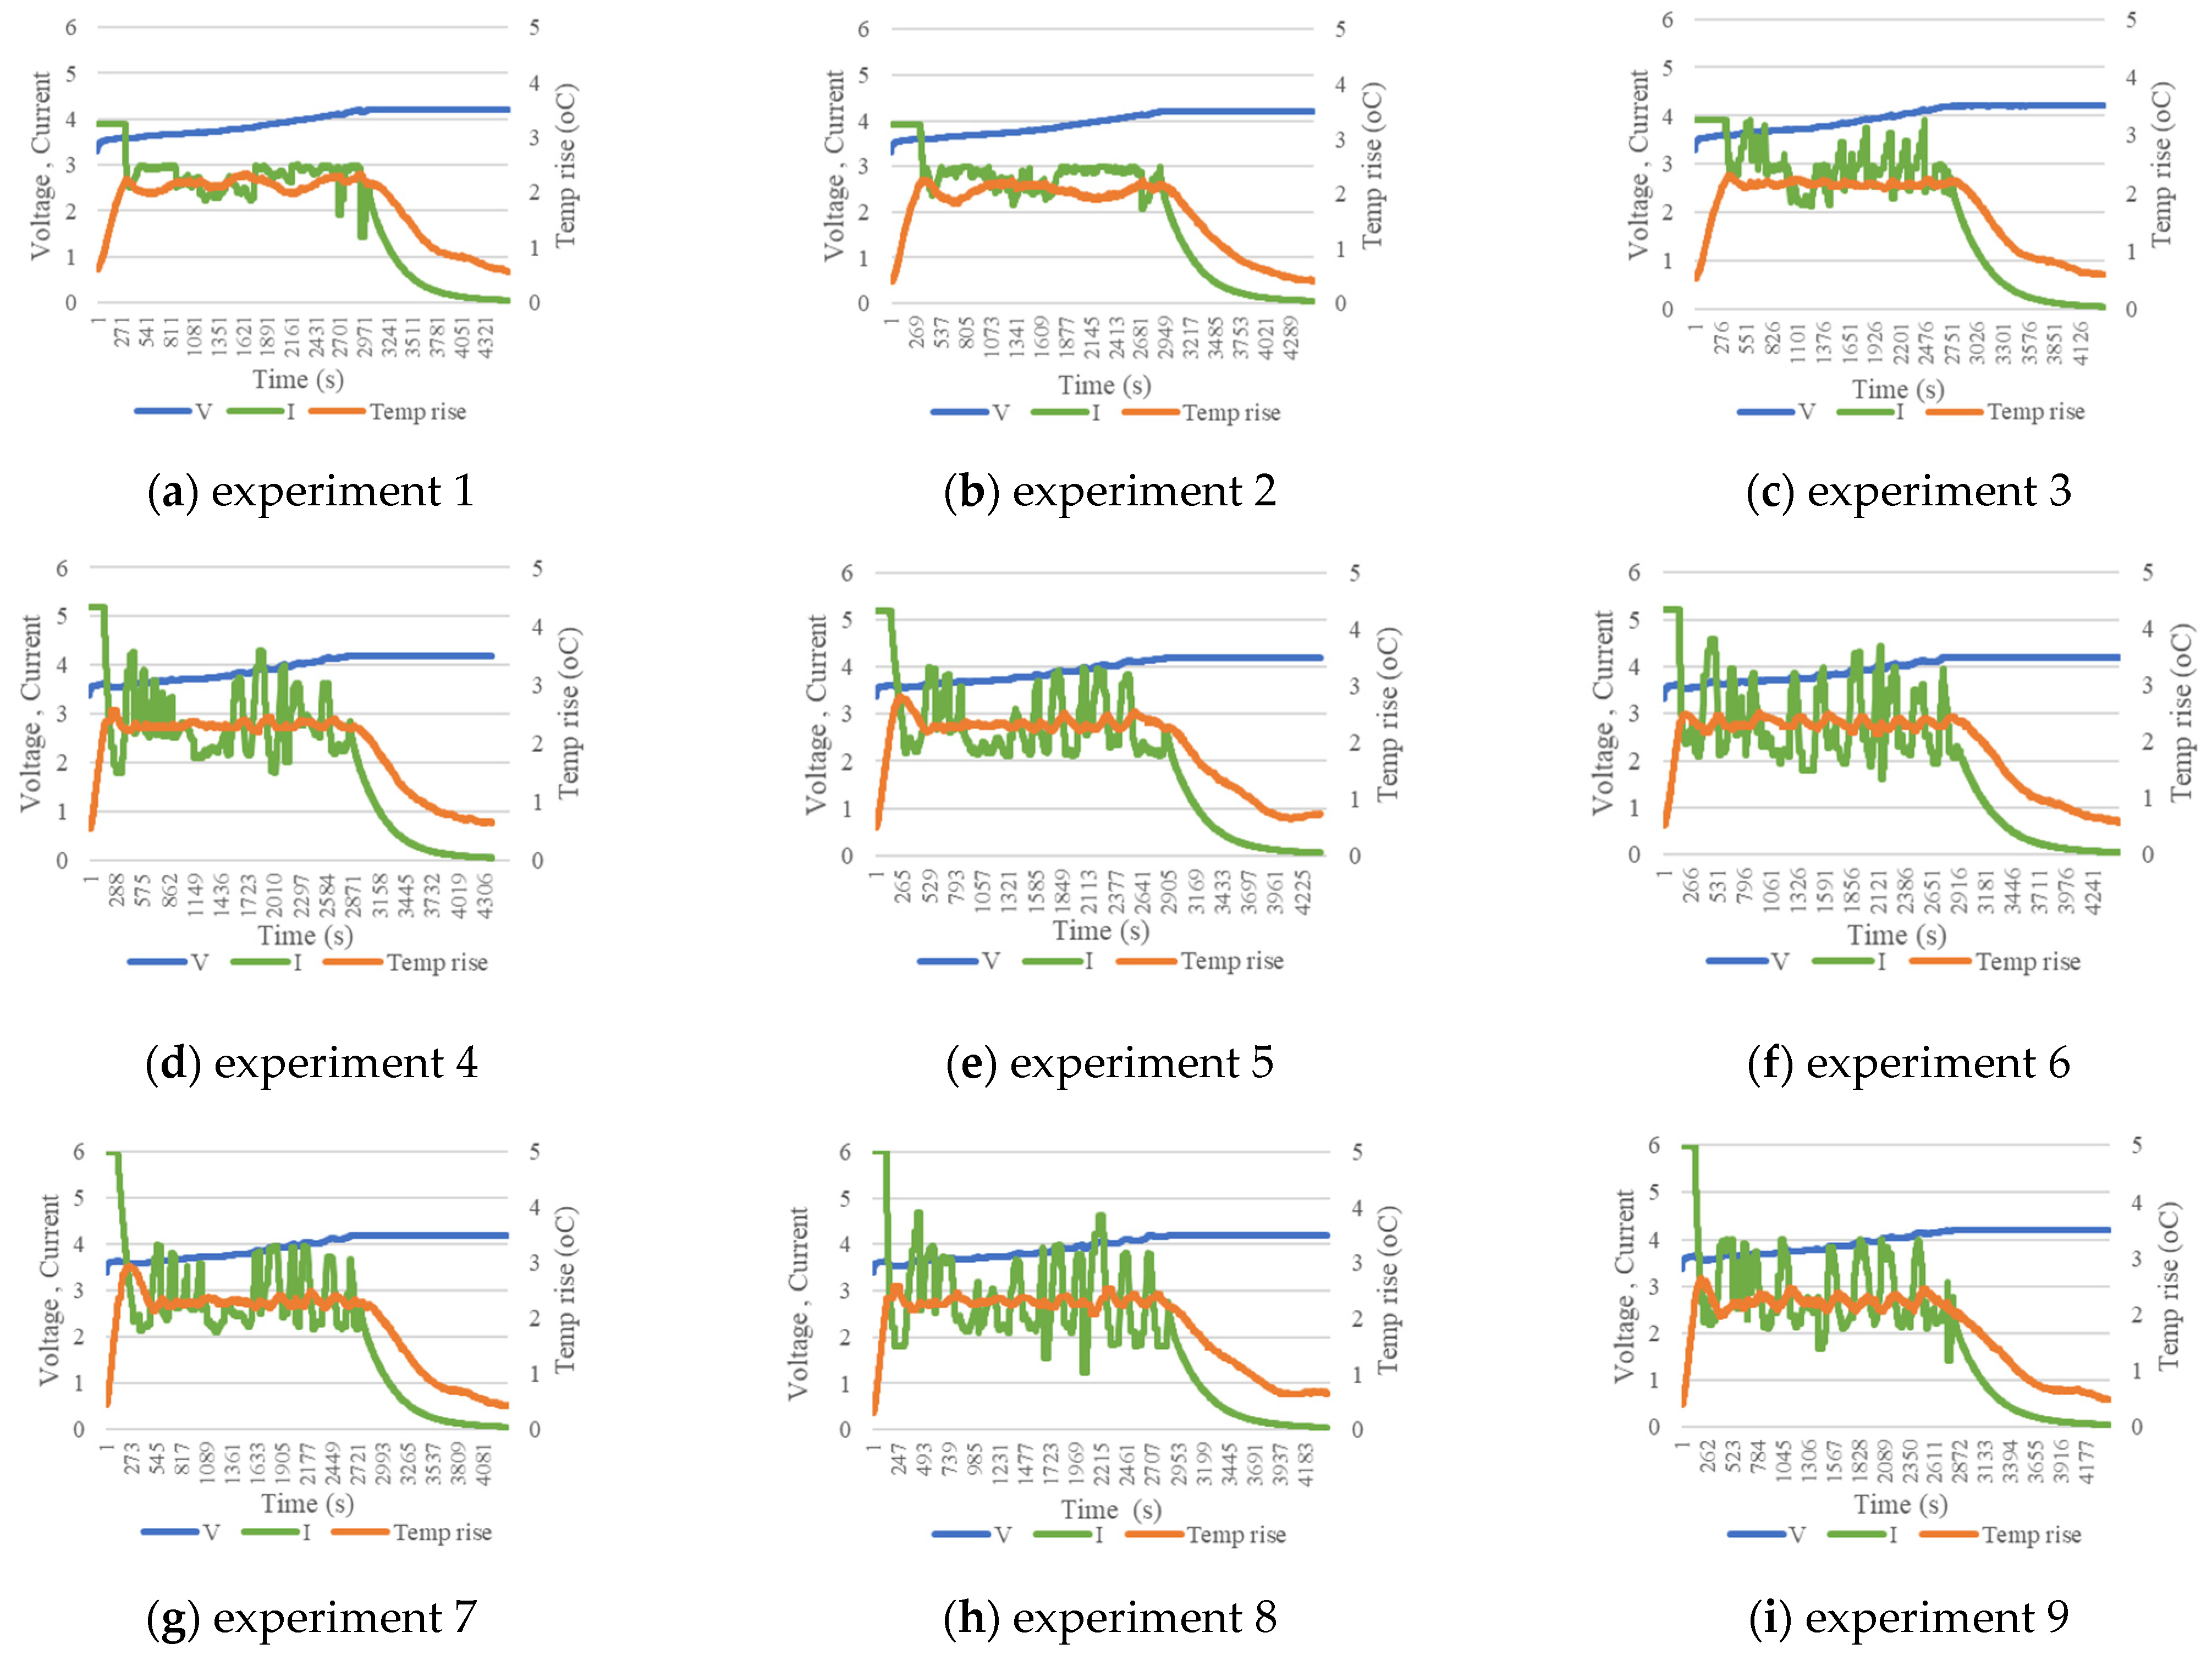
The experiments were carried out based on the designed L9 orthogonal array. The resultant data and waveforms are presented in Table 6 and Figure 6, respectively. Important evaluation metrics, including charging time, charging efficiency, maximum temperature rise, and average temperature rise, were all recorded. The resultant charging performance shown in Table 6 enables the analysis of each factor’s contribution according to the Taguchi method. After the cells were all fully charged, they were discharged by a battery cycler to collect the discharging capacity data and compute the charging efficiency based on Equation (7).
Charging   efficiency   η = Q discharge Q charge

3.3. Analysis of the Key Control Factors Based on Taguchi Method

This section illustrates the control factors’ response plots based on the experimental results and the determination of the CT-CV parameters for distinct charging objectives. The effects of factor levels on the output responses can be obtained from Equation (8),
A L n = 1 n L n i L n Y i L n j
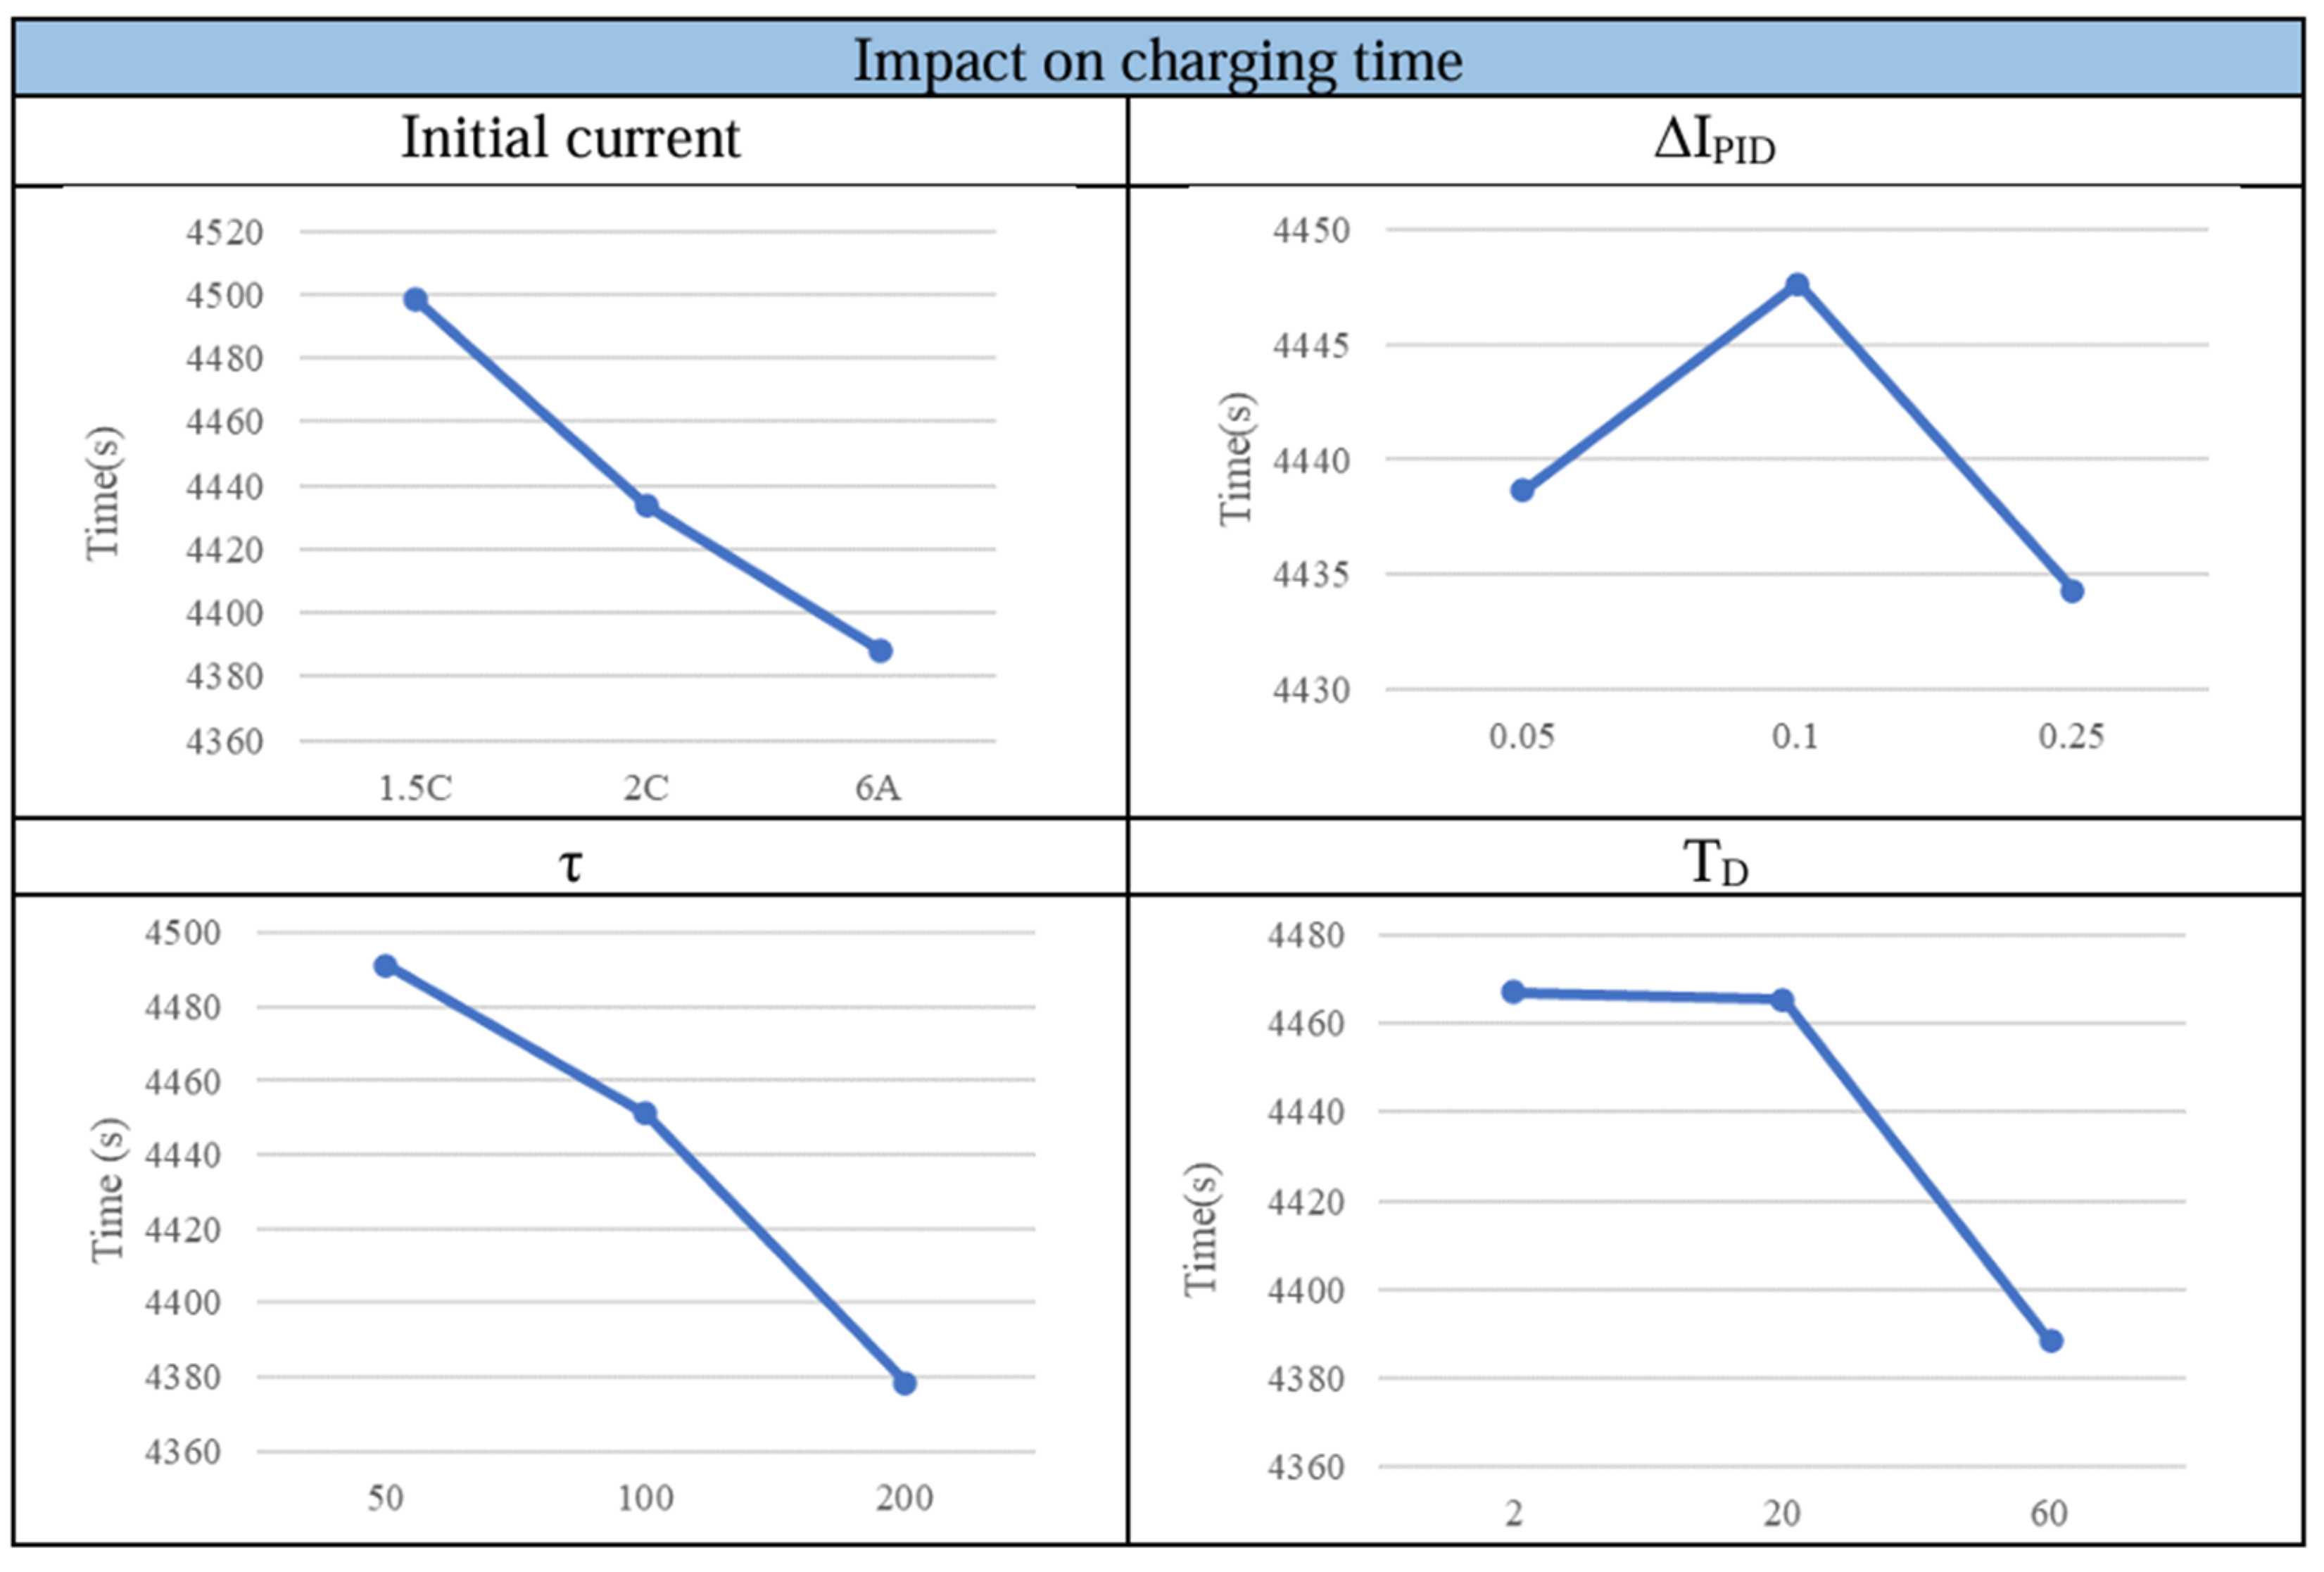
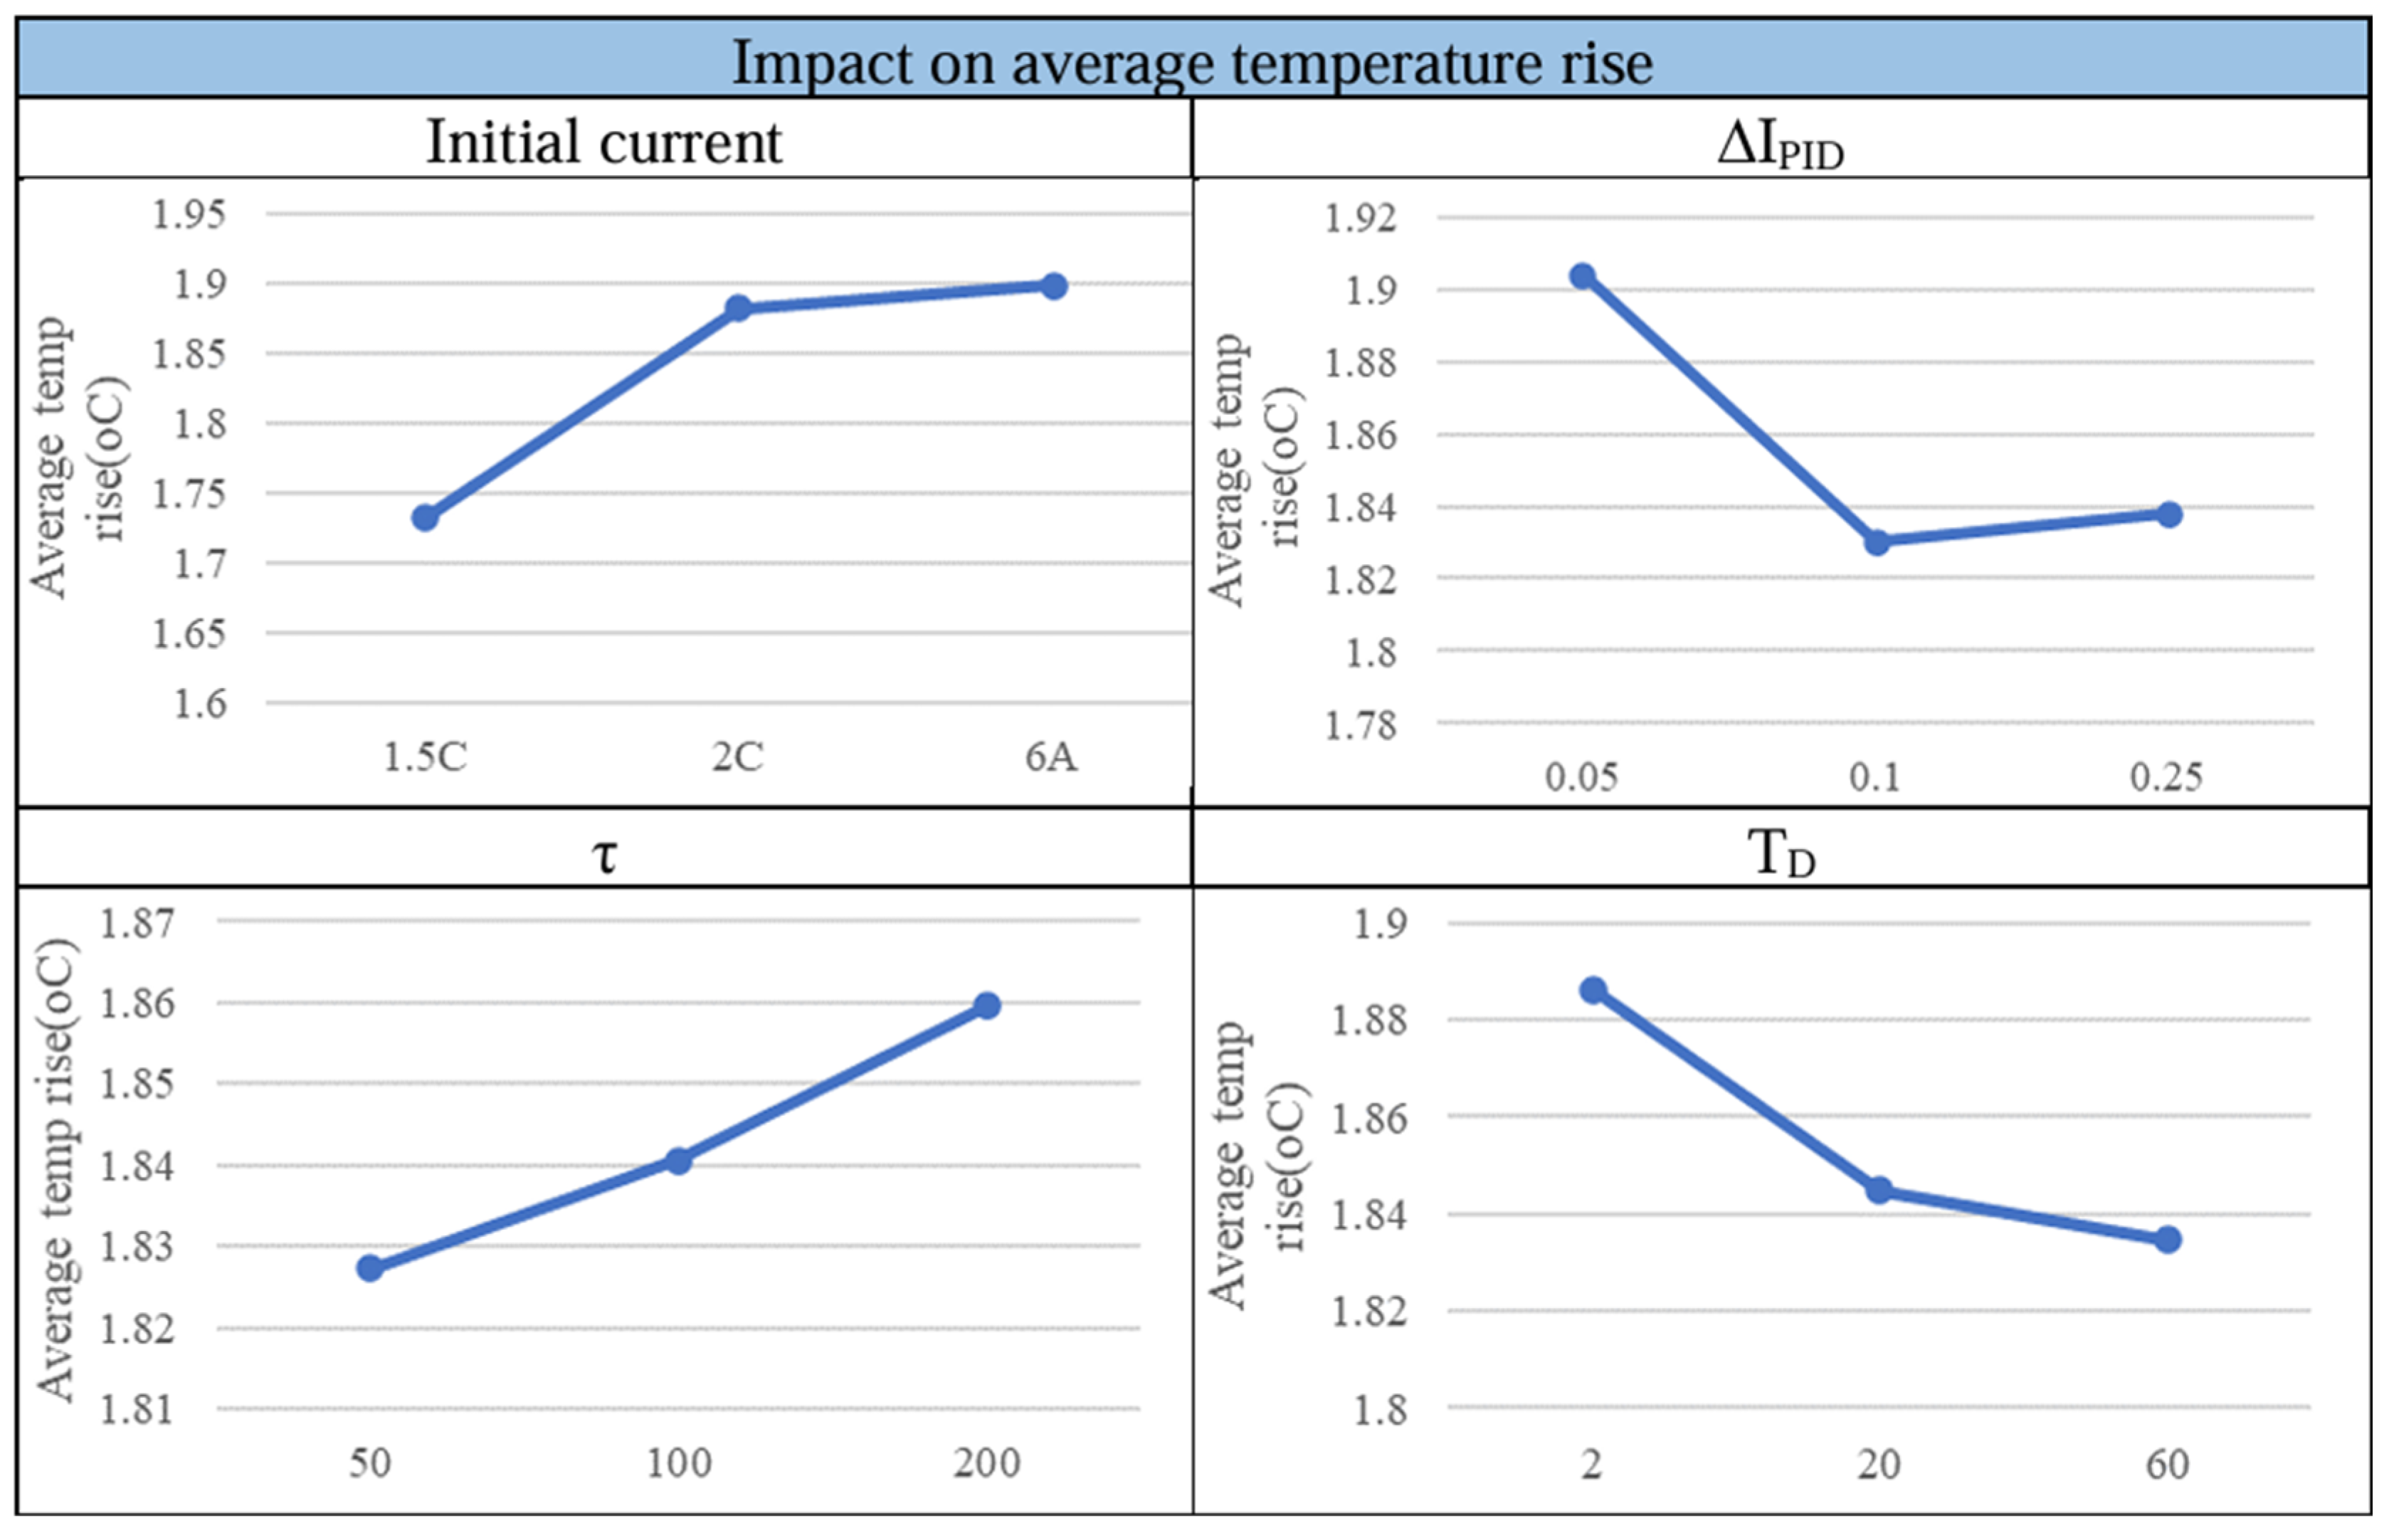
where A L n is the effect of factor level Ln on the output response Y j , n L n is the number of output responses corresponding to level n, and i L n refers to the rows corresponding to level n only in Figure 6 [17]. The impact of the control factors on various evaluation indicators, i.e., the charging time, charging efficiency, and average temperature rise, can be observed from Figure 7, Figure 8 and Figure 9, respectively. In Figure 7, for example, to work out the effects of the factors on the charging time, four control factors are calculated and illustrated individually. Based on Equation (8), the average charging time, approximately 4498.6 s obtained from experiment 1 to experiment 3, represents the effect of the initial current at the level of 1.5 C (3.9 A). On the other hand, the average charging time, approximately 4433.6 s obtained from experiment 4 to experiment 6, represents the effect of the initial current at the level of 2 C (5.2 A). As for the output response of the initial current at the level of Imax (6 A), it is computed as 4388.3 s according to experiment 7 to experiment 9. In a similar way, the effects of the factor levels on the output responses, including the charging efficiency and average temperature rise, can also be displayed as shown in Figure 8 and Figure 9, respectively.
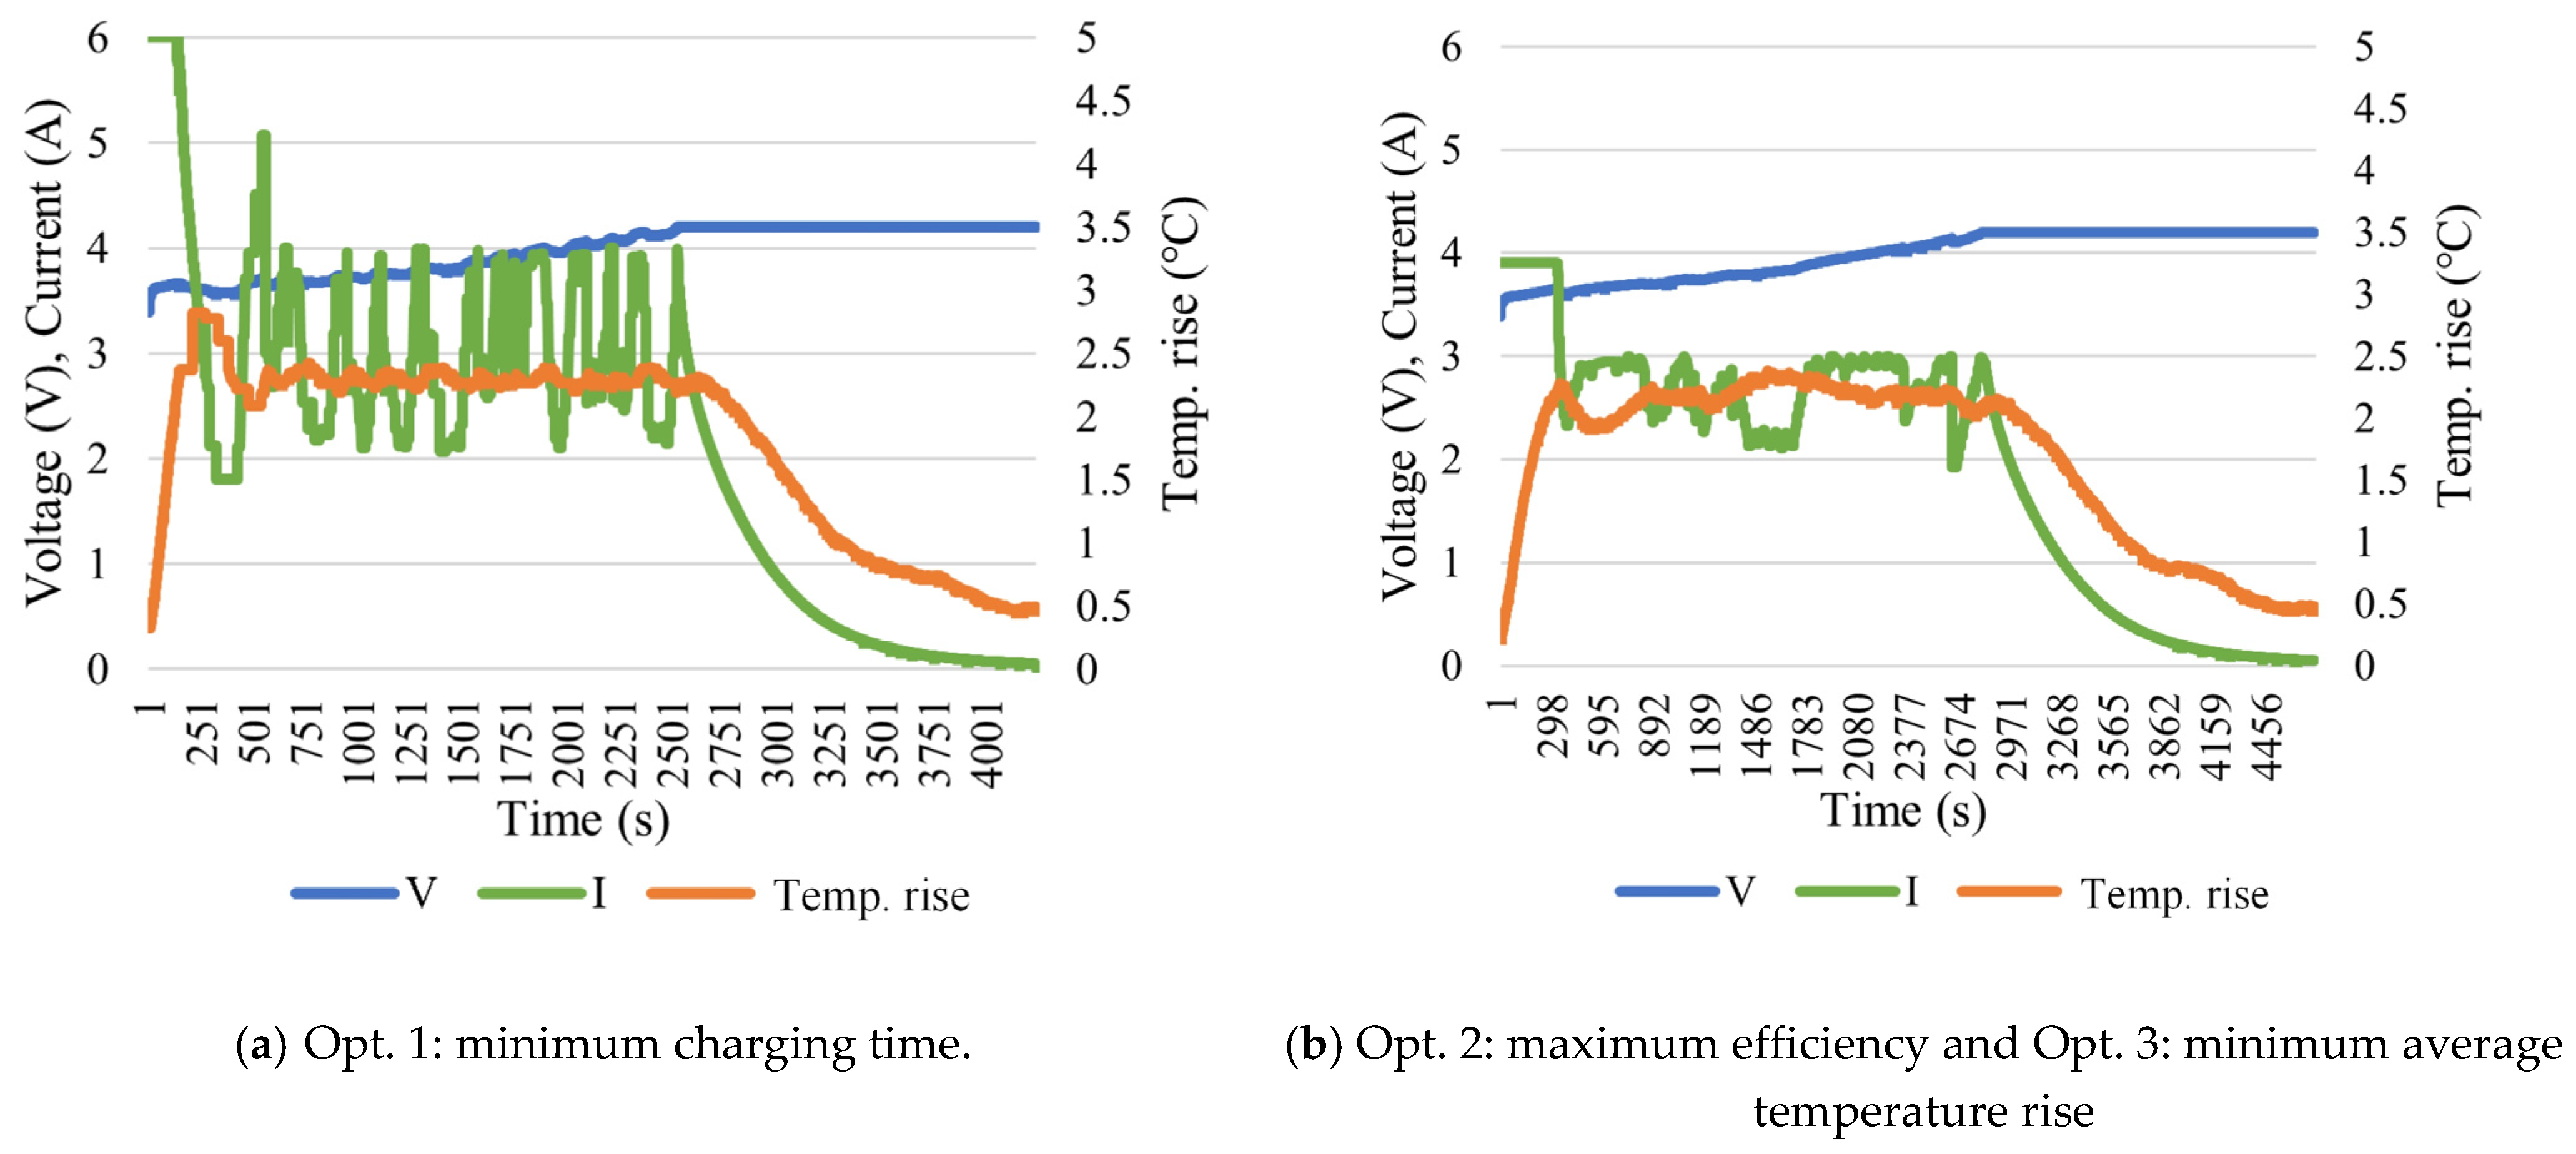
Next, three objectives including the minimum charging time (Opt. 1), maximum efficiency (Opt. 2), and minimum average temperature rise (Opt. 3) are discussed. The corresponding charging parameters can be obtained as given in Table 7. To achieve the minimum charging time, Opt. 1 reveals the initial current value is Imax (6 A), ∆IPID is 0.25 A, τ is 200 s, and TD is 60 s, resulting in the shortest battery charging time. Opt. 2 indicates that the initial current value is 1.5 C (3.9 A), ∆IPID is 0.1 A, τ is 50 s, and TD is 60 s, leading to the highest battery charging efficiency. Opt. 3 has the same parameter settings as Opt. 2, thus achieving the lowest average temperature rise when optimal charging efficiency is achieved. According to Table 7, it can be observed that the relatively large initial current (Imax = 6 A) and the relatively slow decrease in charging current (τ = 200 s) contribute to the shorter charging time. On the other hand, the relatively low initial current (1.5 C (3.9 A)) and the relatively rapid decrease in charging current (τ = 50 s) are attributed to both high efficiency and a low temperature rise. As for the effect of ∆IPID, it is deduced that for a larger initial current, it might require significant current adjustments to control the temperature. For the three objectives, the delayed time TD is identical, from which is deduced that it takes a certain response time for charging commands to affect the cell temperature. Figure 10 shows the current, voltage, and temperature waveforms for the experiments involving Opt. 1, Opt. 2, and Opt. 3.

4. Comprehensive Comparison and Discussion of the Investigated Charging Methods

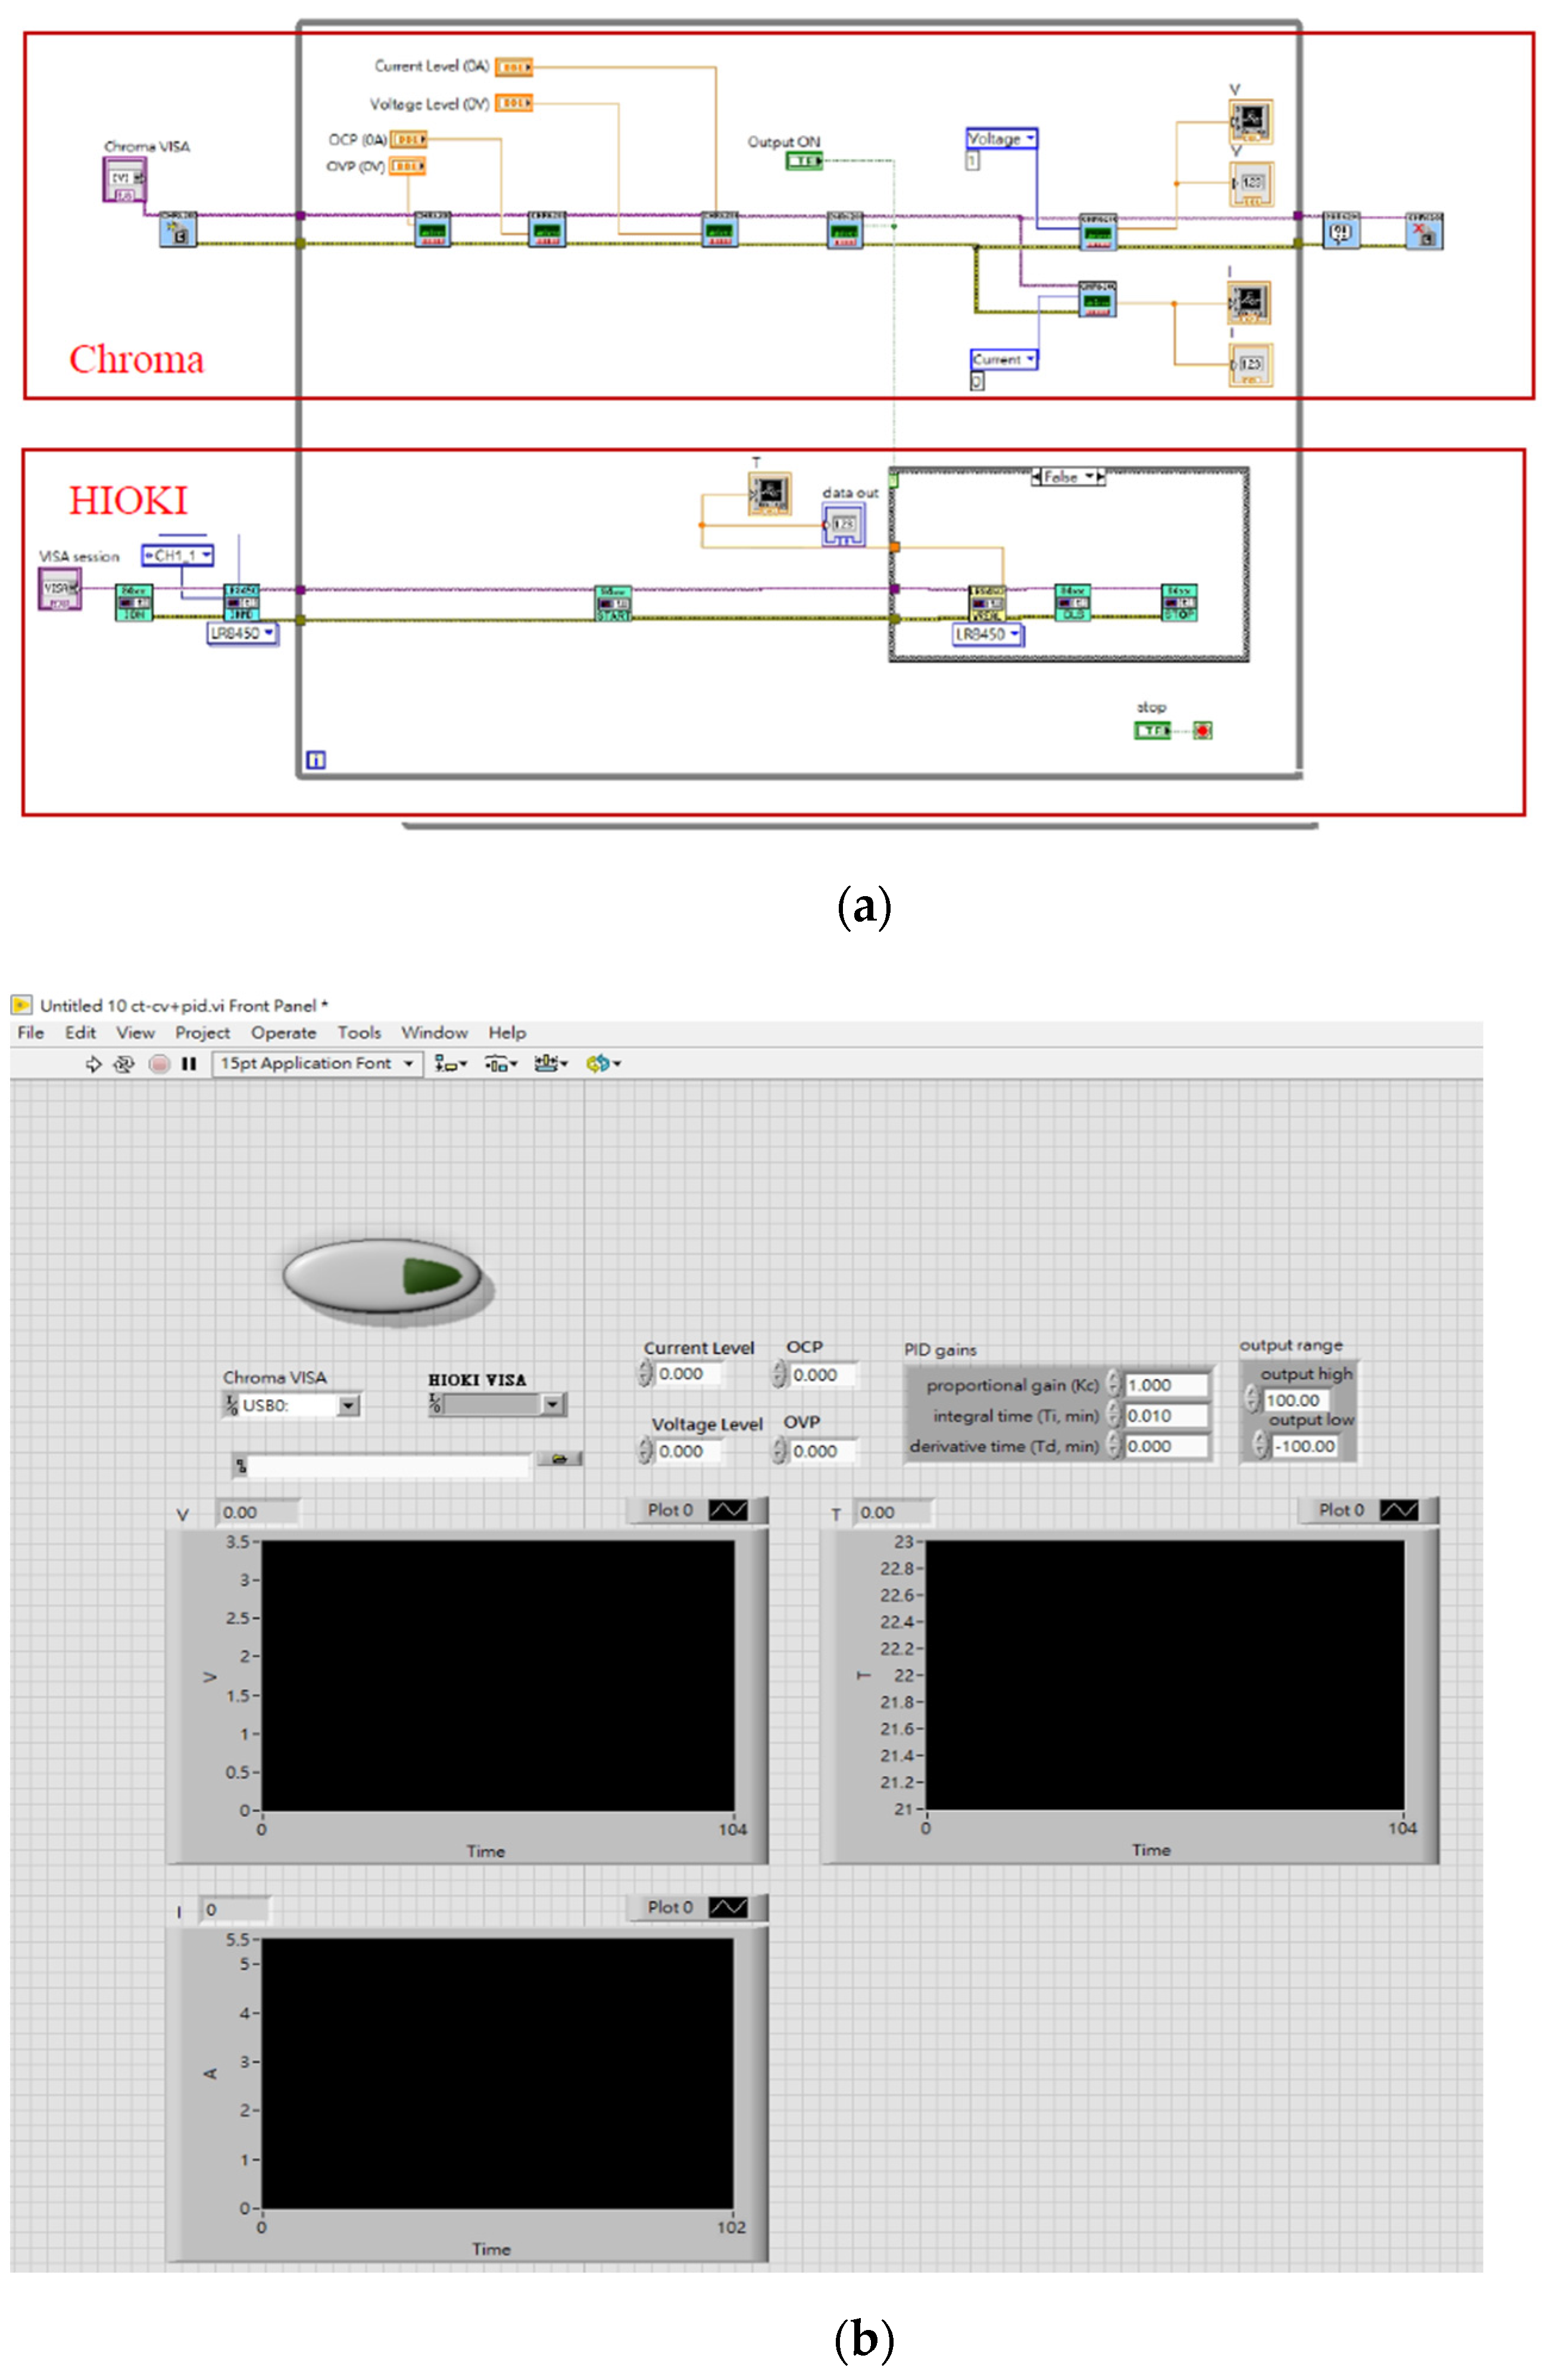
To efficiently implement a variety of charging approaches, this paper proposed a real-time charging monitoring platform based on LabVIEW to observe the charging status of batteries, including voltage, current, and temperature, as shown in Figure 11. A user-friendly interface is provided for intuitively configuring the charging parameters. The block diagram and the control panel in LabVIEW are presented in Figure 12, where different equipment is integrated into one control platform and the arbitrary charging profile can be implemented easily through the user interface. This section gives a comprehensive comparison between the CC-CV method and CT-CV method, and discusses the performance of the optimum CT-CV methods. The overall numerical results are presented in Table 8. Detailed descriptions are given below.

4.1. Comparison between CC-CV and CT-CV Methods

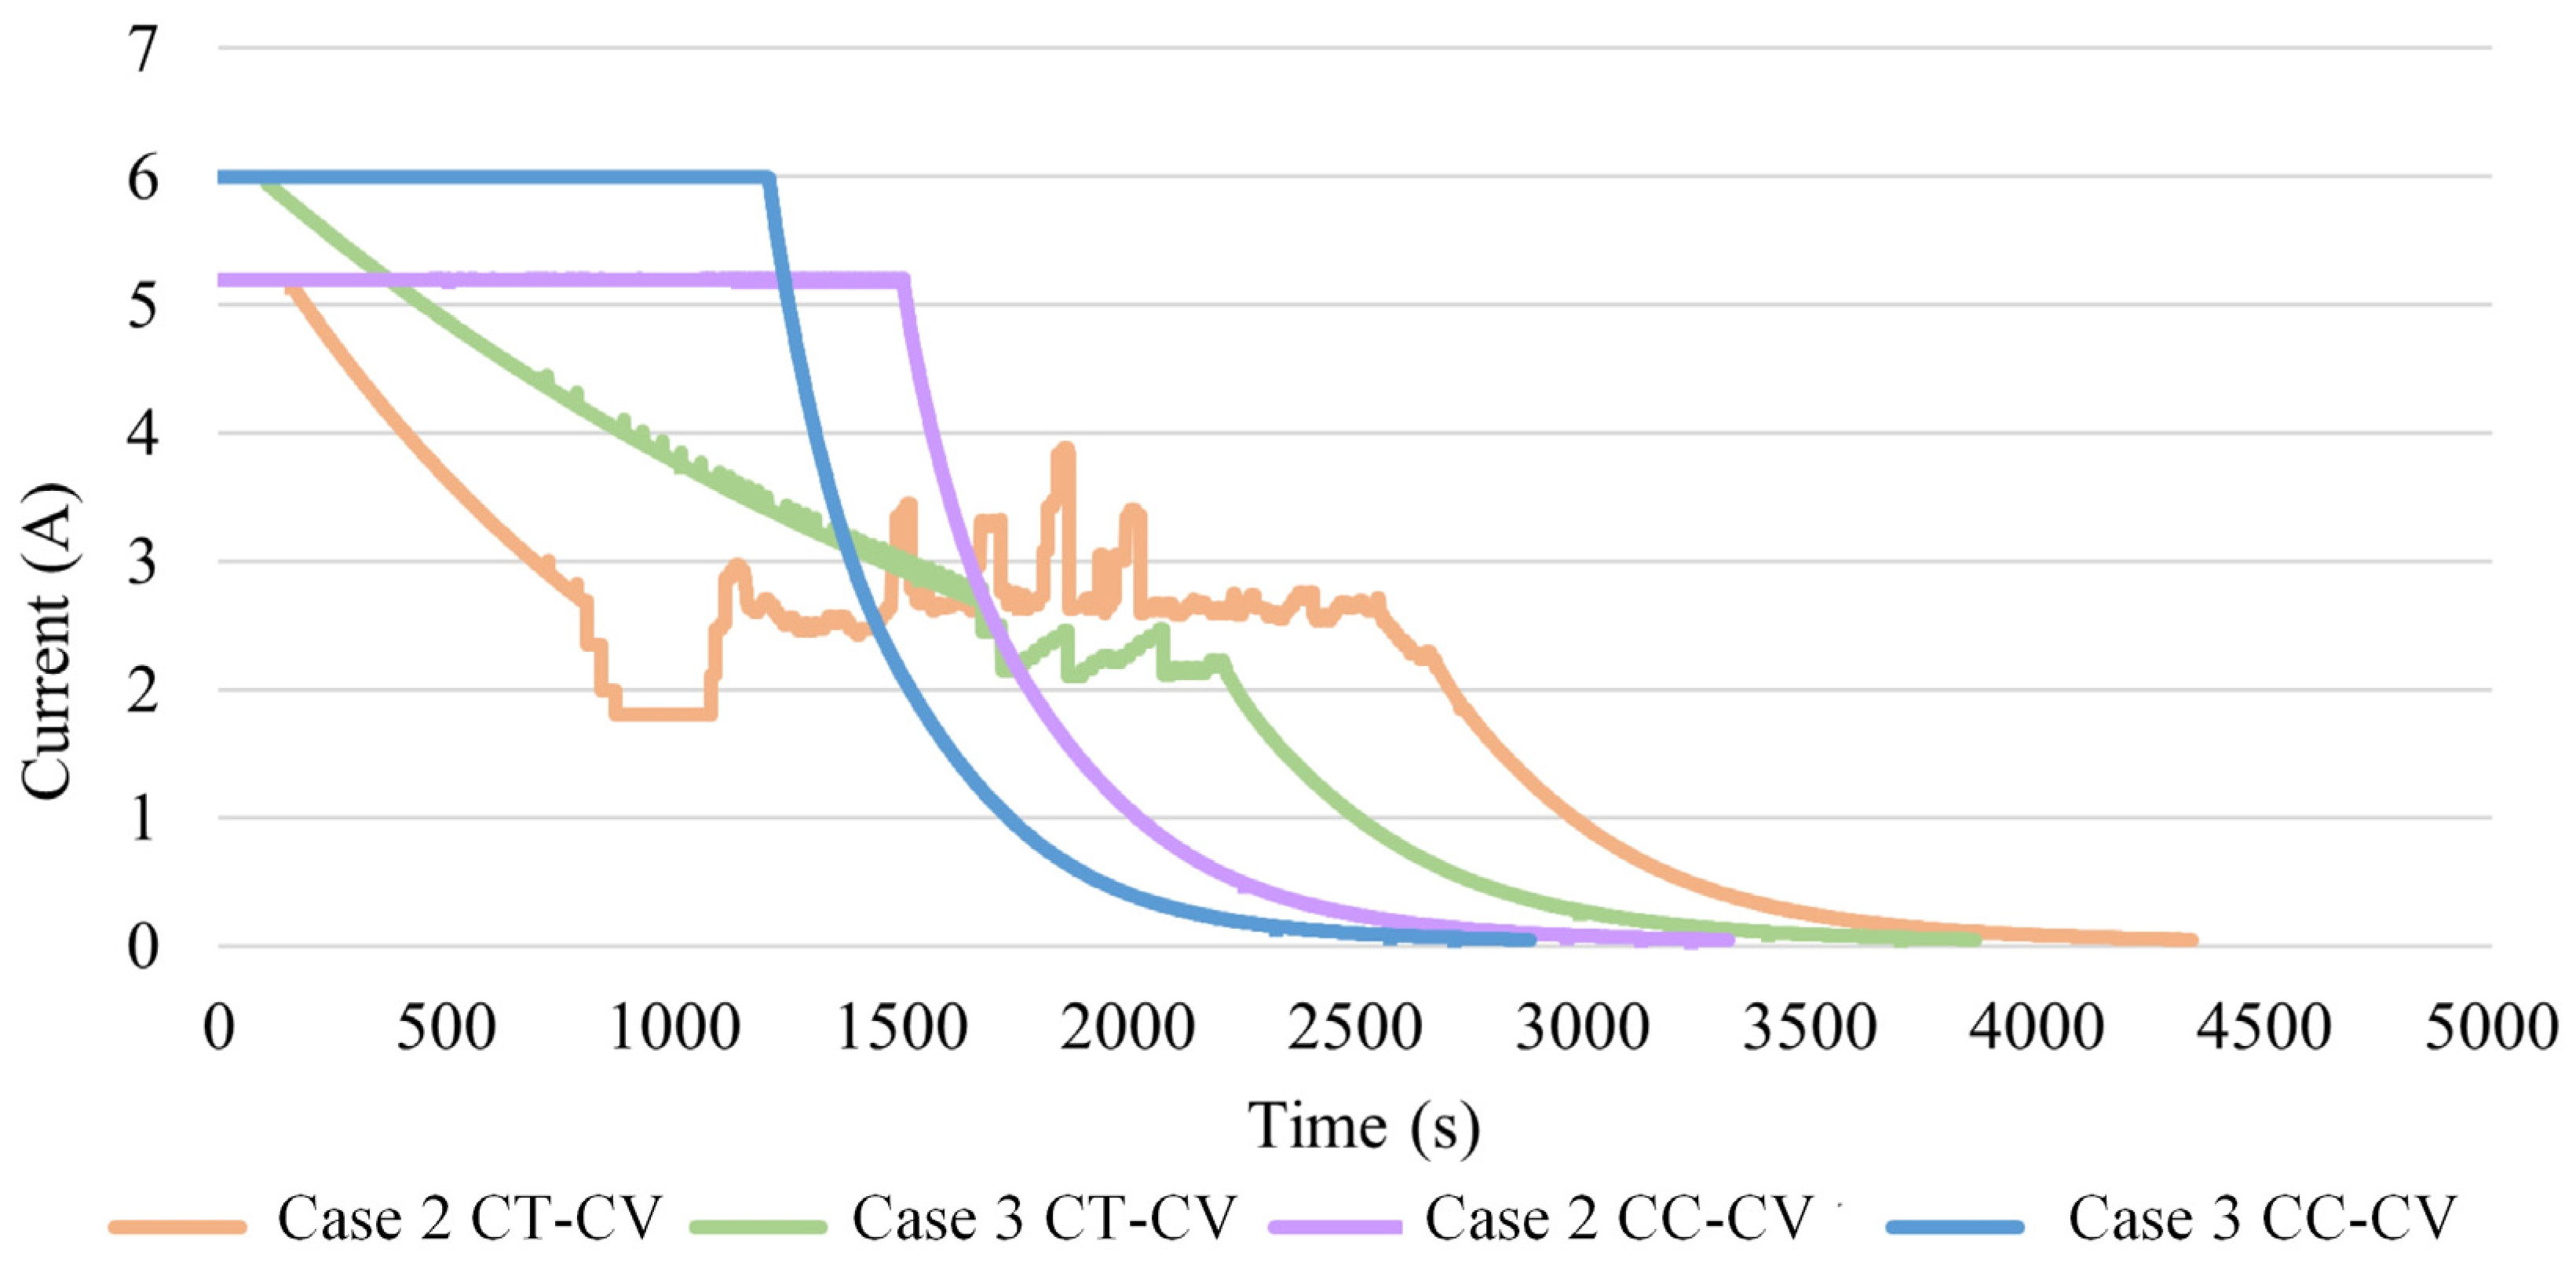
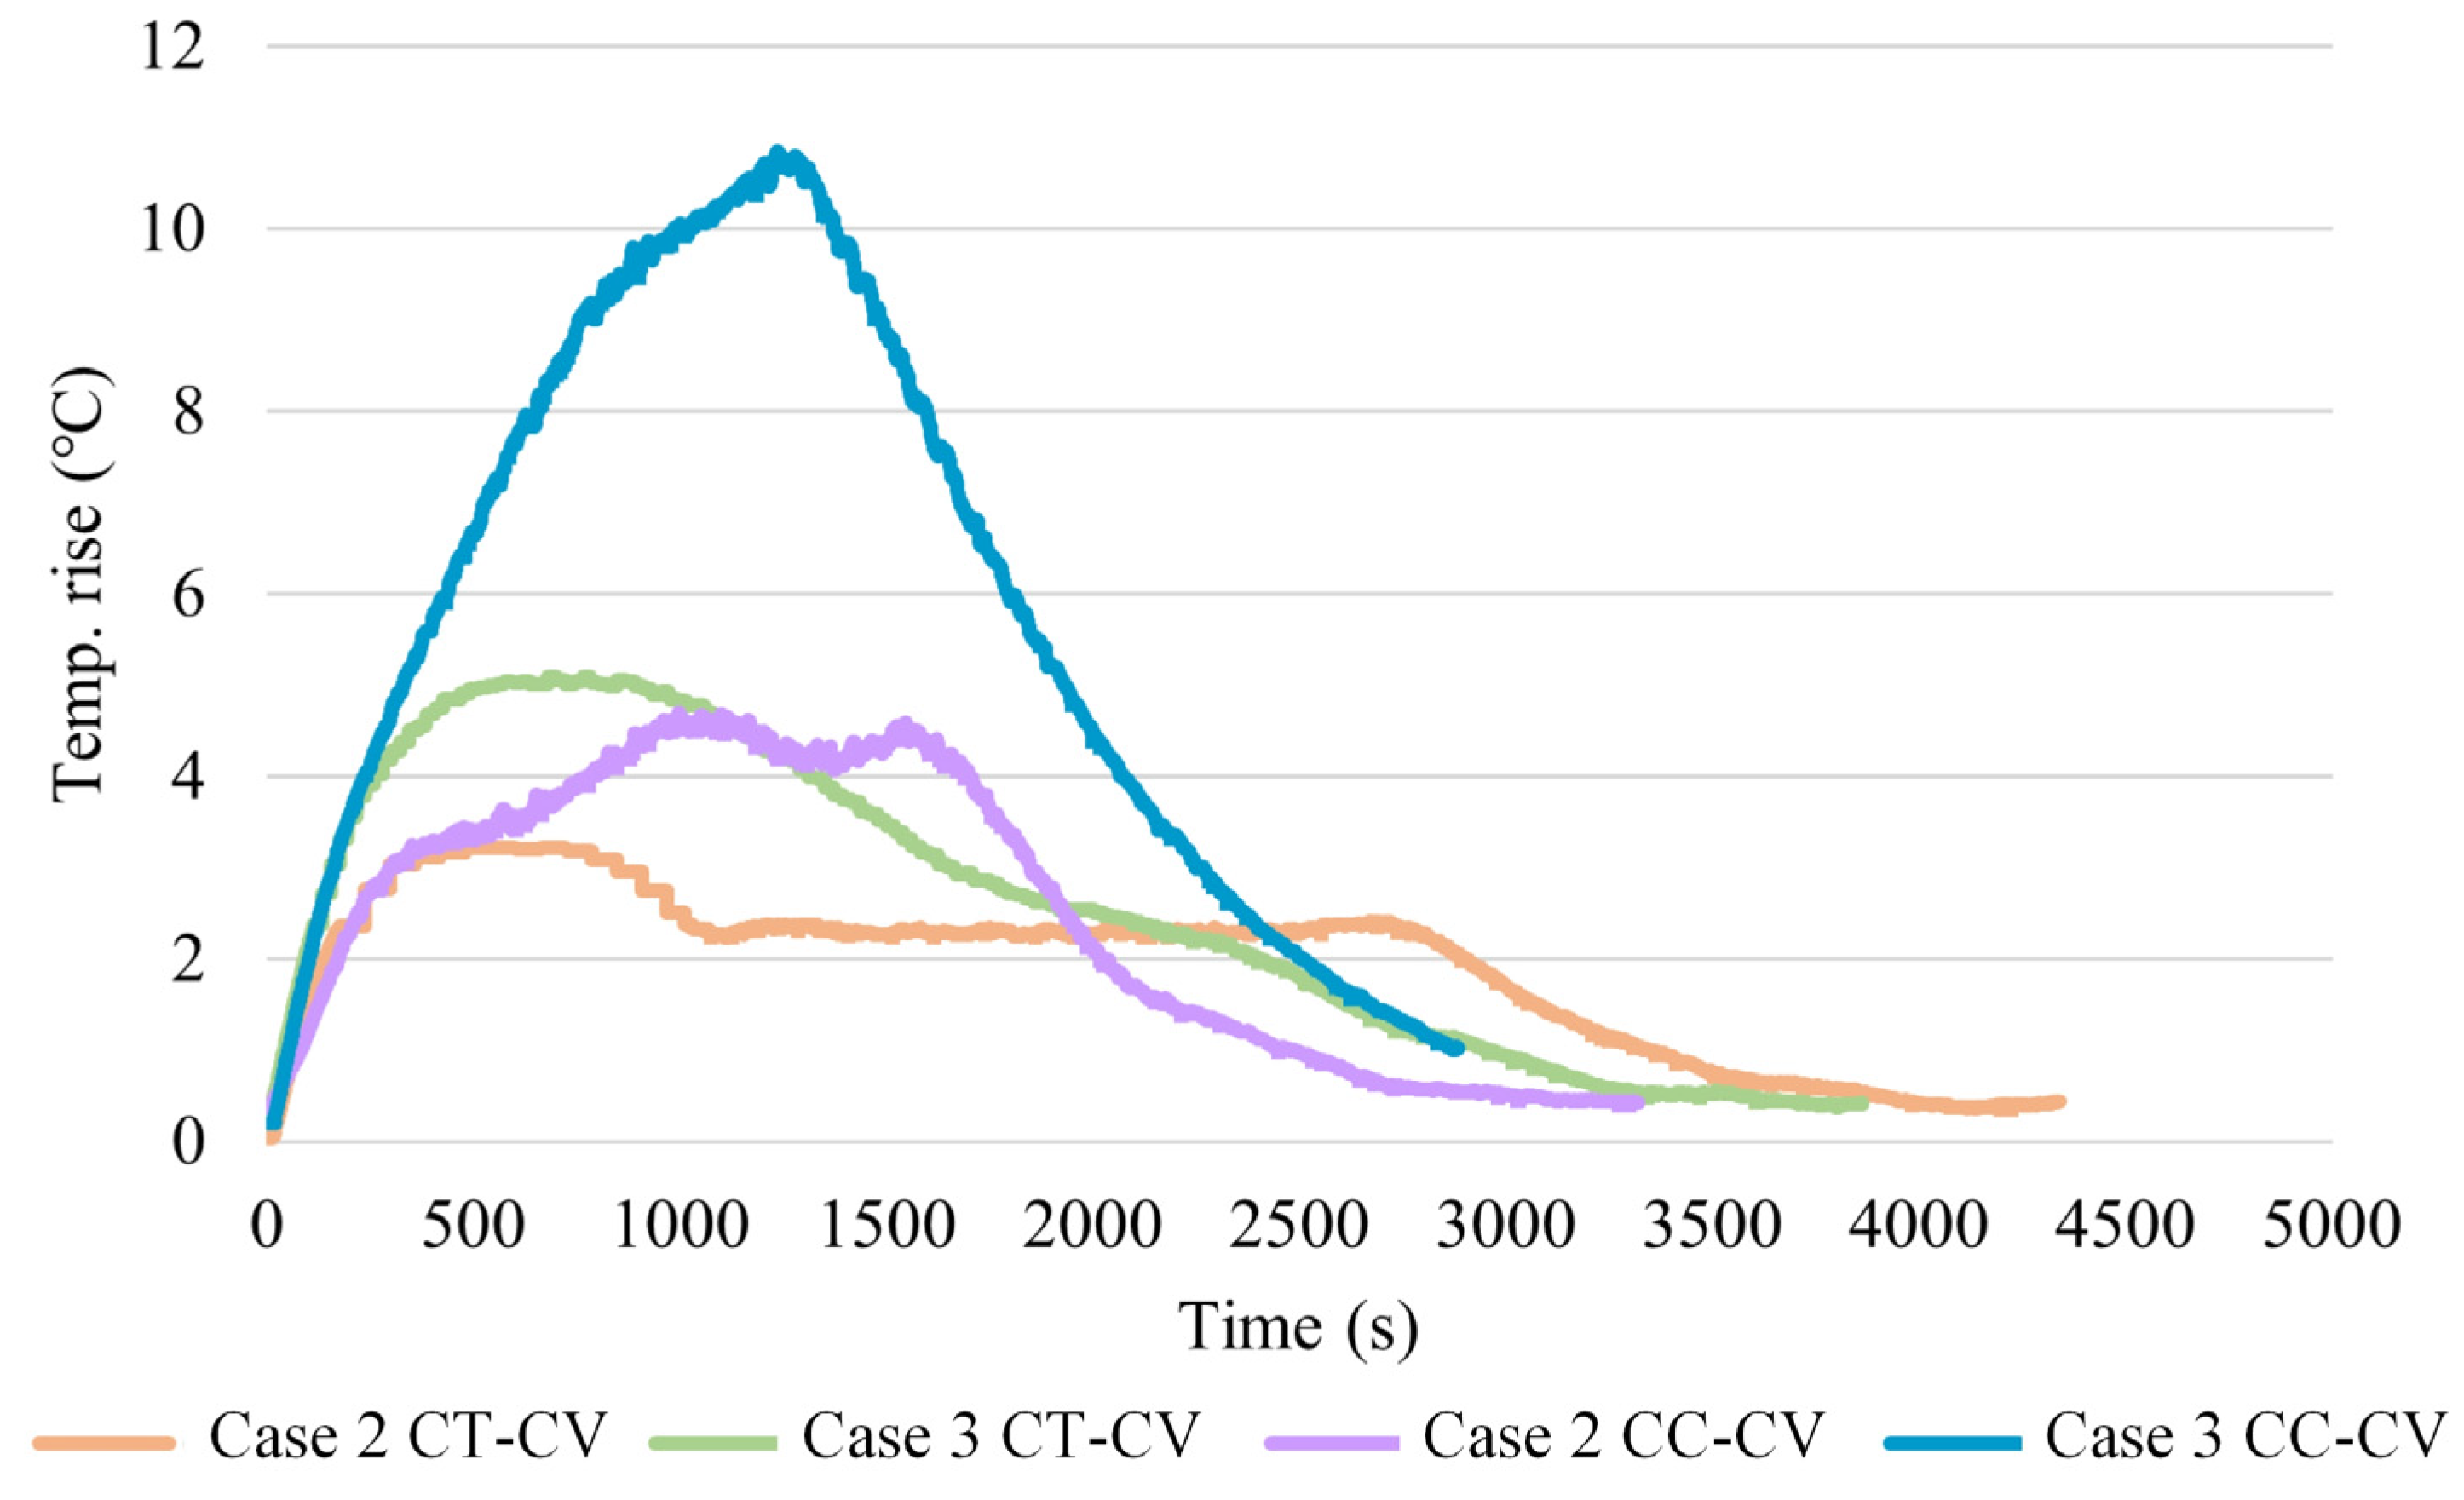
This section compares CC-CV and CT-CV methods. The resultant profiles of the charging current and temperature rise are shown in Figure 13 and Figure 14, respectively. When looking at the Case 2 CT-CV and Case 2 CC-CV, it can be found they use the same initial current (5.2 A). According to Table 8, although Case 2 CT-CV takes longer time to charge compared to Case 2 CC-CV, it reduces the average temperature rise by 0.59 °C (=2.49 °C–1.9 °C) and lowers maximum temperature rise by 1.47 °C (=4.69 °C–3.22 °C) compared to Case 2 CC-CV. Similarly, Case 3 CT-CV and Case 3 CC-CV use the same initial current (6A). Although Case 3 CT-CV takes longer time to charge compared to Case 3 CC-CV, it is able to reduce average temperature rise by 3.21°C (=5.79 °C–2.58 °C) and lower maximum temperature rise by 5.75 °C (=10.84 °C–5.09 °C) compared to Case 3 CC-CV. It can be concluded that with the same initial current, CT-CV exhibits a relatively superior temperature rise performance.

4.2. Comparison between CC-CV and Optimized CT-CV Methods

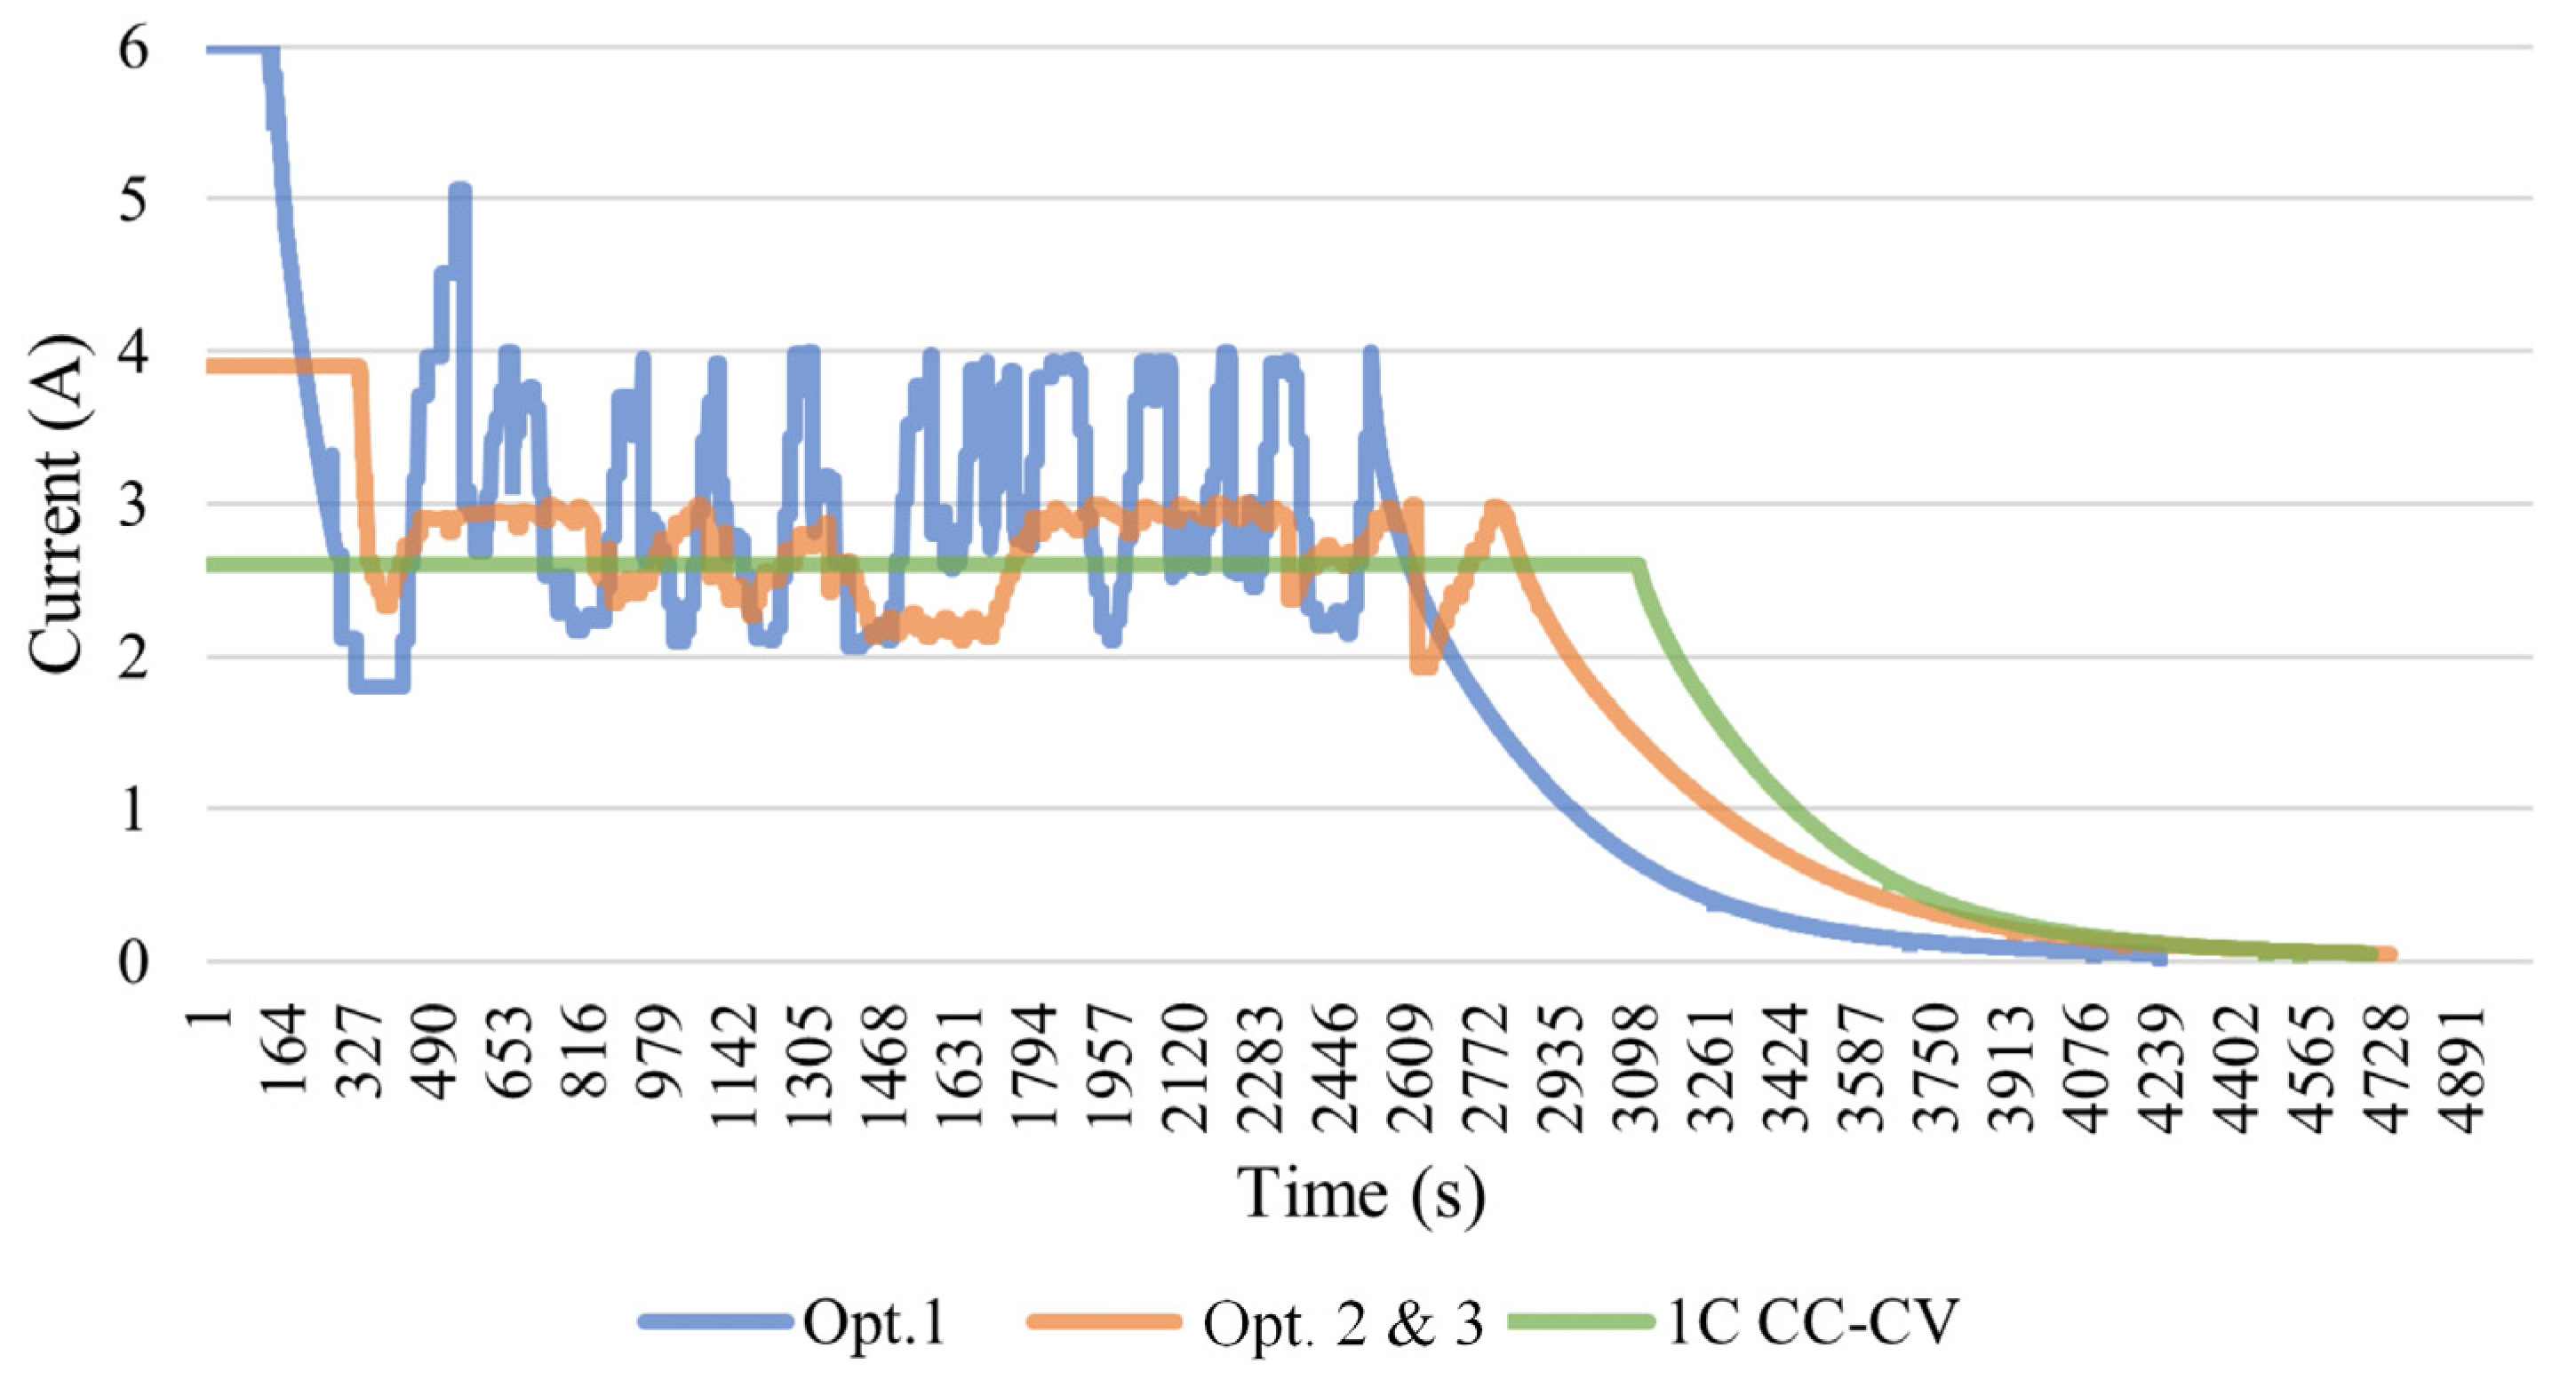
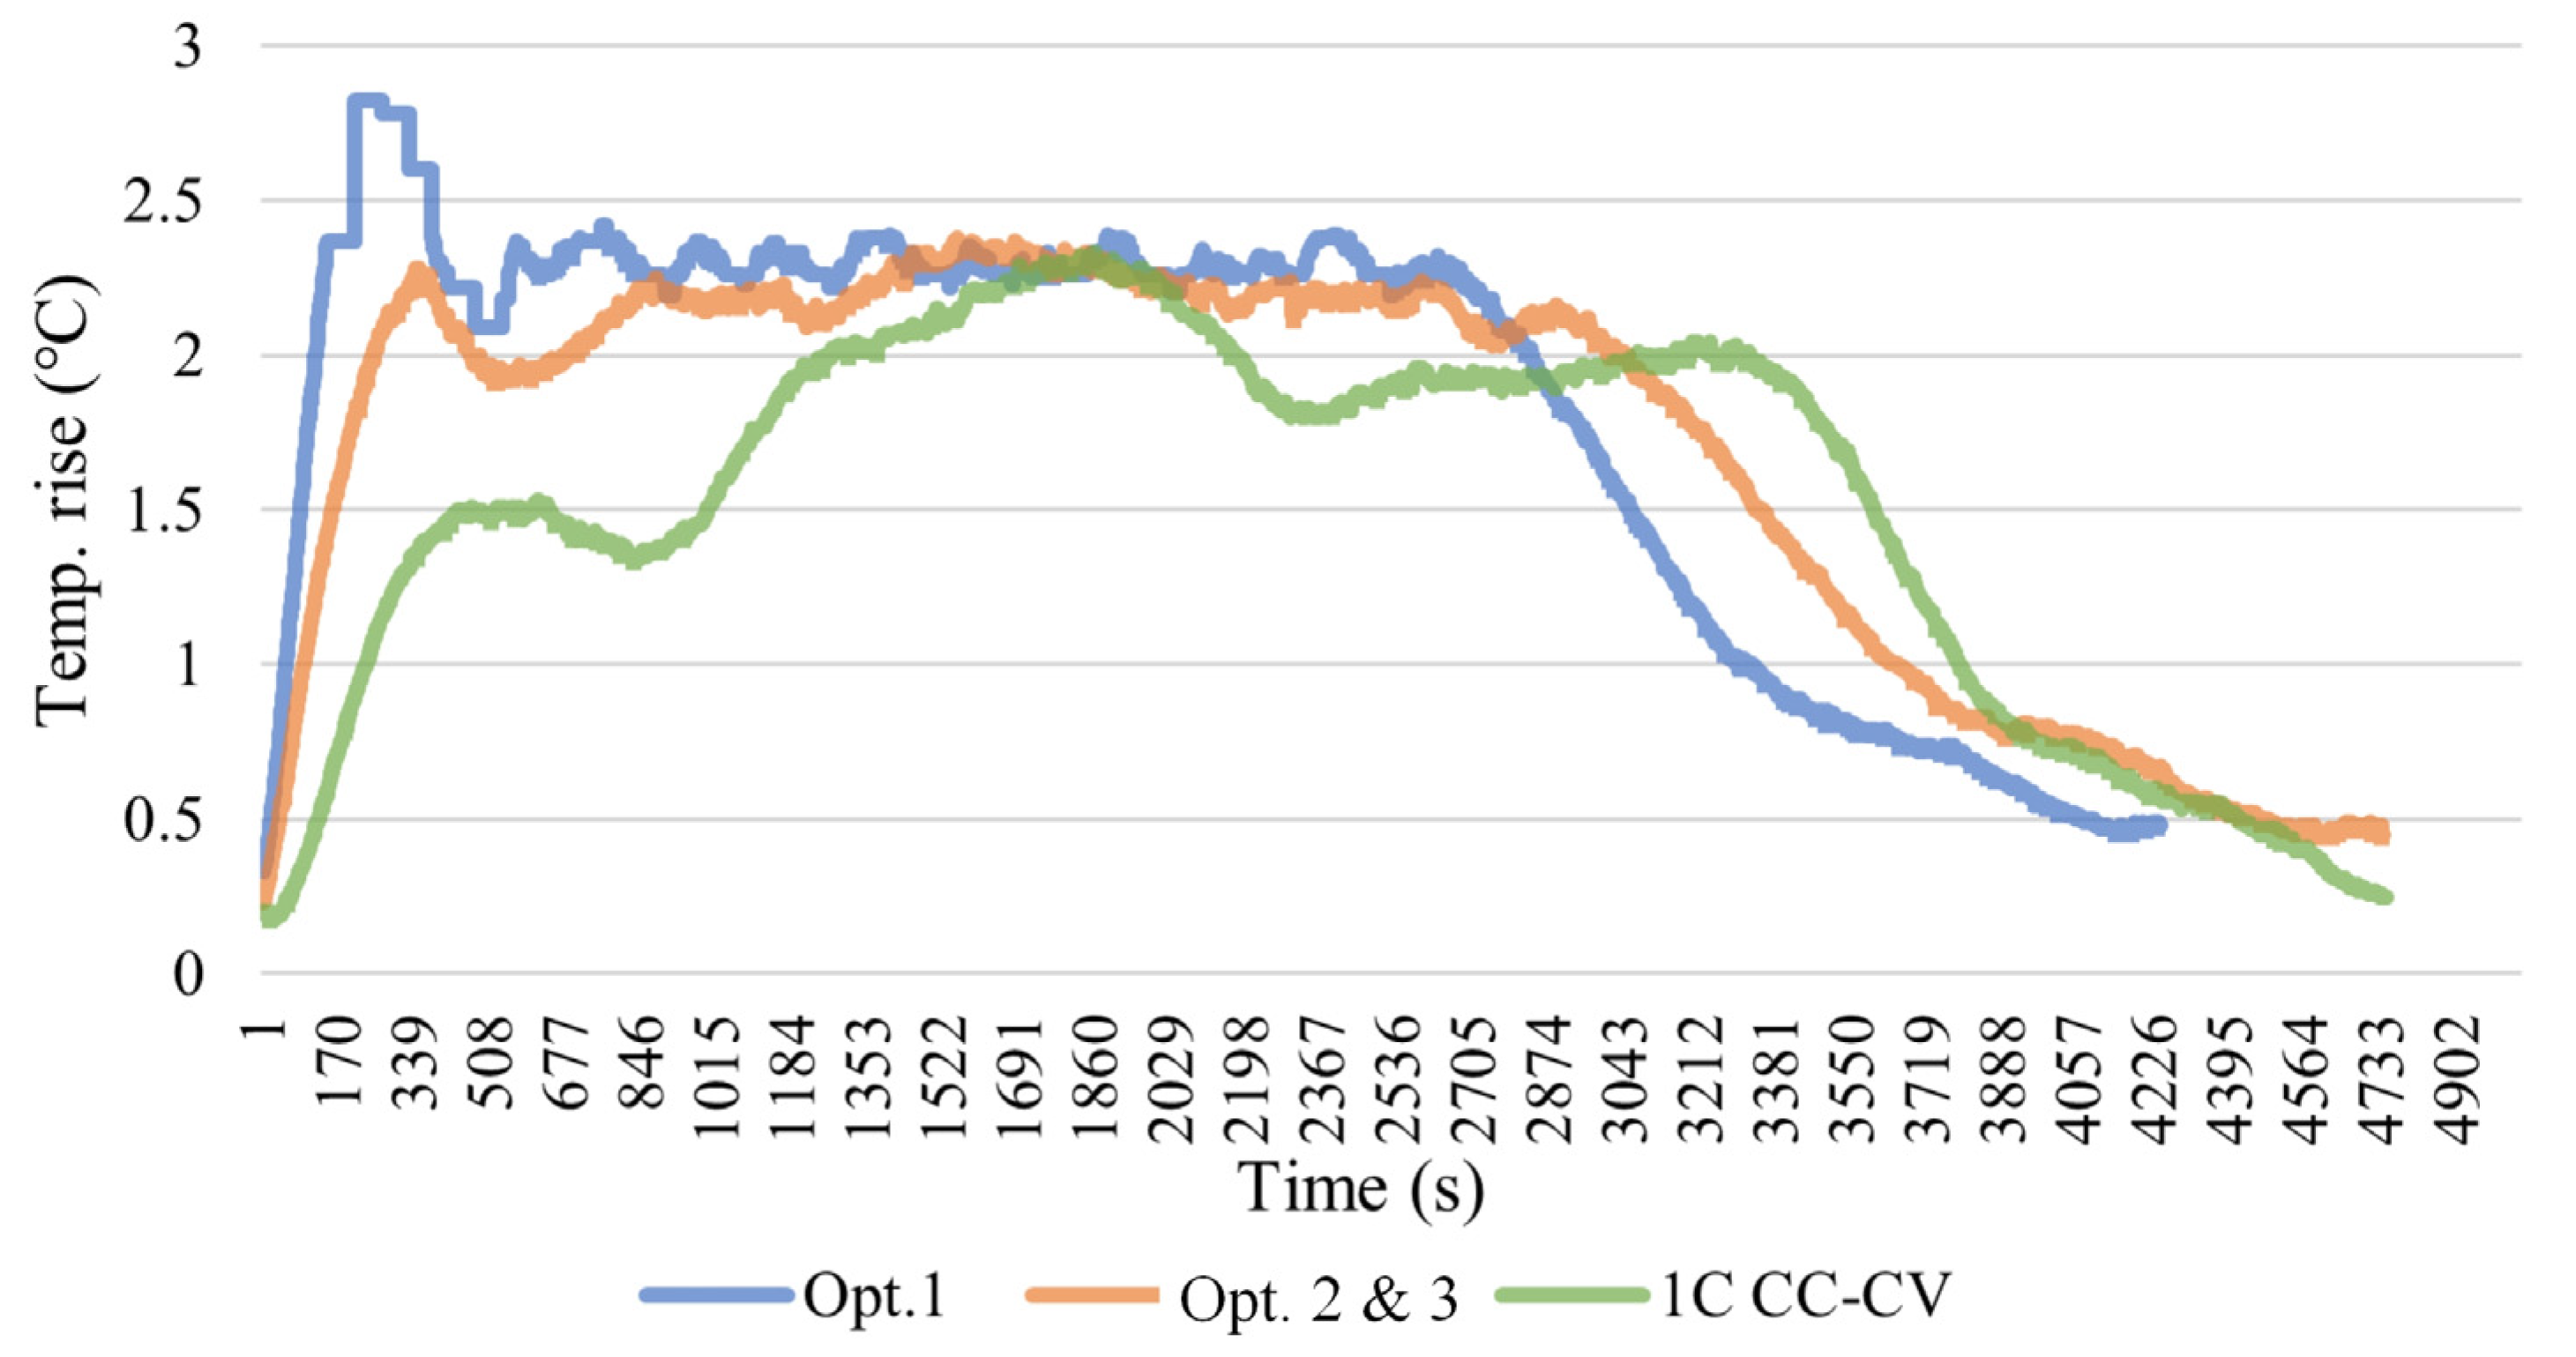
This section compares the optimized CT-CV charging methods with the 1 C CC-CV charging method since the optimum CT-CV methods are designed with a threshold temperature of 24.3 °C, which is also the identical magnitude of the maximum temperature of the 1 C CC-CV charging method. The profiles of the charging current and temperature rise are shown in Figure 15 and Figure 16, respectively. From Figure 16, it is evident that the temperature rises for the Opt. 1 CT-CV method and Opts. 2 and 3 CT-CV method are quite close to the maximum temperature rise of 2.3 °C observed in the 1 C CC-CV method. According to Table 8, the Opt. 1 CT-CV method has a temperature rise of 2.82 °C, which could be derived from the error of the data acquisition system (±0.5 °C) and the challenge of the temperature response time. In addition, it can be observed that compared to the 1 C CC-CV method, Opt. 1 CT-CV is able to reduce the charging time by 10.7%, indicating that using the Opt. 1 CT-CV charging method can effectively shorten the charging time by controlling the temperature rise. On the other hand, the Opt. 2 and Opt. 3 CT-CV methods enable limited improvements in the charging efficiency compared with the 1 C CC-CV method.

5. Conclusions

In this study, we conducted various charging experiments on lithium-ion batteries using the LabVIEW platform. The experiments mainly focused on the investigation of the CT-CV charging method, aiming to work out the appropriate setting of the charging parameters. Unlike the CC-CV method, where a constant current is applied, the concept of the CT-CV method is to keep the maximum temperature rise the same while shortening the charging time with a larger charging current at the beginning stage of the charging process. This paper first implemented a user-friendly charging experimental platform to efficiently carry out different charging approaches and collect the essential data for further evaluation. Next, three trial cases of CT-CV methods were presented by enumeration to exhibit the effect of key parameters on the charging performance at the initial stage. Then, through the application of the Taguchi method, it was possible to identify the optimal combinations of parameters for CT-CV methods with different objectives. Compared to the 1C CC-CV method, the Opt. 1 CT-CV method is capable of maintaining a similar temperature rise and efficiency while achieving 10.7% shorter charging time. Finally, this paper gives a clear overview of designing a CT-CV method and shows the effectiveness of optimized CT-CV methods.

Author Contributions

Conceptualization, Y.-S.C. and S.-F.L.; methodology, K.-C.H.; software, S.-F.L.; validation, S.-F.L., K.-C.H., and Y.-S.C.; formal analysis, S.-F.L.; investigation K.-C.H.; resources, Y.-S.C. and K.-C.H.; data curation, K.-C.H.; writing—original draft preparation, Y.-S.C.; writing—review and editing, K.-C.H.; visualization, S.-F.L.; supervision, Y.-S.C.; project administration, Y.-S.C.; funding acquisition, Y.-S.C. All authors have read and agreed to the published version of the manuscript.

Funding

This work was supported by National Science and Technology Council (NSTC), Taiwan. (Project code: MOST 110-2222-E-019-005-MY3 and NSTC 112-2634-F-019-001).

Data Availability Statement

All collected data are presented in the manuscript.

Acknowledgments

The authors are thankful for Yi-Hua Liu’s great support of this research.

Conflicts of Interest

The authors declare no conflicts of interest.

References

  1. Jeudy-Hugo, S.; Re, L.L.; Falduto, C. Understanding Countries’ Net-Zero Emissions Targets; OECD Publishing: Paris, France, 2021. [Google Scholar]
  2. Raugei, M.; Peluso, A.; Leccisi, E.; Fthenakis, V. Life-Cycle Carbon Emissions and Energy Implications of High Penetration of Photovoltaics and Electric Vehicles in California. Energies 2021, 14, 5165. [Google Scholar] [CrossRef]
  3. Armenta-Deu, C.; Coulaud, T. Control Unit for Battery Charge Management in Electric Vehicles (EVs). Future Transp. 2024, 4, 429–449. [Google Scholar] [CrossRef]
  4. Xie, Y.; Song, Z.; Yue, H.; Fan, Y.; Yu, M.; Li, H.; Zhang, Y. A Self-Adaptive Multistage Constant Current Fast-Charging Strategy for Lithium-Ion Batteries Integrating Cooling Strategy. IEEE J. Emerg. Sel. Top. Power Electron. 2024, 12, 95–106. [Google Scholar] [CrossRef]
  5. Shen, W.; Vo, T.T.; Kapoor, A. Charging algorithms of lithium-ion batteries: An overview. In Proceedings of the 7th IEEE Conference on Industrial Electronics and Applications (ICIEA), Singapore, 18–20 July 2012; pp. 1567–1572. [Google Scholar] [CrossRef]
  6. Gonzalez-Saenz, J.; Becerra, V. Determining Fast Battery Charging Profiles Using an Equivalent Circuit Model and a Direct Optimal Control Approach. Energies 2024, 17, 1470. [Google Scholar] [CrossRef]
  7. Gonzalez-Saenz, J.; Becerra, V. Determination of Fast Battery-Charging Profiles Using an Electrochemical Model and a Direct Optimal Control Approach. Batteries 2024, 10, 2. [Google Scholar] [CrossRef]
  8. Wang, B.; Min, H.; Sun, W.; Yu, Y. Research on Optimal Charging of Power Lithium-Ion Batteries in Wide Temperature Range Based on Variable Weighting Factors. Energies 2021, 14, 1776. [Google Scholar] [CrossRef]
  9. Wang, S.-C.; Zhang, Z.-Y. Research on Optimum Charging Current Profile with Multi-Stage Constant Current Based on Bio-Inspired Optimization Algorithms for Lithium-Ion Batteries. Energies 2023, 16, 7641. [Google Scholar] [CrossRef]
  10. Patnaik, L.; Praneeth, A.V.J.S.; Williamson, S.S. A Closed-Loop Constant-Temperature Constant-Voltage Charging Technique to Reduce Charge Time of Lithium-Ion Batteries. IEEE Trans. Ind. Electron. 2019, 66, 1059–1067. [Google Scholar] [CrossRef]
  11. Hans, M.R.; Kalbhage, S.Y.; Nigam, M.K.; Patel, B. Performance Analysis of the Lithium-Ion Batteries using CT-CV Charging Technique. In Proceedings of the 2021 IEEE Mysore Sub Section International Conference (MysuruCon), Hassan, India, 24–25 October 2021; pp. 572–5770. [Google Scholar]
  12. Chen, G.-J.; Liu, C.-L.; Liu, Y.-H.; Wang, J.-J. Implementation of Constant Temperature–Constant Voltage Charging Method with Energy Loss Minimization for Lithium-Ion Batteries. Electronics 2024, 13, 645. [Google Scholar] [CrossRef]
  13. Zheng, D.; Wang, H.; An, J.; Chen, J.; Pan, H.; Chen, L. Real-Time Estimation of Battery State of Charge with Metabolic Grey Model and LabVIEW Platform. IEEE Access 2018, 6, 13170–13180. [Google Scholar] [CrossRef]
  14. Jiménez-Romero, F.J.; González-Jiménez, J.R.; García-Torres, F.; Caballero, Á.; Lara-Raya, F.R. A novel testing equipment based on Arduino and LabVIEW for electrochemical performance studies on experimental cells: Evaluation in lithium-sulfur technology. Measurement 2024, 224, 113922. [Google Scholar] [CrossRef]
  15. Molicel INR-18650-P26A Lithium Ion Battery Specification. Available online: https://www.molicel.com/wp-content/uploads/INR18650P26A-V2-80087.pdf (accessed on 15 April 2024).
  16. Kaleem, A.; Khalil, I.U.; Aslam, S.; Ullah, N.; Al Otaibi, S.; Algethami, M. Feedback PID Controller-Based Closed-Loop Fast Charging of Lithium-Ion Batteries Using Constant-Temperature–Constant-Voltage Method. Electronics 2021, 10, 2872. [Google Scholar] [CrossRef]
  17. Amanor-Boadu, J.M.; Guiseppi-Elie, A.; Sánchez-Sinencio, E. Search for Optimal Pulse Charging Parameters for Li-Ion Polymer Batteries Using Taguchi Orthogonal Arrays. IEEE Trans. Ind. Electron. 2018, 65, 8982–8992. [Google Scholar] [CrossRef]
  18. Lee, C.-H.; Wang, X.-J.; Lin, K.-Y.; Jiang, J.-A. Experiment-Based Determination of the Optimized Current Level to Achieve Multiple Constant Current Charging for Lithium-Ion Batteries. IEEE Trans. Aerosp. Electron. Syst. 2023, 59, 2648–2657. [Google Scholar] [CrossRef]
  19. Lee, C.-H.; Hsu, C.-Y.; Hsu, S.-H.; Jiang, J.-A. Effect of Weighting Strategies on Taguchi-Based Optimization of the Four-Stage Constant Current Charge Pattern. IEEE Trans. Aerosp. Electron. Syst. 2021, 57, 2704–2714. [Google Scholar] [CrossRef]
  20. Jiang, L.; Li, Y.; Huang, Y.; Yu, J.; Qiao, X.; Wang, Y.; Huang, C.; Cao, Y. Optimization of multi-stage constant current charging pattern based on Taguchi method for Li-Ion battery. Appl. Energy 2020, 259, 114148. [Google Scholar] [CrossRef]
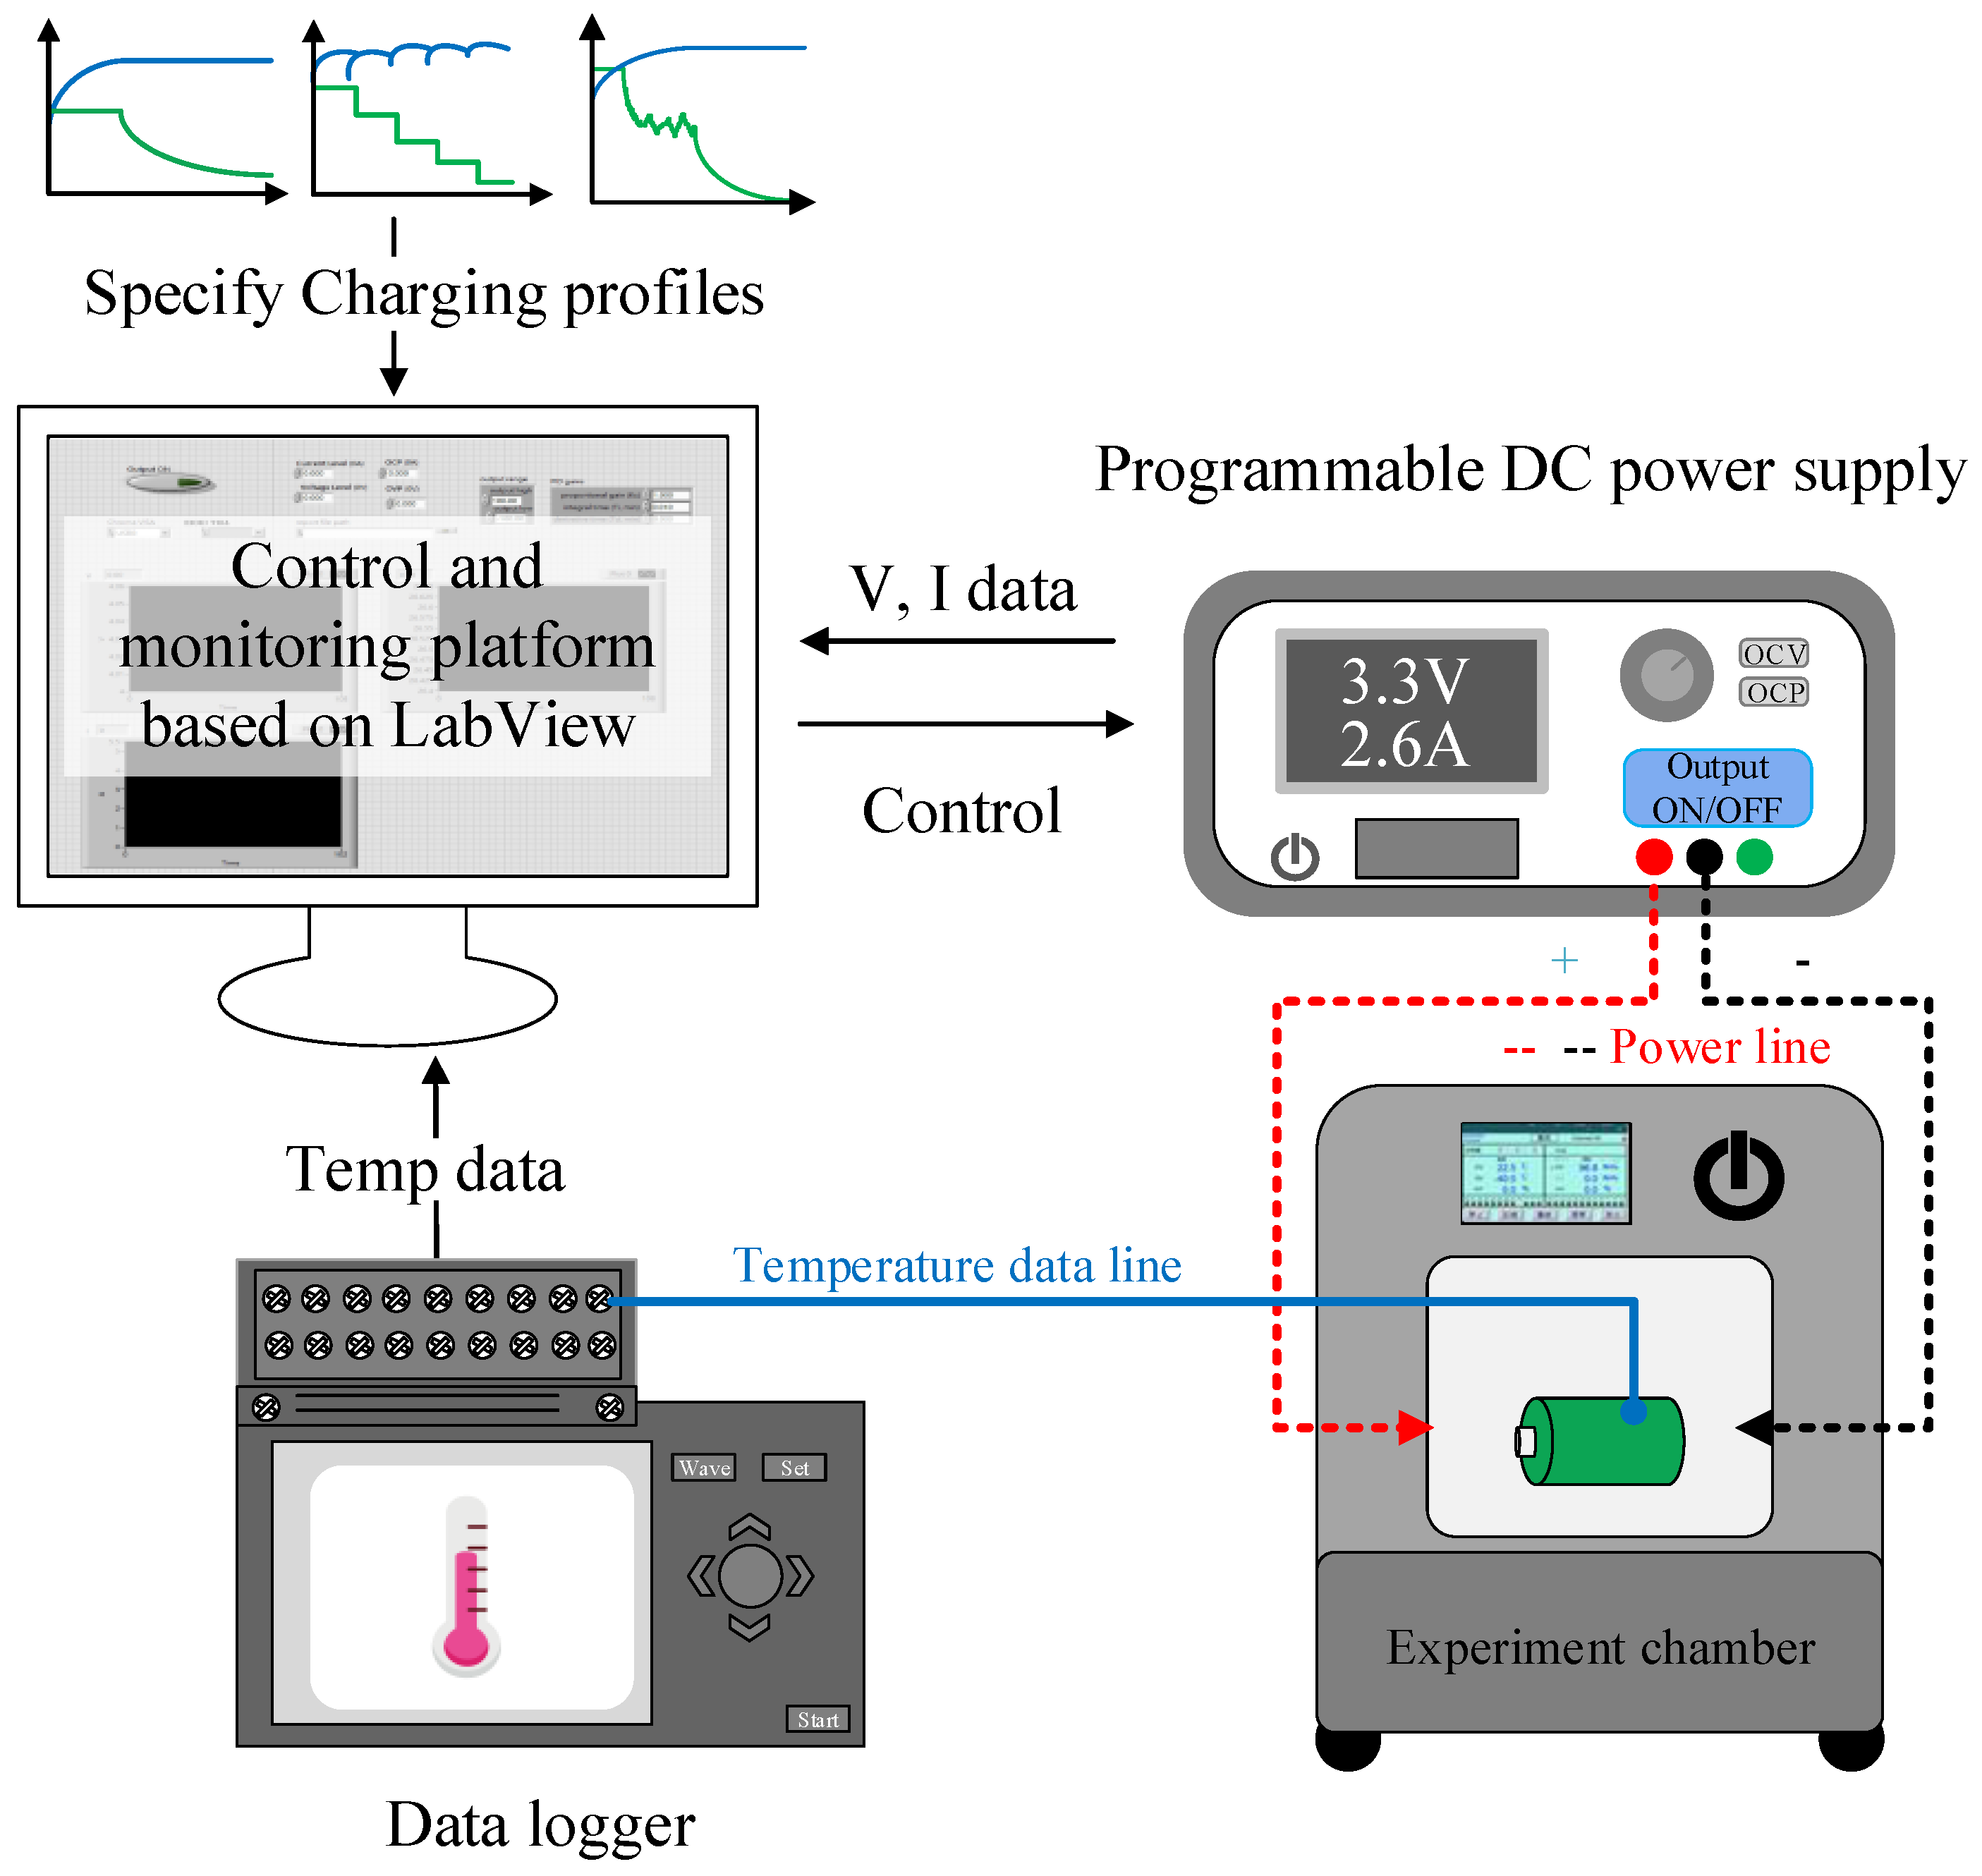
Figure 1. Experimental platform based on LabVIEW to specify charging profiles and record voltage, current and temperature data.
Batteries 10 00211 g001
Figure 2. Illustration of CC-CV and CT-CV method (a) temperature profile (b) charging current waveforms.
Batteries 10 00211 g002
Figure 3. Flowchart of the constant temperature and constant voltage method.
Batteries 10 00211 g003
Figure 4. Charging current waveforms of three trial cases of the CT-CV method.
Batteries 10 00211 g004
Figure 5. Temperature rise profiles of three trial cases of the CT-CV method.
Batteries 10 00211 g005
Figure 6. Voltage, current, and temperature waveforms of the nine experiments from orthogonal array L9.
Batteries 10 00211 g006
Figure 7. The impact of control factors on the charging time.
Batteries 10 00211 g007
Figure 8. The impact of control factors on the charging efficiency.
Batteries 10 00211 g008
Figure 9. The impact of control factors on the average temperature rise.
Batteries 10 00211 g009
Figure 10. The optimum CT-CV waveforms of different charging objectives.
Batteries 10 00211 g010
Figure 11. Photo of experimental setup based on LabVIEW.
Batteries 10 00211 g011
Figure 12. Block diagram and control panel of the LabVIEW (a) connection with the hardware equipment (b) user interface to configure different charging techniques.
Batteries 10 00211 g012
Figure 13. Current profiles of Case 2, Case 3 CT-CV and Case 2, Case 3 CC-CV methods.
Batteries 10 00211 g013
Figure 14. Temperature rise profiles of Case 2, Case 3 CT-CV and Case 2, Case 3 CC-CV methods.
Batteries 10 00211 g014
Figure 15. Current profiles of 1C CC-CV and optimized CT-CV methods.
Batteries 10 00211 g015
Figure 16. Temperature rise profiles of 1C CC-CV and optimized CT-CV method.
Batteries 10 00211 g016
Table 1. Specifications of the battery INR-18650-P26A [15].
MOLICEL INR-18650-P26A Li-Ion Battery
CapacityTypical2600 mAh
Cell VoltageNominal3.6 V
Charge4.2 V
Discharge2.5 V
Charge CurrentStandard2.6 A
Maximum6.0 A
Charge TimeStandard1.5 h
Discharge CurrentMaximum35 A
Ambient TemperatureCharge0~60 °C
Discharge−40~60 °C
Energy DensityVolumetric535 Wh/L
Gravimetric190 Wh/kg
Table 2. Enumeration of the configuration of CT-CV charging methods.
Exp.Case 1Case 2Case 3
Initial current Iinitial1.5 C
(3.9 A)
2 C
(5.2 A)
Imax
(6 A)
Time constant τ200 s1000 s2000 s
PIDKP0.25
KI0.02
KD1
Max. ∆IPID±0.25 A
Table 3. Evaluation metrics of three trial cases of the CT-CV method.
Case 1
CT-CV
Case 2
CT-CV
Case 3
CT-CV
Maximum temp. rise (°C)2.53.225.09
Average temp. rise (°C)1.81.92.58
Charge capacity (mAh)2526.272523.282533.77
Discharge capacity (mAh)2515.122514.202503.38
Efficiency (%)99.699.698.8
Charging time (s)466843423863
Table 4. Control factors and the different levels considered in this paper.
Level
123
FactorsInitial current Iinitial1.5 C (3.9 A)2 C (5.2 A)Imax (6 A)
Time constant τ50 s100 s200 s
Delayed time TD2 s20 s60 s
Limit of ΔIPID0.05 A0.1 A0.25 A
Table 5. Orthogonal array L9 for experiments.
ExperimentInitial Current Iinitial (A)Limit of ΔIPID (A)τ (s)TD (s)
11.5 C (3.9 A)0.05502
21.5 C (3.9 A)0.110020
31.5 C (3.9 A)0.2520060
42 C (5.2 A)0.0510060
52 C (5.2 A)0.12002
62 C (5.2 A)0.255020
7Imax (6 A)0.0520020
8Imax (6 A)0.15060
9Imax (6 A)0.251002
Table 6. Evaluation metrics of CT-CV charging methods from the orthogonal array.
Control FactorsEvaluation Metrics
Initial Current
Iinitial (A)
Limit of ΔIPID (A)τ (s)TD (s)Charging Time
(s)
Charging Efficiency
(%)
Max. Temp. Rise
(°C)
Avg. Temp. Rise
(°C)
11.5 C (3.9 A)0.05502457599.712.351.72
21.5 C (3.9 A)0.110020454299.862.261.74
31.5 C (3.9 A)0.2520060437999.682.311.77
42 C (5.2 A)0.0510060439199.552.561.88
52 C (5.2 A)0.12002440699.452.81.89
62 C (5.2 A)0.255020450499.702.571.87
7Imax (6 A)0.0520020435099.262.951.91
8Imax (6 A)0.15060439599.612.581.88
9Imax (6 A)0.251002442099.432.641.90
Table 7. The corresponding optimum CT-CV charging parameters of different charging objectives.
Iinitial
(A)
∆IPID
(A)
τ
(s)
TD
(s)
Evaluation Indicators
Charging Time (s)Charging Efficiency (%)Average Temperature Rise (°C)
Opt. 1
minimum charging time
Imax (6 A)0.2520060424199.471.90
Opt. 2
maximum efficiency
1.5 C (3.9 A)0.15060473999.891.67
Opt. 3
minimum average temperature rise
Table 8. Comprehensive comparison of various charging methods.
CC-CVCT-CVOptimized
CT-CV
Charging methodCase 1Case 2Case 3Case 1Case 2Case 3Opt. 1
CT-CV
Opt. 2
CT-CV
Constant/initial current1 C (2.6 A)2 C
(5.2 A)
Imax (6 A)1.5 C
(3.9 A)
2 C
(5.2 A)
Imax
(6 A)
Imax
(6 A)
1.5 C
(3.9 A)
Maximum temperature rise (°C)2.334.6910.842.53.225.092.822.30
Average temperature rise (°C)1.52.495.791.81.92.581.901.67
Charging efficiency (%)99.8599.797.399.699.698.899.4799.89
Charging time (s)47473321288646684342386342414739
Disclaimer/Publisher’s Note: The statements, opinions and data contained in all publications are solely those of the individual author(s) and contributor(s) and not of MDPI and/or the editor(s). MDPI and/or the editor(s) disclaim responsibility for any injury to people or property resulting from any ideas, methods, instructions or products referred to in the content.