Article

Thermal Runaway Characteristics and Gas Analysis of LiNi0.9Co0.05Mn0.05O2 Batteries

1
State Key Laboratory of Intelligent Green Vehicle and Mobility, Tsinghua University, Beijing 100084, China
2
College of Locomotive and Rolling Stock Engineering, Dalian Jiaotong University, Dalian 116028, China
3
School of Electrical & Electronic Engineering, Harbin University of Science and Technology, Harbin 150080, China
*
Authors to whom correspondence should be addressed.
Batteries 2024, 10(3), 84; https://doi.org/10.3390/batteries10030084
Submission received: 8 January 2024 / Revised: 22 February 2024 / Accepted: 27 February 2024 / Published: 1 March 2024

Abstract

:
Layered ternary materials with high nickel content are regarded as the most promising cathode materials for high-energy-density lithium-ion batteries, owing to their advantages of high capacity, low cost, and relatively good safety. However, as the nickel content increases in ternary layered materials, their thermal stability noticeably decreases. It is of paramount importance to explore the characteristics of thermal runaway for lithium-ion batteries. In this study, two high-nickel LiNi0.9Co0.05Mn0.05O2 batteries were laterally heated to thermal runaway in a sealed chamber filled with nitrogen to investigate the thermal characteristics and gas compositions. The temperature of the battery tabs was measured, revealing that both batteries were in a critical state of thermal runaway near 120 degrees Celsius. A quantitative analysis method was employed during the eruption process, dividing it into three stages: ultra-fast, fast, and slow; the corresponding durations for the two batteries were 3, 2, 27 s and 3, 3, 26 s. By comparing the changes in chamber pressure, it was observed that both batteries exhibited a similar continuous venting duration of 32 s. However, the pressure fluctuation ranges of the two samples were 99.5 and 68.2 kPa·m·s−1. Compared to the other sample, the 211 Ah sample exhibited larger chamber pressure fluctuations and reached higher peak pressures, indicating a higher risk of explosion. In the experimental phenomenon captured by a high-speed camera, it took only 1 s for the sample to transition from the opening of the safety valve to filling the experimental chamber with smoke. The battery with higher energy density exhibited more intense eruption during thermal runaway, resulting in more severe mass loss. The mass loss of the two samples is 73% and 64.87%. The electrolyte also reacted more completely, resulting in a reduced number of measured exhaust components. The main components of gaseous ejections are CO, CO2, H2, C2H4, and CH4. For the 211 Ah battery, the vented gases were mainly composed of CO (41.3%), CO2 (24.8%), H2 (21%), C2H4 (7.4%) and CH4 (3.9%), while those for the other 256 Ah battery were mainly CO (30.6%), CO2 (28.5%), H2 (21.7%), C2H4 (12.4%) and CH4 (5.8%). Comparatively, the higher-capacity battery produced more gases. The gas volumes, converted to standard conditions (0 °C, 101 kPa) and normalized, resulted in 1.985 L/Ah and 2.182 L/Ah, respectively. The results provide valuable guidance for the protection of large-capacity, high-energy-density battery systems. The quantitative analysis of the eruption process has provided assistance to fire alarm systems and firefighting strategies.

1. Introduction

Lithium-ion batteries (LIBs) are widely used in portable electronic devices, electric vehicles, energy storage systems, and other fields. However, during their usage, especially under abuse conditions such as high temperatures, overcharging, over-discharging, and mechanical damage, there is a risk of thermal runaway (TR) [1,2,3]. This refers to the potential scenario where a lithium-ion battery (LIB) may experience a violent exothermic reaction internally, leading to a loss of control and, in severe cases, causing fires or explosions. Therefore, the study of TR characteristics and gas generation in LIBs holds significant background and importance [4,5]. It is conducive to formulating more scientifically sound safety designs and usage strategies, thereby enhancing the safety performance of LIBs [6,7].
Firstly, the TR of LIBs poses a potential threat to the environment. Large-scale applications of LIBs in electric vehicles and energy storage systems may lead to significant environmental and ecological impacts in the event of a TR incident [8]. This could result in air and water pollution, presenting a potential threat to ecosystems and human health. Therefore, conducting in-depth research on the characteristics and gas generation of tTR in LIBs is beneficial for mitigating potential harm to the environment and promoting the development of sustainable energy storage technologies.
Moreover, research on the TR of LIBs offers valuable insights for addressing the challenges of energy transition and sustainable development. LIBs, as a critical energy storage technology, find widespread applications in electric vehicles and renewable energy systems and play a pivotal role in driving the adoption of clean energy. However, the safety and reliability of LIBs are essential considerations for achieving a sustainable energy transition. Investigating the TR issues associated with LIBs can help mitigate potential safety risks, providing more reliable and secure solutions for the widespread adoption of LIBs in sustainable energy systems [9].
The triggering conditions for battery TR primarily involve three aspects: electrical abuse, thermal abuse, and mechanical abuse [10]. These three aspects share a common TR trigger: an internal short circuit, which is also a primary cause of battery failure. During TR, batteries experience a phenomenon known as capacity degradation before internal heat generation, referred to as high-temperature self-discharge [11], following this, the initial heat generation occurs due to the decomposition of the Solid Electrolyte Interphase (SEI) [12]; as a result of SEI decomposition, the negative electrode comes into direct contact with the electrolyte, initiating a reaction and forming an irregular SEI [13], this leads to a continuous reaction between the negative electrode and the electrolyte, causing the internal temperature of the battery to rise until it reaches the melting point of the separator [14], the melting of the separator induces an endothermic reaction, slowing down or even reducing the rate of temperature increase within the battery. Following the melting of the separator, an internal short circuit occurs, leading to jelly roll failure and the release of a significant amount of heat. At this point, various chemical reactions occur simultaneously, such as positive electrode decomposition and electrolyte decomposition. The electrolyte decomposition generates a substantial amount of gas [15], resulting in an increase in internal gas pressure. The battery swells, and upon reaching a certain threshold, the safety valve opens, releasing high-pressure gas [16], the expelled gas contains combustible components. In the presence of oxygen in the environment and encountering an ignition source, it can lead to a severe combustion reaction [17]. In recent research, it has been discovered that TR can occur even in the absence of internal short circuits. The positively charged electrode material undergoes a phase transition at around 250 °C, releasing reactive oxygen species that react with the negative electrode [18,19]. Therefore, the significant heat generated by the oxidation–reduction reactions of the positive and negative electrodes could potentially be a direct cause of TR, not solely due to internal short circuits [20,21].
In summary, the research background and significance of TR in LIBs primarily lie in enhancing the safety of LIBs, reducing potential environmental hazards, advancing battery technology, and promoting sustainable energy transition. An in-depth study of the mechanisms and patterns of TR in LIBs can provide a scientific basis for battery design, production, usage, and management [22]. This, in turn, enables the optimal utilization of LIBs as a crucial energy storage technology, expanding their applications across various domains and facilitating the realization of sustainable energy and sustainable development goals.
Feng X. et al. provided an overview of the mechanisms of TR in LIBs used in electric vehicles, summarizing the abusive conditions that may lead to TR [23]. N.E. Galushkin analyzed the mechanism of TR in LIBs and found that the cause of TR in LIBs is the strong exothermic reaction of atomic hydrogen accumulated in the anode graphite during the battery cycling process [24]. Shen H. et al. compared the TR characteristics of LIBs with different cathode materials and analyzed their gas generation characteristics. They found that the gas composition of high-nickel LiNi0.9Co0.05Mn0.05O2 batteries is the most hazardous compared to other systems [25]. JH Kim compared the TR characteristics between NCM and LFP batteries and found that, compared to NCM, LFP batteries exhibit a delayed time to reach the maximum temperature during TR due to their higher thermal stability [26]. Sascha K. and his team conducted TR experiments on 51 batteries in a gas-tight container and analyzed their mass loss characteristics as well as gas compositions [27]. Yuan L. et al. conducted multiple TR temperature and gas generation characteristic tests on four batteries using ARC and found that the main gas concentrations in the emitted gases depend mainly on the chemical properties of the battery [28]. Zhang Q. et al. analyzed the effect of different state-of-charges (SOCs) on the gas composition generated by the battery and found that batteries at 100% (state-of-charge) SOC generate a large amount of unsaturated hydrocarbons, which pose a higher thermal hazard [29].
High-nickel layered ternary materials, as positive electrode materials for lithium-ion batteries possess numerous advantages, such as high energy density, excellent cycling stability, outstanding power performance, high resource utilization efficiency, and environmental friendliness. For batteries, the typical hazards resulting from TR are often associated with the nickel content in the positive electrode material [30,31] and the initial SOC [32], pouch cells and cylindrical cells without safety valves pose increased risks in the event of TR [33]. A higher Ni content leads to an increase in capacity, as Ni serves as the primary redox material in the core structure; the thermal stability of Li[Ni1−x−yCoxMny]O2 is directly related to the Ni content; Mn ensures excellent cycle life and safety and Co increases electronic conductivity [31]. For the same positive electrode material at different SOCs, as the SOC increases, the onset temperature of self-heating reactions shifts towards lower temperatures. Additionally, the self-heating rate exponentially increases, especially beyond 50% SOC, significantly affecting the thermal instability [34].
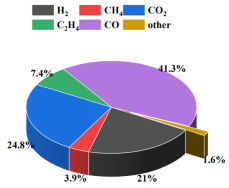
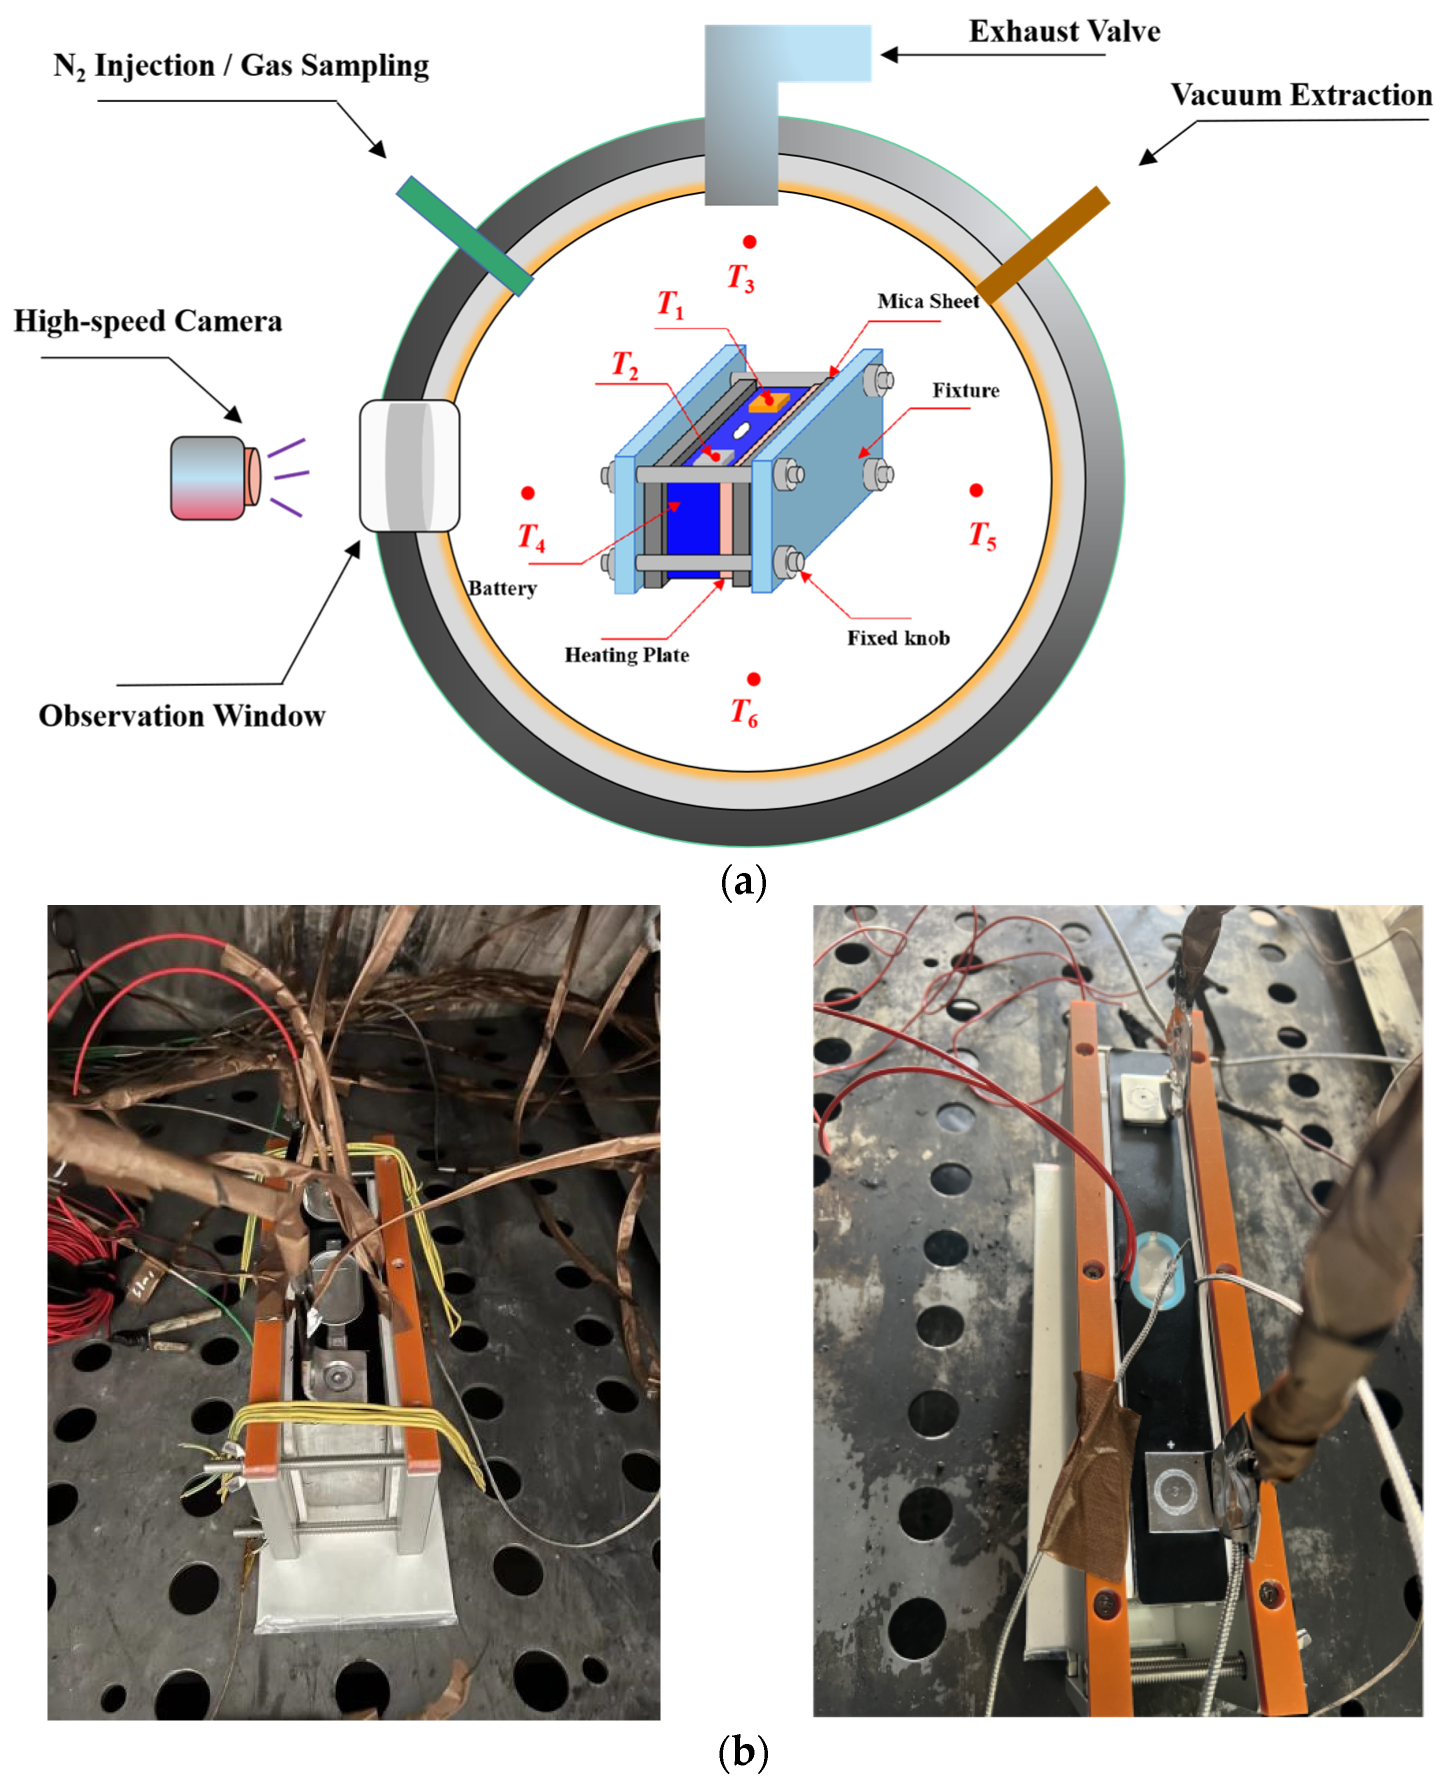
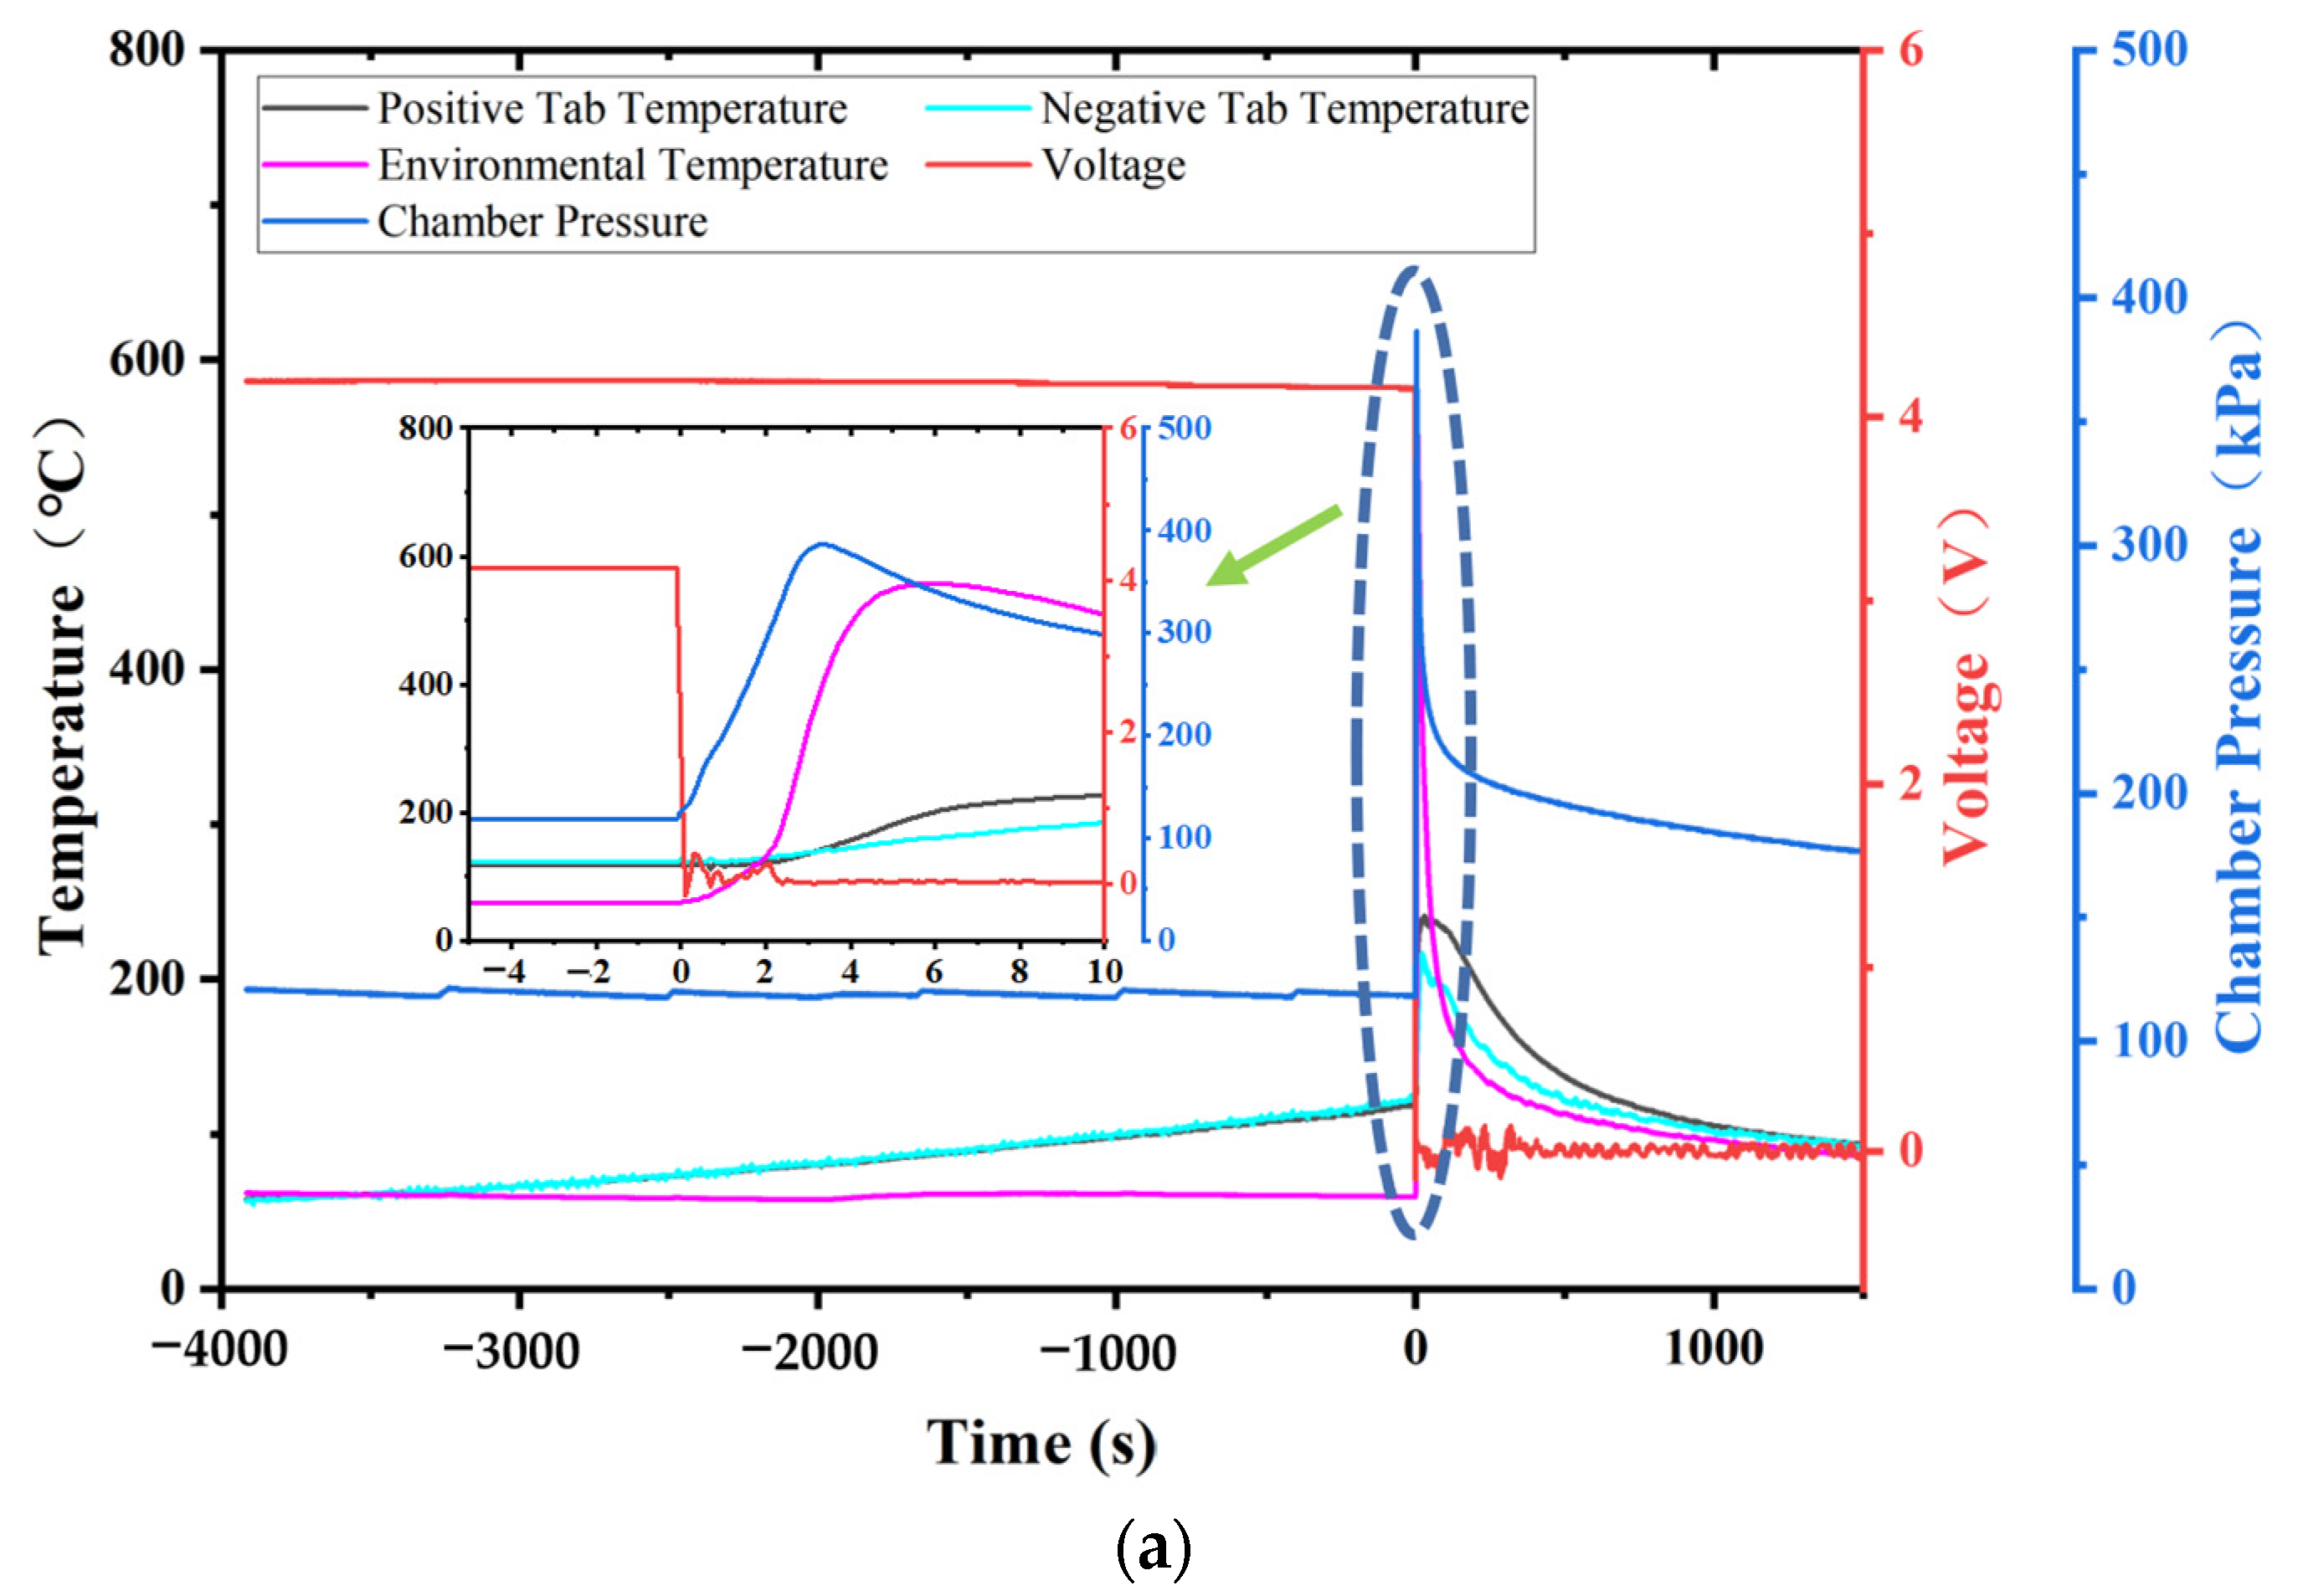
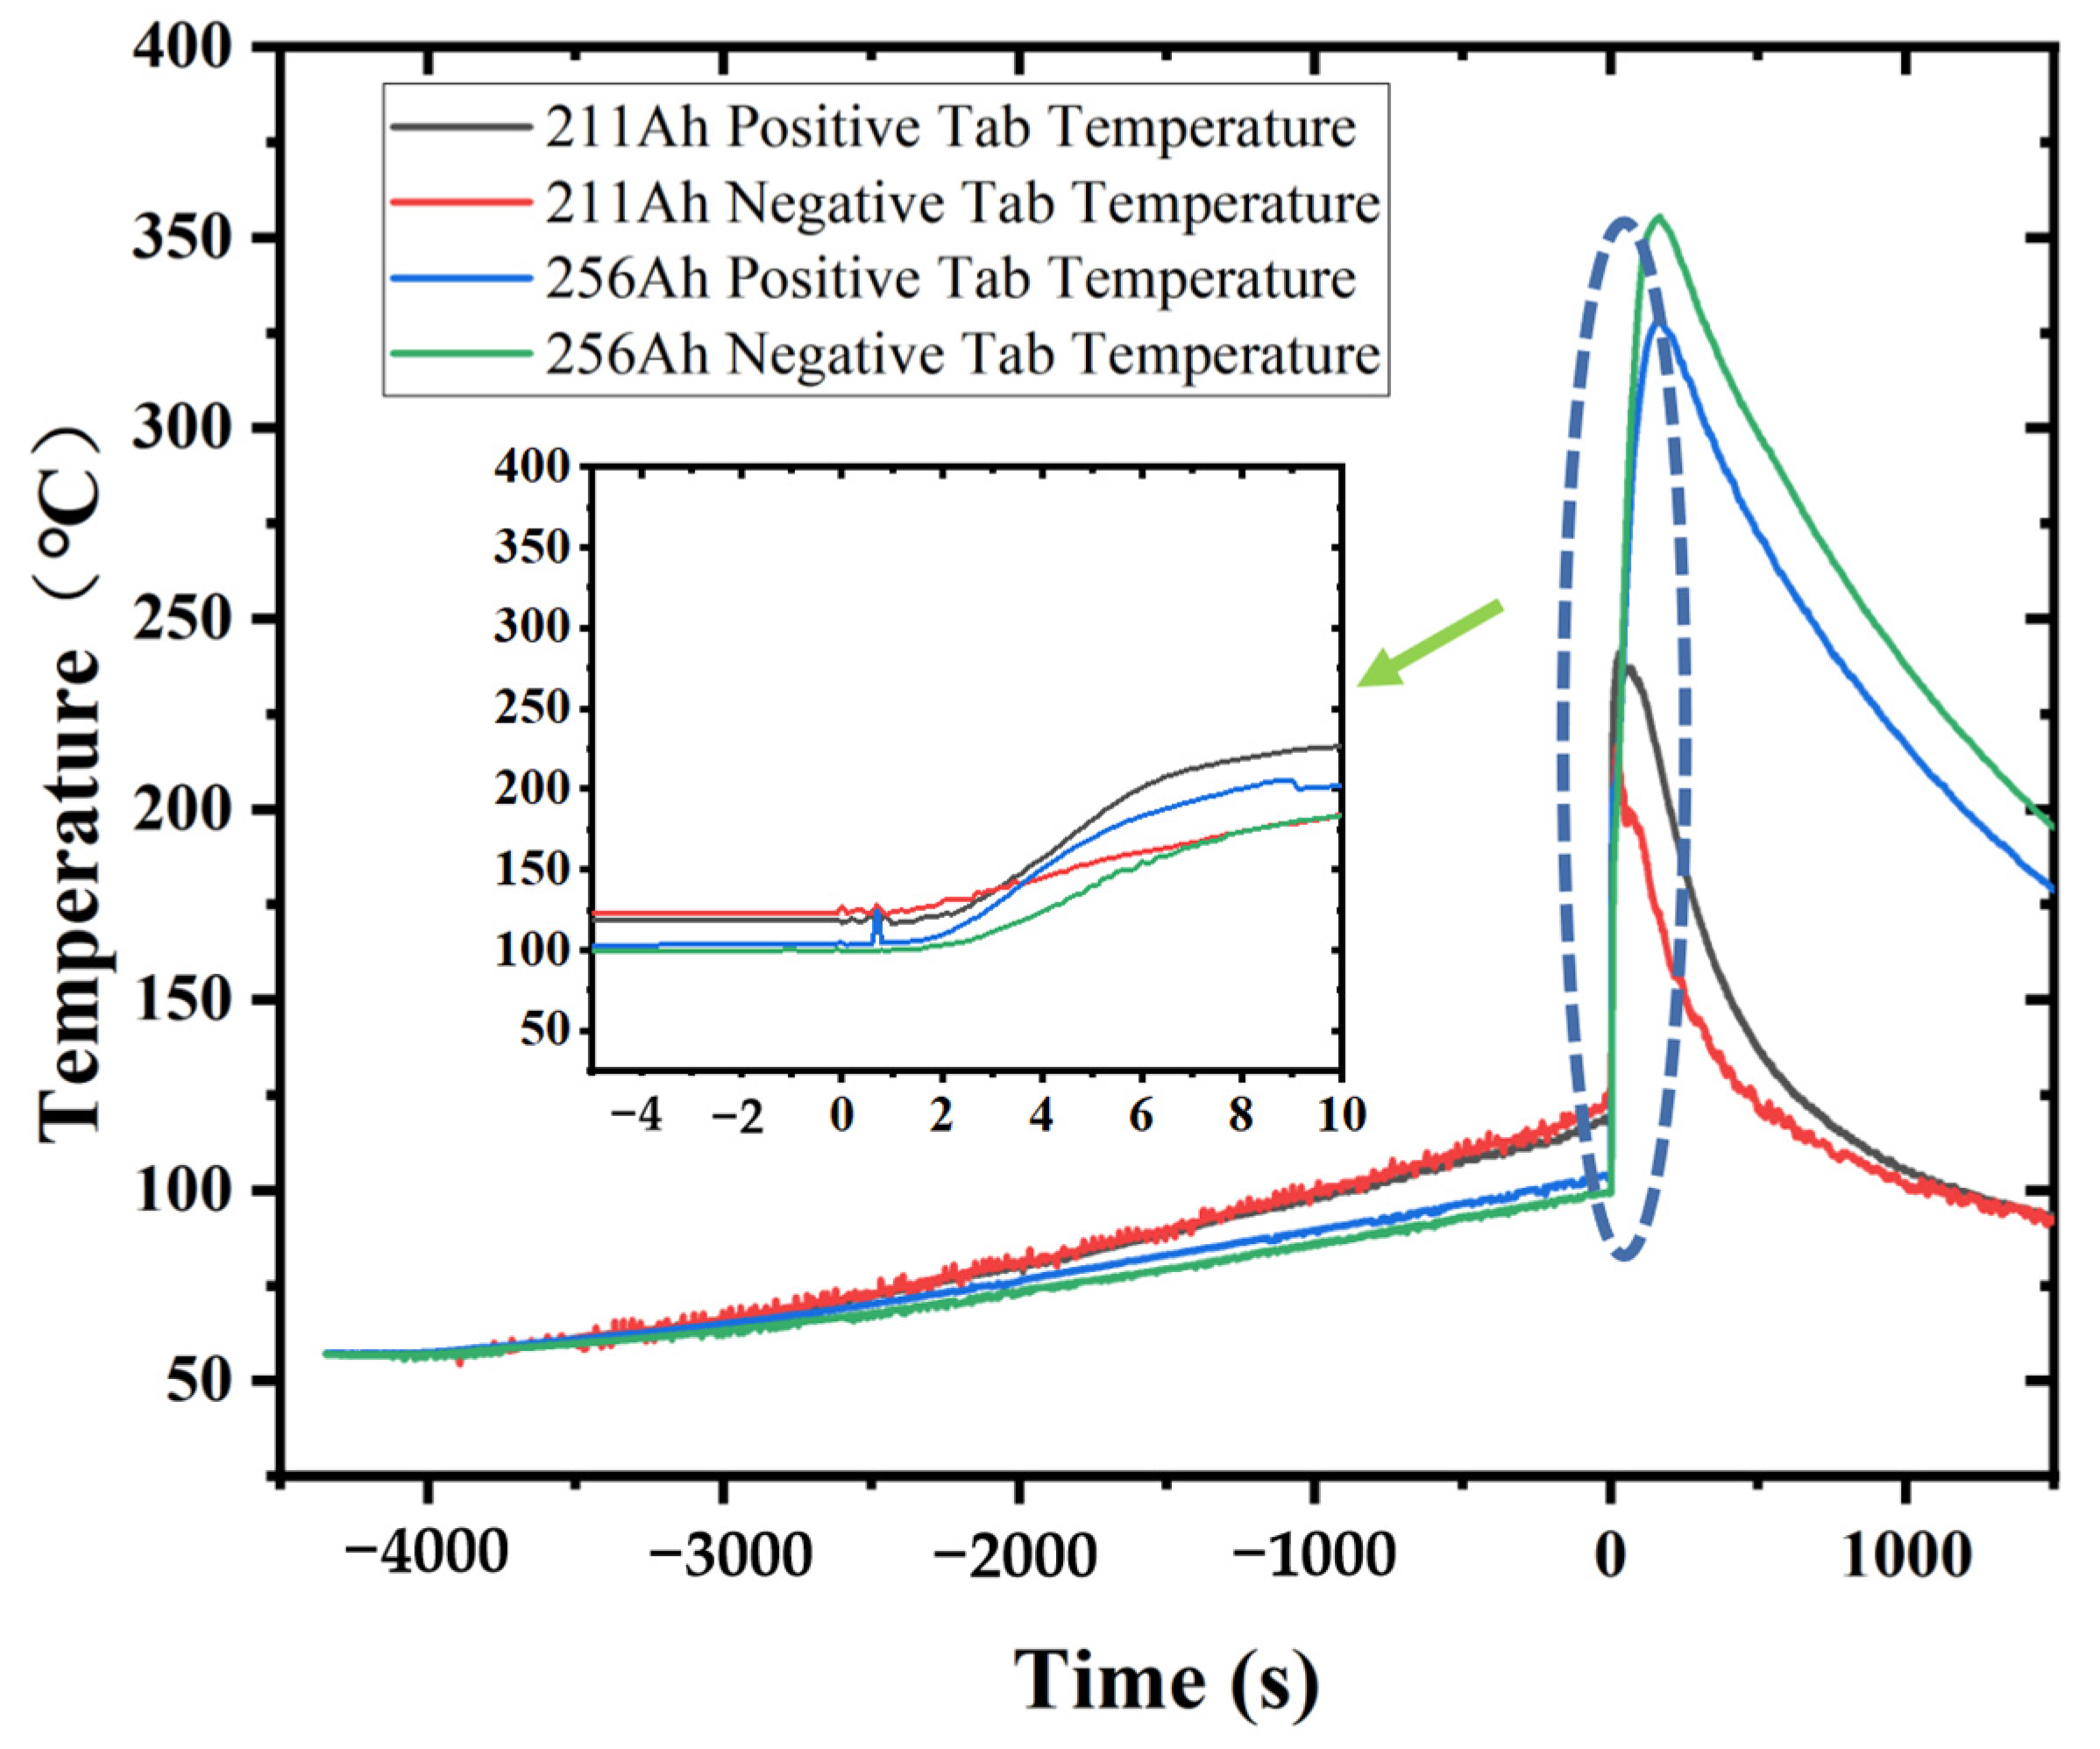
Currently, most research focuses on small-capacity batteries like the 18650 and batteries with lower energy density. There is relatively less research on high-nickel NCM 9-series and high-capacity batteries. Quantitative analysis of battery venting processes remains unclear. The research primarily concentrates on comparative analyses of TR characteristics among various battery systems or comparative analyses of different TR triggering mechanisms. This study involved two different high-nickel NCM9 0.5 0.5 lithium-ion batteries with varying capacities and energy densities. In a sealed chamber, TR was induced through lateral heating within an inert gas environment. The study monitored temperature changes at the electrode tabs during the TR process, along with variations in battery voltage and chamber pressure. High-speed cameras were used to record the TR phenomenon. It was observed that the critical temperature for TR at the electrode tabs was roughly the same for both batteries. However, the higher energy density sample exhibited significantly more intense venting during the TR process. The study employed a quantitative analysis of venting processes to compare the venting characteristics during the TR of the two batteries. Both batteries exhibited similar venting durations, but the higher energy density battery showed significantly higher fluctuations in its venting curve. Finally, the gases vented during the TR were collected and subjected to gas composition analysis.

2. Experimental Setup

2.1. Battery Samples

The two selected samples for this experiment are both batteries with LiNi0.9Co0.05Mn0.05O2 as the cathode material. Their capacities are 211 Ah and 256 Ah, respectively, with the anode primarily composed of graphite. For ease of expression, the following will use Sample A and Sample B to represent the two batteries. In this experiment, both battery samples were subjected to three charge and discharge cycles at a rate of 1/3 C. The charge and discharge cutoff voltages are specified in Table 1. The specific parameters of the battery samples are outlined in Table 1 below:

2.2. Experimental Setup

A 1000 L sealed container filled with nitrogen was employed to carry out TR tests and facilitate the collection of gases generated after the TR of the samples. The container is equipped with two wires, two pressure sensors, and multiple K-type thermocouples. The two wires are used for real-time monitoring of battery voltage, the pressure sensors are used for real-time monitoring of pressure changes inside the chamber, and the thermocouples are used to monitor environmental temperature inside the chamber and surface temperature changes of the samples during TR. Sensors are connected to a high-speed data acquisition system to collect experimental data with a sampling frequency of 10 Hz. The chamber door is hydraulically rotated and fixed to achieve sealing. Vacuum and nitrogen-filling pipelines are provided to create an inert atmosphere for the experiments. An observation window is located on the side of the equipment, allowing real-time observation of the experimental situation inside the chamber. A high-speed camera is placed outside the observation window to record the moment of battery ejection. The structure of the experimental chamber is shown in Figure 1. After the experiment, gases are collected and analyzed using a gas chromatograph. The gas analysis equipment used in the experiment is the Thermo Fisher Scientific gas chromatograph Trace 1300 (Country of origin and manufacturer: Thermo Fisher, Singapore), equipped with four detectors and eight chromatographic columns.

2.3. Testing Procedure

The aim of this study was to investigate the TR characteristics and gas analysis of lithium-ion batteries with the same cathode material but different capacities. The TR was triggered by applying lateral heating to the battery using a heating plate with the same power.
The experimental procedure was as follows:
(a)
The examined battery was fully charged; the voltage and weight of the battery were recorded before the experiment;
(b)
Place the battery at the center of the chamber on a fixed plate. Two thermocouples (T1, T2) were adopted to monitor the temperature variations of the positive and negative tabs during the experiment. Another four thermocouples (T3–T6) were evenly fixed in the chamber in the up, down, left, and right directions to monitor the ambient temperature inside the chamber;
(c)
The heating plate was positioned on one side of the battery to apply heat. Mica boards were placed on the outer side of the heating plate and the opposite side of the battery’s larger surface to prevent heat loss. Clamps were used on the outermost side as fixtures to secure the setup. The wires were connected to the battery terminals to monitor voltage changes throughout the experiment;
(d)
After closing the chamber door, a vacuum was drawn, N2 was injected to restore normal pressure, and this sequence was repeated multiple times to ensure an inert gas atmosphere;
(e)
A high-speed camera was placed outside the observation window to capture the eruptive state during TR;
(f)
The data logger was initiated to gather data from the battery voltage, thermocouples, and pressure sensors. The heating plate was activated until the battery experienced TR, subsequently, the heating plate was deactivated.
After the experiment concluded, a period of stillness was observed until the gases inside the chamber stabilized, and the particles settled. The gases were collected from the chamber and the gas composition was analyzed using a gas chromatograph for both battery samples. Additionally, any particles and remaining battery debris were collected for weighing, and conducting an analysis of the mass loss.

3. Results and Discussion

3.1. The TR Characteristics of Batteries with Different Capacities

At elevated temperatures, the initial heat generation in the battery arises from the decomposition of the SEI membrane at the anode/electrolyte interface. This is followed by heat absorption by the separator, the heat released from the exothermic reaction at the anode/electrolyte interface, and further heat generation from the decomposition of the SEI membrane at the anode/electrolyte interface. The heat primarily originates from reactions between the anode’s active material and the electrolyte, with the decomposition reaction of the cathode’s active material ultimately releasing a significant amount of heat [35]. To ensure the accuracy of the chamber’s environmental temperature during the experiment, the average value of the four environmental temperatures arranged was taken to represent the temperature inside the chamber. Taking the moment of TR initiation as “0” time, and considering the voltage drop as the trigger time for TR, heating by the heating plate was stopped after the TR was triggered. Figure 2 illustrates the variations in tab temperature and voltage of the two batteries, as well as the changes in environmental temperature and chamber pressure inside the experiment chamber.
In the temporal sequence of reactions occurring within the battery’s internal structure as temperature changes, the metastable components of the SEI film undergo exothermic decomposition between 70 and 90 degrees. Between 90 and 260 degrees, three simultaneous chemical reactions occur, including the melting of the SEI and the decomposition of various positive electrode materials, which may result in internal short circuits between electrodes. Electrolyte decomposition occurs between 200 and 300 degrees [25]. Christensen et al. conducted thermal abuse and mechanical abuse experiments on battery modules, observing trends similar to those depicted in Figure 2. However, due to differences in the triggering mechanisms between their experiment and ours, the curves exhibit less fluctuation compared to theirs [36]. The differences in the triggering mechanisms for thermal runaways result in varying characteristics of thermal runaways as well.
The initial temperature of the batteries was 30 °C, with initial voltages of 4.2 V and 4.3 V, respectively. The batteries were heated from one side, causing the battery temperature and tab temperatures to gradually rise. For Sample A, it took 3916 s to turn on the heating plate to reach the TR triggering condition. The critical temperature for TR is defined as a temperature change rate of 1 °C/s. The temperature of the positive tab rose to 119 °C, and the negative tab rose to 123 °C. The voltage stabilized at 4.16 V, and then the battery underwent TR, with the voltage rapidly dropping to 0 V. Following this, the temperatures of both tabs rose rapidly. The highest temperature inside the chamber reached 557.5 °C, and the highest pressure inside the chamber reached 386.5 kPa. For Sample B, it took 4346 s, from turning on the heating plate to reaching the TR triggering condition. The temperature of the positive tab rose to 110.9 °C, and the temperature of the negative tab rose to 108.4 °C. The voltage experienced a slight decrease when there was a sudden rise in temperature and pressure, and then TR occurred, with the voltage dropping to 0 V. The temperatures of both tabs rose rapidly. The pressure inside the chamber and the environmental temperature rose rapidly before the voltage dropped, indicating that the battery’s safety valve opened before the battery failed. The reason for the difference from the phenomenon observed in sample A, where the voltage dropped before the valve opening, might be due to an initial TR occurring in a specific part of the battery core. This led to an increase in internal pressure, causing the safety valve to open. As the reaction intensified further, the entire core failed, resulting in a complete TR and the voltage dropping to 0 V. The highest temperature inside the chamber reached 409.86 °C, and the highest pressure inside the chamber was 330.5 kPa. For Sample A, the highest temperature of the positive tab was 241 °C, and the highest temperature of the negative tab was 217 °C. For Sample B, the highest temperature of the positive tab was 328 °C, and the highest temperature of the negative tab was 355.5 °C. Table 2 shows the key temperature points for two samples. Figure 3 shows the temperature changes of the positive and negative tabs during the test.
To investigate the TR spray process of these two batteries, a quantitative analysis method proposed by Zhang et al. for the spray process in LIBs was employed. The LIB spray process was divided into the ultra-fast spray stage, fast spray stage, and slow spray stage. Based on the calculation formula for the explosion index Kg, as shown in Equation (1), the normalized pressure rise rate KLIB during the LIBs spray process was obtained as the spray index, as shown in Equation (2). Four typical times were defined:
  • The time corresponding to the rapid rise of KLIB is defined as the start time of the spray (te);
  • The time corresponding to KLIB,max is defined as the end time (tu) of the ultra-fast burst;
  • The time when KLIB changes from positive to negative is defined as the end time (tf) of the fast spray;
  • The time when KLIB returns to the initial fluctuation state before the burst is defined as the end time (ts) of the slow burst.
The durations corresponding to the above critical times are defined as follows:
  • The time interval from te to tu is referred to as the duration of the ultra-fast burst (Du);
  • The time interval from tu to tf is referred to as the duration of the fast burst (Df);
  • The time interval from tf to ts is referred to as the duration of the slow burst (Ds);
  • The time interval from te to ts is referred to as the overall duration of the burst (De) [37].
K g = ( d P d t ) max V 1 3
K LIB = ( d P d t ) V 1 3
According to the above research method, the TR spray processes of the two batteries were compared during the experimental process, as shown in Figure 4. It can be observed that the chamber pressure follows a similar trend over time during the TR process, increasing first, then decreasing and finally stabilizing. However, the amplitude of the pressure variation for Sample A is significantly higher than that of Sample B, with Du, Df, Ds, De being 3, 2, 27, 32 s and 3, 3, 26, 32 s, respectively. The pressure characteristic parameters of the two batteries are presented in Table 3 below. Compared to Zhang’s analysis of NCM6 2 2, these two batteries demonstrate shorter eruption times. This could be attributed to the higher Ni content in the samples examined in this research, intensifying the redox reactions during TR and significantly increasing the gas generation rate. Consequently, the eruption duration decreases. The higher KLIBmax in both samples further supports this observation. The comparatively higher explosion risk in A, as opposed to B, could be linked to A’s higher energy density.

3.2. Recording of Experimental Observations and Battery Mass Loss

The occurrence of battery rupture is primarily attributed to two factors. Firstly, explosions happen when the electrode assembly fails to maintain an opening for sufficient gas flow to reach the exhaust port. This leads to displacement of the electrode assembly, blocking the exhaust port. Secondly, when the exhaust port itself does not allow enough gas to escape, internal pressure builds up until the battery ruptures at a critical pressure [38]. In this experiment, battery rupture mainly resulted from the second cause. Wang et al. categorized the TR mass loss into three stages: (1) Packaging thermal decomposition; (2) Violent gas or smoke jetting and intense burning of ejected materials; (3) Attenuation and eventual extinction of open flames [39]. During the experiment, due to the vigorous reactions between the positive and negative electrodes and the electrolyte, a large amount of gas, particles, and electrolytes were generated. When the pressure reached a certain level, the safety valve opened, ejecting gas, particles, electrolytes, etc., resulting in battery mass loss. Figure 5 shows several images recorded during the TR process using a high-speed camera. The moment of smoke ejection from the safety valve was taken as the starting point. Within 0.06 s after the smoke ejection, sparks were observed, but at this point, smoke was still predominant. Around 0.2 s later, the ejection phenomenon was dominated by flames. It took only 1 s from the observation of smoke ejection to the entire chamber being filled with smoke within the field of view. Subsequently, the open flames gradually attenuated and eventually extinguished. We observed that the severity of TR in Sample A was higher than in Sample B. The jetting of sparks was more pronounced in Sample B. This may be attributed to the higher energy density of Sample A, leading to more intense reactions.
The weights of the two samples were measured before and after the experiments. Table 4 presents the resulting mass loss due to TR. Yang et al. compared the mass loss after TR in different systems and pointed out that NCM9 0.5 0.5 exhibited higher energy density, leading to higher mass loss. In their experiments, the mass loss was 72.89% with an energy density of 328.78 Wh/kg [40]. Sample A showed a larger mass loss after TR, indicating a more severe TR phenomenon. This was further confirmed by the recorded videos, which clearly showed more intense combustion in Sample A.

3.3. Gas Composition and Explosive Limits

The TR in lithium-ion battery systems can generate hundreds of liters of high-temperature, toxic, and flammable gases. With the continuous increase in energy density and battery capacity, the exhaust from battery TR has also changed accordingly. For passenger safety in electric vehicles, it is crucial to understand the volume and composition of the exhaust gases. The experimental setup used in this study can achieve an inert gas atmosphere, filled with nitrogen, effectively preventing the reaction of gases emitted from battery TR with oxygen and other gases, ensuring the accurate measurement of the volume and composition of gases produced during TR.
The calculation of gas production during battery TR uses the ideal gas state equation, as shown in Equation (3), where n is the molar mass of the substance, P is the gas pressure, V is the gas volume, R is the ideal gas constant, and T is the ambient temperature. To ensure the accuracy of temperature measurements, multiple thermocouples are evenly distributed inside the experimental chamber, and the average value is calculated as the ambient temperature.
P V = n R T
n = P 1 R T 1 P 0 R T 0
The gas production can be calculated using Equation (4), where Δn represents the change in gas volume inside the chamber before and after the experiment, which is the volume of gas produced during battery TR. P1 represents the pressure inside the chamber after the experiment, V is the volume of the experimental chamber (1000 L in this case), R has a value of 8.31, T1 represents the ambient temperature inside the chamber after the experiment, P0 represents the pressure inside the chamber before the experiment, and T0 represents the ambient temperature inside the chamber before the experiment. To ensure accuracy in calculations, the values of P1 and T1 are taken from the data after the TR stabilizes to obtain the molar quantity of gas. After calculations, the gas production for Sample A is 18.35 mol, and for Sample B, it is 24.85 mol. To facilitate comparison, the gas production is converted to standard conditions, resulting in 1.958 L/Ah for Sample A and 2.182 L/Ah for Sample B. It can be observed that gas production is related to the capacity of the battery. During the thermal decomposition process, gases mainly originate from three sources: Firstly, the breakdown of SEI and NCM materials at high temperatures generates oxygen [41], and through secondary reactions with electrolytes, produces carbon dioxide. Secondly, lithium embedding into the graphite anode at high temperatures results in the release of carbon dioxide [42]. Lastly, the electrolyte decomposition at elevated temperatures produces gases such as HF, CO2, and C2H4 [43]. Table 5 below shows the detected components of gases for both samples. As the experiment was conducted in an inert environment, the reactions within the chamber did not generate HF, and therefore, this component was not detected.
The composition of the gases after TR is closely related to the phenomenon. When TR is accompanied by combustion, the electrolyte components in the collected gas sample will decrease [44]. The severity of combustion in Sample A is higher than that in Sample B. The electrolyte components ejected will also be more fully ignited. The detected electrolyte components of the TR gases from the two batteries are also significantly higher for the latter compared to the former.
In this section, the flammable limits of the gases generated during battery TR were also studied. Based on the gas composition measured in Table 5, the flammable upper and lower limits of the mixed gases were calculated using the Le Chatelier equation. In the equation, Lmix represents the flammability limit of gases generated during battery TR, Li denotes the flammability limit of combustible component i in the battery, and xi represents the volume percentage of component i in the mixed gas.
L mix = 1 i = 1 n x i L i × 100 %
Using Equation (5) to calculate the flammable limits of the mixed gases produced during the TR of the two samples, the calculated results are shown in Table 6 below.
The safety of batteries is assessed from two aspects of gas flammability limits. On one hand, the lower flammable limit indicates how easily the gas can act as a fuel and lead to combustion or explosion; thus, the lower the flammable limit, the higher the risk. On the other hand, the flammable concentration range reflects how easily the gas in the environment can satisfy the conditions for combustion. A wider flammable concentration range implies that the gas is more likely to combust under environmental conditions.

4. Conclusions

In this study, we investigated the characteristics of terminal temperature and gas composition during the TR of batteries with the same positive electrode material NCM9 0.5 0.5 but different capacities. The experimental samples had capacities of 211 Ah (Sample A) and 256 Ah (Sample B), with the energy density of Sample A being higher than that of Sample B. The main experimental equipment was a sealed chamber, and the experimental environment was a sealed inert atmosphere. The TR was triggered by lateral heating. The main conclusions are as follows:
(1)
The TR triggering temperatures for the two batteries are relatively close, with the electrode tab temperatures both around 120 °C. The maximum temperature of Sample B electrode plates is significantly higher than that of Sample A. Yet, the maximum pressure within Sample A chamber is higher than that of Sample B.
(2)
Quantitative analysis of the spray process for the two lithium-ion batteries was performed using the KLIB curve. The ultra-fast, fast, and slow venting stages for both batteries were observed to be 3, 2, 27 s and 3, 3, 26 s. The total venting duration for both was 32 s. However, it was evident that the fluctuation amplitude of the chamber pressure for Sample A was notably higher than that of Sample B; A poses a higher explosion risk compared to B;
(3)
In the experimental phenomenon captured by the high-speed camera, it took only 1 s for the sample to transition from the opening of the safety valve to filling the experimental chamber with smoke. The battery with higher energy density in the two exhibits a higher degree of severity in TR, with more pronounced phenomena of jetting flames and a significantly increased mass loss rate. The mass loss rates for A and B were 73% and 64.87%;
(4)
The gas production of the two batteries under standard conditions is 1.985 L/Ah for one and 2.182 L/Ah for the other. With gas production increasing with battery capacity. The main gas components for both batteries, listed in descending order, are CO, CO2, H2, C2H4, and CH4. The total amount of gas components measured in Sample A is lower than that in Sample B.

5. The Limitation of the Study and the Future Work

This study only conducted comparisons with the same positive electrode materials, focusing solely on the differences in capacity and energy density. Subsequent additions should include comparisons of TR temperatures and gas production characteristics for different positive electrode materials, capacities, and application types. The aim is to provide assistance for the application of batteries in various scenarios and for thermal hazard protection.

Author Contributions

Conceptualization, C.S. and C.L.; methodology, C.S.; software, C.S. and H.S.; validation, H.W., J.W. and M.L.; formal analysis, C.S.; investigation, C.S.; resources, H.W.; data curation, H.S.; writing—original draft preparation, C.S.; writing—review and editing, H.W., C.L., Y.L. and M.L.; visualization, C.S., W.X. and H.S.; supervision, J.W. All authors have read and agreed to the published version of the manuscript.

Funding

Sponsored by Tsinghua-Toyota Joint Research Fund.

Data Availability Statement

The data are available through appropriate requests.

Conflicts of Interest

The authors declare no conflicts of interest.

Nomenclature

SymbolsExplanation
LIBlithium-ion battery
LIBslithium-ion batteries
SEISolid Electrolyte Interphase
SOCstate-of-charge
SOCsstate-of-charges
NCMLiNixCoyMnzO2
UFLUpper flammable limit
LFLLower flammable limit
TRThermal runaway
TPMaxThe highest temperature during positive electrode TR
TNMaxThe highest temperature during negative electrode TR
TPcriticalThe critical temperature for positive electrode TR
TNcriticalThe critical temperature for negative electrode TR
P1the pressure inside the chamber after the experiment
Vthe volume of the experimental chamber
T1the ambient temperature inside the chamber after the experiment
P0the pressure inside the chamber before the experiment
T0the ambient temperature inside the chamber before the experiment
Lmixthe flammability limit of gases generated during battery TR
Lithe flammability limit of combustible component i in the battery
xithe volume percentage of component i in the mixed gas

References

  1. Wang, X.; Wei, X.; Zhu, J.; Dai, H.; Zheng, Y.; Xu, X.; Chen, Q. A review of modeling, acquisition, and application of lithium-ion battery impedance for onboard battery management. eTransportation 2021, 7, 100093. [Google Scholar] [CrossRef]
  2. Lai, X.; Chen, Q.; Tang, X.; Zhou, Y.; Gao, F.; Guo, Y.; Bhagat, R.; Zheng, Y. Critical review of life cycle assessment of lithium-ion batteries for electric vehicles: A lifespan perspective. eTransportation 2022, 12, 100169. [Google Scholar] [CrossRef]
  3. Cai, T.; Valecha, P.; Tran, V.; Engle, B.; Stefanopoulou, A.; Siegel, J. Detection of Li-ion battery failure and venting with Carbon Dioxide sensors. eTransportation 2021, 7, 100100. [Google Scholar] [CrossRef]
  4. Piao, N.; Gao, X.; Yang, H.; Guo, Z.; Hu, G.; Cheng, H.-M.; Li, F. Challenges and development of lithium-ion batteries for low temperature environments. eTransportation 2022, 11, 100145. [Google Scholar] [CrossRef]
  5. Xu, W.; Wu, X.; Li, Y.; Wang, H.; Lu, L.; Ouyang, M. A comprehensive review of DC arc faults and their mechanisms, detection, early warning strategies, and protection in battery systems. Renew. Sustain. Energy Rev. 2023, 186, 113674. [Google Scholar] [CrossRef]
  6. Faraji, H.; Yıldız, Ç.; Arshad, A.; Arıcı, M.; Choukairy, K.; El Alami, M. Passive thermal management strategy for cooling multiple portable electronic components: Hybrid nanoparticles enhanced phase change materials as an innovative solution. J. Energy Storage 2023, 70, 108087. [Google Scholar] [CrossRef]
  7. Faraji, H.; Teggar, M.; Arshad, A.; Arıcı, M.; Mehdi Berra, E.; Choukairy, K. Lattice Boltzmann simulation of natural convection heat transfer phenomenon for thermal management of multiple electronic components. Therm. Sci. Eng. Prog. 2023, 45, 102126. [Google Scholar] [CrossRef]
  8. Peiyan, Q.I.; Jie, Z.M.; Da, J.; Kai, Y.; Jianling, L.; Yilin, L.; Fei, G.; Hao, L. Combustion characteristics of lithium–iron–phosphate batteries with different combustion states. eTransportation 2022, 11, 100148. [Google Scholar] [CrossRef]
  9. Wang, Q.; Mao, B.; Stoliarov, S.I.; Sun, J. A review of lithium ion battery failure mechanisms and fire prevention strategies. Prog. Energy Combust. Sci. 2019, 73, 95–131. [Google Scholar] [CrossRef]
  10. Wen, J.; Yu, Y.; Chen, C. A Review on Lithium-Ion Batteries Safety Issues: Existing Problems and Possible Solutions. Mater. Express 2012, 2, 197–212. [Google Scholar] [CrossRef]
  11. Ishikawa, H.; Mendoza, O.; Sone, Y.; Umeda, M. Study of thermal deterioration of lithium-ion secondary cell using an accelerated rate calorimeter (ARC) and AC impedance method. J. Power Sources 2012, 198, 236–242. [Google Scholar] [CrossRef]
  12. Spotnitz, R.; Franklin, J. Abuse behavior of high-power, lithium-ion cells. J. Power Sources 2003, 113, 81–100. [Google Scholar] [CrossRef]
  13. Zhou, M.; Zhao, L.; Okada, S.; Yamaki, J.I. Quantitative Studies on the Influence of LiPF_6 on the Thermal Stability of Graphite with Electrolyte. J. Electrochem. Soc. 2012, 159, A44. [Google Scholar] [CrossRef]
  14. Orendorff, C.J. The Role of Separators in Lithium-Ion Cell Safety. Electrochem. Soc. Interface 2012, 21, 61. [Google Scholar] [CrossRef]
  15. Botte, G.G.; White, R.E.; Zhang, Z. Thermal stability of LiPF 6 –EC:EMC electrolyte for lithium ion batteries. J. Power Sources 2001, 97, 570–575. [Google Scholar] [CrossRef]
  16. Harris, S.J.; Timmons, A.; Pitz, W.J. A combustion chemistry analysis of carbonate solvents used in Li-ion batteries. J. Power Sources 2009, 193, 855–858. [Google Scholar] [CrossRef]
  17. Liu, X.; Stoliarov, S.I.; Denlinger, M.; Masias, A.; Snyder, K. Comprehensive calorimetry of the thermally-induced failure of a lithium ion battery. J. Power Sources 2015, 280, 516–525. [Google Scholar] [CrossRef]
  18. Lamb, J.; Orendorff, C.J.; Steele, L.A.M.; Spangler, S.W. Failure propagation in multi-cell lithium ion batteries. J. Power Sources 2015, 283, 517–523. [Google Scholar] [CrossRef]
  19. Mohammadian, S.K.; Zhang, Y. Improving wettability and preventing Li-ion batteries from thermal runaway using microchannels. Int. J. Heat Mass Transf. 2018, 118, 911–918. [Google Scholar] [CrossRef]
  20. Dongxu, O.; Jiahao, L.; Mingyi, C.; Jingwen, W.; Jian, W. An Experimental Study on the Thermal Failure Propagation in Lithium-Ion Battery Pack. J. Electrochem. Soc. 2018, 165, A2184–A2193. [Google Scholar]
  21. Golubkov, A.W.; Scheikl, S.; Planteu, R.; Voitic, G.; Hacker, V. Thermal runaway of commercial 18650 Li-ion batteries with LFP and NCA cathodes—Impact of state of charge and overcharge. RSC Adv. 2015, 5, 57171–57186. [Google Scholar] [CrossRef]
  22. Spinner, N.S.; Field, C.R.; Hammond, M.H.; Williams, B.A.; Myers, K.M.; Lubrano, A.L.; Rose-Pehrsson, S.L.; Tuttle, S.G. Physical and chemical analysis of lithium-ion battery cell-to-cell failure events inside custom fire chamber. J. Power Sources 2015, 279, 713–721. [Google Scholar] [CrossRef]
  23. Feng, X.; Ouyang, M.; Liu, X.; Lu, L.; Xia, Y.; He, X. Thermal runaway mechanism of lithium ion battery for electric vehicles: A review. Energy Storage Mater. 2018, 10, 246–267. [Google Scholar] [CrossRef]
  24. Galushkin, N.E.; Yazvinskaya, N.N.; Galushkin, D.N. Mechanism of Thermal Runaway in Lithium-Ion Cells. J. Electrochem. Soc. 2018, 165, A1303. [Google Scholar] [CrossRef]
  25. Shen, H.; Wang, H.; Li, M.; Li, C.; Zhang, Y.; Li, Y.; Yang, X.; Feng, X.; Ouyang, M. Thermal Runaway Characteristics and Gas Composition Analysis of Lithium-Ion Batteries with Different LFP and NCM Cathode Materials under Inert Atmosphere. Electronics 2023, 12, 1603. [Google Scholar] [CrossRef]
  26. Kim, J.H.; Kwak, E.G.; Jeong, J.; Oh, K.Y. Versatile multiphysics model for thermal runaway estimation of a lithium-ion battery. Int. J. Energy Res. 2022, 46, 16550–16575. [Google Scholar] [CrossRef]
  27. Koch, S.; Fill, A.; Birke, K.P. Comprehensive gas analysis on large scale automotive lithium-ion cells in thermal runaway. J. Power Sources 2018, 398, 106–112. [Google Scholar] [CrossRef]
  28. Yuan, L.; Dubaniewicz, T.; Zlochower, I.; Thomas, R.; Rayyan, N. Experimental study on thermal runaway and vented gases of lithium-ion cells. Process Saf. Environ. Prot. 2020, 144, 186–192. [Google Scholar] [CrossRef]
  29. Zhang, Q.; Niu, J.; Zhao, Z.; Wang, Q. Research on the effect of thermal runaway gas components and explosion limits of lithium-ion batteries under different charge states. J. Energy Storage 2022, 45, 103759. [Google Scholar] [CrossRef]
  30. Wang, H.; Du, Z.; Rui, X.; Wang, S.; Jin, C.; He, L.; Zhang, F.; Wang, Q.; Feng, X. A comparative analysis on thermal runaway behavior of Li (Ni Co Mn) O2 battery with different nickel contents at cell and module level. J. Hazard. Mater. 2020, 393, 122361. [Google Scholar] [CrossRef]
  31. Noh, H.J.; Youn, S.; Yoon, C.S.; Sun, Y.K. Comparison of the structural and electrochemical properties of layered Li[NixCoyMnz]O2 (x = 1/3, 0.5, 0.6, 0.7, 0.8 and 0.85) cathode material for lithium-ion batteries. J. Power Sources 2013, 233, 121–130. [Google Scholar] [CrossRef]
  32. Zheng, Y.; Gao, W.; Ouyang, M.; Lu, L.; Zhou, L.; Han, X. State-of-charge inconsistency estimation of lithium-ion battery pack using mean-difference model and extended Kalman filter. J. Power Sources 2018, 383, 50–58. [Google Scholar] [CrossRef]
  33. Huang, L.; Zhang, Z.; Wang, Z.; Zhang, L.; Zhu, X.; Dorrell, D.D. Thermal runaway behavior during overcharge for large-format Lithium-ion batteries with different packaging patterns. J. Energy Storage 2019, 25, 100811. [Google Scholar]
  34. Jindal, P.; Bhattacharya, J. Review—Understanding the Thermal Runaway Behavior of Li-Ion Batteries through Experimental Techniques. J. Electrochem. Soc. 2019, 166, A2165–A2193. [Google Scholar] [CrossRef]
  35. He, T.; Zhang, T.; Gadkari, S.; Wang, Z.; Mao, N.; Cai, Q. An investigation on thermal runaway behaviour of a cylindrical lithium-ion battery under different states of charge based on thermal tests and a three-dimensional thermal runaway model. J. Clean. Prod. 2023, 388, 135980. [Google Scholar] [CrossRef]
  36. Christensen, P.; Milojevic, Z.; Wise, M.; Ahmeid, M.; Attidekou, P.; Mrozik, W.; Dickmann, N.; Restuccia, F.; Lambert, S.; Das, P. Thermal and mechanical abuse of electric vehicle pouch cell modules. Appl. Therm. Eng. 2021, 189, 116623. [Google Scholar] [CrossRef]
  37. Zhang, Y.; Wang, H.; Li, W.; Li, C.; Ouyang, M. Quantitative analysis of eruption process of abused prismatic Ni-rich automotive batteries based on in-chamber pressure. J. Energy Storage 2020, 31, 101617. [Google Scholar] [CrossRef]
  38. Finegan, D.P.; Darcy, E.; Keyser, M.; Tjaden, B.; Heenan, T.M.; Jervis, R.; Bailey, J.J.; Vo, N.T.; Magdysyuk, O.V.; Drakopoulos, M.J.A.S. Thermal Runaway: Identifying the Cause of Rupture of Li-Ion Batteries during Thermal Runaway. Adv. Sci. 2018, 5, 1870003. [Google Scholar] [CrossRef]
  39. Wang, Z.; Yang, H.; Li, Y.; Wang, G.; Wang, J. Thermal runaway and fire behaviors of large-scale lithium ion batteries with different heating methods. J. Hazard. Mater. 2019, 379, 120730. [Google Scholar] [CrossRef]
  40. Yang, X.; Wang, H.; Li, M.; Li, Y.; Li, C.; Zhang, Y.; Chen, S.; Shen, H.; Qian, F.; Feng, X.; et al. Experimental Study on Thermal Runaway Behavior of Lithium-Ion Battery and Analysis of Combustible Limit of Gas Production. Batteris 2022, 8, 250. [Google Scholar] [CrossRef]
  41. Yang, H.; Shen, X.D. Dynamic TGA–FTIR studies on the thermal stability of lithium/graphite with electrolyte in lithium-ion cell. J. Power Sources 2007, 167, 515–519. [Google Scholar] [CrossRef]
  42. Garg, M.; Tanim, T.R.; Rahn, C.D.; Bryngelsson, H.; Legnedahl, N. Elevated temperature for life extension of lithium ion power cells. Energy 2018, 159, 71–723. [Google Scholar] [CrossRef]
  43. Galushkin, N.E.; Yazvinskaya, N.N.; Galushkin, D.N. Mechanism of Gases Generation during Lithium-Ion Batteries Cycling. J. Electrochem. Soc. 2019, 166, A897–A908. [Google Scholar] [CrossRef]
  44. Zhang, Q.; Liu, T.; Wang, Q. Experimental study on the influence of different heating methods on thermal runaway of lithium-ion battery. J. Energy Storage 2021, 42, 103063. [Google Scholar] [CrossRef]
Figure 1. Experimental chamber layout. (a) Schematic diagram of experimental arrangement; (b) Experimental setup, left (Sample A) and right (Sample B).
Batteries 10 00084 g001
Figure 2. During the experimental process, the temperatures of the positive and negative tabs of the battery, the surface temperature of the battery, the environmental temperature, the pressure, and the voltage were monitored. (a) For Sample A; (b) For Sample B.
Batteries 10 00084 g002aBatteries 10 00084 g002b
Figure 3. The temperature changes of the positive and negative tabs of the samples over time during the experimental process.
Batteries 10 00084 g003
Figure 4. Graphs of Chamber Pressure and KLIB Over Time. (a) For Sample A, (b) For Sample B.
Batteries 10 00084 g004aBatteries 10 00084 g004b
Figure 5. High-speed photography captured the eruptive state during the TR of the batteries. (a) Sample A; (b) Sample B.
Batteries 10 00084 g005
Table 1. Battery Sample Parameters.
CellSample ASample B
ShapePrismaticPrismatic
Packaging MaterialAluminum AlloyAluminum Alloy
Capacity (Ah)211256
Upper Cutoff Voltage (V)4.254.35
Lower Cutoff Voltage (V)2.82.5
Energy Density (Wh/kg)342.06325.82
Weight (g)2621.63417.8
SOC100%100%
AnodeGraphiteGraphite
CathodeLiNi0.9Co0.05Mn0.05O2LiNi0.9Co0.05Mn0.05O2
Table 2. The TR temperature data of the batteries.
SampleTPmax (°C)TNmax (°C)TPcritical (°C)TNcritical (°C)
A241217119123
B328355110.9108
TPMax: The highest temperature during positive electrode TR. TNMax: The highest temperature during negative electrode TR. TPcritical: The critical temperature for positive electrode TR. TNcritical: The critical temperature for negative electrode TR.
Table 3. Pressure fluctuation parameter.
SamplePmax (kPa)KLIB max (kPa·m·s−1)Du (s)Df (s)Ds (s)De (s)
A380.599.5322732
B330.368.2332632
Li(Ni0.6Mn0.2Co0.2)O2 [37]126.324.9442836
Table 4. Mass Statistics.
SampleInitial Weight (g)Final Weight (g)Mass Loss Rate (%)Energy Density (Wh/Kg)
A2621.6707.873342.06
B3417.81200.664.87325.82
Table 5. Gas composition.
SampleAB
Major components (%)Batteries 10 00084 i001Batteries 10 00084 i002
C2H60.86%0.53%
C3H80.02%0.04%
C3H60.19%/
C2H20.01%0.04%
C4H100.32%0.02%
C4H8/0.05%
C3H40.15%0.29%
C4H6/0.03%
Table 6. The flammable limits.
SampleUFLLFLFlammable Range
A58.38.4949.81
B51.887.4344.45
Disclaimer/Publisher’s Note: The statements, opinions and data contained in all publications are solely those of the individual author(s) and contributor(s) and not of MDPI and/or the editor(s). MDPI and/or the editor(s) disclaim responsibility for any injury to people or property resulting from any ideas, methods, instructions or products referred to in the content.

