1. Introduction
Electric vehicle (EV) development is moving quickly, which has brought attention to the pressing need for accurate battery failure prediction and diagnostics. Energy storage technology has progressively emerged as a crucial element of contemporary power networks in recent years [
1]. EVs make extensive use of lithium-ion batteries (LIBs) [
2]. Compared to other chemical battery types, lithium-ion batteries have the advantages of a high energy density, a long service life, and a low self-discharge rate. However, under certain failure conditions, a battery may produce excessive heat, resulting in a phenomenon known as thermal runaway. Thermal runaway is a self-accelerating, exothermic reaction that occurs when the heat generated inside a battery exceeds the heat it dissipates to its surroundings, resulting in a rapid increase in temperature [
3]. This can be caused by thermal abuse (e.g., exposure to high temperatures); electrical abuse (e.g., overcharging, overdischarging, or short-circuiting); and mechanical abuse (e.g., crushing, puncturing, or physical damage); all of which can jeopardize the integrity and safety of the battery [
4]. Thermal runaway can potentially result in an explosion in certain extreme situations [
5]. Thermal runaway is obviously a direct result of elevated battery temperature, therefore online battery temperature prediction and diagnosis are essential to guaranteeing dependable and safe battery operation.
Over temperature (OT), over temperature rise (OTR), and over temperature difference (OTD) are the three categories into which typical temperature anomalies fall. Even with advances in our understanding of failure causes, it is still difficult to forecast how battery systems will change over time using time-sensitive sensor data. Early failure detection in large-scale electric vehicle applications is more complex than laboratory testing due to the presence of multiple aging and failure mechanisms, dynamic operating conditions, and data-related issues like noise, incompleteness, and variability between different batteries and batches. As a result, knowing how to accurately and promptly identify battery issues is critical for both the battery’s regular functioning and the vehicle’s safety.
A lot of work has been undertaken by researchers to realize the quick diagnosis of lithium-ion battery defects. Three categories can be used to classify these defect diagnosis techniques: methods based on knowledge, models, and data [
6]. In knowledge-based techniques, defect diagnostic criteria are usually designed using prior expert knowledge. Even though these techniques do not need modeling, creating rules and gaining prior knowledge are difficult and time-consuming processes [
7]. Model-based techniques anticipate parameters that characterize battery failures by using different identification algorithms and mathematical models to replicate the electrochemical reactions inside a battery. The remaining signal is extracted and examined for fault diagnosis by contrasting the measured values with the expected fault parameters. Model-based techniques necessitate substantial modeling labor and significant a priori information, and they mostly rely on the accuracy of existing models [
8].
The performance and safety of a battery system is highly dependent on the effectiveness of its thermal management system, which in turn depends on the design and operating conditions of the battery system. In recent years, it has been shown that data-driven approaches are widely used not only for the estimation and prediction of state-of-charge (SOC) [
9], state-of-power (SOP) [
10], state-of-health (SOH) [
11,
12], and residual useful life (RUL) [
13,
14], but also well implemented in battery troubleshooting [
15]. Temperature prediction and thermal fault forecasting continue to receive very little research attention, despite the large body of research on battery fault diagnostics. An intelligent battery management system that can efficiently regulate the battery pack’s charging and discharging was created by Daowd et al. [
16]. Important data support was provided by Panchal et al.’s [
17] on-site measurements of the heating rate of lithium-ion batteries at various charging and discharging rates and boundary conditions.
Temperature prediction of battery systems has become more important as research into controlling thermal runaway of power batteries has increased due to the growing number of safety incidents involving electric vehicles. PWM switching oscillation signals are used in the literature [
18] to track lithium-ion battery internal temperature fluctuations online. In the literature [
19], online estimation of battery temperature was realized by charging and discharging experiments at different current rates using a simplified distributed electric heat model for cylindrical lithium-ion batteries. The literature [
20] proposes a novel hybrid method based on the fusion of the Extended Kalman Filter (EKF) and data-driven methods for battery core temperature estimation under model noise compensation based on electrically and thermally coupled models. The literature [
21] established a two-node electro-thermal model and a multi-scale long and short-term memory network to provide an advanced online multi-step ahead warning structure for temperature cross-warning. Furthermore, a great deal of research has been done to evaluate the performance of batteries through experiments carried out in a variety of harsh environments [
22,
23]. However, these techniques have significant drawbacks. First, they are inefficient in estimating actual operating vehicle temperatures over a future time period that is applicable to all climatic conditions. This is because they typically rely on historical data, which may not accurately reflect future climate changes and operating conditions. Due to data volume limitations, it is impractical to collect comprehensive data covering all possible future scenarios. In addition, complex and dynamic real-world operating conditions, such as variable driving patterns, environmental factors, and vehicle usage, make it difficult for these methods to provide accurate temperature estimates. Lastly, most research on battery system thermal safety currently emphasizes mechanism analysis and modeling, estimating temperature with experimental data or pre-selected real operation data [
24,
25]. Very few studies [
26,
27,
28] have attempted to predict temperature in real-time or thermal failure in real vehicle operation, so their viability and stability have not yet been confirmed.
New chances to learn from data and standardize the process of creating predictions are provided by data-driven technology. Specifically, deep learning methods naturally provide the characterization tools needed for detection and classification [
29], as well as tools for dealing with uncertainty models and predictions based on observed data [
30], and are characterized by unprecedented spatial and temporal coverage. This technology is frequently utilized in electric car safety systems, serving to both avoid thermal runaway and prolong the life of lithium batteries.
Mamba [
31] is a new architecture that has garnered a lot of interest from scientists studying computer vision (CV), natural language processing (NLP), and other AI-related subjects. Furthermore, Mamba is well respected for its sequence modeling capabilities. Schiff et al. [
32] extended long-range Mamba into BiMamba components supporting bi-directionality, and further into MambaDNA blocks, which serve as the basis for the long-range DNA language model. Additionally, Mamba’s efficacy has been demonstrated in activities like sensor data sequence prediction [
33] and stock prediction [
34]. Ahamed and Cheng [
35] proposed a Mamba-based TimeMachine to identify and model extended dependencies within multivariate time series data.
This paper will employ a unique Mamba neural network to address the aforementioned shortcomings and close the gaps in the literature. This report presents a novel investigation on thermal failure predictions and temperature prediction for battery systems that are oriented towards Mamba. The main contributions of this paper are summarized as follows:
Actual data application with multiple time dimensions: in this work, we train Mamba models using actual operating data of electric vehicles. Our learning system can adjust to various temporal embeddings, which makes it easier to analyze time series data in depth. This finding makes it possible to identify anomalies early on and sheds light on how battery cell problems develop over time.
Novel time series prediction model: utilizing the state-space framework of Mamba, a novel time series prediction model is proposed that can realize context-aware prediction and detect and analyze extended dependencies in multivariate time series data.
Multivariate sequence representation and adaptive correlation: prior to producing predictions by linear mapping, each time series is separately labeled to characterize the variable features. Correlations between variables are then extracted using Mamba, and the feed-forward network is configured to learn the time dependence.
Prediction ranges that are adaptable and adjustable: to support learning at various scales in complex systems, the prediction range can be flexibly modified based on the requirements of prediction accuracy. This approach allows for the provision of either short-term or long-term hazard warnings in the event of temperature anomalies or thermal runaway within the prediction range, giving the driver or big data platform manager enough time to process the information.
Furthermore, real-time accurate temperature prediction of the battery is used to evaluate battery safety. The new energy national big data alliance platform will collect vast amounts of vehicle operation data, which will improve modeling accuracy and expand the potential applications of the suggested approach. The rest of the paper is organized as follows:
Section 2 describes the methodology for predictive temperature modeling.
Section 3 demonstrates the process of data characterization and debugging hyperparameters.
Section 4 details the comparative and prognostic results for various temperature anomalies.
Section 5 summarizes the work.
2. Methodology
Thermal problems in batteries are directly linked to abnormal temperature variations in batteries. Consequently, it is possible to convert the prognosis of battery thermal failure into an issue of forecasting temperature. A precise model can be used to estimate battery temperature in the future. In this study, we present a method, called BMPTtery, to prevent lithium battery thermal runaway. The research logic for this method covers four aspects: research significance, data preparation, model training, and result analysis.
Figure 1 illustrates this logic.
Partitioning the training, validation, and test sets, as well as addressing anomalies and normalizing the data, are all included in the first step. The vehicle’s speed, mileage, total voltage, total current, SOC, insulation resistance, and probe temperature are among the input variables used by the model. Vehicle speed, current, and voltage variations reflect the effects of battery charging and discharging on temperature. Next, a multi-step prediction of the Li-ion battery temperature is performed by the BMPTtery model to prevent the occurrence of thermal runaway. Additionally, the forecast range can be adjusted flexibly based on vehicle demand. Ultimately, the battery system’s thermal failure prognosis is achieved by determining whether the value surpasses the safety threshold established based on battery performance.
2.1. Multivariate Sequence Representation and Adaptive Correlation
Conventional Transformers might not be able to efficiently learn the central representation of each variable as they embed the timestamps of several variables into a single token. Rather, iTransformer incorporates every time series into a distinct token, enabling the attention mechanism to more effectively detect correlations among many variables [
36]. Thus, in this paper, each time series is first labeled independently (as shown in the model training module of
Figure 1), describing the variable attributes to optimize the inputs for model training. The time points of each optimized feature are marked autonomously by linear mapping and fed into bi-directional Mamba to extract the correlation between different features. The input sequence
is linearly mapped to
as (1). The Mamba model’s prediction ability is enhanced by linear mapping since it not only detects global patterns and trends in various sequences but also eliminates noise and unnecessary information from the data. In time series forecasting, the use of optimization and linear mapping in multivariate dimensions is especially crucial for long-term dependencies.
2.2. State Space Models
Any cyclic process with potential states can be described using the state space model. A first-order differential equation represents the evolution of the internal system state, while another set of differential equations describes the connection between the latent state and the output sequence. The latent state assumption
as in (2) allows the input sequence
to be mapped to the output sequence
.
where
and
are learnable matrices. The continuous sequence is then discretized in
steps, and the discretized SSM model is expressed as in (3).
where
and
. Due to the transition from the continuous form
to the discrete form
, the model can be computed efficiently by linear recursive methods [
37]. The vanila SSM is the basis for the Structured State Space Model (S4) [
38], which is initialized using HiPPO [
39] to give the state matrix
z structure and enhance long-range dependency modeling.
2.3. Applications of Mamba
Mamba extends its loop model to include hardware-aware parallel algorithms and adds a data-dependent selection mechanism in S4. Mamba can retain computing efficiency while capturing contextual information in lengthy sequences thanks to this approach. Mamba, being a multilayer model with nearly linear complexity in comparison to Transformer, has the ability to enhance productivity and performance in lengthy sequence tasks.
Figure 2 describes in detail the formation of the output of sequence position
. The Mamba layer takes as input the sequence
, where
denotes the batch size,
denotes the number of variables, and
denotes the dimensionality.
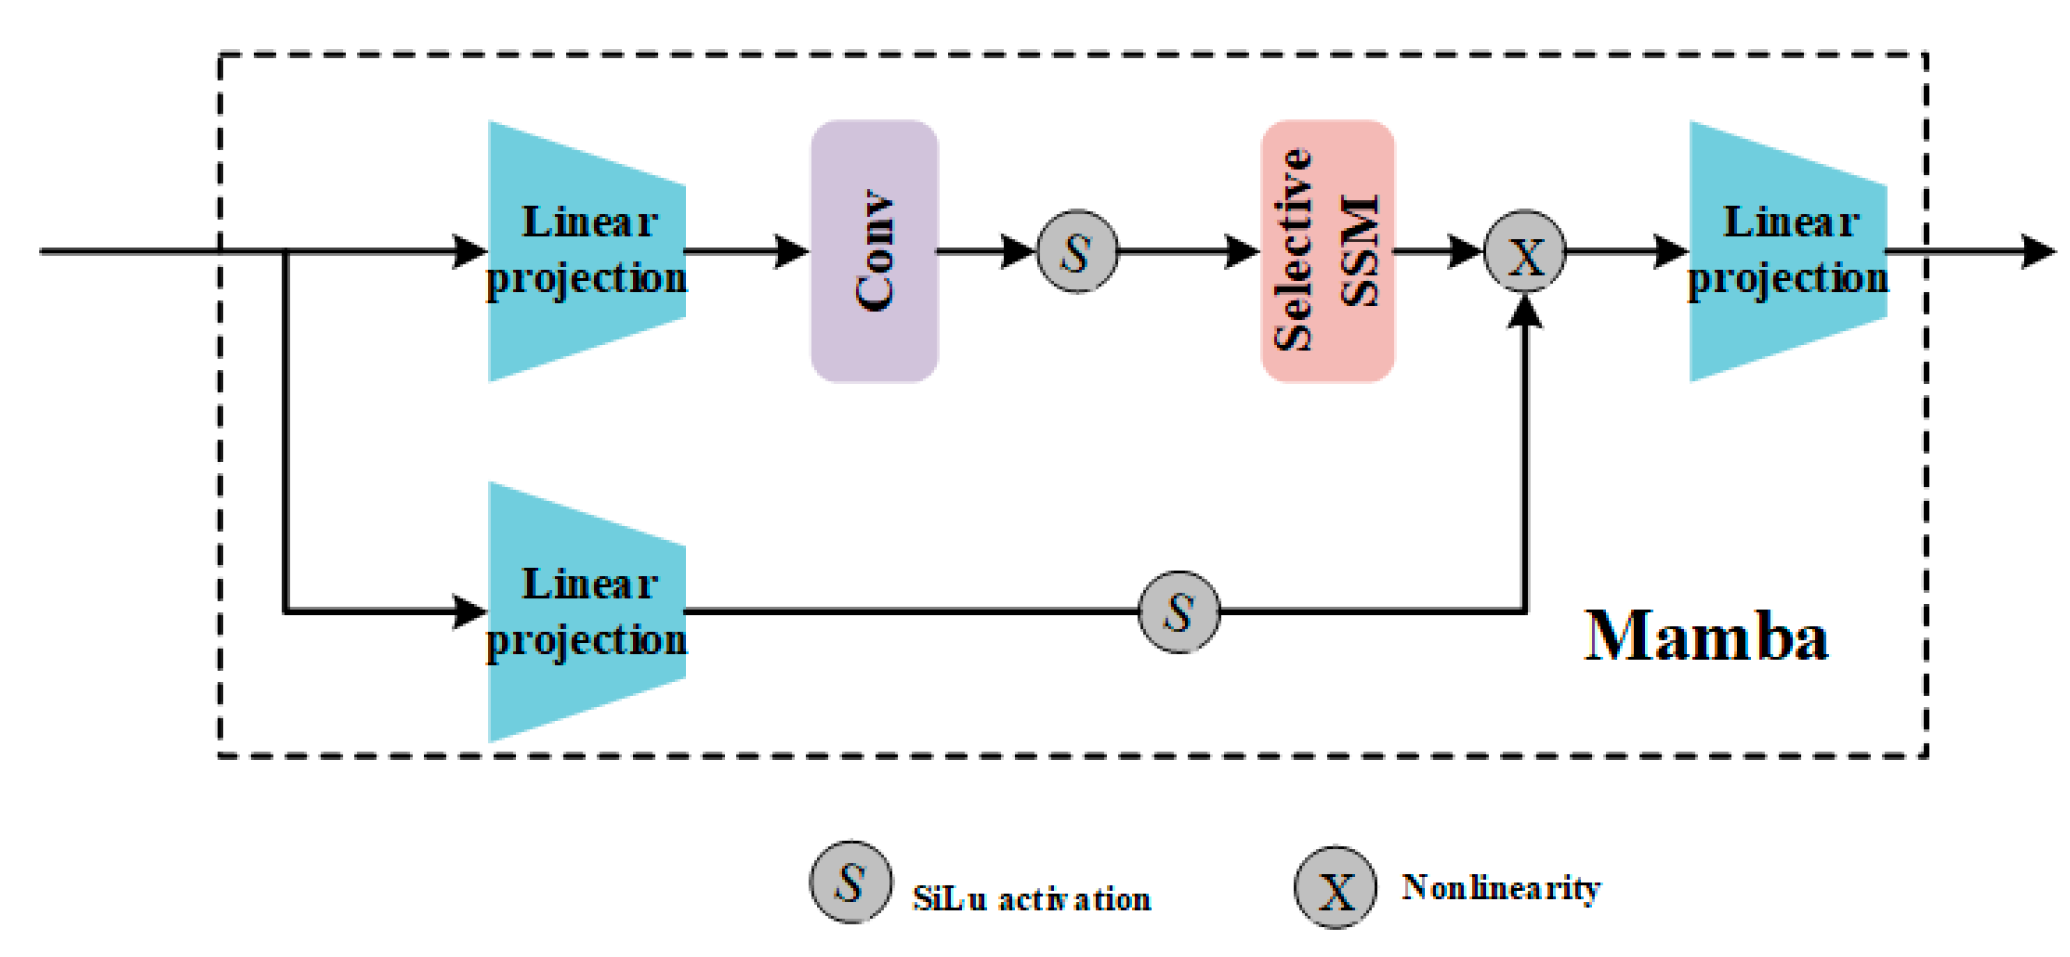
Figure 3 depicts the composition of the Mamba Block. The block first extends the hidden dimension to ED by a linear projection, and then processes the projections obtained earlier using the convolution function and the SiLU [
40] activation function. The states are formed based on the discretized SSM (i.e., the core of the Mamba block) chosen from the input parameters. It is eventually combined with a linear projection from the residual connection activation and linearly processed to generate the final output
at time step
. Mamba Block efficiently handles sequential information by utilizing selective state-space models and input-dependent adaptation. Mamba block final output is
.
The main goal of using Mamba is to extract relationships between variables by connecting variables that exhibit similar trends, thus learning mutual information. Learning exact information is made easier by the Transformer architecture’s global attention capacity, which calculates the impact of every other variable on a particular variable. Global attention may not be feasible, as its computing burden increases exponentially with the number of variables. This limitation may restrict real-world applications of Transformer-based algorithms. In contrast, Mamba’s selection mechanism recognizes the importance of different variables, similar to an attention mechanism, and its computational overhead rises in a nearly linear fashion as the number of variables increases. Unlike Transformer, Mamba’s selection method is unidirectional and can only take into account preceding variables, which means it cannot concentrate on global variables. In order to get around this restriction, we employed two Mamba layers (as seen in
Figure 1), which made it easier to determine the correlation between each variable. The bidirectional Mamba’s variable correlations are combined and linked to another residual network to provide the layer’s output. As (4)–(7) illustrate the precise procedure.
After that, the time dependence on the serial representation of every variable is discovered using a feedforward network (FFN). Dense nonlinear connections are used by feedforward networks to encode the observed time series. By upholding sequential relationships, the FFN implicitly encodes the time series during this operation. Based on the output of the FFN layer, the tokenized temporal information is reconstructed into the time series to be predicted through the mapping layer and subsequently transposed to produce the final prediction.
2.4. Multi-Step Ahead Prediction
Time series prediction is now the subject of a lot of research; however, the majority of these studies focus on single-step forecasting, which is unfeasible in real-world applications, particularly when it comes to the early prediction of lithium battery failures. This paper proposes a multi-step ahead temperature prediction technique based on this backdrop. Rather than depending solely on the most current parameter for prediction, the method employs the Training Window Size (TWS) to acquire data from the previous time period and uses this data to forecast future temperatures. The Predicted Window Size (PWS) indicates the number of steps required to anticipate the temperature, whereas the TWS indicates the number of steps in the time lag. However, raising the TWS slows down training and makes the model more complex. Conversely, a smaller PWS might contribute to increased prediction accuracy. Therefore, setting different sizes of TWS and PWS will have a significant impact on the prediction performance, and the specific settings will be discussed in detail in the next section. By adjusting the size of the prediction window, predictions can be made for different time scales. As illustrated in
Figure 4, the prediction window sizes are 6, 30, and 90. Given that the actual vehicle data is 10 s per frame, the corresponding time windows are 1 min, 5 min, 10 min, and 15 min, respectively.
3. Description of Data and Optimization of Hyperparameters
3.1. Data Description
Actual vehicle data is provided by the New Energy Vehicle National Big Data Consortium 2022 Digital Vehicle Competition, and all of the cars in this dataset belong to the same model year. The electric car gathers motion and operational data, including temperature, voltage, battery current, and SOC (State of Charge), vehicle speed, etc. in real time with a sampling interval of 10 s. For data with gradual temperature changes, a 10 s sampling interval decreases data storage costs without significantly affecting the effectiveness of the algorithm [
41].
The battery pack voltage in this dataset is made up of 95 separate cells connected in series, and 34 temperature probes (probes 1 through 34) are dispersed inside and outside the battery pack. The input features of the model include speed (speed), total_voltage, total_current, mileage, standard_soc, insulation_resistance (isulate_r), and temperature of each probe. Specifically, the speed affects the complexity and thermal performance of the battery; the total voltage reflects the overall operating state of the battery; the total current directly affects the heat generation of the battery; the driving range is used to evaluate the battery performance; the standard state of charge has an important impact on the discharge characteristics of the battery; the insulation resistance relates to the safety and thermal characteristics of the battery; and the probe temperature serves as an input to the model and as a prediction target for capturing the time series of temperature characteristics. Real-time data analysis can be used to track defects, anticipate battery life, and provide early fault warnings. Following data processing, end users receive this information for ongoing upkeep.
3.2. Data Processing
For machine learning techniques to perform better, data pretreatment is essential. Denoising, data transformation, and the handling of missing data (such as dispersed sensor measurements) are commonly included in preprocessing. The challenge of handling noisy and incomplete time series data can be effectively mitigated by employing a two-step hybrid model that integrates trajectory piecewise–polynomial regression (TPPR) and the Exponentially Weighted Moving Average (EWMA) (
Figure 5) [
42]. This approach addresses the complexities involved in multivariate forecasting of real-world time series data.
The initial phase of this dual-step noise reduction approach employs trajectory piecewise–polynomial regression, which, by analyzing each piece independently, allows the construction of a model that approximates the “true” trajectory of the data, even in the presence of noise. This method also enables handling incomplete or missing data by interpolating or estimating the absent values within each piecewise–polynomial regression, using the derived polynomial model. The primary objective of this phase is to generate an initial smooth approximation of the data trajectory and to precisely address any data gaps.
The EWMA is applied as the next step after completing the initial data smoothing and gap-filling with piecewise–polynomial regression. The initial smoothed data can be further refined using EWMA to reduce the influence of outliers and the remaining noise. EWMA is more effective than segmented polynomial regression alone at capturing recent changes or trends in the data because of its adaptive nature. These two phases clearly divide the work: sophisticated adaptive smoothing (EWMA), which comes after noise reduction and gap filling (TPPR). These two techniques can be integrated into a dual-step model to effectively address issues arising from noisy, incomplete, and ambiguous time series data.
One important preprocessing step in the machine learning workflow is data normalization. By balancing their ratios, it converges the effects of various model features. We employ the Z-score normalization technique in our work, which uses the feature set’s mean and standard deviation to alter the data points so that the base unit is the standard deviation and the mean of all multiscale features is zero. The Z-score approach is used to normalize the temperature, voltage, and current of each parameter in the study of battery temperature prediction. Feature normalization is important because it ensures that all features contribute equally to the model output, promoting balanced and more accurate predictions; it keeps large-scale features from masking small-scale features and preventing prediction errors; and it accelerates the convergence of training data for effective model development. The feature normalization formula is as (8).
where
denotes the normalized eigenvalue,
denotes the original eigenvalue,
denotes the mean of the eigenvalue, and
denotes the standard deviation of the eigenvalue. In this paper, the target loss function of the model is chosen as mean squared error (
MSE).
where
and
are the predicted temperature and actual temperature, respectively;
refers to the total amount of testing cycle.
3.3. Evaluation Metrics
To evaluate the performance of temperature prediction, we used three metrics, Mean Relative Error (
MRE), Mean Absolute Error (
MAE), and Root Mean Square Error (
RMSE). These metrics are used to evaluate the prediction results for each cross-validation test data and are defined as shown below.
where
and
are the predicted temperature and actual temperature, respectively; and
refers to the total amount of testing cycle.
3.4. Hyper-Parameters Tuning
Making the right hyperparameter selections has a significant impact on how well machine learning models work. We employed the popular ten-fold cross-validation method and trained the model with the June temperature probe1 data to fully use the optimal performance of the temperature prediction model. Ten equal-sized subdatasets were created from the input data, nine of which were used to train the temperature prediction model, and the tenth subset was utilized for model testing and validation. The batch size, dropout, and epoch hyper-parameters are initially set to 1024, 0.4, and 10, respectively. Furthermore, two parameters, namely TWS and PWS, have a direct impact on the established model’s performance, according to the multi-step forward prediction integration procedure. Consequently, these two parameters—which were originally set to 30 (5-min data) and 6 (1-min data)—are also thought of as hyper-parameters.
Table 1 displays the assessment results of the temperature prediction model with various hybrid parameters. For easier comparison, the least MRE, RMSE, and MAE are indicated with bold characters.
The amount of training data in each batch and the trade-off between memory usage and model convergence time are represented by the batch size, which is first ascertained. The study’s batch size is set within the range of [16, 32, 64, 128, 256, 512, 1024] in order to determine the proper value.
Table 1 provides the matching MRE, RMSE, and MAE based on various batch sizes. It is evident that the MRE, RMSE, and MAE achieve their lowest values when the batch size approaches 16, i.e., specifically 0.3614%, 0.2968 °C, and 10.05%, respectively. Consequently, 16 is the batch size that is specified. Next, the impact of varying dropout rates on the model’s execution is examined, and the dropout rates are adjusted to 0.5, 0.4, 0.3, 0.2, and 0.1, in that order. It is evident that the model’s accuracy improves when the dropout rate is below 0.4, but declines when the rate exceeds 0.4. Therefore, 0.1 is an ideal dropout tradeoff. The frequency of training epochs is then determined; one epoch is defined as the complete dataset running through the BMPTtery once, forward and backward. As shown in
Table 1, increasing the epochs from 10 to 20 results in a reduction of MRE and MAE from 0.33636% and 9.368% to 0.33633% and 9.367%, respectively, indicating a gradual improvement in the prediction model’s performance. When the epoch is set to 30 or 50, both the MRE and MAE measures exhibit an increasing trend when compared to 20 epochs, indicating that the model’s performance does not improve with the number of epochs. Consequently, 20 is chosen as the epoch.
Next, the value of TWS is examined.
Table 1 shows that the MRE, RMSE and MAE show an increasing trend when increasing from the initial value to 90 (15 min), whereas the MRE, RMSE, and MAE are decreasing when the TWS decreases from the initial value to 6 (1 min), which suggests that adjusting the TWS value can enhance the model’s performance, and therefore setting the TWS to 6 (1-min data).
In addition, the prediction accuracy of the model decreases with the increase of PWS, and when the PWS is 6 (1 min), the MRE, RMSE, and MAE are smaller than the corresponding values when the PWS is equal to 12 (2 min), 30 (5 min), 60 (10 min), and 90 (15 min), respectively. Clearly, reducing the prediction time step enhances the accuracy of the results. However, this study aims to predict battery thermal runaway in advance. Excessively minimizing PWS reduces the warning time. As illustrated in
Table 1, a smaller PWS increases prediction accuracy but decreases warning time. The larger the PWS, the lower the prediction accuracy, but the driver has more time to take safety measures when the temperature anomaly is predicted. After considering the prediction accuracy and timeliness, the PWS is set to 6, which indicates that the temperature can be predicted 1 min in advance, and under this condition, the MRE, RMSE, and MAE are 0.2812%, 0.2837 °C, and 7.858%, which satisfy the prediction accuracy requirement.
In summary, the multi-step ahead temperature prediction model’s optimum values for batch size, dropout rate, epoch, TWS, and PWS are 16, 0.1, 20, 6, 6.
5. Conclusions
5.1. Work Summary
This paper proposes and validates a multi-step battery temperature prediction method based on the BMPTtery model using actual operational data from electric vehicles. The method helps identify frequent battery temperature anomalies by accurately estimating battery temperatures in advance. The study begins by inverting the multivariate dimensions to better capture the variable relationships between individual time series. The battery temperature is then predicted using the novel network Mamba, and the model’s hyperparameters are found using a tenfold cross-validation technique. Subsequently, the temperature prediction model was trained using the fault-free data, and the results showed that the temperature prediction curves were able to effectively track all the probe temperature variations with a maximum error of no more than 5 °C. In the end, the temperature anomaly diagnosis strategy and the proposed temperature prediction method are utilized to accurately and timely detect temperature faults in the battery system, including excessive temperature, rapid temperature increase, and significant temperature variation.
The devised technique performs exceptionally well in temperature prediction and temperature anomaly identification, according to experimental data. The method provides a viable solution for assessing battery safety by identifying thermal issues and reducing the likelihood of uncontrolled thermal escalation. Moreover, the technique allows for flexible adjustment of the prediction range in accordance with the required prediction sensitivity. The driver and the big data platform manager may have enough time to take immediate action if any temperature anomalies or thermal defects are found inside the next prediction window.
5.2. Future Work
Despite the effective results achieved in this study, thermal runaway of batteries is a complex phenomenon involving a variety of factors such as electrochemical reactions, material properties, mechanical stresses, and environmental conditions. To make the model predictions more realistic and comprehensive, future research will focus on the following areas: Firstly, more variables related to thermal runaway are incorporated into the existing model, such as battery electrochemical reaction parameters, ambient temperature changes, mechanical stress, etc., so that the model can more comprehensively reflect the behavior of the battery under actual working conditions. Secondly, the rich experimental and operational data are utilized to improve the generalization ability of the model under different battery types and operating conditions through data augmentation and transfer learning. The model is then integrated into the battery management system (BMS) to realize real-time monitoring of battery temperature and thermal state, and develop control strategies to actively prevent thermal runaway. Finally, systematic experimental studies are carried out to verify and calibrate the model prediction results to ensure their reliability and accuracy in practical applications.
By these efforts, the model’s accuracy and realism can be improved to contribute more to preventing battery thermal runaway and enhancing the safety performance of electric vehicles. Enhancing collaboration between academics and industry will facilitate the translation and application of research findings, while also aiding in the testing and improvement of the model.


