Article

Interactive Impacts of Temperature and Elevated CO2 on Basil (Ocimum basilicum L.) Root and Shoot Morphology and Growth

1
North Mississippi Research and Extension Center, Mississippi State University, Verona, MS 38879, USA
2
Department of Plant and Soil Sciences, Mississippi State University, Mississippi State, MS 39762, USA
3
USDA UVB Monitoring and Research Program, Natural Resource Ecology Laboratory, Department of Ecosystem Science and Sustainability, Colorado State University, Fort Collins, CO 80523, USA
*
Author to whom correspondence should be addressed.
Horticulturae 2021, 7(5), 112; https://doi.org/10.3390/horticulturae7050112
Submission received: 6 April 2021 / Revised: 6 May 2021 / Accepted: 7 May 2021 / Published: 14 May 2021
(This article belongs to the Special Issue Plant Physiology under Abiotic Stresses)

Abstract

:
Recent evidence suggests that the effects of temperature significantly affect the growth and development of basil plants with detrimental impacts on yield. The current research investigated the interactive effects of varying temperature and CO2 levels on the shoot and root morphology and growth of early and late-season basil plants. Basil plants were subjected to control (30/22 °C), low (20/12 °C), and high (38/30 °C) temperature under ambient (420 μL L−1) and elevated (720 μL L−1) CO2 concentrations. Decreasing the temperature to 20/12 °C caused more adverse effects on the morphological traits of the early-season basil. Relative to the control treatments, low- and high-temperature stresses decreased 71 and 14% in marketable fresh mass, respectively. Basil exhibited an increase in plant height, node and branch numbers, specific leaf area, anthocyanin and nitrogen balance index, root tips, and root crossings when subjected to high-temperature stress. Furthermore, elevated CO2 affected many morphological features compared to ambient CO2 concentrations. The findings of this study suggest that varying the growth temperature of basil plants would more significantly impact the shoot and root morphologies and growth rates of basil than increasing the CO2 concentrations, which ameliorated the adverse impacts of temperature stress.

1. Introduction

Climate change is increasingly recognized as a serious, global agricultural concern affecting plant growth and development with detrimental impacts on the yields of many important crops. Over the past century, there have been a dramatic increase in atmospheric carbon dioxide (CO2) concentrations with a corresponding rise in global temperatures [1]. Global atmospheric CO2 is rising (above 417 μL L−1 in 2021) [2] and is projected by climate models to reach 540 to 970 μL L−1 by 2100 because of human activities, declining carbon sinks, and natural global cycles [3,4]. As delineated in the fourth U.S. climate assessment, global temperature is projected to rise in the range of 1.5 °C and 4.5 °C in the next century due to the levels of atmospheric CO2 and other greenhouse gases increasing at an alarming rate [1]. Atmospheric CO2 and temperature are critical in the photosynthesis, physiological, and developmental processes that occur in many crops, especially C3 crops, including basil (Ocimum basilicum L.) [5,6]. Since climate change induces multiple abiotic stressors that affect crop yield worldwide, the impact of elevated CO2 and temperature stress on basil growth and development has been distinguished as a vital area for additional studies. A great deal of the research to date, nonetheless, has focused on individual abiotic stresses and not their interactions with less consideration on the morphology and growth parameters of basil roots and shoots. Hence, it is imperative to understand the interactive effects of elevated CO2 and temperature stress on basil growth and morphology to ensure sustainable crop production.
Basil is an essential herbaceous aromatic plant with a noteworthy contribution to enhancing cuisine nutrition, healthy living, and landscape aesthetics. Globally, a large proportion of high-quality basil is cultivated for its essential oil, dry leaves, and flowers [7,8]. Generally, basil is widely adapted to various climates and regions, and therefore it is cultivated throughout the globe. However, recent evidence suggests that basil growth and development can be seriously impaired by low-temperature stress and is susceptible to growth temperatures below 10 °C [9,10]. Low-temperature stress can be deleterious to basil growth and morphology, especially during its seedling and vegetative stage, with resultant effects on reduced productivity [10]. Chilling causes brown discoloration of interveinal leaf areas (LA), increases leaf-blade thickening, decreases plant growth, and deteriorates quality and marketability [9,10]. Moreover, low-temperature stress decreases plant height (PH) and fresh mass (FM) of basil by 36% and 63%, respectively, after 15 days of treatment [11]. However, according to previous studies, basil is a thermophilic plant that can sustain growth at a temperature in the range of 29 °C and 35 °C [9,12]. Corroborating this information, Walters and Currey [13] recorded increased biomass, PH, FM, dry mass accumulation (DM), node numbers (NN), and internode length of basil when the growth temperatures were increased to 29 °C.
The response of basil plants to elevated atmospheric CO2 has not been extensively explored. However, previous research has indicated that elevated CO2 will significantly impact basil growth and development primarily because of the significant role CO2 plays in the respiration and photosynthesis of C3 plants [5,14]. Al Jaouni et al. [15] reported that biomass production increased by 40% along with the photosynthetic and respiratory rate of basil, which significantly improved by 80% when atmospheric CO2 was increased from 360 to 620 μL L−1. The improved photosynthetic rate was attributed to the role of elevated atmospheric CO2 in repressing the oxygenation reaction of Rubisco, leading to improved carbon gains [14].
Individual and multiple interacting abiotic stresses have been noted to significantly affect plant roots’ growth and morphology due to the pivotal role the root system plays in plant growth [16,17]. Root systems are instrumental in providing anchorage, water, and nutrient acquisition for plant growth. Recent evidence suggests that the plant root system is more critical than the above-ground traits to adapting to abiotic stress [17,18,19]. Varying temperature levels have been noted to have either beneficial or detrimental impacts on plant roots [20,21]. Lahti et al. [22] reported that spruce seedlings subjected to high-temperature stress increased their total root biomass and length growth, indicating the beneficial growth role of rising soil temperatures. Conversely, low-temperature stress constrained plant root morphology, specifically length, depth, and width, when growth temperature decreased to 18/13 °C (day/night), signifying the plant root’s sensitivity to chilling stress [17,23]. Previous studies on the interactive effects of multiple abiotic stresses on plants have shown that increasing CO2 from the ambient concentrations ameliorates other abiotic stressors’ adverse effects by increasing the carbon gains in the plant roots [21]. Accordingly, further investigation is crucial to thoroughly understand the interactive impacts of temperature stress and elevated CO2 on basil root growth and morphology to determine promotive or inhibitive role.
Under these considerations, it is imperative to note that understanding plant root and shoot response to various abiotic stresses is vital in increasing crop productivity while adapting to harsh environmental conditions. Moreover, limited information has been provided on basil roots in response to individual and multiple abiotic stress. Therefore, this study aims to investigate the individual and interactive impacts of elevated CO2 and temperature stress on the growth and morphology of basil shoots and roots.

2. Materials and Methods

Basil ‘Genovese’ (Johnny’s Selected Seeds, Winslow, ME, USA) seeds were planted in polyvinyl-chloride pots (15.2 cm diameter by 30.5 cm height). Each pot was filled up with 500 g gravel and then filled with a mixture of sand and topsoil (3:1 VV) in the soil-plant-atmosphere-research (SPAR) units at the Rodney Foil Plant Science research facility of Mississippi State University, Mississippi State, MS, USA, June–July 2019. The SPAR units can control environmental conditions, including temperature and CO2 concentration levels, at predetermined set points. More information on the SPAR chamber’s subtleties is portrayed by Reddy et al. [24] and Wijewardana et al. [25].
Six seeds previously selected by size and quality were planted in each pot, and approximately 14 days after sowing (DAS), the plants were thinned to one plant per pot, and temperature and CO2 treatments were initiated. Throughout the experiment, basil plants were irrigated with full-strength Hoagland’s nutrient solution [26] three times daily (7 a.m., 12 p.m., and 5 p.m.) via an automated computer-controlled drip system. Irrigation amounts were based on the evapotranspiration of the basil plants within each chamber. Irrigation was then applied at 120% of the amount of water lost the previous day and split between each irrigation cycle.
The experiment was organized in a randomized complete block design within a three by two factorial arrangement with temperature and CO2 treatments. A total of six SPAR chambers represents three blocks with ten replications. Each SPAR chamber consisted of three rows of pots with ten pots per row in each SPAR chamber. All environmental growing conditions except for temperature and CO2 were kept the same throughout the experiment.

2.1. Temperature and CO2 Treatments

Basil plants were randomly assigned to each chamber consisting of 20/12, 30/22, and 38/30 °C temperature treatments in combination with ambient (420 μL L−1) or elevated (720 μL L−1) CO2 concentrations (Table 1). The day- and night-time temperatures were, respectively, initiated at dawn and one hour after nightfall. Table 1 shows the average environmental conditions in which the experiment was conducted. During the experiment, three temperature treatments, 20/12, 30/22, and 38/30 °C, were regarded as low, optimum, and high temperatures, respectively, for basil growth and development.

2.2. Morphophysiological Measurements

At 17 and 38 days after treatment (DAT), basil plants from each treatment combination were harvested to assess their phenotype and to obtain growth data on early- and late-season effects of temperature and CO2. Basil phenotypic data of plant height (PH), node number (NN), branch number (BN), and marketable FM were measured for each treatment combination. LA was measured using the LI-3100 leaf-area meter (Li-Cor Bioscience, Lincoln, NE). Plant component FM was obtained from all basil plants using a weighing scale. The plant FM samples were then dried in a forced-air oven at 75 °C for two days to obtain basil dry mass (DM). Specific leaf area (SLA) is the measure of the leaf area formed per unit of leaf biomass, and plants usually use variation in SLA as a means of adapting to suboptimal conditions [27]. The measured DM and LA were utilized to estimate SLA (cm2 g−1).

2.3. Root Image Acquisition and Analysis

The basil plants were severed at the soil surface and divided into stem and roots. The roots were carefully washed to remove excess soil from the root system and ensure clean measurements. The total root length (TRL) was measured using a meter ruler. Next, the cleansed roots were soaked in a 5 mm Plexiglass tray filled with water, where individual roots were straightened out and set apart for root imaging. A specialized dual-scan optical scanner (Regent Instruments, Inc., Québec, Canada) connected to a PC was used to capture gray-scaled root images according to the method described by Wijewardana et al. [25]. Acquired images were analyzed for the total root length (TRL), root surface area (RSA), average root diameter (RAD), root volume (RV), number of roots (RN), number of roots having laterals (RNL), number of tips (RNT), number of forks (RNF), and number of crossings (RNC) using WinRHIZO Pro software (Regent Instruments, Québec, Canada). More information on the root parameters can be found at www.regentinstruments.com (1 March 2021).

2.4. Physiological Measurements

At 17 DAT, a Dualex® Scientific Polyphenols (FORCE-A, Orsay, France) device was clipped on the second most fully developed basil leaf across treatments to obtain total chlorophyll (TCI) in the mesophyll, flavonoids (Flav), anthocyanin (Anth) in the epidermis, and a nitrogen balance index (NBI). The NBI shows the plants’ nitrogen status by utilizing the proportion of chlorophyll and flavonoid units in the leaves. The TCI was evaluated as the ratio of the leaf transmission of near-infrared and red wavelengths. The Flav and Anth index is based on the measurement of chlorophyll fluorescence, while the NBI is a ratio between chlorophyll and flavonol indexes.
NBI = Chl/Flav

2.5. Epicuticular Wax Content Determination

The epicuticular leaf waxes were extracted and quantitively analyzed in accordance with the method of Ebercon et al. [28] with minor modifications as described by Singh and Reddy [29].

2.6. Data Analysis

The experimental design was a randomized complete block in a factorial arrangement with three temperature treatments, two CO2 treatments, three-block, and ten replications. Data were analyzed using the PROC GLIMMIX analysis of variance (ANOVA) followed by mean separation. Statistical analysis of the data was performed using SAS (version 9.4; SAS Institute, Cary, NC, USA). The standard errors were based on the pooled error term from the ANOVA table. Duncan’s multiple range test (p ≤ 0.05) was used to differentiate between treatment classifications when F values were significant for the main effects. Model-based values were reported rather than the unequal standard error from a data-based calculation because pooled errors reflected the statistical testing. Diagnostic tests, such as Shapiro–Wilk in SAS, were conducted to ensure that treatment variances were statistically equal before pooling.

3. Results

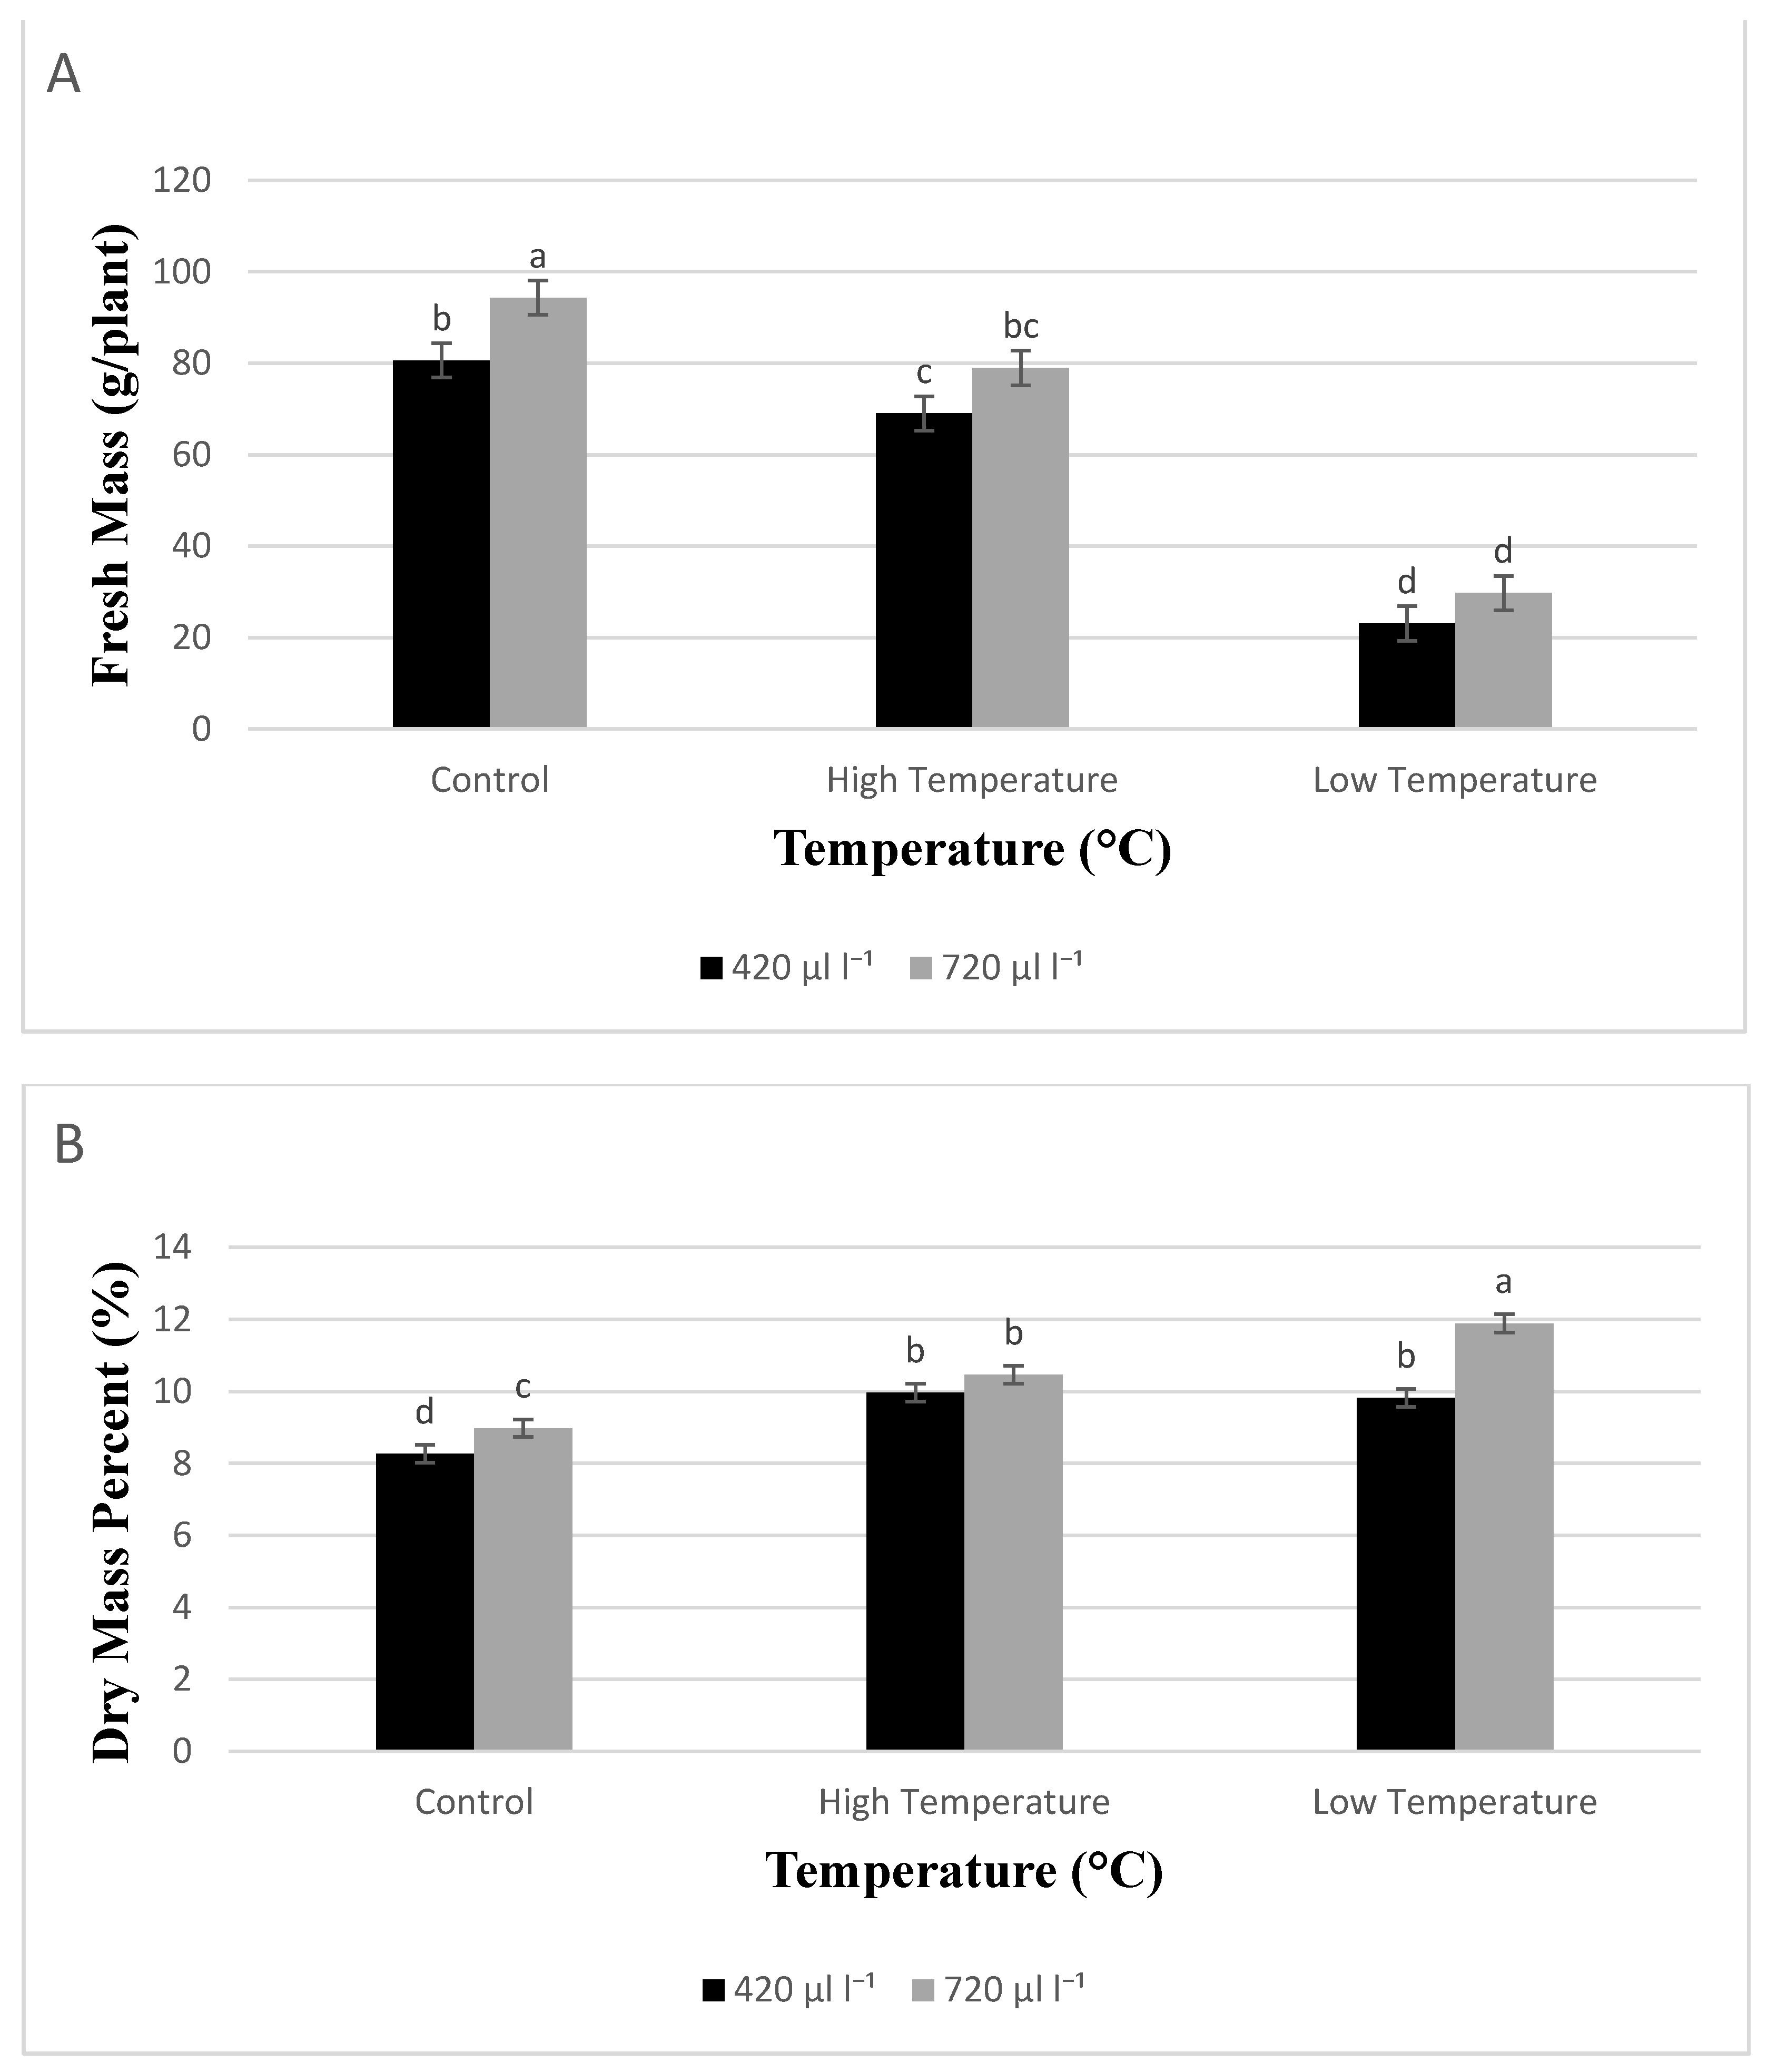
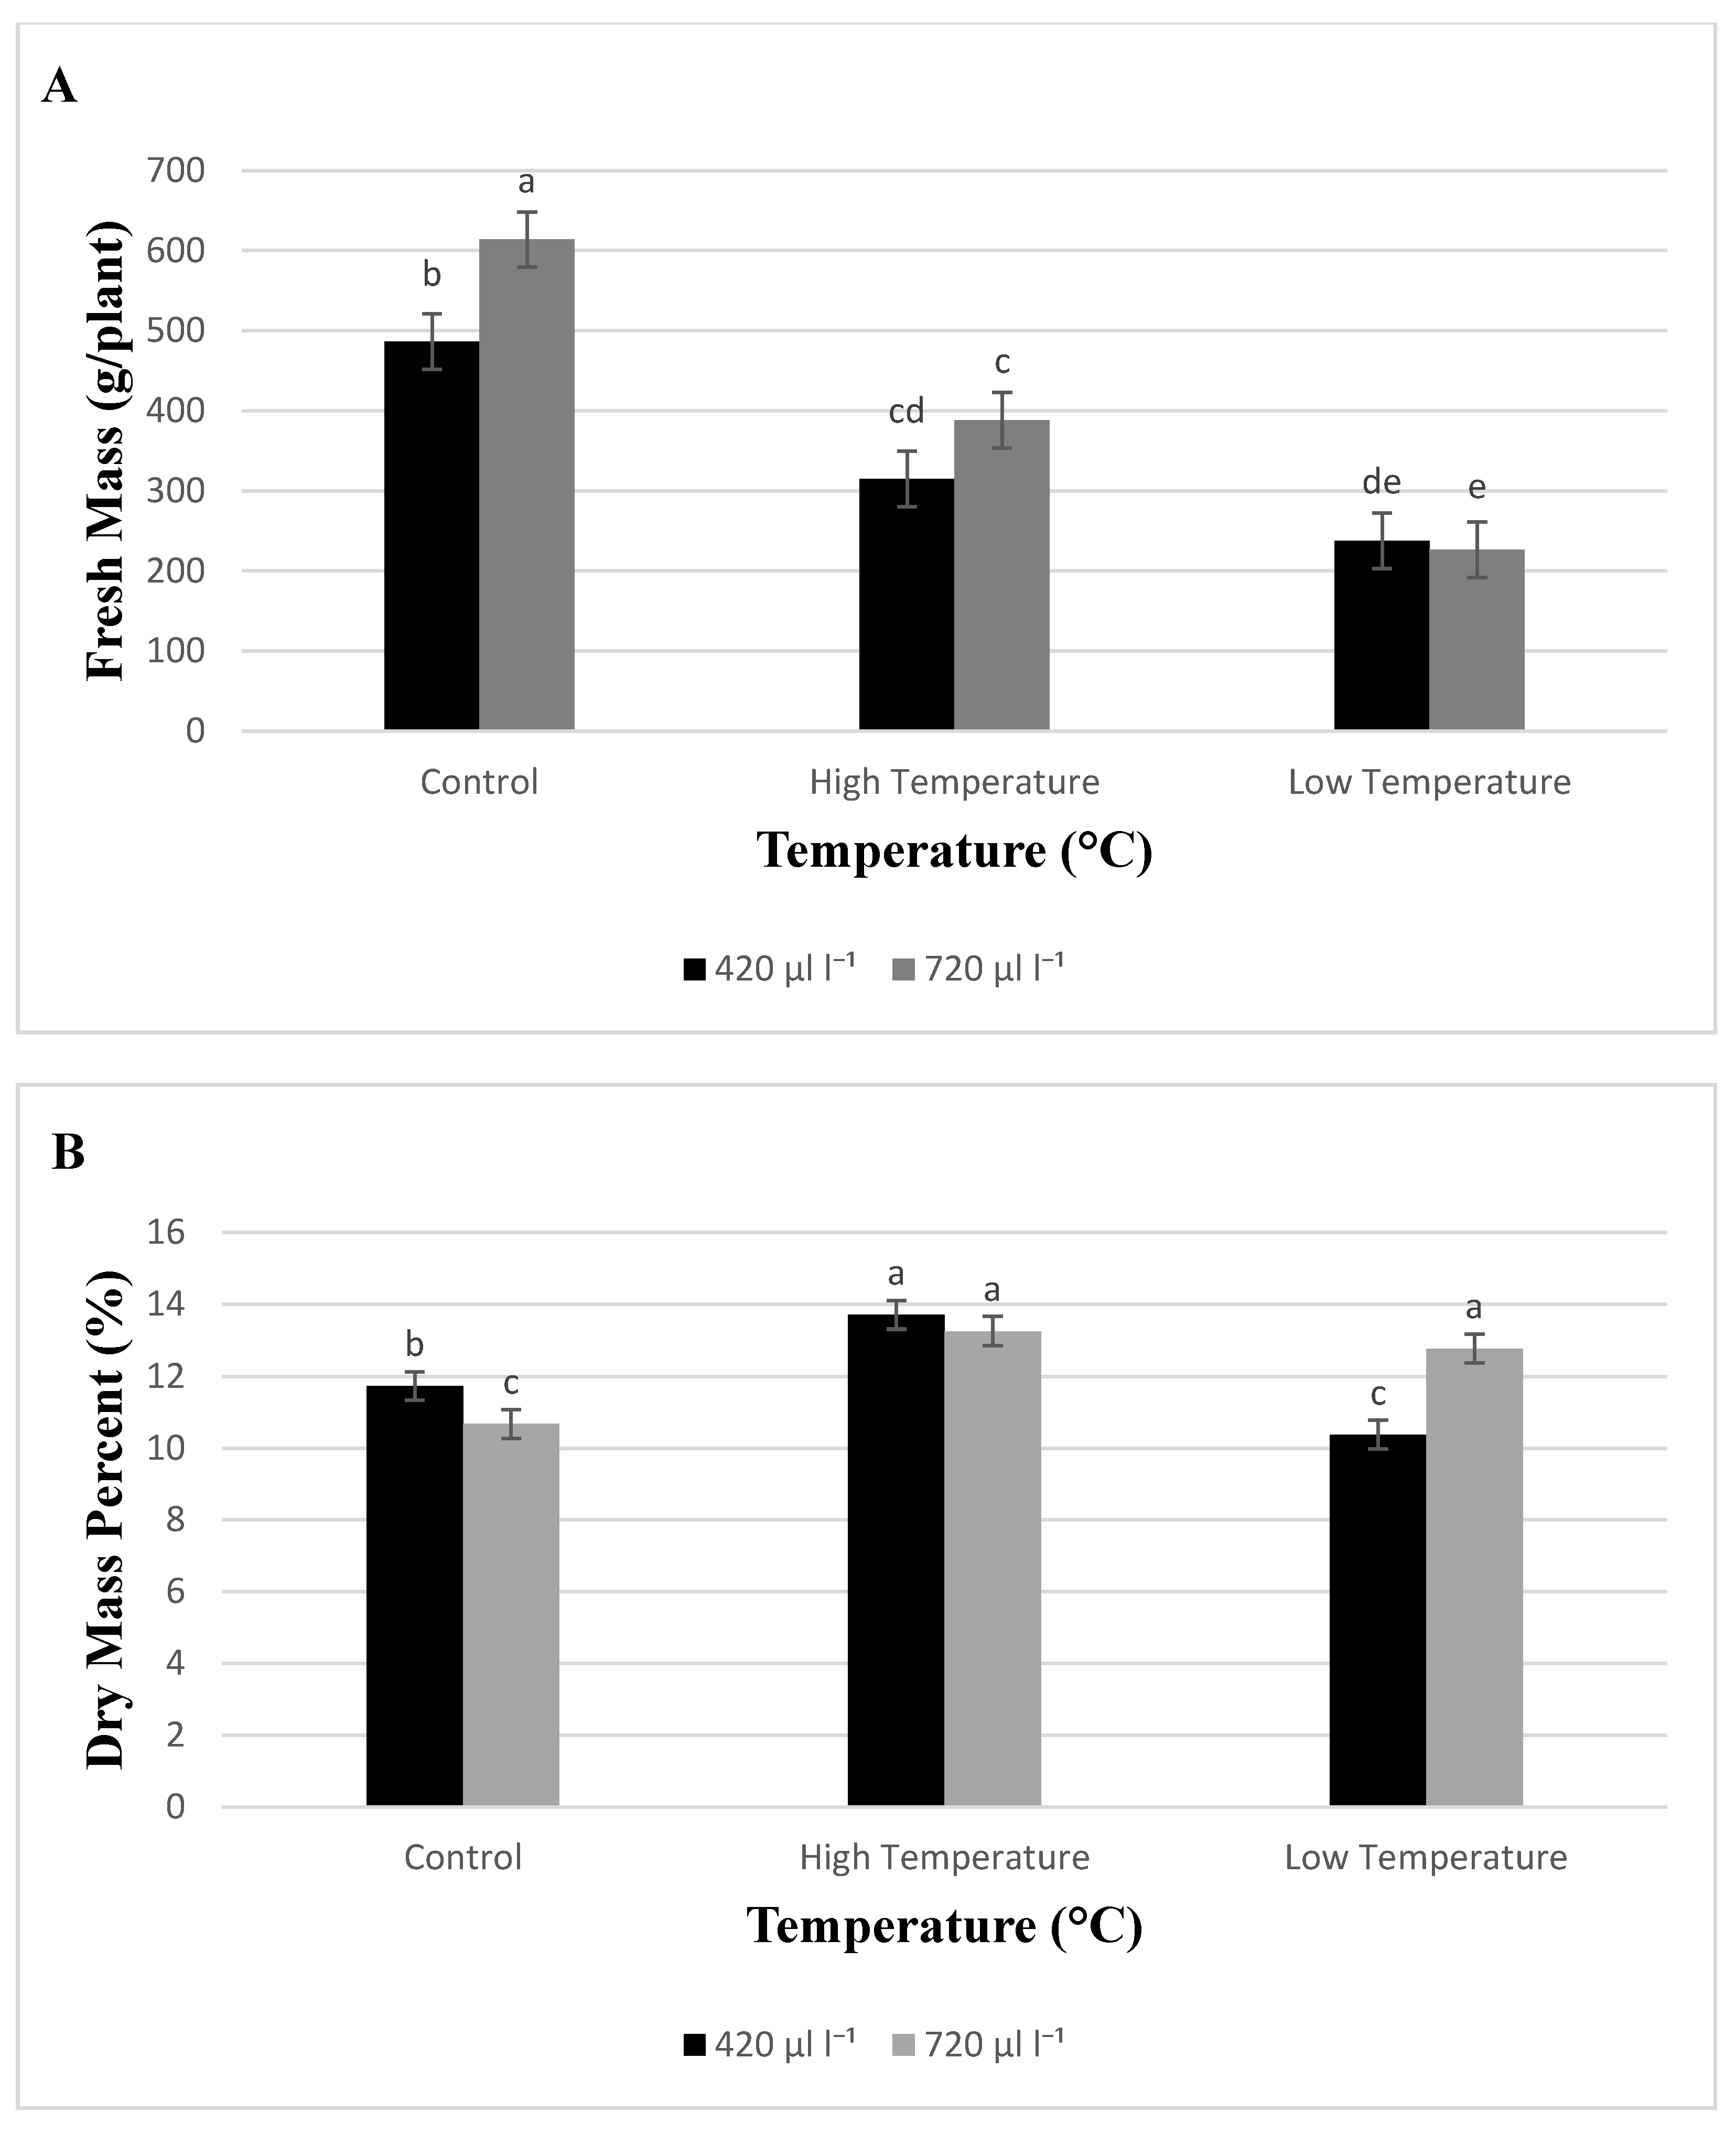
3.1. Shoot Growth and Morphology

The analysis of variance revealed that temperature and CO2 independently affect the morphological traits of basil (Table 2). The temperature treatments significantly affected (p < 0.001) the PH of both the early-season (17 DAT) and late-season (38 DAT) basil. However, CO2 only affected (p < 0.01) the PH of the early-season basil (17 DAT) and no significant difference (p > 0.05) of the late-season basil (38 DAT). Also, there was no interaction between temperature and CO2 effects on the PH of basil. At 17 DAT, low-temperature stress decreased PH of basil plants by 55% and 46% when subjected to elevated CO2 compared to the control temperature at ambient CO2. At 38 DAT, basil PH decreased by 17% and 22% at the high- and low-temperature stresses, respectively, compared to the control temperature at ambient CO2 (Table 3).
At 17 DAT, low- and high-temperature stresses decreased the LA of basil by 67% and 15%, respectively, compared to the control temperature at ambient CO2 (Table 2). While at 38 DAT, low- and high-temperature stresses decreased the LA of basil by 40% and 34%, respectively, compared to the control temperature at ambient CO2. However, the LA of basil was not different (p > 0.05) when subjected to elevated CO2. The basil plants increased in SLA by 21% under high-temperature stress, whereas they decreased SLA by 27% at low-temperature stress (Figure 1). Elevated CO2 decreased the SLA of basil by 9% when compared to the control treatments. However, SLA’s response to both CO2 and temperature was not significant (p > 0.05).
At 17 and 38 DAT, the DM of basil leaf and stem were significantly different (p > 0.001) when subjected to both low- and high-temperature stresses. Basil plants under low-temperature stress showed a more decreased measure of biomass per plant than basil under control temperature at ambient CO2. At 17 DAT, high temperature showed a 3% reduction in leaf DM of basil, and this decline was ameliorated by elevated CO2 to increase basil leaf DM by 17% (Figure 2C). However, at 38 DAT, high-temperature stress decreased basil leaf DM by 16% compared to basil under control temperature at ambient CO2 (Figure 3C). It is imperative to state that elevated CO2 significantly (p > 0.001) increased both leaf and stem DM of basil at 17 DAT. However, elevated CO2 did not show a significant effect on leaf DM (p > 0.05) but stem DM (p < 0.05) at 38 DAT.
Contrary to the control temperature at ambient CO2, basil plant marketable FM decreased by 71% and 14% when exposed to cold and heat stresses, respectively (Figure 2A). Elevated CO2 ameliorated the adverse effects and decreased marketable FM by up to 63% more at low temperatures than basil grown at the control temperature. At 38 DAT, similar results were discovered for decreasing marketable FM (Figure 3A).
The basil plants showed a significant reduction in leaf wax content when subjected to both low- and high-temperature stresses and elevated CO2 (Figure 4). However, there was no interaction effect between CO2 and temperature treatments on basil leaf wax content.

3.2. Root Development Parameters

Amongst the root traits, TRL and RSA were more sensitive to the interactions between temperature and CO2 than other root traits (Table 4). Basil RL, RAD, RV, RNT, RNF, and RNC were also significantly affected by the main effects of temperature and CO2 (Table 4). At 17 DAT, TRL decreased by 41% and 17% under low- and high-temperature stresses, respectively, compared to the control temperature at ambient CO2. It is interesting to note that the elevated CO2 mitigated the detrimental effects and decreased basil TRL by 27% and 8% at low- and high-temperature treatments, respectively, compared to the control temperature at ambient CO2. Similar results were observed with decreasing RSA of basil. Under high-temperature stress, basil plants exhibited 31%, 27%, and 12% reduction in RSA, RAD, and RV, respectively, compared to the control treatment. RNT, RNF, and RNC, which influence root’s architecture, were observed to be considerably higher and lower under high and low-temperature stress, respectively, compared with the control treatments.

3.3. Physiological Parameters

The results showed that temperature, CO2, and its interactions on basil’s epidermal anthocyanin index (Anth) were discovered to be significant. The concentration of Anth in basil increased by 7% and 10% under high-temperature stress at both ambient and elevated CO2, respectively (Figure 5A). However, the Anth concentration of basil decreased by 21% and 2% under low temperature at both ambient and elevated CO2, respectively. The results also showed a higher index of flavonoids under low-temperature stress, while under high-temperature stress, it decreased significantly (Figure 5B). Elevated CO2 significantly increased the index of basil flavonoids under both high- and low-temperature stress. The basil leaves showed significantly higher TCI when subjected to low-temperature stress than the control treatments (Figure 5C). Comparing the basil TCI to the control treatments, high-temperature treatments significantly increased the basil TCI. However, elevated CO2 significantly decreased the NBI of the basil plant at both low- and high-temperature stresses (Figure 5D). Similar results were observed of TCI when subjected to elevated CO2 at low temperatures.

4. Discussion

Temperature and elevated CO2 remain important factors that significantly affect the growth and development of C3 plants, including basil [13,30]. Hence, exploring the interactive effects of multiple abiotic stressors on the growth and development traits associated with basil roots and shoots is imperative. Understanding crop performance to temperature stress and elevated CO2 is crucial during the early seedling stage because it affects developing a uniform and healthy plant canopy.
In this current research, increasing the temperature to 38/30 °C at ambient CO2 concentration caused less adverse effects on the early season’s morphological features (17 DAT) of basil. Previous research indicated an increase in the PH, NN, and BN primarily because basil plants prefer warmer temperatures [31]. For instance, in this current study, high-temperature stress caused a significant decrease in late-season basil PH, NN, and BN by 17%, 16%, 18%, respectively, compared to the control treatments. However, in contrast to the control treatments, there was a significant increase in the early-season basil PH, NN, and BN by 1%, 20%, and 57%, respectively. These findings suggest that growing basil under high-temperature stress is beneficial to basil at its early stage and detrimental to the late-season basil.
On the other hand, growing both the early- and late-season basil under low-temperature stress significantly decreased basil PH, NN, and BN by 55%, 35%, and 58%, respectively. These results are in line with previous studies [9,13]. They reported a reduction in basil PH when exposed to low temperature and increased PH of basil grown under high-temperature stress. It is important to note that CO2 only affected the PH of basil at 17 DAT, and there was no significant difference in basil at 38 DAT. Thus, these results signified the role of elevated CO2 in ameliorating the adverse impacts of temperature stress due to the higher production of carbon available for increased rates of photosynthesis. Several studies have surmised the beneficial effects of elevated CO2 while varying the temperature levels [5,20,21,27].
Altering plants’ growth temperature could result in fewer basil leaves, perhaps due to the reduction in the rate of emergence of plant NN and increased rate of leaf senescence [32]. Basil plants revealed the highest decrease in the LA when exposed to low-temperature stress, indicating their sensitivity to cold stress compared to heat stress. There was a 27% decline in the SLA of basil in response to cold stress because the LA is directly linked to SLA. Correspondingly, Bannayan et al. [27] and Caliskan et al. [32] posited that increasing basil’s growth temperature would increase SLA and vice versa. In this study, when SLA declined in response to elevated CO2, there was no significant difference in the LA considering elevated CO2. The present exploration also revealed a positive effect of elevated CO2 on basil’s total biomass, which is usually expected of C3 plants. The adverse impacts of both low- and high-temperature stresses on the FM and DM of basil were ameliorated by elevated CO2. Thus, these results suggest that basil plants could cope with sub-optimal temperature conditions because of enhanced photosynthetic rates when CO2 is elevated. Al Jaouni et al. [15] also reported that basil biomass production increased by 40% under elevated CO2.
The plant root system is composed of various sorts of roots that change in morphology and function. The root architecture illustrates the root system’s spatial organization in the soil and is crucial for plants in obtaining water and nutrients required for growth and development [33,34]. Recent evidence suggests that the root traits required for obtaining resources from the soil are also linked with plants’ adaptive characteristics to reduce the adverse effects of variation in growth temperatures [16,18]. The adaptive traits of the plant’s roots to environmental changes indicated that TRL and RSA were more sensitive to both temperature- and CO2 -change. Luo et al. [17] revealed root width and depth to be susceptible to temperature changes. However, RNT and RNC, which influence the root’s architecture, were considerably larger under high-temperature stress. Increasing the CO2 levels also contributed to increasing the RNC. These results are consistent with previous studies on C3 crops, such as members of genus Brassica and order Fabales [17,35]. Previous studies additionally revealed that high RNT and RNC contribute to a thinner RAD [36]. In support of our research, basil plants showed decreased RAD and RV when subjected to heat stress. This implies that a reduced RAD under temperature stress would obtain additional soil nutrients and increase nutrient absorption, suggesting basil’s tolerance to warmer conditions [17,37].
Analogous to shoot and root traits, basil plants’ physiological traits were also affected by temperature stress. Growing basil plants under low-temperature stress significantly increased the concentration of flavonoids index in basil leaves. While under high-temperature treatment, the index of flavonoids of basil decreased considerably. These findings contradict many studies [31,38,39] because increased flavonoids are usually associated with thermophilic plant defense mechanisms against heat stress. Moreover, increased growth temperature from 30/22 °C to 38/30 °C for basil under elevated CO2 produced more Anth content. These results suggest that subjecting basil to temperature stress and elevated CO2 does not cause a drastic loss in Anth, which matches those observed in earlier studies [15]. Moreover, epicuticular wax decreased significantly both under hot and cold stress conditions, which is unexpected because increased wax content is always utilized as a physiological trait for selecting thermophilic plants [40].
In contrast with the present results, previous studies have demonstrated that decreasing plant growth temperature significantly increased the chlorophyll index [41,42]. Many studies have utilized the plant chlorophyll index as a metric for characterizing the plant’s tolerance to multiple abiotic stresses, especially temperature stress in grain and vegetables [41,43,44]. Low temperature significantly increased the non-destructive TCI of basil leaves by 18%. However, a reduction of TCI was observed for basil leaves when the temperature was increased to 38/30 °C. It is important to note that the lowest basil TCI was observed under elevated CO2 at 30/22 °C, while the maximum basil TCI was recorded when basil was subjected to low temperatures at ambient CO2. In addition to using TCI as an essential tool for selecting plants for adapting to multiple abiotic stressors, NBI has been noted to determine in vivo the plant nitrogen status [42,45]. It can also be used to measure the ratio of carbon and nitrogen capacity of plants. In this study, the NBI of basil leaves was observed at maximum when subjected to 30/22 °C at ambient CO2, indicating basil tolerance to heat stress. However, the lowest basil NBI values were recorded under low-temperature stress, which further supports the previous information on the sensitivity of basil to chilling stress.

5. Conclusions

Elevated CO2 and temperature stress independently affect the growth and morphology of basil roots and shoots. Decreasing the basil’s growth temperature to 20/12 °C was the major determining factor in both the early- and late-season basil’s morphological features. Low-temperature stress also resulted in the significant reduction of physiological parameters, thus repressing basil plants’ growth. Furthermore, the accelerated concentration of chlorophyll and flavonoid pigment degradation of basil plants was observed when elevated CO2 interacted with low-temperature stress. These results further proved the susceptibility of basil plants to chilling stress. Contrarily, elevated CO2 remarkably ameliorated the damage caused by low-temperature stress on the morphology and growth of basil roots, shoots, and physiological parameters. However, basil, being a thermophilic plant, was observed to increase its plant height, node numbers, branch numbers, net photosynthesis, specific leaf area, anthocyanin, and nitrogen-balance index when subjected to high-temperature stress. The outcomes of this research suggest that altering the growth temperature of basil plants would more significantly impact the growth and development rates of basil than increasing the CO2 concentrations, which ameliorated the adverse impacts of temperature stress.

Author Contributions

T.C.B.: conceptualization, methodology, validation, formal analysis, investigation, resources, data curation, writing—original draft, writing—review & editing, visualization, supervision, project administration, funding acquisition. O.J.O.: formal analysis, writing—original draft, writing—review & editing. A.S.: methodology, validation, investigation. C.H.W.: methodology, validation, formal analysis, investigation. K.R.R.: conceptualization, methodology, validation, formal analysis, investigation, resources, data curation, writing—review & editing, visualization, supervision, project administration, funding acquisition. W.G.: conceptualization, methodology, validation, resources, funding acquisition. All authors have read and agreed to the published version of the manuscript.

Funding

This material is based on the work supported by the USDA-NIFA Hatch Project under accession number 149210, and the National Institute of Food and Agriculture, 2019-34263-30552, and MIS 043050 funded this research.

Institutional Review Board Statement

Not applicable.

Informed Consent Statement

Not applicable.

Data Availability Statement

The data presented in this study are available on request from the corresponding author.

Acknowledgments

We thank David Brand for technical assistance and graduate students at the Environmental Plant Physiology Laboratory for their help during data collection.

Conflicts of Interest

The authors declare that they have no known competing financial interest or personal relationships that could have appeared to influence the work reported in this paper.

Abbreviations

ANTH, epidermal anthocyanin index; BN, branch number; DAS, days after sowing; DAT, days after treatment; DM, dry mass; Flav, epidermal flavonoids index; FM, fresh mass; LA, leaf area; NBI, nitrogen balance index; NN, node numbers; PH, plant height; RAD, average root diameter; RDW, root dry mass; RN, number of roots; RNC, number of crossings; RNF, number of forks; RNL, number of roots having laterals; RNT, number of tips; RSA, root surface area; RV, root volume; SLA, specific leaf area; SPAR, soil-plant-atmosphere-research; TCI, total chlorophyll index; and TRL, total root length.

References

  1. USGCRP. Impacts, Risks, and Adaptation in the United States: Fourth National Climate Assessment, Volume II; Reidmiller, D.R., Avery, C.W., Easterling, D.R., Kunkel, K.E., Lewis, K.L.M., Maycock, T.L., Stewart, B.C., Eds.; US Global Change Research Program: Washington, DC, USA, 2018; p. 1515.
  2. Baker, H. Atmospheric CO2 Will Pass an Alarming Milestone in 2021. Available online: https://www.livescience.com/co2-concentration-rising-past-alarming-threshold.html (accessed on 8 February 2021).
  3. IPCC. Climate Change 2014: Impacts, Adaptation, and Vulnerability. Part A: Global and Sectoral Aspects. Contribution of Working Group II to the Fifth Assessment Report of the Intergovernmental Panel on Climate Change; Field, C.B., Barros, V.R., Dokken, D.J., Mach, K.J., Mastrandrea, M.D., Bilir, T.E., Chatterjee, M., Ebi, K.L., Estrada, Y.O., Genova, R.C., et al., Eds.; Cambridge University Press: Cambridge, UK; New York, NY, USA, 2014; p. 1132. [Google Scholar]
  4. Stocker, T.F.; Qin, D.; Plattner, G.-K.; Tignor, M.; Allen, S.K.; Boschung, J.; Nauels, A.; Xia, Y.; Bex, V.; Midgley, P.M. Climate Change 2013: The Physical Science Basis. Intergovernmental Panel on Climate Change, Working Group I Contribution to the IPCC Fifth Assessment Report (AR5); Cambridge University Press: New York, NY, USA, 2013; p. 25. [Google Scholar]
  5. Reddy, A.R.; Reddy, K.R.; Hodges, H.F. Interactive effects of elevated carbon dioxide and growth temperature on photosynthesis in cotton leaves. Plant Growth Regul. 1998, 26, 33–40. [Google Scholar] [CrossRef]
  6. Dong, J.; Gruda, N.; Li, X.; Tang, Y.; Zhang, P.; Duan, Z. Sustainable vegetable production under changing climate: The impact of elevated CO2 on yield of vegetables and the interactions with environments-A review. J. Clean. Prod. 2020, 253, 119920. [Google Scholar] [CrossRef]
  7. Simon, J.E.; Quinn, J.; Murray, R.G. Basil: A Source of Essential Oils. In Adv. New Crops; Janick, J., Simon, J.E., Eds.; Timber Press: Portland, OR, USA, 1990; pp. 484–489. [Google Scholar]
  8. Kopsell, D.A.; Kopsell, D.E.; Curran-Celentano, J. Carotenoid and chlorophyll pigments in sweet basil grown in the field and greenhouse. Hort. Sci. 2005, 40, 1230–1233. [Google Scholar] [CrossRef] [Green Version]
  9. Chang, X.; Alderson, P.; Wright, C. Effect of temperature integration on the growth and volatile oil content of basil (Ocimum Basilicum L.). J. Hortic. Sci. Biotechnol. 2005, 80, 593–598. [Google Scholar] [CrossRef]
  10. Ribeiro, P.; Simon, J.E. Breeding sweet basil for chilling tolerance. In Issues in New Crops and New Uses; Janick, J., Whipkey, A., Eds.; ASHS Press: Alexandria, VA, USA, 2007; pp. 302–305. [Google Scholar]
  11. Mortensen, L.M. The effect of air temperature on growth of eight herb species. Amer. J. Plant Sci. 2014, 5, 1542–1546. [Google Scholar] [CrossRef] [Green Version]
  12. Hiltunen, R.; Holm, Y. Essential of oil of Ocimum. In Basil: The Genus Ocimum; Hiltunen, R., Holm, Y., Eds.; Harwood academic publishers: Amsterdam, The Netherlands, 1999; pp. 113–135. [Google Scholar]
  13. Walters, K.J.; Currey, C.J. Growth and development of basil species in response to temperature. Hort. Sci. 2019, 54, 1915–1920. [Google Scholar] [CrossRef] [Green Version]
  14. Watanabe, C.K.; Sato, S.; Yanagisawa, S.; Uesono, Y.; Terashima, I.; Noguchi, K. Effects of elevated CO2 on levels of primary metabolites and transcripts of genes encoding respiratory enzymes and their diurnal patterns in Arabidopsis thaliana: Possible relationships with respiratory rates. Plant Cell Physiol. 2014, 55, 341–357. [Google Scholar] [CrossRef] [PubMed] [Green Version]
  15. Jaouni, S.A.; Saleh, A.M.; Wadaan, M.A.M.; Hozzein, W.N.; Selim, S.; AbdElgawad, H. Elevated CO2 induces a global metabolic change in basil (Ocimum Basilicum L.) and peppermint (Mentha Piperita L.) and improves their biological activity. J. Plant Physiol. 2018, 224–225, 121–131. [Google Scholar] [CrossRef]
  16. de Dorlodot, S.; Forster, B.; Pagès, L.; Price, A.; Tuberosa, R.; Draye, X. Root system architecture: Opportunities and constraints for genetic improvement of crops. Trends Plant Sci. 2007, 12, 474–481. [Google Scholar] [CrossRef] [PubMed]
  17. Luo, H.; Xu, H.; Chu, C.; He, F.; Fang, S. High temperature can change root system architecture and intensify root interactions of plant seedlings. Front. Plant Sci. 2020, 11, 160. [Google Scholar] [CrossRef] [PubMed] [Green Version]
  18. Bardgett, R.D.; Mommer, L.; De Vries, F.T. Going underground: Root traits as drivers of ecosystem processes. Trends Ecol. Evol. 2014, 29, 692–699. [Google Scholar] [CrossRef] [PubMed]
  19. Fitter, A.H.; Caldwell, M.M.; Pearcy, R.W. Architecture and biomass allocation as components of the plastic response of root systems to soil heterogeneity. In Exploitation of Environmental Heterogeneity by Plants: Ecophysiological Processes Above-And Belowground; Academic Press: Cambridge, MA, USA, 1994; pp. 305–323. [Google Scholar]
  20. Brand, D.; Wijewardana, C.; Gao, W.; Reddy, K.R. Interactive effects of carbon dioxide, low temperature, and ultraviolet-b radiation on cotton seedling root and shoot morphology and growth. Front. Earth Sci. 2016, 10, 607–620. [Google Scholar] [CrossRef]
  21. Wijewardana, C.; Henry, W.B.; Gao, W.; Reddy, K.R. Interactive effects on CO2, drought, and ultraviolet-b radiation on maize growth and development. J. Photochem. Photobiol. B. 2016, 160, 198–209. [Google Scholar] [CrossRef] [PubMed]
  22. Lahti, M.; Aphalo, P.J.; Finér, L.; Ryyppö, A.; Lehto, T.; Mannerkoski, H. Effects of soil temperature on shoot and root growth and nutrient uptake of 5-year-old norway spruce seedlings. Tree Physiol. 2005, 25, 115–122. [Google Scholar] [CrossRef] [Green Version]
  23. Balliu, A.; Sallaku, G. The environment temperature affects post-germination growth and root system architecture of pea (Pisum Sativum L) plants. Sci. Hortic. 2021, 278, 109858. [Google Scholar] [CrossRef]
  24. Reddy, K.; Read, J.J.; McKinion, J.M. Soil-Plant-Atmosphere-Research (SPAR) facility: A Tool for plant research and modeling. Biotronics 2001, 30, 27–50. [Google Scholar]
  25. Wijewardana, C.; Hock, M.; Henry, B.; Reddy, K.R. Screening corn hybrids for cold tolerance using morphological traits for early-season seeding. Crop Sci. 2015, 55, 851–867. [Google Scholar] [CrossRef] [Green Version]
  26. Hoagland, D.R.; Arnon, D.I. The Water-Culture Method for Growing Plants without Soil, 2nd ed.; Circular 347; California Agricultural Experiment Station: Berkeley, CA, USA, 1950; p. 347. [Google Scholar]
  27. Bannayan, M.; Tojo Soler, C.M.; Garcia y. Garcia, A.; Guerra, L.C.; Hoogenboom, G. Interactive effects of elevated [CO2] and temperature on growth and development of a short- and long-season peanut cultivar. Clim. Chang. 2009, 93, 389–406. [Google Scholar] [CrossRef]
  28. Ebercon, A.; Blum, A.; Jordan, W.R. A rapid colorimetric method for epicuticular wax contest of sorghum leaves. Crop Sci. 1977, 17, 179–180. [Google Scholar] [CrossRef] [Green Version]
  29. Singh, S.K.; Reddy, K.R. Regulation of photosynthesis, fluorescence, stomatal conductance and water-use efficiency of cowpea (Vigna Unguiculata [L.] Walp.) under drought. J. Photochem. Photobiol. B Biol. 2011, 105, 40–50. [Google Scholar] [CrossRef]
  30. Yuan, L.; Yuan, Y.; Liu, S.; Wang, J.; Zhu, S.; Chen, G.; Hou, J.; Wang, C. Influence of high temperature on photosynthesis, antioxidative capacity of chloroplast, and carbon assimilation among heat-tolerant and heat-susceptible genotypes of nonheading chinese cabbage. HortScience 2017, 52, 1464–1470. [Google Scholar] [CrossRef] [Green Version]
  31. Al-Huqail, A.; El-Dakak, R.M.; Sanad, M.N.; Badr, R.H.; Ibrahim, M.M.; Soliman, D.; Khan, F. Effects of climate temperature and water stress on plant growth and accumulation of antioxidant compounds in sweet basil (Ocimum basilicum L.) leafy vegetable. Scientifica 2020, 3808909. [Google Scholar] [CrossRef] [PubMed] [Green Version]
  32. Caliskan, O.; Odabas, M.S.; Cirak, C. The modeling of the relation among the temperature and light intensity of growth in Ocimum basilicum L. J. Med. Plants Res 2009, 3, 965–977. [Google Scholar] [CrossRef]
  33. Yamauchi, A.; Pardales, J.R., Jr.; Kono, Y. Root system structure and its relation to stress tolerance. In Dyanamics of Roots and Nitrogen in Cropping Systems of the Semi-Arid Tropics; Ito, O., Johansen, C., Adu-Gyamfi, J.J., Katayama, K., Kumar, J.V.D.K., Rego, T.J., Eds.; Japan International Research Center for Ag Sciences: Tsukuba, Japan, 1996; pp. 211–233. [Google Scholar]
  34. Aidoo, M.K.; Bdolach, E.; Fait, A.; Lazarovitch, N.; Rachmilevitch, S. Tolerance to high soil temperature in foxtail millet (Setaria Italica L.) Is related to shoot and root growth and metabolism. Plant Physiol. and Biochem. 2016, 106, 73–81. [Google Scholar] [CrossRef] [PubMed]
  35. Nagel, K.A.; Kastenholz, B.; Jahnke, S.; van Dusschoten, D.; Aach, T.; Mühlich, M.; Truhn, D.; Scharr, H.; Terjung, S.; Walter, A.; et al. Temperature responses of roots: Impact on growth, root system architecture and implications for phenotyping. Funct. Plant Biol. 2009, 36, 947–959. [Google Scholar] [CrossRef] [PubMed]
  36. Kaspar, T.C.; Bland, W.L. Soil temperature and root growth. Soil Sci. 1992, 154, 290–299. [Google Scholar] [CrossRef]
  37. De Kroon, H.; Mommer, L.; Nishiwaki, A. Root competition: Towards a mechanistic understanding. In Root Ecology; de Kroon, H., Visser, E.J.W., Eds.; Ecological Studies (Analysis and Synthesis); Springer: Berlin/Heidelberg, Germany, 2003; Volume 168, pp. 215–234. ISBN 978-3-662-09784-7. [Google Scholar]
  38. Shamloo, M.; Babawale, E.A.; Furtado, A.; Henry, R.J.; Eck, P.K.; Jones, P.J.H. Effects of genotype and temperature on accumulation of plant secondary metabolites in canadian and australian wheat grown under controlled environments. Sci. Rep. 2017, 7, 9133. [Google Scholar] [CrossRef] [PubMed]
  39. Sublett, W.L.; Barickman, T.C.; Sams, C.E. Effects of elevated temperature and potassium on biomass and quality of dark red ‘lollo rosso’ lettuce. Horticulturae 2018, 4, 11. [Google Scholar] [CrossRef] [Green Version]
  40. Jumrani, K.; Bhatia, V.S. Interactive effect of temperature and water stress on physiological and biochemical processes in soybean. Physiol. Mol. Biol. Plant. 2019, 25, 667–681. [Google Scholar] [CrossRef] [PubMed]
  41. Reddy, K.R.; Seghal, A.; Jumaa, S.; Bheemanahalli, R.; Kakar, N.; Redoña, E.D.; Wijewardana, C.; Alsajri, F.A.; Chastain, D.; Gao, W.; et al. Morpho-Physiological characterization of diverse rice genotypes for seedling stage high- and low-temperature tolerance. Agronomy 2021, 11, 112. [Google Scholar] [CrossRef]
  42. Ronga, D.; Rizza, F.; Badeck, F.-W.; Milc, J.; Laviano, L.; Montevecchi, G.; Pecchioni, N.; Francia, E. Physiological responses to chilling in cultivars of processing tomato released and cultivated over the past decades in southern europe. Sci. Hortic. 2018, 231, 118–125. [Google Scholar] [CrossRef]
  43. Agati, G.; Tuccio, L.; Kusznierewicz, B.; Chmiel, T.; Bartoszek, A.; Kowalski, A.; Grzegorzewska, M.; Kosson, R.; Kaniszewski, S. Nondestructive optical sensing of flavonols and chlorophyll in white head cabbage (Brassica Oleracea L. Var. Capitata Subvar. Alba) grown under different nitrogen regimens. J. Agric. Food Chem. 2016, 64, 85–94. [Google Scholar] [CrossRef] [PubMed]
  44. de Freitas, G.M.; Thomas, J.; Liyanage, R.; Lay, J.O.; Basu, S.; Ramegowda, V.; do Amaral, M.N.; Benitez, L.C.; Bolacel Braga, E.J.; Pereira, A. Cold Tolerance response mechanisms revealed through comparative analysis of gene and protein expression in multiple rice genotypes. PLoS ONE 2019, 14, e0218019. [Google Scholar] [CrossRef] [PubMed]
  45. Cerovic, Z.G.; Masdoumier, G.; Ghozlen, N.B.; Latouche, G. A New optical leaf-clip meter for simultaneous non-destructive assessment of leaf chlorophyll and epidermal flavonoids. Physiol. Plant. 2012, 146, 251–260. [Google Scholar] [CrossRef] [PubMed]
Figure 1. Average specific leaf area (SLA) for basil plants grown without temperature stress (control; 30/22 °C), with low-temperature (20/12 °C) stress, and with high-temperature (38/30 °C) stress at 420 and 720 μL L−1 of CO2 concentration after 38 days of treatment. The standard error mean for SLA was 1.2941. Different lower-case letters indicate a significant difference at p = < 0.05 by the least significant difference.
Horticulturae 07 00112 g001
Figure 2. (A) Fresh mass (FM), (B) total dry mass (total DM), and (C) dry mass percent (DM %) for basil plants grown without temperature stress (control; 30/22 °C), with low-temperature (20/12 °C) stress, and with high-temperature (38/30 °C) stress at 420 and 720 μL L−1 of CO2 concentration after 17 days of treatment. The standard error mean was FM = 3.7485, total DM = 0.497, and DM percent = 0.2487. Different lower-case letters indicate a significant difference at p = < 0.05 by the least significant difference.
Horticulturae 07 00112 g002aHorticulturae 07 00112 g002b
Figure 3. (A) Fresh mass (FM), (B) total dry mass (total DM), and (C) dry mass percent (DM %) for basil plants grown without temperature stress (control; 30/22 °C), with low-temperature (20/12 °C) stress, and with high-temperature (38/30 °C) stress at 420 and 720 μL L−1 of CO2 concentration after 38 days of treatment. The standard error mean was FM = 34.65, total DM = 5.5682, and DM percent = 0.4008. Different lower-case letters indicate a significant difference at p = < 0.05 by the least significant difference.
Horticulturae 07 00112 g003aHorticulturae 07 00112 g003b
Figure 4. Average epicuticular wax content for basil plants grown without temperature stress (control; 30/22 °C), with low-temperature (20/12 °C) stress, and with high-temperature (38/30 °C) stress at 420 and 720 μL L−1 of CO2 concentration after 34 days of treatment. The standard error mean for wax was 0.9463. Different lower-case letters indicate a significant difference at p = < 0.05 by the least significant difference.
Horticulturae 07 00112 g004
Figure 5. (A) Epidermal anthocyanin index, (B) epidermal flavonoid index, (C) total chlorophyll index, and (D) nitrogen balance index of basil leaf tissue subjected to no temperature stress (control; 30/22 °C), with low-temperature (20/12 °C) stress, and with high-temperature (38/30 °C) stress at 420 and 720 μL L−1 of CO2 concentration. The standard error mean was anthocyanin = 0.003594, flavonoids = 0.02642, TCI = 0.88, and NBI = 1.4829. Different lower-case letters indicate significant difference at p = < 0.05 by least significant difference.
Horticulturae 07 00112 g005aHorticulturae 07 00112 g005bHorticulturae 07 00112 g005c
Table 1. Temperature-stress treatments based on the percentage of daily evapotranspiration (ET) imposed at 14 days after sowing, mean and standard error day/night temperature, mean and standard error day chamber CO2 concentration, mean and standard error day/night vapor pressure deficit (VPD), and mean and standard error day/night evapotranspiration (ET) during the experimental period of 38 days for each treatment.
TreatmentsMeasured
Temperature (°C)
CO2 (μL L−1)VPD (kPa)Mean ET
(L H2O d1)
Day/nightDayDay/nightDay/night
Control30/22 °C, 420 μL L−126.27 ± 0.02430.47 ± 0.981.82 ± 0.0114.64 ± 1.41
Control + High CO230/22 °C, 720 μL L−126.34 ± 0.01731.21 ± 1.521.98 ± 0.0112.60 ± 1.27
High Temperature38/30 °C, 420 μL L−132.16 ± 0.49434.19 ± 1.212.80 ± 0.078.74 ± 0.64
Low Temperature20/12 °C, 420 μL L−119.53 ± 0.56431.08 ± 0.660.89 ± 0.088.59 ± 0.47
High Temperature + High CO238/30 °C, 720 μL L−132.09 ± 0.49728.79 ± 0.832.87 ± 0.0718.41 ± 1.86
Low Temperature + High CO220/12 °C, 720 μL L−119.56 ± 0.57724.78 ± 0.350.95 ± 0.096.39 ± 0.37
Table 2. The mean plant height (PH), node number (NN), branch number (BN), leaf area (LA), leaf dry mass (LDM), shoot dry mass (SH DM), stem dry mass (ST DM), root dry mass (RDM), and root-to-shoot ratio (RS-Ratio) of basil plants grown without temperature stress (Control), with low-temperature stress, and with high-temperature stress at 420 and 720 μL L−1 of CO2 concentration after 17 days of treatment.
TreatmentPH aNNBNLALDWSH DWST DWRDWRS Ratio b
420 μL L−1
Control36.5 a7.1 b15.3 c1223.6 a,b4.479 b6.667 b2.188 c0.941 a0.140 b
High Temperature36.8 a8.5 a24.0 b1044.9 b4.366 b6.893 b2.528 b,c0.891 a0.128 b
Low Temperature16.5 c4.6 d6.4 e403.8 c1.909 d2.263 d0.354 d0.411 b0.198 a
720 μL L−1
Control36.6 a7.0 b15.3 c1321.1 a5.779 a8.568 a2.789 a,b1.021 a0.119 b
High Temperature38.2 a8.9 a26.7 a1139.41 a,b5.227 a,b8.340 a3.113 a0.966 a0.121 b
Low Temperature19.6 b5.0 c9.0 d413.0 c2.948 c3.544 c0.596 d0.532 b0.155 b
Treatment c,d**************************
CO2*****NS*********NS*
Trt * CO2NSNSNSNSNSNSNSNSNS
a Plant-height units in centimeters (cm); node number and branch number on a per-plant basis; leaf area units in centimeters squared; remaining parameter units are on a gram-per-plant basis. b RS ratio, root-to-shoot ratio (root dry mass/shoot dry mass). c SE, standard error of the mean; PH = 1.2848; NN = 0.1487; BN = 1.0653; LA = 586.3; LDW = 2.2082; SH DW = 4.8444; ST DW = 2.7489; RDW = 0.8512; RS ratio = 0.00981; RDW = 0.06842; RS ratio = 0.01446. d NS represents non-significant p > 0.05. *, **, *** represent significance levels at p ≤ 0.05, p ≤ 0.01, and p ≤ 0.001, respectively.
Table 3. The mean plant height (PH), node number (NN), branch number (BN), leaf area (LA), leaf dry mass (LDM), shoot dry mass (SH DM), stem dry mass (ST DM), root dry mass (RDM), and root-to-shoot ratio (RS-Ratio) of basil plants grown without temperature stress (Control), with low-temperature stress, and with high-temperature stress at 420 and 720 μL L−1 of CO2 concentration after 38 days of treatment.
TreatmentPH aNNBNLALDWSH DWST DWRDWRS Ratio b
420 μL L−1
Control61.7 a10.0 b29.9 a6946.3 a25.03 a,b58.081 a,b33.049 a,b6.841 a0.116 c
High Temperature51.4 b11.6 a24.5 b4616.3 b,c18.63 c43.274 c24.645 c7.387 a0.164 a
Low Temperature47.9 c,d7.2 d15.7 c4149.3 b,c16.62 c25.206 d8.589 d3.049 b0.123 b,c
720 μL L−1
Control60.9 a10.1 b29.7 a8078.9 a28.39 a67.126 a38.733 a8.511 a0.128 b,c
High Temperature50.9 b,c11.4 a24.7 b5215.7 b20.65 b,c52.123 b,c31.469 b,c7.518 a0.142 a,b
Low Temperature47.3 d7.7 c17.1 c3582.0 c18.95 c29.113 d10.167 d4.599 b0.157 a
Treatment c,d**************************
CO2NSNSNSNSNSNS*NSNS
Trt * CO2NSNSNSNSNSNSNSNS*
a Plant height units in centimeters (cm); node number and branch number on a per-plant basis; leaf area units in centimeters squared; remaining parameter units are on a gram-per-plant basis. b RS ratio, root-to-shoot ratio (root dry mass/shoot dry mass). c SE, standard error of the mean; PH = 1.2848; NN = 0.1487; BN = 1.0653; LA = 586.3; LDW = 2.2082; SH DW = 4.8444; ST DW = 2.7489; RDW = 0.8512; RS ratio = 0.00981. d NS represents non-significant p > 0.05. *, **, *** represent significance levels at p ≤ 0.05, p ≤ 0.01, and p ≤ 0.001, respectively.
Table 4. The mean longest root length (RL), total root length (TRL), root surface area (RSA), root average diameter (RAD), root volume (RV), root tips (RNT), root forks (RNF), and root crossings (RNC) of basil plants grown without temperature stress (control), with low-temperature stress, and with high-temperature stress at 420 and 720 μL L−1 of CO2 concentration after 17 days of treatment.
TreatmentRL aTRLRSARADRVRNTRNFRNC
420 μL L−1
Control45.1 a4572.9 a854.3 a0.598 a14.00 a10052 a38545 a,b2412.6 b
High Temperature40.6 b,c3792.2 b,c623.4 b,c0.524 c9.68 b12271 a33856 b2475.1 b
Low Temperature36.9 c2701.2 d497.3 d0.584 a,b7.35 b5448 b17831 c1115.2 c
720 μL L−1
Control46.7 a4159.1 a,b738.6 a,b0.561 a,b,c15.45 a12477 a46580 a3287.8 a
High Temperature43.0 a,b4194.4 a,b715.4 b,c0.541 b,c9.78 b10898 a31358 b2428.6 b
Low Temperature39.9 b,c3354.1 c602.1 c,d0.576 a,b8.65 b9624 a22960 c1480.0 c
Treatment b,c*********************
CO2NSNSNSNSNSNSNS*
Trt*CO2NS**NSNSNSNSNS
a RL, TRL, RAD on a centimeter-per-plant basis; RSA, RV on a cubic-centimeter basis; RNT, RNF, and RNC on a number-per-plant basis. b SE, standard error of the mean; RL = 1.4215; TRL = 212.96; RSA = 43.7643; RAD = 0.01825; RV = 1.0304; RNT = 1260.17; RNF = 2952.16; RNC = 218.76. c NS represents non-significant p > 0.05. *, **, *** represent significance levels at p ≤ 0.05, p ≤ 0.01, and p ≤ 0.001, respectively; within columns, values followed by the same letter are not significantly different.
Publisher’s Note: MDPI stays neutral with regard to jurisdictional claims in published maps and institutional affiliations.

