Article

Heat Stress at Early Reproductive Stage Differentially Alters Several Physiological and Biochemical Traits of Three Tomato Cultivars

by
Md. Sabibul Haque
1,
Mst. Tanziatul Husna
1,
Md. Nesar Uddin
1,
Md. Alamgir Hossain
1,
Abul Khayer Mohammad Golam Sarwar
1,
Omar M. Ali
2,*,
Arafat Abdel Hamed Abdel Latef
3 and
Akbar Hossain
4,*
1
Department of Crop Botany, Bangladesh Agricultural University, Mymensingh 2202, Bangladesh
2
Department of Chemistry, Turabah University College, Turabah Branch, Taif University, P.O. Box 11099, Taif 21944, Saudi Arabia
3
Botany and Microbiology Department, Faculty of Science, South Valley University, Qena 83523, Egypt
4
Department of Agronomy, Bangladesh Wheat and Maize Research Institute, Dinajpur 5200, Bangladesh
*
Authors to whom correspondence should be addressed.
Horticulturae 2021, 7(10), 330; https://doi.org/10.3390/horticulturae7100330
Submission received: 2 August 2021 / Revised: 11 September 2021 / Accepted: 16 September 2021 / Published: 22 September 2021

Abstract

:
Global warming is predicted to be increased in the upcoming years, resulting in frequent heatwaves or hot days worldwide, which can seriously affect crop growth and productivity. The responses of heat stress to several photophysiological and biochemical traits in three tomato cultivars were investigated in a pot experiment, and the heat tolerance capability of these cultivars was evaluated based on the investigated traits. The experiment was followed by a factorial completely randomized design, and the factors were (i) tomato cultivars (BARI Hybrid Tomato-5, BARI Tomato-14, and BARI Tomato-15) and (ii) heat stress (control and heat). The plants of three tomato cultivars were exposed to short-term heat stress (four days at 38/25 °C day/night temperature) at the flowering stage. The measured traits such as dry mass, leaf greenness (SPAD), maximum photochemical efficiency of photosystem II (Fv/Fm), photosynthetic rate (A), stomatal conductance (gs), transpiration rate (E), leaf chlorophyll, and carotenoid content were significantly declined, while the catalase and ascorbate peroxidase activities were increased by heat stress in all three tomato cultivars except BARI Tomato-15, which showed unaltered gs, E, and carotenoids. The percent reduction (over control) in SPAD, Fv/Fm, A, total chlorophyll, and total carotenoids was significantly lower (11, 06, 25, 34, and 19%, respectively), whereas the percent increase in catalase and ascorbate peroxidase activities was substantially higher (70 and 72%, respectively) in BARI Tomato-15 than in other cultivars. Based on the measured physiological and biochemical traits, the cultivar BARI Tomato-15 showed better heat tolerance than the other cultivars.

1. Introduction

During the 20th century, an increase of 0.74 °C in global surface temperature was reported, while climate models predicted a further rise of 1.1 to 6.4 °C global mean temperature during the next century [1]. Heatwaves due to global climate change have made crop production more vulnerable, and the world is under crisis for agricultural production and food security [2]. Climate simulation studies have shown that in contrast to twice a century, hot summers are predicted to occur twice a decade in the future during the 2000s [3].
Tomato (Solanum lycopersicum L.) is an important and popular vegetable globally, including in Bangladesh. Tomato is a heat-sensitive crop and is usually grown in the winter season in Bangladesh for its optimum growth and yield. The optimal temperature for the growth and development of tomatoes is 25–30 °C in the daytime and 20 °C at night [4]. Heat stress differentially alters the morphological, physiological, and biochemical attributes at whole-plant cellular and molecular levels affecting tomato growth and yield [5,6,7,8]. Vegetative growth, flowering, pollen viability, fruit development, and fruit set of tomato are restricted at air temperature higher than 35 °C [8]. The maximal photochemical efficiency of photosystem (PS) II (Fv/Fm) and photosynthesis are considered the most heat-sensitive physiological processes in plants, including tomatoes [4,9,10]. Heat stress is reported to decrease in Fv/Fm, electron transport rate, net photosynthesis, stomatal conductance, transpiration rate, pollen viability, and leaf chlorophyll content in tomato [9,10,11]. Decreased chlorophyll concentration as a result of heat stress may be one of the primary causes for the loss in photosynthesis, as the enzyme chlorophyllase is required for the conversion of chlorophyll to phytol and chlorophyllide [12,13]. Increased temperature in tomato leaves decreases photosynthetic machinery, changes membrane fluidity, and disrupts the general stability of metabolic mechanisms, thereby causing overproduction of reactive oxygen species (ROS) and oxidative stress resulting in cell death [4,14]. Plants encounter the adverse effects of ROS by either enzymatic or nonenzymatic antioxidative defense [15]. Heat stress causes the accretion of antioxidative enzymes such as peroxidase (POD), superoxide dismutase (SOD), and ascorbate peroxidase (APX), resulting in an increased level of ROS in tomatoes [16,17]. Heat resistance or thermotolerance is the capability of the crop to cope with the heat stress and create economic production with greater yield [18]. The rising temperature due to global warming will affect tomato production in the coming years. Therefore, we need to develop suitable technologies by which plants can adapt to the changing climate. Screening of cultivated and wild tomato genetic resources has been extensively employed to find heat-tolerant genotypes and to advance the development of heat-tolerant cultivars through conventional breeding [19]. Chlorophyll fluorescence is a simple and successful approach that has been used in a number of studies to screen for and identify heat-tolerant genotypes [9,20,21,22]. Exogenous treatment of several biomolecules, such as salicylic acid, melatonin, and abscisic acid, can boost a plant’s heat tolerance. These biomolecules enhance the growth and physiology of crops and prevent oxidative damage [7,10,11,16,23].
In Bangladesh, winter lasts from December to January, and tomato is often grown during this season. However, many commercial producers modify planting times so that fruit picking can occur a month earlier or later than usual to obtain a higher economic return. Such timing adjustments with winter tomato cultivars are not always successful due to the sudden heat spell (35–40 °C) at later developmental stages that hampers crop growth and results in a significant loss in fruit production. On the other hand, farmers might choose heat-tolerant winter cultivars able to withstand this unexpected heatwave and produce a decent harvest. There is a scarcity of suitable or recommended heat-tolerant tomato cultivars in Bangladesh to combat these adverse climate conditions. This study aimed to assess the influence of short-term heat stress on some physiological characteristics and antioxidative enzyme activities in three tomato cultivars at the flowering stage. The differences in the photophysiological and biochemical parameters among the said three common winter tomato cultivars tested in response to the sudden heatwave and presented in this paper.

2. Materials and Methods

2.1. Plant Materials and Stress Treatments

The experiment was set at the field laboratory of the Department of Crop Botany, Bangladesh Agricultural University, and climate chamber in Bangladesh Institute of Nuclear Agriculture (BINA), Mymensingh, Bangladesh, from November 2018 to April 2019. Seeds of three tomato cultivars such as BARI Hybrid Tomato-5, BARI Tomato-14, and BARI Tomato-15 were collected from Bangladesh Agriculture Research Institute (BARI), Gazipur, Bangladesh. The seeds of all tomato cultivars were sown in November 2018 in plastic pots under field conditions. The size of each plastic pot was 25 cm × 25 cm (D × H), containing 8 kg of soil collected from the bank of the Old Brahmaputra River. A single seed per pot was sown, and all pots were kept in the field laboratory with proper management until the imposition of heat treatment. The chemical fertilizers such as urea, triple superphosphate (TSP), muriate of potash (MoP), and gypsum were applied to the potting soil at the rate of 2 g, 1.0 g, 0.4 g, and 0.6 g per pot, respectively (converted from the recommended doses) [24]. One-third of urea and all TSP, MoP, and gypsum fertilizers were applied 20 days after seedling plantation. The remaining part of urea fertilizer was applied at 40 and 60 DAS in two equal splits. The experiment was set in a two factorial (tomato cultivars and stress) completely randomized design (CRD), having three replications. Each pot containing a single plant was used as a single replicate. The plants of all cultivars were exposed to short-term heat during the flowering stage (60 days after sowing). Three plants of each cultivar from the field laboratory were shifted to the climate chamber (Model DK-COC010, Daiki Scientific Company, Seoul, Korea) for heat stress treatment. The temperature inside the climate chamber was maintained by 38/25 °C day/night, and the plants were subjected to heat treatment for four days. The photoperiod inside the climate chamber was 12 h, and the photosynthetic photon flux density (PPFD) was approximately 200 µmol m−2s−1. The relative humidity (RH) inside the chamber was maintained approximately to 70/50% day/night. To avoid water-limiting conditions, the plants were well-irrigated during the heat stress treatment. The plants were exposed to heat stress for four days inside the climate chamber. The control plants remained in the ambient field condition, and data recording was performed simultaneously with stressed plants. The average day and night temperature in the field was approximately 25/16 °C. The date of plant sowing and main growth stages are presented in Table 1.

2.2. Physiological Measurements

At 0, 1, 2, 3, and 4 days of high-temperature stress treatment, the leaf greenness (recorded as SPAD values) of the plants grown both in control and high-temperature conditions was measured. A chlorophyll meter (SPAD-502 plus, Konica Minolta, Osaka, Japan) was used to measure the leaf greenness. The SPAD data were recorded from three different plants in each treatment. The maximal photochemical efficiency of photosystem (PS) II (Fv/Fm) was measured in the leaf of three plants of each cultivar of different treatments at Days 0, 1, 2, 3, and 4 of the heat stress period. The Fv/Fm measurements were performed by a fluorometer (Pocket PEA, Hansatech, Norfolk, UK). The dark adaptation of the leaves was performed for 30 min using the shutter system leaf clips. After that, the Fv/Fm was quantified with the Pocket PEA under a saturated PPFD of 3500 µmol m−2s−1 [20]. The gas exchange parameters were measured by a portable photosynthetic system (LCi-SD photosynthetic system, ADC Bio Scientific Ltd., Hertfordshire, UK). The rate of photosynthesis (A), stomatal conductance (gs) and transpiration rate (E) were recorded at a PPFD of 200 µmol m−2s−1 in the well-developed leaves of the stressed plants (38 °C) at Day 4 and the same day in control (25 °C) plants. The ambient (400 ppm) levels of CO2 were maintained during the gas exchange measurements at all growth conditions. The dry weight of the plants on the 4th day of stress treatment along with control plants was collected using an oven with 80 ± 2 °C for three days.

2.3. Pigment Analysis

The leaf samples of plants grown in control and stressed conditions were collected for pigment and antioxidative enzyme analysis at Day 4 of heat stress treatments and stored until analysis. The biochemical analysis was performed in the Plant Physiology Laboratory of the Department of Crop Botany, Bangladesh Agricultural University. For chlorophyll and carotenoid determination, 50 mg of fresh leaf samples were plunged in 10 mL of 80% acetone and kept for seven days in dark conditions for proper extraction. Chlorophyll a (Chl a), chlorophyll b (Chl b), total chlorophyll (Chl a + Chl b), and total carotenoid (carotene and xanthophyll) content were calculated from the absorbance readings at 470, 648.6, and 664.2 nm by a UV–vis spectrophotometer (DR6000, Hach, Dusseldorf, Germany) following the method of Lichtenthaler [25].

2.4. Catalase and Ascorbate Peroxidase Activity Determination

The extraction procedure for catalase (CAT, EC1.11.1.6) and ascorbate peroxidase (APX, EC 1.11.1.11) enzyme activities was followed by Elavarthi and Martin [26] with minor modification. For the extraction of enzyme activities, 0.5 g of fresh leaf sample was used. The leaf samples were ground using a mortar and pestle with 3 mL of KH2PO4 buffer (pH 8.0). The extracts were then carried into an Eppendorf tube (1.5 mL) and centrifuged at 12,000 rpm for 10 min in a centrifuge. The samples were kept in an icebox during the spectrophotometric analysis. For CAT determination, a 3 mL assay reaction mixture was made in a cuvette containing 2.1 mL of 50 mM KH2PO4 buffer (pH 8.0), 0.3 mL of 2.5 mM EDTA, 0.3 mL of 200 mM H2O2, and 0.3 mL of the sample extract. The cuvette was then immediately placed in a UV–vis spectrophotometer (DR6000, Hach, Dusseldorf, Germany). The enzyme activity was assayed by measuring the rate of decrease in absorbance per unit of time (90 min) at a 240 nm wavelength. For APX, 3 mL of assay reaction mixture was made in a cuvette containing 1.8 mL of 50 mM KH2PO4 buffer (pH 8.0), 0.3 mL of 2.5 mM EDTA, 0.3 mL of 200 mM H2O2, 0.3 mL of 2.5 mM ascorbate, and 0.3 mL of sample. The APX activity was measured as the decrease in absorbance per unit of time at 290 nm. The extinction coefficient of H2O2 (40 mM−1 cm−1 at 240 nm) was used for the calculation of CAT activity [27], while the extinction coefficient of 2.8 mM−1 cm−1 at 290 nm for reduced ascorbate was used to calculate APX activity [28].

2.5. Statistical Data Analysis

The open-source statistical software program R [29] was used to evaluate the variation of measured traits between the treatments and among the cultivars. Recorded data were analyzed using analysis of variance (ANOVA) with a significance level of p ˂ 0.05. The percent changes over control values in different parameters were calculated as (Control values–Stress values)/Control values * 100. The multiple comparisons of mean values of different parameters in all cultivars were performed by the Tukey program R software. Stress tolerance index (STI) values were calculated as Stress/Control * 100, and these values were used to formulate the heatmap. The hierarchical clustering heatmap, correlation matrix scatter plot, and principal component analysis (PCA) biplot were constructed using the Heatmap, ggpairs, and fviz_pca functions of the R statistical software, respectively.

3. Results

Heat stress had a substantial effect on photophysiological processes and biochemical parameters such as pigment concentrations and antioxidative enzyme activity in three tomato cultivars, and ANOVA analysis revealed the sources of variance (Table 2). Under heat stress, morphological and physiological characteristics were significantly decreased, although antioxidative enzymes such as ascorbate peroxidase (APX) and catalase (CAT) activity were significantly elevated.

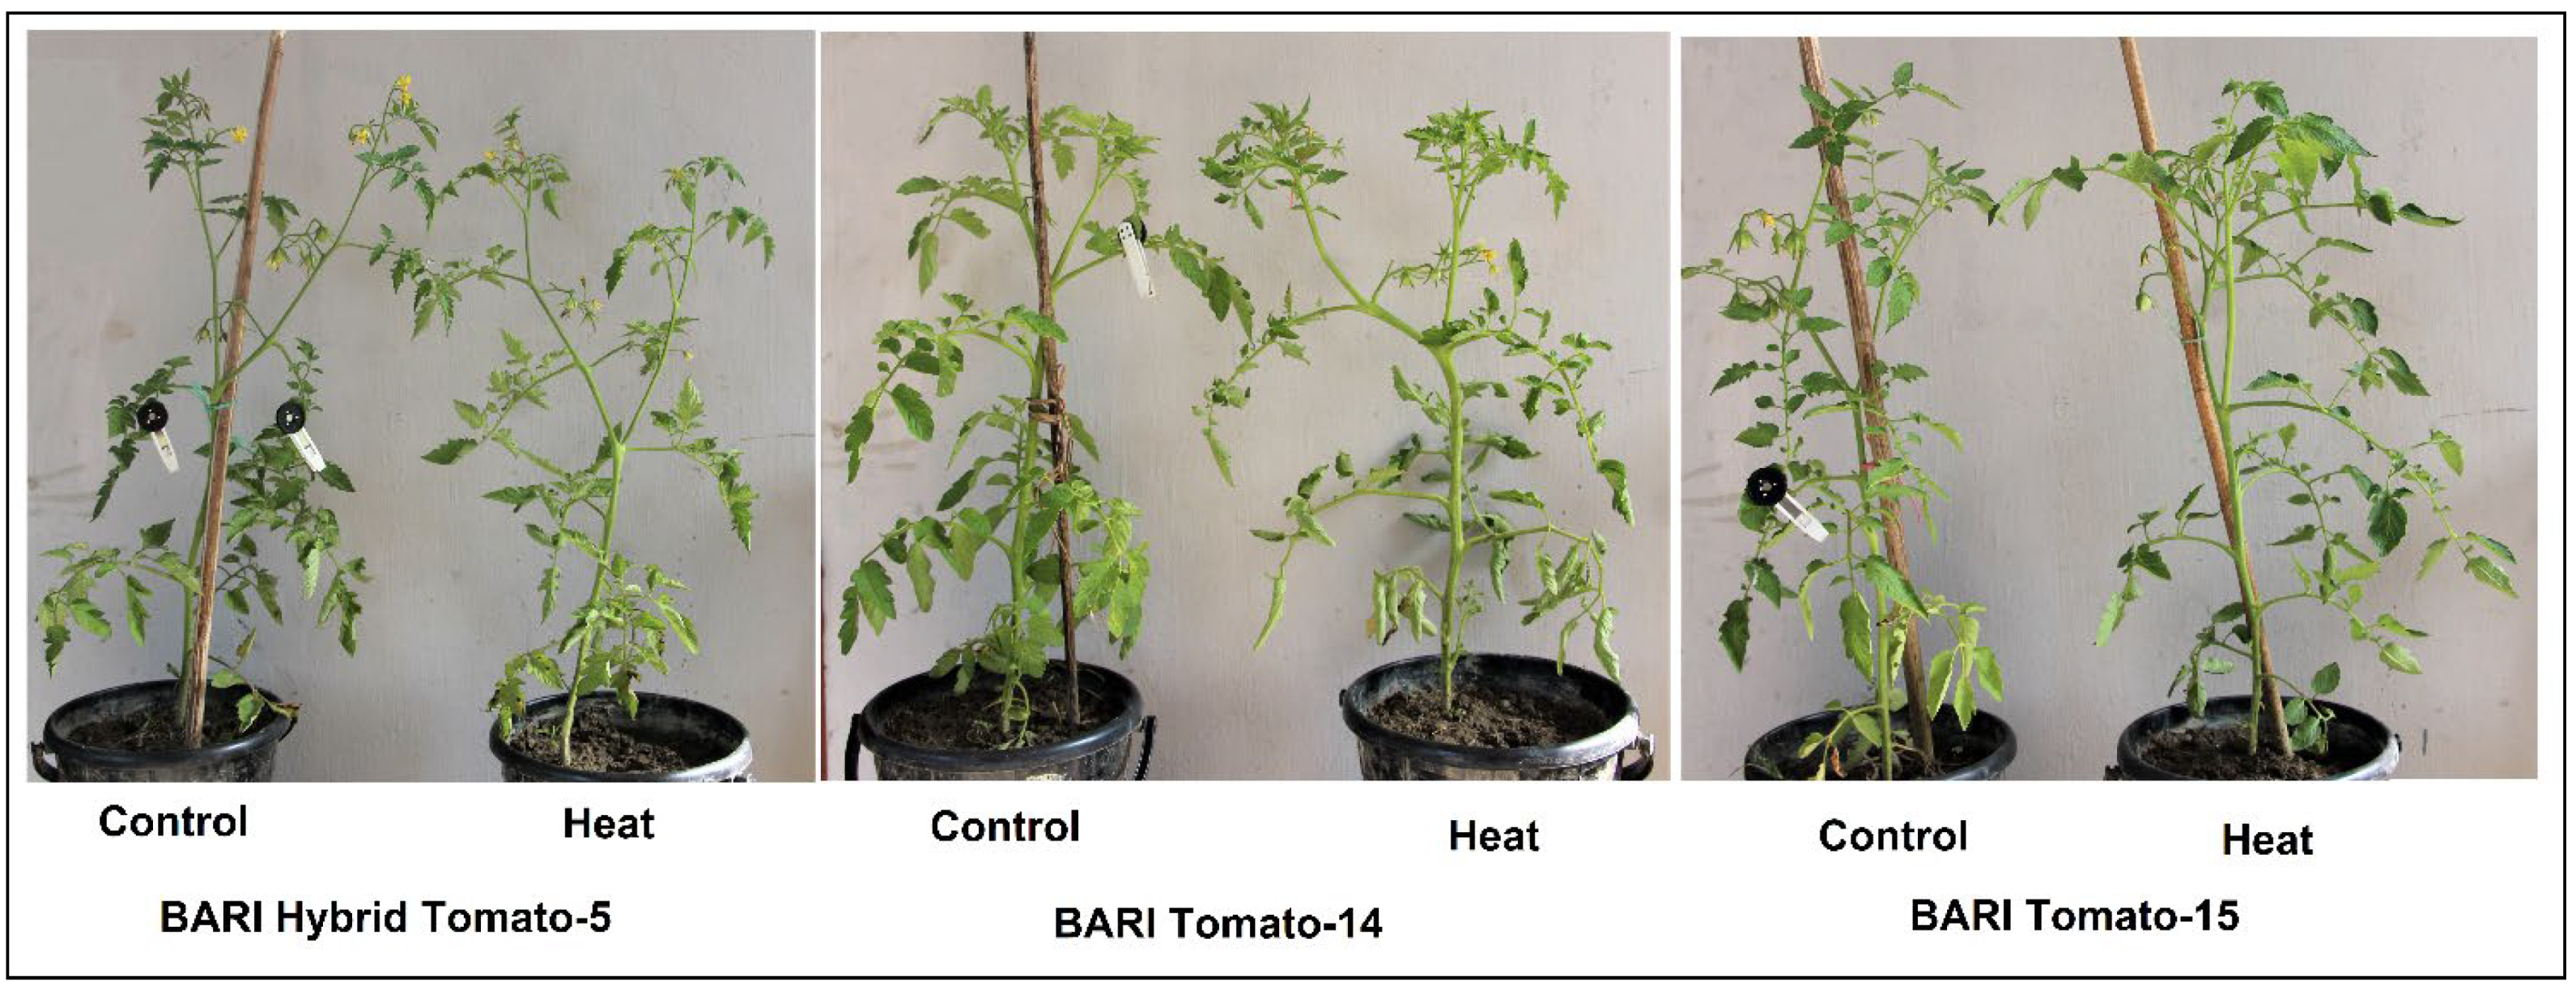
3.1. Plant Growth and Appearance

The visual observation of three cultivars following short-term heat stress during the early blooming stage demonstrates that BARI Tomato-15 is more tolerant than the other cultivars. Both BARI Hybrid Tomato-5 and BARI Tomato-14 had their bottom leaves curled due to short-term heat stress. By comparison, it appears BARI Tomato-15 did not demonstrate any leaf curling in response to heat stress (Figure 1).
The three cultivars’ average dry mass (DM) varied significantly between control (16.5 g plant−1) and heat stress (12.1 g plant−1), ranging between 15.3 and 17.3 and 9.5 and 13.7 g plant−1, respectively (Figure 2). Each cultivar’s DM reduced significantly in response to heat stress (Figure 3a), with 36.7, 28.7, and 16.9% relative dry mass decreases in BARI Hybrid Tomato-5, BARI Tomato-14, and BARI Tomato-15, respectively (Figure 3b).

3.2. Leaf Greenness and Quantum Efficiency of Photosystem (PS) II

Heat stress significantly reduced leaf greenness (SPAD) in three tomato cultivars, and significant heterogeneity in leaf greenness was also detected between cultivars (Table 2). After four days of heat treatment, SPAD values varied considerably between control (41.9) and heat stress (35.5) in all cultivars (Figure 2). In all three tomato cultivars, the leaf greenness reduced as the duration of heat stress increased (Figure 4a). SPAD values in all three cultivars ranged from 41 to 43 under control (Day 0) and from 33 to 38 under heat conditions (Day 4). SPAD values were reduced by 19, 18.6, and 10.7% in BARI Hybrid Tomato-5, BARI Tomato-14, and BARI Tomato-15, respectively (Figure 3b).
In all tomato cultivars, heat stress significantly affected the maximal photochemical efficiency of PSII (Fv/Fm) (Table 1). In all cultivars, control plants retained considerably higher average Fv/Fm values (0.82) than heat-treated plants (0.75) (Figure 2). Similarly, as the length of heat exposure progressed, the SPAD trend, the Fv/Fm ratio decreased (Figure 4b). On the fourth day of heat stress, the Fv/Fm values in BARI Hybrid Tomato-5, BARI Tomato-14, and BARI Tomato-15 were 0.74, 0.73, and 0.77, respectively (Figure 4b). BARI Tomato-15 appeared to have the smallest amount of relative drop in Fv/Fm (6.5%), followed by BARI Hybrid Tomato-5 (10.1%) and BARI Tomato-14 (10.6%) (Figure 3b).

3.3. Gas Exchange Parameters

The rate of photosynthesis (A), stomatal conductance (gs), and transpiration rate (E) were significantly influenced by heat stress in comparison to control in all three tomato cultivars (Table 1). The mean values of A under control and stress conditions were 5.5 and 3.6 µmol CO2 m−2 s−1, respectively, and this difference was statistically significant (Figure 2). The A was maximum in BARI Tomato-15 (4.12 µmol CO2 m2 s1), followed by BARI Tomato-14 (3.43) and BARI Hybrid Tomato-5 (2.83) under heat stress conditions (Figure 5a). The gs and E ranged from 0.27 to 0.55 mol m−2 s−1 and from 1.8 to 4.4 mol m−2 s−1, respectively, under heat treatment (Figure 5b,c). Relative decline under stress compared to control revealed that BARI Tomato-15 showed the lowest magnitude of reduction (25.4%) in A compared to BARI Tomato-14 (42.4%) and BARI Hybrid Tomato-5 (44.6%) (Figure 3b). The percent reduction in gs and E over control ranged from 7 to 48% and 10 to 59%, respectively, depending on the cultivars (Figure 3b).

3.4. Leaf Pigments

Heat stress decreased the leaf pigment concentration considerably in all tomato cultivars (Table 2). The average leaf chlorophyll a, chlorophyll b, total chlorophyll, and total carotenoids concentrations were considerably greater in control plants (3.82, 1.20, 5.02, and 0.72 µg mg1 fresh weight, respectively) in comparison to the leaves of stress plants (2.21, 0.64, 2.85, and 0.49 µg mg1 fresh weight, respectively) (Figure 2). Significant varietal difference was seen for chlorophyll a, chlorophyll b, total chlorophyll, and total carotenoids. The varietal range in chlorophyll a, chlorophyll b, total chlorophyll, and total carotenoids was 3.26–4.77, 0.95–1.45, 4.21–6.21, and 0.60–0.81 µg mg1 fresh weight, respectively, under normal conditions and 1.49–3.27, 0.52–0.82, 2.04–4.09, and 0.30–0.74 µg mg1 fresh weight, respectively, under stress conditions (Figure 6a–d). Under heat stress, total carotenoid content in BARI Tomato-15 was not significantly influenced compared to the control (Figure 6d). The percent reduction in pigment content over control varied from 19 to 58%, and in all cases, the percent reduction was significantly lower in BARI Tomato-15 except Chl b compared to other tomato cultivars (Figure 3b).

3.5. Antioxidative Enzymes Activity

In comparison to controls, all three tomato cultivars exhibited considerably greater activity of APX and CAT enzymes when heat stress was applied. A considerable degree of diversity in the antioxidant defense was observed across the tomato cultivars under higher temperature conditions (Table 2). The average APX and CAT activities of all cultivars were 0.22 and 7.62 µmol min1 g1 fresh weight, respectively, under control plants, and these activities were significantly increased (0.36 and 12.49, respectively) due to the exposure of higher temperature (Figure 2). The maximum APX and CAT activity was observed in BARI Tomato-15 (0.42 and 16.03, respectively), whereas these enzymes’ activities were found minimum in BARI Tomato-14 (0.30 and 9.63, respectively) under heat stress treatment (Figure 7a,b). The increased activities of both enzymes ranged from 48 to 72% due to heat exposure, and BARI Tomato-15 exhibited the greatest increase in APX and CAT enzymes (72 and 70%, respectively) compared to BARI Hybrid Tomato-5 (59 and 49%) and BARI Tomato-14 (48 and 54%) under heat stress (Figure 3b).

3.6. Correlation Matrices and PCA Analyses

Correlation matrices among Chl a, Chl b, Total Chl, Carot., DW, A, gs, E, SPAD, Fv/Fm, CAT, and APX at each of control and stress treatment are shown in Figure 8a,b.
Insignificant correlations in most traits under control treatment explain the lesser variability among the cultivars. However, there was a major shift toward positive correlations among most photophysiological and chemical parameters and DM of plants when they were subjected to heat stress. DM under stress maintained a significant positive correlation with each of A, E, Total Chl, and carotenoids. Additionally, antioxidative enzymes APX and CAT maintained strong positive correlations with each of A, SPAD, and Fv/Fm ratios, but only under heat stress. Fv/Fm and SPAD, besides maintaining significantly positive correlations with CAT and APX, also maintained significant positive correlations with each of Total Chl & Chl a, A, E, and gs under stress conditions. Seemingly, gas exchange parameters viz. A, E, and gs also maintained positive correlations with most parameters studied under heat stress conditions.
Principal component analysis (PCA), a type of multivariate analysis, was used to determine whether the studied traits under control and stress conditions in three tomato cultivars can be more simply explained by creating a pair of new variables (PC1 and PC2) that combine the original variables/traits to a different extent. PCA was used to extract information in this investigation (Figure 9), and a biplot demonstrates that PC1 alone explained 73.3% of the overall variability, while PC2 provided another 17%.
Thus, the PC1 and PC2 scores explained 90.2% of the total variability, while all analyzed characteristics except CAT and APX contributed nearly equally to PC1, CAT, and APX contributed much more to PC2 (Figure 9c). PC1 clearly distinguished observations into a control group with typically higher scores and a stress group with significantly lower scores (Figure 9a). On the other hand, utilizing the PC2 score from the score plot, cultivars can be distinguished (Figure 9b). PC2 scores for BARI Tomato-15 were higher than those for BARI Hybrid Tomato-5. In comparison, cultivar BARI Tomato-14 had the lowest PC2 score (Figure 9b. The loading charts appear to portray two distinct trait groupings (Figure 9c). Within one group, the traits CAT and APX are positioned maintaining a sharply acute angle and almost identical projection lengths, indicating their strong positive correlations and nearly equal contributions. All other traits, except for CAT and APX, formed a separate group with various degrees of acute angles and projection lengths, indicating their positive associations but differential contributions.

3.7. Stress Tolerance Index (STI)

The hierarchical clustering heatmap depicts the stress tolerance indices (STIs) for several measured parameters of all three tomato cultivars (Figure 10). The cultivars were classified into two groups as shown in rows (BARI Tomato-15 in Group-1 and the other two cultivars in Group-2). On the other hand, the traits were classified into four clusters (column). Cluster-1 comprised CAT and APX, and this cluster was significantly upregulated under stressed conditions. In comparison to the other two cultivars, BARI Tomato-15 consistently maintained a higher level of APX and CAT activity under heat stress.
On the other side, Cluster-2 was shared by all pigments, photosynthetic rate, and transpiration rate. Stress had a detrimental effect on the attributes in this second cluster, and once again, BARI Tomato-15 outperformed the other two cultivars. SPAD and Fv/Fm ratio are grouped in Cluster-3, and this trait group was the least altered by heat stress. Two parameters, DM and gs, were grouped in the fourth cluster, and this cluster group also distinguished the cultivar BARI Tomato-15 as the cultivar that was less influenced by stress treatment than the other two. The STI values for morphophysiological traits and pigments were between 42 and 94%, whereas the STI values for antioxidant traits ranged between 149 and 172%. Considering the STI values for all tested attributes, the cultivar BARI Tomato-15 was clearly more heat resistant than the other two cultivars, scoring higher STI values for almost all parameters (Figure 10).

4. Discussion

Crop experts have long regarded heat stress as the single most important factor impacting the yield potential of crop species [30]. The current study assessed the performance of three tomato cultivars when subjected to short heat stress. The results indicated that heat stress had a substantial and differential effect on all of the assessed parameters, including leaf greenness (SPAD), maximal photochemical efficiency of PSII, photosynthesis, chlorophyll, and antioxidant activities, among the three cultivars studied. These results are in agreement with many previous studies [5,6,7,8,9,10,16]. Declined level of leaf greenness is associated with a reduction in chlorophyll content. When exposed to a high temperature, chlorophyll synthesis is impaired, or there is increased degradation of chlorophyll molecules [31]. There are a set of enzymes involved in chlorophyll synthesis that undergo deactivation due to heat stress [12,31], and the accelerated degradation of chlorophyll is more pronounced in the developed leaf [32]. The ratio of variable fluorescence to maximum fluorescence (Fv/Fm) can be used to determine the maximal photochemical efficiency of photosystem II (PSII), and this metric can be utilized as an early stress marker in crops [33]. The Fv/Fm varied significantly in the three tomato cultivars under heat stress, and BARI Tomato-15 appeared the best and affected relatively to a lesser extent in comparison to other cultivars (Figure 3b and Figure 4). This cultivar may have genetically higher PSII efficiency, and under stress, it maintains the same along with better thermal stability of the thylakoid membrane compared to other cultivars. The thermotolerance capacity of leaf PSII is affected under higher temperatures [11,34], and increased leaf temperature may eventually terminate PSII function [4]. Reduction in chlorophyll content and Fv/Fm due to heat stress in tomato and other crops were reported, and these parameters were used as screening tools in many other studies [9,21,22,35]. Apart from their strong positive correlations with CAT and APX, Fv/Fm and SPAD also showed significant positive correlations with Total Chl, Chl a, A, E, and gs under stress conditions (Figure 8). Additionally, the heatmap generated using the STI values (Figure 10) clearly shows that Fv/Fm and SPAD are clustered together and that BARI Tomato-15 maintained higher STI values in these two traits compared to the other two cultivars, which may ultimately favor this cultivar in accumulating relatively more DM under heat stress.
Heat stress had a considerable impact on gas exchange parameters, and cultivars responded differently (Figure 3b and Figure 5). Under heat stress, photosynthesis is one of the most critical biochemical features that is negatively impacted [11,36]. Heat stress triggers a reduction in leaf expansion and also impairment in the normal functioning of photosynthetic apparatus and eventually promotes leaf senescence [37]. Under heat stress, stomatal closure may diminish CO2 availability, making the plant more sensitive to UV damage [38]. Heat stress particularly targets damage to the reaction center of PSII [39], and it is assumed that a reduced level of photosynthesis under heat stress is associated with the breakdown of chlorophyll molecules into phytol and chlorophyllide with the help of an enzyme chlorophyllase [12]. High temperatures have been reported to reduce photosynthesis in tomatoes by altering enzyme activity, photophosphorylation, and electron transport, as well as stomatal conductance and photoassimilate translocation [9,11,40]. Tomato varieties with higher heat stress tolerance capacity were found to maintain a higher chlorophyll a:b ratio while maintaining their total chlorophyll and carotenoids [4]. As a result, the reduced rate of photosynthesis shown in this study could be related to a disruption in photosynthetic pigment synthesis, lowered PSII activity, and impaired RuBP regeneration ability. As before, the cultivar BARI Tomato-15 exhibited relatively greater heat tolerance in comparison to others by having a lower change in leaf greenness (SPAD), PSII efficiency, dry mass, and gas exchange parameters (Figure 4, Figure 5, and Figure 7). In general, stronger positive correlations among the rate of transpiration, stomatal conductance, and rate of photosynthesis were observed under heat stress (Figure 8). Interestingly, the dry weight of plants under heat stress also maintained a significantly higher positive correlation with the rate of photosynthesis and stomatal conductance. This provides a strong clue that current photosynthesis under heat stress is a major determinant of biomass yield. The reduced total dry matter in all tomato cultivars under heat stress in our experiment could be attributed to a lower rate of photosynthesis, hence the reduced photoassimilate production.
The result in this study reveals that the catalase and ascorbate peroxidase activities in three tomato cultivars were significantly increased under heat treatments (Figure 7), indicating an increased formation of ROS. Among three cultivars, the percent increase of APX and CAT over control was significantly higher in BARI Tomato-15 (Figure 3b), which indicates that this cultivar had a higher inherent capability to produce antioxidative enzymes to cope with the increased levels of destructive ROS and, therefore, showed tolerance to heat stress. The antioxidative enzymes APX and CAT had significant positive relationships with A, SPAD, and the Fv/Fm ratio, but only under conditions of heat stress (Figure 8). These two enzymes had a high correlation and were the primary contributors to the PC2 score in PC analysis (Figure 9). Additionally, the hierarchical heatmap of STI demonstrates that APA and CAT constitute a distinct cluster (Figure 10). This was the only cluster with STI values greater than 100 for all cultivars examined, and curiously, BARI Tomato-15 was the best cultivar, with much higher STI values for APX and CAT than the other two cultivars. Plants subjected to elevated temperatures have been shown to suffer oxidative damage as a result of the generation of reactive oxygen species (ROS), which hampers cellular activities by changing proteins and lipids [16,17,30,41]. The plant uses both enzymatic and nonenzymatic antioxidative mechanisms to cleanse ROS, with enzymatic defense being the most efficient [36]. Catalase, ascorbate peroxidase, and superoxide dismutase are the key antioxidative enzymes, while carotenoids additionally act as antioxidants [42]. Green plants can indirectly and directly counter the harmful effects of ROS via antioxidant enzymes such as ascorbate peroxidase (APX) and catalase (CAT). This is because sustaining higher antioxidant levels has favorable effects on plants [43,44]. Carotenoids have a strong potency to scavenge ROS, thereby protecting photosynthetic pigments and unsaturated fatty acids from being damaged [45,46]. Very interestingly, the absolute content of total carotenoids in the BARI Tomato-15 cultivar was not affected due to heat stress (Figure 6), and this provided an additional advantage to this cultivar to the tolerance against heat stress.

5. Conclusions

Heat stress is a serious limiting factor in tomatoes’ productivity and yield. It is vital to identify stress-tolerant features in tomato cultivars, particularly in areas of the world such as Bangladesh, where winter is very short. Based on chlorophyll content, PSII efficiency, gas exchange parameters, and antioxidative enzyme activity in leaves, the cultivar BARI Tomato-15 outperformed and displayed greater resistance to heat stress than the other cultivars studied. Although BARI Tomato-15 is a winter cultivar, farmers have chosen it as a spring variety that can withstand a sudden heat spell (35–40 °C) that comes after the winter season (late February to March). This study uncovered some physiochemical bases of BARI Tomato-15’s heat stress resistance mechanisms.

Author Contributions

Conceptualization: M.S.H. and M.T.H.; methodology: M.S.H. and M.T.H.; formal analysis: M.S.H., M.N.U., and M.T.H.; data curation: M.N.U. and M.S.H.; statistical expertise: M.N.U. and M.S.H.; writing—original draft preparation: M.S.H. and M.T.H.; writing—review and editing: M.A.H., M.N.U., M.S.H., A.K.M.G.S., O.M.A., A.A.H.A.L., and A.H.; visualization: M.A.H., M.N.U., M.S.H.; supervision: M.S.H. and A.K.M.G.S.; project administration: M.S.H. and M.T.H.; funding acquisition: M.S.H., O.M.A., A.A.H.A.L., and A.H. All authors have read and agreed to the published version of the manuscript.

Funding

This research was funded by a research grant from Bangladesh Agricultural University (BAU) (Project No. 2018/349/BAU). The work was also funded by the Taif University Researchers Supporting Project number (TURSP-2020/81), Taif University, Taif, Saudi Arabia.

Institutional Review Board Statement

Not applicable.

Informed Consent Statement

Not applicable.

Data Availability Statement

Data used in the article are available in all Figures and Tables.

Acknowledgments

The authors acknowledge Md. Tarikul Islam and his institute, Bangladesh Institute of Nuclear Agriculture (BINA), for their assistance and providing climate chamber facilities during the experiment. The authors appreciate Taif University Researchers Supporting Project (TURSP-2020/81), Taif University, Taif, Saudi Arabia, for providing financial support to conduct the research.

Conflicts of Interest

The authors have no conflict of interest to disclose.

References

  1. Intergovernmental Panel on Climate Change (IPCC). Climate Change 2007: Synthesis Report; Contribution of Working Groups I, II and III to the Fourth Assessment Report of the Intergovernmental Panel on Climate Change; Core Writing Team, Pachauri, R.K., Reisinger, A., Eds.; IPCC: Geneva, Switzerland, 2007; p. 104. [Google Scholar]
  2. Dhankher, O.P.; Foyer, C.H. Climate resilient crops for improving global food security and safety. Plant Cell Environ. 2018, 41, 877–884. [Google Scholar] [CrossRef]
  3. Christidis, N.; Jones, G.S.; Scott, P.A. Dramatically increasing chance of extremely hot summers since the 2003 European heatwave. Nat. Clim. Chang. 2014, 5, 46–50. [Google Scholar] [CrossRef]
  4. Camejo, D.; Rodriguez, P.; Morales, M.A.; Dell’amico, J.M.; Torrecillas, A.; Alarcon, J.J. High temperature effects on photosynthetic activity of two tomato cultivars with different heat susceptibility. J. Plant Physiol. 2005, 162, 281–289. [Google Scholar] [CrossRef] [PubMed]
  5. Zhou, R.; Yu, X.; Xu, L.P.; Wang, Y.L.; Zhao, L.P.; Zhao, T.M.; Yu, W.G. Genome-wide identification of circular RNAs in tomato seeds in response to high temperature. Biol. Plant. 2019, 63, 97–103. [Google Scholar] [CrossRef]
  6. Zhou, R.; Yu, X.; Li, X.; dos Santos, T.M.; Rosenqvist, E.; Ottosen, C.O. Combined high light and heat stress induced complex response in tomato with better leaf cooling after heat priming. Plant Physiol. Biochem. 2020, 151, 1–9. [Google Scholar] [CrossRef] [PubMed]
  7. Jahan, M.S.; Shu, S.; Wang, Y.; Hasan, M.M.; El–Yazied, A.A.; Alabdallah, N.M.; Hajjar, D.; Altaf, M.A.; Sun, J.; Guo, S. Melatonin pretreatment confers heat tolerance and repression of heat-induced senescence in tomato through the modulation of ABA–and–GA–mediated pathways. Front. Plant Sci. 2021, 12, 650955. [Google Scholar] [CrossRef] [PubMed]
  8. Alsamir, M.; Mahmood, T.; Trethowan, R.; Ahmad, N. An overview of heat stress in tomato (Solanum lycopersicum L.). Saudi J. Biol. Sci. 2020, 28, 1654–1663. [Google Scholar] [CrossRef] [PubMed]
  9. Zhou, R.; Yu, X.; Kjær, K.H.; Rosenqvist, E.; Ottosen, C.O.; Wu, Z. Screening and validation of tomato genotypes under heat stress using Fv/Fm to reveal the physiological mechanism of heat tolerance. Environ. Exp. Bot. 2015, 118, 1–11. [Google Scholar] [CrossRef]
  10. Jahan, M.S.; Shu, S.; Wang, Y.; Chen, Z.; He, M.; Tao, M.; Sun, J.; Guo, S. Melatonin alleviates heat-induced damage of tomato seedlings by balancing redox homeostasis and modulating polyamine and nitric oxide biosynthesis. BMC Plant Biol. 2019, 19, 414. [Google Scholar] [CrossRef]
  11. Jahan, M.S.; Guo, S.; Sun, J.; Shu, S.; Wang, Y.; El–Yazied, A.A.; Alabdallah, N.M.; Hikal, M.; Mohamed, M.H.M.; Ibrahim, M.F.M.; et al. Melatonin–mediated photosynthetic performance of tomato seedlings under high–temperature stress. Plant Physio. Biochem. 2021, 167, 309–320. [Google Scholar] [CrossRef] [PubMed]
  12. Mishra, D.; Shekhar, S.; Agrawal, L.; Chakraborty, S.; Chakraborty, N. Cultivar-specific high temperature stress responses in bread wheat (Triticum aestivum L.) associated with physicochemical traits and defense pathways. Food Chem. 2017, 221, 1077–1087. [Google Scholar] [CrossRef]
  13. Zhou, R.; Yu, X.; Ottosen, C.-O.; Rosenqvist, E.; Zhao, L.; Wang, Y.; Yu, W.; Zhao, T. Drought stress had a predominant effect over heat stress on three tomato cultivars subjected to combined stress. BMC Plant Biol. 2017, 17, 24. [Google Scholar] [CrossRef] [Green Version]
  14. Larkindale, J.; Hall, J.D.; Knight, M.R.; Vierling, E. Heat stress phenotypes of Arabidopsis mutants implicate multiple signaling pathways in the acquisition of thermotolerance. Plant Physiol. 2005, 138, 882–897. [Google Scholar] [CrossRef] [Green Version]
  15. Apel, K.; Hirt, H. Reactive oxygen species: Metabolism, oxidative stress, and signal transduction. Ann. Rev. Plant Biol. 2004, 55, 373–399. [Google Scholar] [CrossRef] [Green Version]
  16. Jahan, M.S.; Shu, S.; Zhong, M.; Chen, Z.; Wu, J.; Sun, J.; Guo, S. Exogenous salicylic acid increases the heat tolerance in tomato (Solanum lycopersicum L.) by enhancing photosynthetic efficiency and improving antioxidant defense through scavenging of reactive oxygen species. Sci. Hortic. 2019, 247, 421–429. [Google Scholar] [CrossRef]
  17. Zhou, R.; Kong, L.; Yu, X.; Ottosen, C.-O.; Zhao, T.; Jiang, F.; Wu, Z. Oxidative damage and antioxidant mechanism in tomatoes responding to drought and heat stress. Acta Physiol. Plant. 2019, 41, 20. [Google Scholar] [CrossRef]
  18. Hall, A.E. Crop Responses to Environment; CRC Press LLC.: Boca Raton, FL, USA, 2001. [Google Scholar]
  19. Ayenan, M.A.T.; Danquah, A.; Hanson, P.; Ampomah-Dwamena, C.; Sodedji, F.A.K.; Asante, I.K.; Danquah, E.Y. Accelerating breeding for heat tolerance in tomato (Solanum lycopersicum L.): An integrated approach. Agronomy 2019, 9, 720. [Google Scholar] [CrossRef] [Green Version]
  20. Haque, M.S.; Kjaer, K.H.; Rosenqvist, E.; Sharma, D.K.; Ottosen, C.-O. Heat stress and recovery of photosystem II efficiency in wheat (Triticum aestivum L.) cultivars acclimated to different growth temperatures. Environ. Exp. Bot. 2014, 99, 1–8. [Google Scholar] [CrossRef]
  21. Zhou, R.; Wu, Z.; Wang, X.; Rosenqvist, E.; Wang, Y.; Zhao, T.; Ottosen, C.-O. Evaluation of temperature stress tolerance in cultivated and wild tomatoes using photosynthesis and chlorophyll fluorescence. Hortic. Environ. Biotechnol. 2018, 59, 499–509. [Google Scholar] [CrossRef]
  22. Poudyal, D.; Rosenqvist, E.; Ottosen, C.-O. Phenotyping from lab to field-tomato lines screened for heat stress using Fv/Fm maintain high fruit yield during thermal stress in the field. Funct. Plant Biol. 2018, 46, 44–55. [Google Scholar] [CrossRef] [PubMed]
  23. Zhou, R.; Wan, H.; Jiang, F.; Li, X.; Yu, X.; Wang, X.; Rosenqvist, E.; Ottosen, C.O. The alleviation of photosynthetic damage in tomato under drought and cold stress by high CO2 and melatonin. Int. J. Mol. Sci. 2020, 21, 5587. [Google Scholar] [CrossRef] [PubMed]
  24. Ahmmed, S.; Jahiruddin, M.; Razia, S.; Begum, R.A.; Biswas, J.C.; Rahman, A.S.M.M.; Ali, M.M.; Islam, K.M.S.; Hossain, M.M.; Gani, M.N.; et al. Fertilizer Recommendation Guide—2018; Bangladesh Agricultural Research Council: Dhaka, Bangladesh, 2018; p. 223. [Google Scholar]
  25. Lichtenthaler, H.K. Chlorophylls and carotenoids:pigments of photosynthetic biomembranes. Meth. Enzymol. 1987, 120, 173–182. [Google Scholar]
  26. Elavarthi, S.; Martin, B. Spectrophotometric Assays for Antioxidative Enzymes in Plants. In Plant Stress Tolerance, Methods in Molecular Biology; Sunkar, R., Ed.; Springer: Berlin/Heidelberg, Germany, 2010; Volume 639. [Google Scholar]
  27. Aebi, H. Catalase in vitro. Met.h Enzymol. 1984, 105, 121–126. [Google Scholar]
  28. Nakano, Y.; Asada, K. Hydrogen peroxide is scavenged by ascorbate–specific peroxidase in spinach chloroplasts. Plant Cell Physiol. 1981, 22, 867–880. [Google Scholar]
  29. R Core Team. Language and Environment for Statistical Computing; R Foundation for Statistical Computing: Vienna, Austria, 2013. [Google Scholar]
  30. Fahad, S.; Bajwa, A.A.; Nazir, U.; Anjum, S.A.; Farooq, A.; Zohalb, A.; Sadia, S.; Nasim, W.; Adkins, S.; Saud, S.; et al. Crop production under drought and heat stress: Plant responses and management options. Front. Plant Sci. 2017, 8, 1147. [Google Scholar] [CrossRef] [Green Version]
  31. Dutta, S.; Mohanty, S.; Tripathy, B.C. Role of temperature stress on chloroplast biogenesis and protein import in pea. Plant Physiol. 2009, 150, 1050–1061. [Google Scholar] [CrossRef]
  32. Karim, M.A.; Fracheboud, Y.; Stamp, P. Photosynthetic activity of developing leaves mays is less affected by heat stress than that of developed leaves. Physiol. Plant 1999, 105, 685–693. [Google Scholar] [CrossRef]
  33. Baker, N.R.; Rosenqvist, E. Application of chlorophyll fluorescence can improve crop production strategies: An examination of future possibilities. J. Exp. Bot. 2004, 55, 1607–1621. [Google Scholar] [CrossRef] [Green Version]
  34. Crafts-Brandner, S.J.; Salvucci, M.E. Sensitivity of photosynthesis in C4 plant, maize to heat stress. Plant Physiol. 2002, 129, 1773–1780. [Google Scholar] [CrossRef] [Green Version]
  35. Hameed, M.; Keitel, C.; Ahmad, N.; Mahmood, T.; Trethowan, R. Screening of tomatoes for heat stress tolerance under controlled conditions. Proc. Environ. Sci. 2015, 29, 173–174. [Google Scholar] [CrossRef] [Green Version]
  36. Farooq, M.; Aziz, T.; Basra, S.M.A.; Cheema, M.A.; Rehman, H. Chilling tolerance in hybrid maize induced by seed priming with salicylic acid. J. Agron. Crop Sci. 2008, 194, 161–168. [Google Scholar] [CrossRef]
  37. Wahid, A.; Gelani, S.; Ashraf, M.; Foolad, M.R. Heat tolerance in plants: An overview. Environ. Exp. Bot. 2007, 61, 199–223. [Google Scholar] [CrossRef]
  38. Lawlor, D.W.; Cornic, G. Photosynthetic carbon assimilation and associated metabolism in relation to water deficits in higher plants. Plant Cell Environ. 2002, 25, 275–294. [Google Scholar] [CrossRef] [PubMed] [Green Version]
  39. Murata, N.; Takahashi, S.; Nishiyama, Y.; Allakhverdiev, S.I. Photoinhibition of photosystem II under environmental stress. Biochim. Biophys. Acta-Bioenerg. 2007, 1767, 414–421. [Google Scholar] [CrossRef] [Green Version]
  40. Balla, K.; Bencze, S.; Janda, T.; Veisz, O. Analysis of heat stress tolerance in winter wheat. Acta Agron. Hung. 2009, 57, 437–444. [Google Scholar] [CrossRef]
  41. Dinar, M.; Rudich, J. Effect of heat stress on assimilate metabolism in tomato flower buds. Ann. Bot. 1985, 56, 249–257. [Google Scholar] [CrossRef]
  42. Moller, I.M.; Jensen, P.E.; Hansson, A. Oxidative modifications to cellular components in plants. Ann. Rev. Plant Biol. 2007, 58, 459–481. [Google Scholar] [CrossRef] [Green Version]
  43. Sharma, P.; Dubey, R.S. Drought induces oxidative stress and enhances the activities of antioxidant enzymes in growing rice seedlings. Plant Growth Regul. 2005, 46, 209–221. [Google Scholar] [CrossRef]
  44. Anjum, S.A.; Wang, L.C.; Farooq, M.; Hussain, M.; Xue, L.; Zou, C.M. Brassinolide application improves the drought tolerance in maize through modulation of enzymatic antioxidants and leaf gas exchange. J. Agron. Crop Sci. 2011, 197, 177–185. [Google Scholar] [CrossRef]
  45. Conn, P.F.; Schalch, W.; Truscott, T.G. The Singlet Oxygen and Carotenoid Interaction. J. Photochem. Photobiol. B Biol. 1997, 11, 41–47. [Google Scholar] [CrossRef]
  46. Edge, R.; McGarvey, D.J.; Truscott, T.G. The Carotenoids as Antioxidants—A Review. J. Photochem. Photobiol. B Biol. 1997, 41, 189–200. [Google Scholar] [CrossRef]
Figure 1. Photographs of three tomato cultivars cultivated both at control (25 °C) and heat stress regimes (38/25 °C day/night for four days) during the early flowering stage.
Horticulturae 07 00330 g001
Figure 2. Boxplots summarizing the descriptive statistics of different measured traits, namely dry mass (DM; g plant−1), leaf greenness (as SPAD unit), Fv/Fm ratio, rate of photosynthesis (A, µmol CO2 m2 s1), stomatal conductance (gs, mol m2 s1), rate of transpiration rate (E, mol m2 s1), various pigments such as chlorophyll a, chlorophyll b, total chlorophyll, and total carotenoids as µg mg−1 fresh weight, ascorbate peroxidase (APX), and catalase (CAT) as nmol min1 g1 fresh weight in three tomato cultivars grown under control and heat stress conditions at early flowering stage (60 DAS). The mean is represented by the blue points, while the median is represented by the thickened horizontal lines that divide the box. The lower and upper box boundaries, as well as the lower and higher whiskers, reflect the Q1 (25th percentile), Q3 (75th percentile), minimum (Q1–1.5IQR), and maximum (Q1 + 1.5 IQR) values, respectively. IQR is an abbreviation for interquartile range. Treatment means with various letters closer to the boxes are significant at 5% probability levels.
Horticulturae 07 00330 g002
Figure 3. (a) Dry mass variation in three tomato cultivars grown in control and heat stress (4 d) at 60 DAS. (b) The radar plot shows % decrease in dry mass and some physiochemical traits and % increase in CAT and APX activities under heat stress compared to control in three tomato cultivars at 60 DAS (n = 3). Treatment means that distinct letters in the bar diagram are significantly different from one another. Different letters at the top of each trait axis in the radar plot denote significant variance among cultivars. The colors of the letters are the same as line colors that denote different tomato cultivars. Chl a = Chlorophyll a, Chl b = Chlorophyll b, Chl a+b = Total chlorophyll, Carotenoids = Total carotenoids, DM = Dry mass, A = Rate of photosynthesis, gs = Stomatal conductance, E = Rate of transpiration, SPAD = Leaf greenness, Fv/ Fm = Maximum photochemical efficiency of PS II, CAT = Catalase, and APX = Ascorbate peroxidase.
Horticulturae 07 00330 g003
Figure 4. Trends in leaf greenness (SPAD; (a)) and the maximum photochemical efficiency of photosystem II (Fv/Fm; (b)) in three tomato cultivars on exposure to heat stress for four days during the blooming stage (60 DAS). The symbol D0 denotes the day before the introduction of stress (control), whereas the symbols D1, D2, D3, and D4 denote the first, second, third, and fourth days of the stress period, respectively. The vertical bars represent the standard error of the mean (n = 3).
Horticulturae 07 00330 g004
Figure 5. Photosynthesis rate A (µmol CO2 m2 s1; (a)), stomatal conductance gs (mol m2 s1; (b)), and transpiration rate E (mol m2 s1; (c)) in three tomato cultivars growing in two stress conditions (control and heat stress) at 60 days after sowing. The vertical bars represent the standard error of the means (n = 3). Treatment means denoted by various letters differ significantly.
Horticulturae 07 00330 g005
Figure 6. The chlorophyll a (a), chlorophyll b (b), total chlorophyll (c), and total carotenoid (d) concentrations in three tomato cultivars grown in two stress conditions (control and heat) at 60 DAS (µg mg1 fresh weight). SEM (n = 3) is shown in the vertical bars. Within cultivars, treatment means denoted by distinct letters varied considerably.
Horticulturae 07 00330 g006
Figure 7. Bar diagram (means ± SEM of three replicates) showing catalase (CAT, µmol min1 g1 fresh weight; (a)) and ascorbate peroxidase (APX, µmol min1 g1 fresh weight; (b)) activities that was measured in three tomato cultivars cultivated in two stress regimes (control and heat). Treatment means sharing different letters varied significantly.
Horticulturae 07 00330 g007
Figure 8. Scatterplot and correlation matrix of different traits of three tomato cultivars grown in control (a) and heat stress (b). In both, green and red boxes indicate positive and negative correlations, respectively, with increasing color intensity reflecting a higher correlation coefficient. The numeric values within the boxes are correlation coefficients between the paired traits. *, **, and *** indicate 5%, 1%, and 0.1% levels of significance, respectively. The diagonal panel indicates the data distribution of correlated traits. Chl a = Chlorophyll a, Chl b = Chlorophyll b, Total Chl = Total chlorophyll, Carot. = Total carotenoids, DM = Dry mass, A = Rate of photosynthesis, gs = Stomatal conductance, E = Rate of transpiration, SPAD = Leaf greenness, Fv/ Fm = Maximum photochemical efficiency of PS II, CAT = Catalase, and APX = Ascorbate peroxidase.
Horticulturae 07 00330 g008
Figure 9. (a) Biplot of different traits (loading plots showing with different colored arrows) and PCA score plots showing the cultivars observations under both control and heat stress. The loading plots demonstrate the traits; (b) Genotypic observations are distributed in different ordinates based on their dissimilarity in PC1 and PC2 scores and (c) shows the relative contributions of different traits to the PC1 and PC2 scores. The left panel depicts a PCA biplot illustrating the genotypic distribution between control and stress treatment. The right panel displays the same but with cultivar identification. The angles between the vectors generated from the biplot’s center point show whether the parameters under consideration exhibit positive or negative interactions. The closer the variables (vectors) that form smaller angles between them, the higher the positive correlation. The parameters used to develop PCA analysis: Chl a = Chlorophyll a, Chl b = Chlorophyll b, Total Chl = Total chlorophyll, Carotenoids = Total carotenoids, DM = Dry mass, A = Rate of photosynthesis, gs = Stomatal conductance, E = Rate of transpiration, SPAD = Leaf greenness, Fv/ Fm = Maximum photochemical efficiency of photosystem II, CAT = Catalase, and APX = Ascorbate peroxidase.
Horticulturae 07 00330 g009
Figure 10. The heatmap shows hierarchical clustering of traits and cultivars. The stress tolerance index (STI) values for different traits are grouped into four clusters, while three cultivars are clustered into two distinct groups.
Horticulturae 07 00330 g010
Table 1. Different growth stages, stage duration, and age of tomato cultivars used in the study.
Growth StageDate (Stage Duration)Crop Age (Days)
Sowing2 November, 2018 (0)0
1st emergence7 November, 2018 (5 d)5
Vegetative growth2 December, 2018 (25 d)30
First flowering17 December, 2018 (15 d)45
Anthesis (50% flowers open)2 January, 2019 (15 d)60 (heat stress)
Fruit ripening and harvest17 January to 12 February, 2019 (15 d)75–100
‘d’ denotes days.
Table 2. Investigation of variation using analysis of variance (ANOVA) for several measured traits in three tomato cultivars exposed to control and heat stress conditions.
ParametersSources of VariationRelative Change in C Compared to Control
Cultivar (C)Stress (S)C x S
Leaf greenness (SPAD)*********
Maximum photochemical efficiency of PSII (Fv/Fm)*******
Photosynthesis (A)*********
Stomatal conductance (gs)**********
Transpiration (E)************
Dry mass (DM)********
Chl a******NS**
Chl b****NSNS
Total chlorophyll******NS*
Total carotenoids****NS*
Ascorbate peroxidase (APX)**********
Catalase (CAT)**********
* = Significant at 5% level, ** = Significant at 1% level, *** = Significant at 0.1% level; NS = Nonsignificant.
Publisher’s Note: MDPI stays neutral with regard to jurisdictional claims in published maps and institutional affiliations.

