Article

Measuring Camellia Petal Color Using a Portable Color Sensor

by
Phillip C. Post
1 and
Mark A. Schlautman
2,*
1
D W Daniel High School, Central, SC 29630, USA
2
Department of Environmental Engineering and Earth Sciences, Clemson University, Anderson, SC 29625, USA
*
Author to whom correspondence should be addressed.
Horticulturae 2020, 6(3), 53; https://doi.org/10.3390/horticulturae6030053
Submission received: 12 August 2020 / Revised: 26 August 2020 / Accepted: 28 August 2020 / Published: 3 September 2020

Abstract

:
The color of petals of flowering plants is often determined by comparing one or more of the petals to various Royal Horticultural Society (RHS) Colour Chart cards until a color match is found. However, these cards are susceptible to fading with age and can also provide inaccurate results if lighting is not optimal. The cards also rely on the human eye to determine a match, which introduces the possibility of human error. The objectives of this study were to determine camellia (Camellia japonica L.) petal color using the RHS Colour Chart, to determine camellia petal color with the NixTM Pro color sensor (Nix Sensor Ltd., Hamilton, Ontario, Canada), and to compare these measurements using different color measuring approaches. Color measurements of camellia flower petals using the NixTM Pro color sensor were compared to published CIELAB values from the Royal Horticultural Society (RHS) Colour Chart. Forty-five petal color samples were collected from fifteen different camellia shrubs. The RHS Colour Chart was used for each of the petals, and the RHS identifications were recorded. Measurements using the NixTM Pro color sensor were compared to RHS-provided CIELAB values that corresponded with the recorded identification for each petal to determine accuracy. The NixTM Pro color sensor’s measurements were also compared to a mean of the values, multiple measurements on the same petal location, and multiple measurements on different petal locations to determine precision and variation. The Nix™ Pro color sensor’s readings were precise in petal color determination and provided more nuanced differences between petals of the same plant and plants of the same variety in each of the color categories. The RHS Colour Chart provided an accurate depiction of most petals, but it was difficult to use with petals that had wide color variation over the entire petal. The Nix™ Pro color sensor’s measurements appeared to have more variation in the b* color space. However, overall, the Nix™ Pro color sensor L*, a*, and b* values were highly correlated with the provided RHS values (p < 0.01), showing that the sensor can be used as an accurate and precise substitute for the RHS Colour Chart. The Nix™ Pro color sensor can be a useful, cost-effective tool to measure the petal color of camellia and other flowering plants and rectifies many of the problems associated with the RHS Colour Chart.

1. Introduction

Color is crucial to the survival and reproductive success of many flowering plants because it dictates whether or not insects will be attracted to and ultimately pollinate the plant [1]. A flower’s apparent color is governed by the selective absorption of specific wavelengths of light by the petals, as well as by light scattering in the petal’s interior [1]. Although the specific variation and signaling of different petal colors are not well understood, all petals function in a similar sense, in that their purpose is to reflect sunlight in a way that attracts a pollinator’s attention. However, there is a decreased return in light reflection for increased levels of color, and this fact is compounded by the energy required to produce more pigment [1]. For this reason, flower petals tend to be translucent rather than an energy-intensive solid, opaque color, as the higher rate of visible light reflection has been shown not to attract more pollinators, although petals that are too translucent would fail to attract pollinators [1]. Therefore, plants are in a constant act of balancing not attracting enough pollinators with spending too much energy on pigment production, causing variations in a petal’s color value between plants [1].
With a wide variety of colors and conditions that can affect them, there are many different color standards in use. For this research, the CIELAB color space, also known as CIE L*a*b*, was used. The CIELAB color space is defined by planes of constant lightness, L*, in relation to a net of lines parallel to the a* (green to red) and b* (blue to yellow) axes [2]. By calculating color on three axes, the CIELAB standard is able to provide an accurate yet uniform color measurement standard [2]. Unlike the commonly used CMYK and RGB color models, CIELAB is designed to approximate human vision, with the L* value closely matching the human eye’s perception of light [3]. It also has the advantage of being able to make minute color balance corrections by changing the a* or b* values, and to adjust the lightness contrast through the L* value [3]. Today, CIELAB is the most complete color space specified by the International Commission on Illumination (CIE) [3]. The L* value is measured on a scale from 0 to 100, where 0 is black and 100 is white [3]. The a* value is measured from −127, which is pure green, to 127, which is pure red [3]. Lastly, the b* value is measured from −127, which is pure blue, to 127, which is pure yellow [3]. This three-dimensional range between colors allows for distance to be calculated between colors, directly proportional to the difference between two colors in the human eye [3].
The color of flower petals is important for horticulturalists because, for ornamental plants such as camellias, petal color is one of the most critical characteristics and serves as a target and benchmark for plant breeding [4]. Petal color is a clear indicator of expressed genes that provides horticulturalists with a valuable pathway towards creating new varieties of ornamental plants, or visually understanding genetic interactions when breeding plants [4]. Furthermore, when some colors are distinctly lacking from ornamental plants (such as the lack of blue in Chinese roses and chrysanthemums), horticulturalists can profit if they breed new colors in popular ornamental plants, due to the novelty and visual appeal, highlighting the economic value that petal color can garner [5]. Petal color can also visually indicate pigments and chemicals present within certain species, as major flavonoid pigments such as anthocyanins and other crucial plant chemicals are directly related to a plant’s color [5]. As a result, petal color serves as a trove of information for horticulturalists regarding a plant’s genetic and chemical makeup, as well as serving as a visual indicator of genetic interactions from breeding. Thus, petal color provides horticulturalists with an invaluable amount of data, as well as the potential for economic success.
A wide array of physical and optical characteristics can dramatically alter a person’s perception of color. Color refers to the part of the electromagnetic spectrum that is visible to the human eye. An object’s color is defined by the visible light that is not absorbed, but instead is reflected into the human eye [6]. However, color is not absolute, as many physical conditions can alter the human perception of color. Two principal physical conditions are value, the relative lightness or darkness of a color, and gradation, the physical conditions of the contiguous surface [7]. Both of these conditions are relative, as the value of a color can change with the lighting (i.e., a rainy or sunny day) and the gradient of a color is relative to the surface it is covering. Consequently, human perception of a color can change dramatically just because of a different time of day or due to the presence of a different surface. Furthermore, optical illusions, such as the simultaneous contrast effect, can alter one’s perception of a color due to a surrounding color [7]. This optical illusion is often seen when a color is placed on a bright background and the color also seems to become brighter in value, despite no change in the actual color.
The Royal Horticultural Society (RHS), the United Kingdom’s leading gardening charity, is one of the oldest and most influential societies in horticulture [8]. The Society was founded in 1804 for the purpose of publishing scientific research, as well as bringing together the foremost researchers in horticulture. The RHS has expanded its collection of research and experimentation within its scientific gardens, however, its members, as well as gardeners around the world, have struggled with identifying and naming plant colors. Starting in the mid-1930s, the RHS addressed this issue by creating a comprehensive manual containing hundreds of defined colors [9]. Since then, the RHS Colour Chart has been constantly improved and is now in its sixth edition. In addition to new and refined colors, the chart has been updated from a book to a fan deck, for easier use in the field. Since its introduction, the RHS Colour Chart has been the universal standard for plant color classification.
The RHS Colour Chart works by arranging a spectral order of fully saturated and progressively less saturated colors, which are to be matched to the plant [10]. The chart functions only if it is used under a natural north light and cannot work with artificial light or direct sunlight. The plant is then placed within the holes of the color chart until a uniform color is formed, which indicates that a matching color and identification has been found. The color chart guide notes that measurements may become increasingly erroneous if the measurer’s eyes become fatigued. Furthermore, flowers, which are not homogeneous in color, will not have an exact match and must be described as being close to the matched color. Once a proper match is found, the type of color can be universally described using the RHS Colour Chart naming system. If an exact match cannot be found, then the natural color of the petal cannot accurately be described [4]. This is problematic, as often there is not an exact match between a petal and the color chart, but rather the closest equivalent to the petal’s color which is used.
Traditionally, color card matching methods like the RHS Colour Chart has been used as a standard reference for flower color classification. However, these traditional methods rely on human vision to assess color, which varies from person to person. Inexpensive color sensors, such as the NixTM Pro sensor (Nix Sensor Ltd., Hamilton, Ontario, Canada), used in the present study, can potentially serve as a more reliable and accurate method of assessing color. The NixTM Pro color sensor was developed to replace printed color charts used in interior design and has revolutionized the market by providing an inexpensive yet accurate color sensor within a mobile body [11]. The NixTM Pro color sensor has been used in a wide variety of applications, from soil science [12] to meat quality checks [13]. The NixTM Pro color sensor was used to identify soil color and predict soil organic carbon and total nitrogen [12,14] and soil samples have been compared to the Munsell Soil Color Chart (MSCC) [15]. The purpose of that study was to evaluate if the inexpensive NixTM Pro color sensor could take accurate, consistent readings, potentially resolving issues with the MSCC’s print quality variations and propensity to fade [15]. The study found that the NixTM Pro color sensor provided repeatable readings that were similar to the much more expensive Konica Minolta CR-400 laboratory colorimeter (Konica Minolta Sensing Americas, Inc., Ramsey, NJ) [15]. The study concluded that the NixTM Pro color sensor was an excellent alternative to the MSCC method for in-field soil color determination. However, no previous research could be found that utilized the sensor for plant color evaluation.
A wide variety of species fit into the Camellia genus. It is home to more than 400 species, with a combination of white, pink, red, and yellow colors. Camellias were originally native to China and Japan’s warm subtropical regions, but were introduced to Western gardens during the colonial period [16]. Camellia plants have a large economic value for multiple reasons. The primary reason is that camellia plants are harvested for their oil and tea leaves, with camellia oil fetching a significantly higher market price than other plant-based oils because of its nutritional and medicinal properties [17]. This does not include the large camellia gardening market, which is reliant on accurate color depiction to sell the aesthetically pleasing shrub. Camellias provide a sizeable economic value for their oil and tea yield, as well as through their sought-after beauty. This beauty primarily results from the plant’s flowers, and research has found that petal color is the deciding factor in a majority of consumers’ decisions when buying an ornamental plant [4]. However, the camellia industry still lacks a widely available and accurate color testing method. Due to the fact that camellias span a vast geographical area, varying environmental conditions can skew human-based color measuring methods. The NixTM Pro color sensor could help to alleviate this problem by providing an inexpensive way to identify camellia petal color universally. Due to its patented design, which blocks out light and other environmental conditions, the NixTM Pro color sensor could provide uniform readings. This study compares the use of the NixTM Pro sensor for petal color classification by comparing it to the current universal RHS Colour Chart identification method. The specific objectives of this study were to: (1) determine camellia petal color with the RHS Colour Chart, (2) assess camellia petal color with the NixTM Pro color sensor, and (3) compare the measurements of camellia petal color using the NixTM Pro color sensor and 3rd party color equivalents of the RHS Colour Chart.

2. Materials and Methods

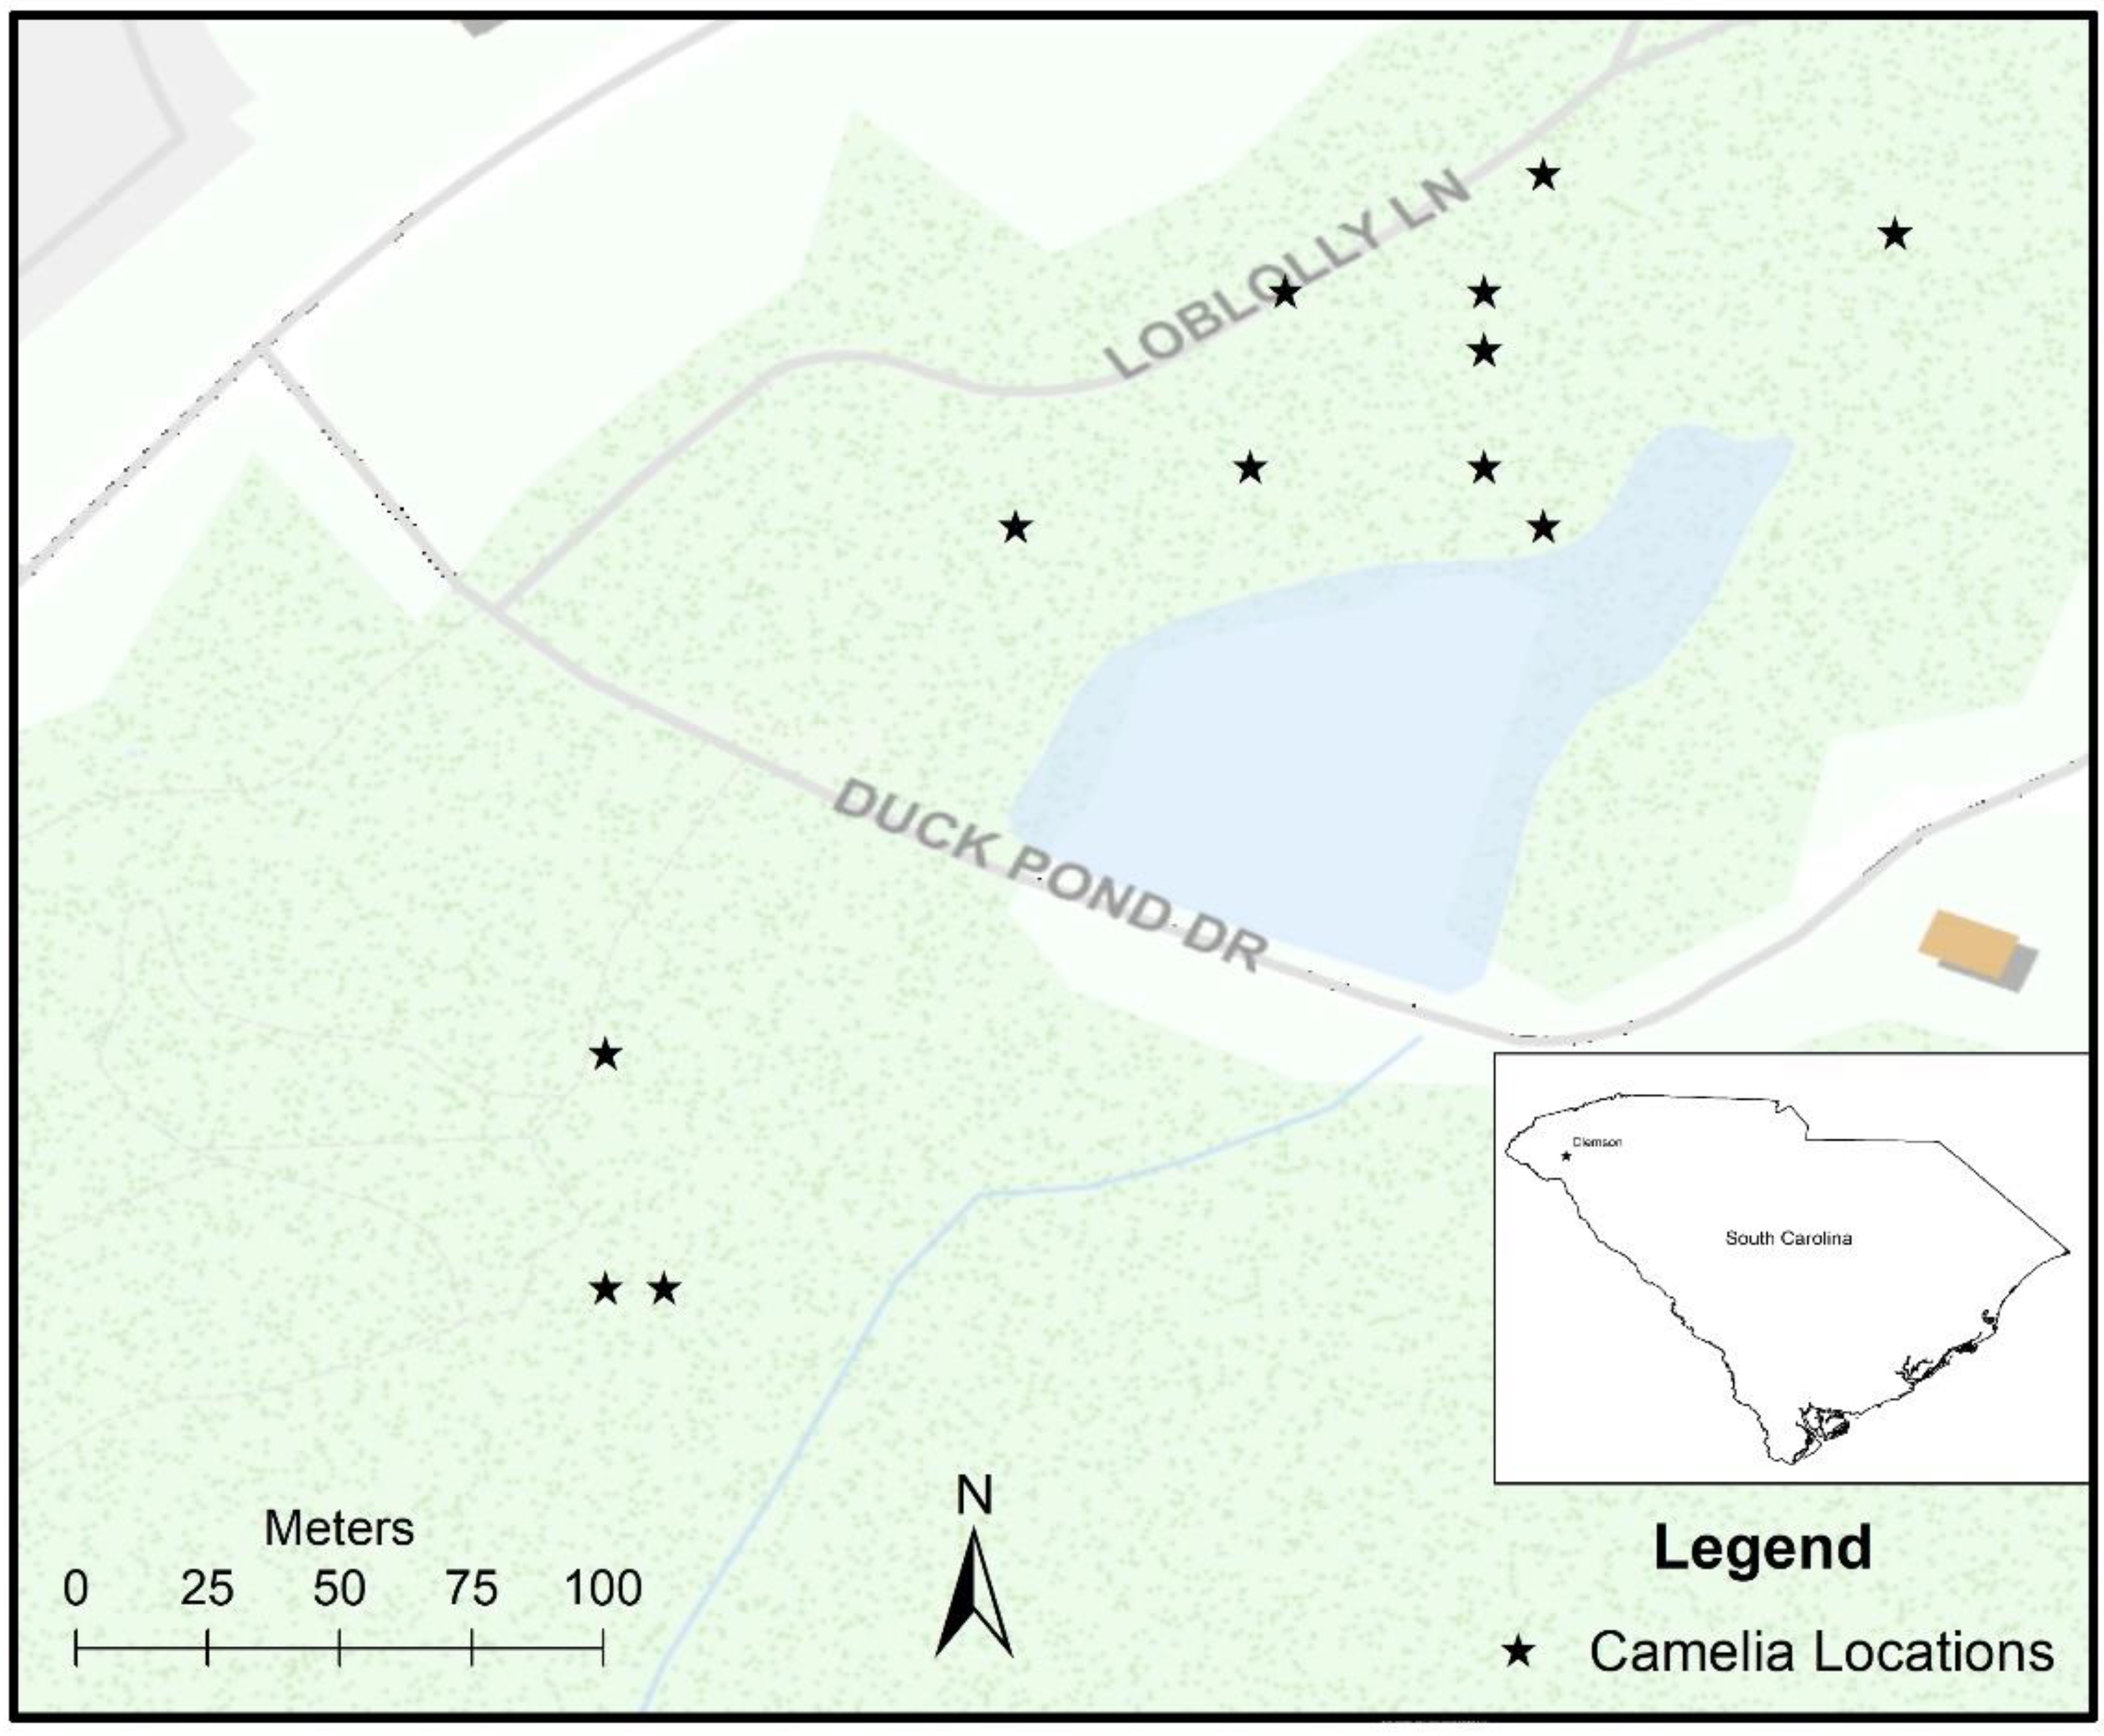
2.1. Site Description

The South Carolina Botanical Garden is an extensive 295-acre garden (Figure 1), founded in 1958 for the purpose of preserving a camellia collection on the Clemson University Campus [18]. Due to this mission, the botanical garden is home to one of America’s largest and most diverse camellia collections with over 400 varieties of camellias [19]. The climate of the area is temperate and generally mild to warm year-round, with temperatures occasionally falling below freezing in the winter months. The area receives an average amount of rainfall of 1270 mm annually [20] and the South Carolina Botanical Garden has sizable ponds to act as water reserves. Located in the Piedmont region of South Carolina, the South Carolina Botanical Garden provides a significant variety of camellias to sample, allowing for a large and diverse sampling size.

2.2. Data Collection

As explained in more detail by Stiglitz et al. [15], the NixTM Pro Color Sensor has its own light-emitting diode light source and is controlled through a Bluetooth-connected mobile device. The sensor can output results in a variety of different color systems, including RGB, CMYK, and CIE L*a*b*. The NixTM Pro Color Sensor is rechargeable, easily accessible because of its small size, can be recalibrated easily, and is relatively inexpensive (~$350). Data were collected during March of 2020 over several days to assure sampling uniformity among the various camellia shrubs, using steps outlined in the data collection flowchart (Figure 2). Figure 2 describes the general process behind the data collection, as well as the ways in which precision, variation, and accuracy were measured. For accuracy comparison, RHS provided CIELAB values for each of the color card identifications used in comparison to the Nix™ Pro color sensor readings [21].
The first task was to find a camellia shrub that was in bloom yet had many fresh flowers. Shrubs that were at the end of their blooming cycle or which had browning flowers were avoided. Once a suitable shrub was found, a petal was removed from three different flowers on the same shrub to mitigate color variation between flowers. The petals were then placed on their respective identification number—either 1, 2, or 3 (for categorizing results)—on a white cardboard backing (Figure 3a,b). The RHS fan decks were compared to each petal by the researcher until a match, or the closest color, was found and then recorded (Figure 3a).
The color matching was performed in non-direct sunlight during mid-day to prevent any color skewing by the lighting conditions. Furthermore, a second researcher confirmed each of the RHS measurements as the closest color match to each petal’s color. After the three RHS measurements were recorded, the Nix™ Pro color sensor was used on each of the petals and the results were also recorded (Figure 3b). This process was repeated for five white, five red, and five pink camellia shrubs, with a total of 45 different petals being measured with both the RHS and Nix™ Pro color sensor. Table 1 outlines the specific varieties that were sampled, according to their respective color category of white, pink, or red, and Table 2 provides RHS color identifications for each of the three petals for each variety.

2.3. Statistical Analysis

Packages Lattice and GGplot2 within R Studio were used for the data analyses and graphs [23]. Lattice was used to produce some of the figures instead of GGplot2 due to its ability to easily incorporate multiple sets of data within a single graph [24]. However, GGplot2 was used to calculate p-values and R-squared values due to its ability to quickly provide a wide range of calculations [25]. GGplot2 was used to create figures, as well as for the analyses. All of the tables were created in Microsoft Excel, and the table statistics were also calculated in Microsoft Excel.

3. Results and Discussion
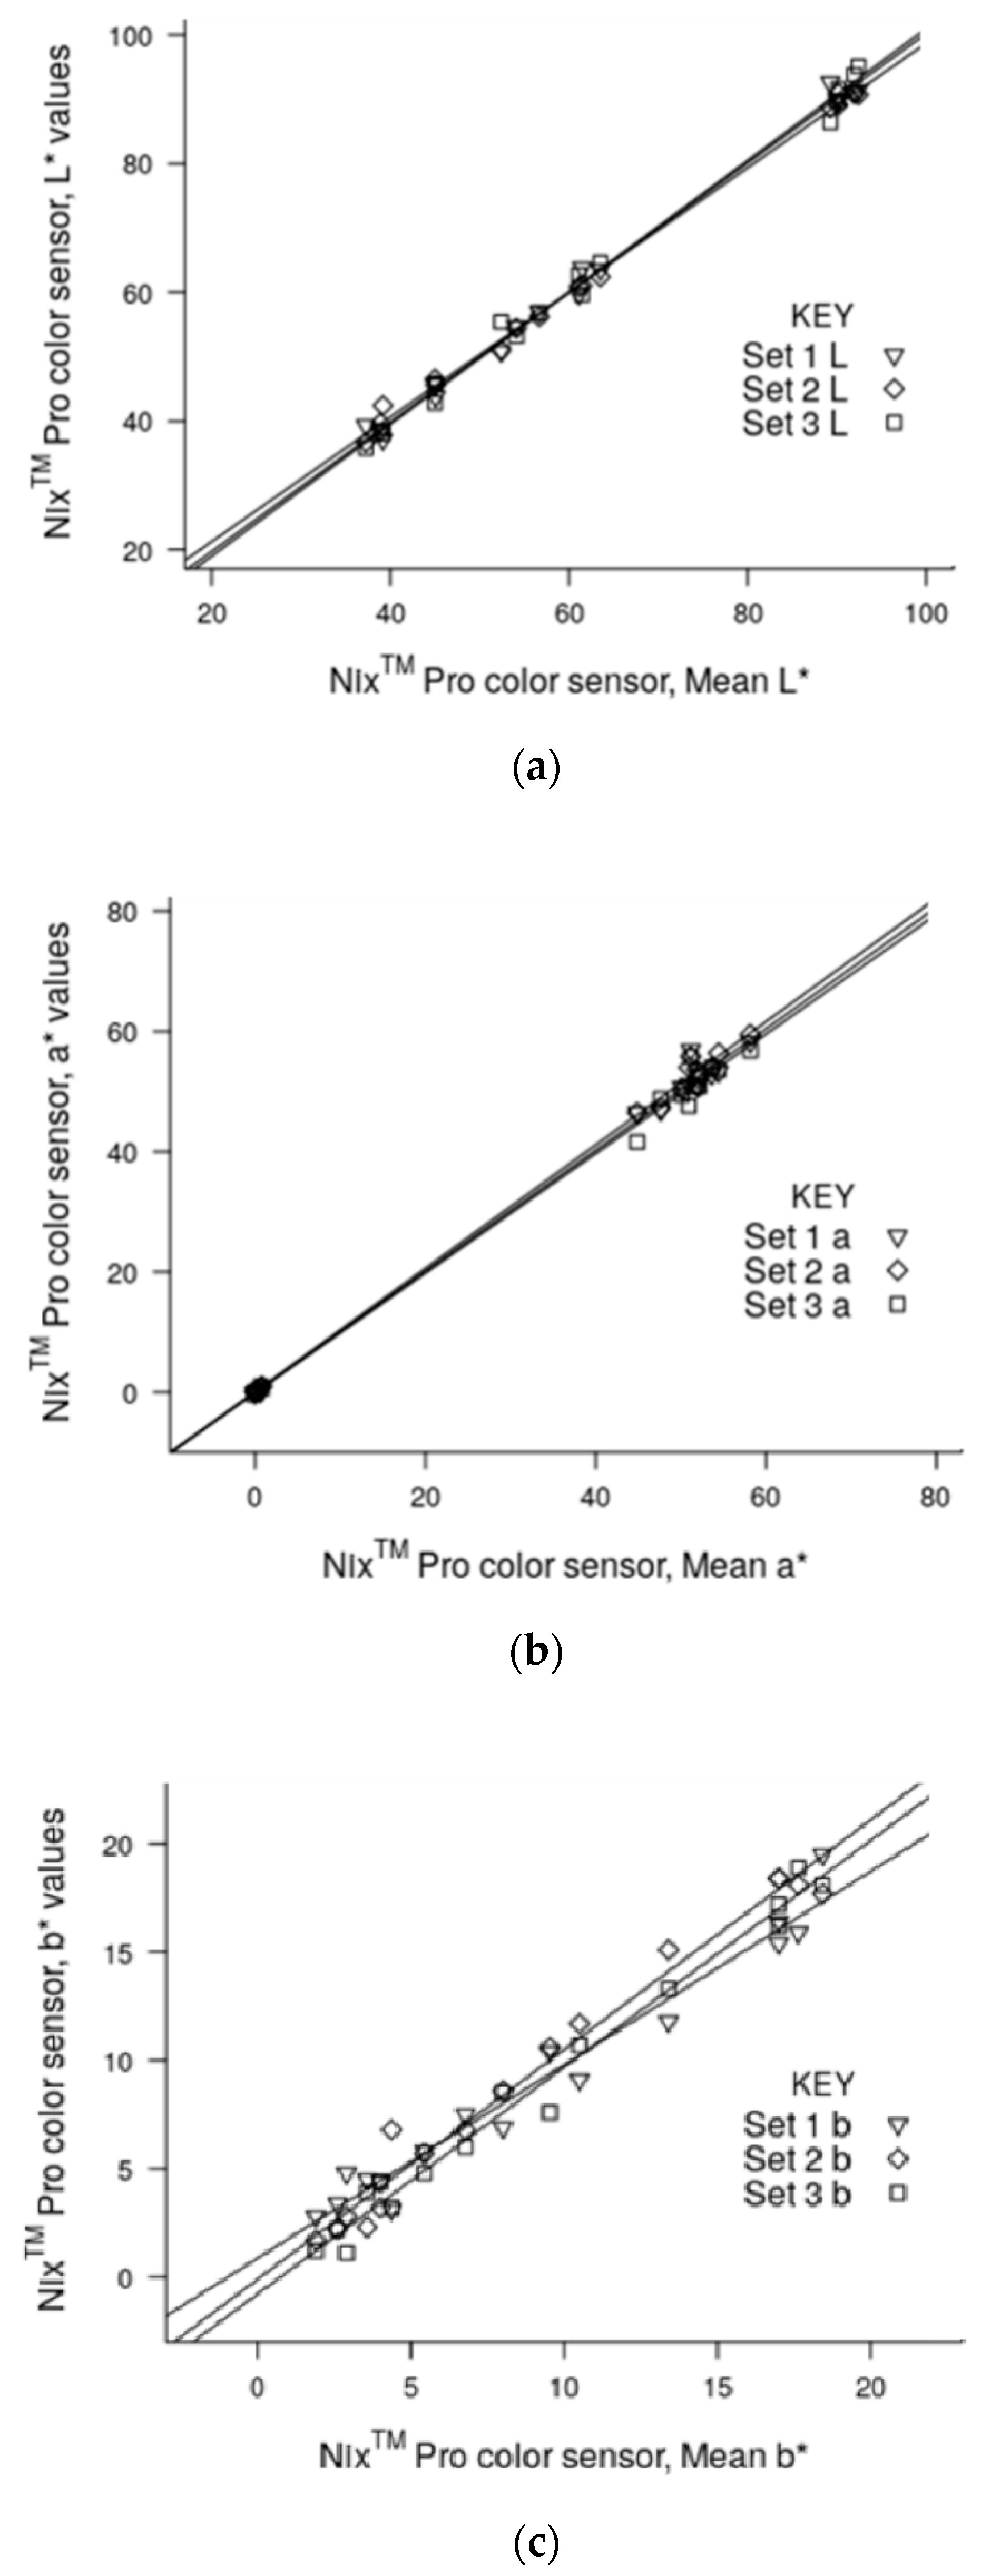
3.1. Accuracy

Accuracy was measured by comparing the Nix™ Pro color sensor L*, a*, and b* values of a petal to the provided corresponding L*, a*, and b* values of the RHS identification, and extraneous values were removed (Figure 4). The corresponding L*, a*, and b* values of the RHS identifications are contained in Table 3. Overall, there was a significantly low p-value and high R-squared value for each of the results. The L* value had a p-value < 0.01 and R-squared of 0.9257, a* value had a p-value of < 0.01 and R-squared of 0.9434, and b* value had a p-value of < 0.01 and R-squared of 0.8213. Overall, the p-value was less than 0.01; therefore, the null hypothesis (that there is no correlation between the Nix™ Pro color sensor’s and RHS’s measurements) can be rejected. The Nix™ Pro color sensor provides significantly similar results to the RHS values provided on the identification cards.
For the R-squared values, over 92% for the L* value, 94% for the a* value, and over 82% for the b* value observed variation can be explained by the model’s inputs. Again, this demonstrates a high correlation between the CIELAB values taken by the Nix™ Pro color sensor and the values provided by the RHS Colour Chart identification. Consequently, the Nix™ Pro color sensor’s results make a compelling case as a substitute for the RHS Colour Chart card system. Interestingly, the b* value varies more than the L* and a* values, which correlates with the Nix™ Pro color sensor’s high standard deviation b* value in the precision section of the results. This may reinforce the earlier observation that the Nix™ Pro color sensor may have more difficulty processing the b* color range, leading to more variation in the results.

3.2. Precision

Precision of the Nix™ Pro color sensor was determined by comparing the individual values of L*, a*, and b* to their respective mean values (Figure 5). For the L* values, among the different data sets, the lowest R-squared value was 0.9938, indicating a low variation between the three L* value data sets and the mean (Figure 5a). For the a* values, the lowest R-squared value was 0.9944, reflecting a low variation between the three a* value sets and the mean (Figure 5b). For the b* values, the lowest R-squared value was 0.9647, suggesting a slightly higher but still low variation between the b* values and their mean (Figure 5c). These high R-squared values signify little difference between the individual measurements and their overall mean, indicating a high overall precision. However, there was slightly higher variation with the b* value (blue to yellow) among measurements, indicating that the color sensor may have a harder time precisely measuring this range. Another measure of precision is the variation between three repeated measurements on the exact same location of the petals (Table 4). The Nix™ Pro color sensor had a very high precision between measurements on the same location, with the highest standard deviation being 0.6 (Table 4).
Camellias in the white category had almost no deviation with a maximum deviation of 0.1. Red and pink also had minimal deviation overall; however, the varieties ’Tiffany’ and ‘Joe Holland’ had a higher L* value deviation of 0.6. This higher standard deviation does not imply a deficiency with the Nix™ Pro color sensor, as later results reflect that these varieties have a higher color variation over their petals.

3.3. Variation

Nix™ Pro color sensor variation was measured by the standard deviation of readings from three different locations on the same petal (Table 5). Although high, the standard deviation values between the three readings were almost all under 3.0 and most were closer to 1.0. Certain varieties, such as ‘Tiffany’ and ‘Joe Holland’, had a high standard variation of over 6.0, reflecting a higher color variation over the petal. This corresponds to the high standard deviation found for these varieties in the precision section of the results. The final measurement of variation was the difference between different measurements of petals from the same camellia plant (Table 6). Despite readings being taken from separate petals, the standard deviation between petals was quite low when outliers were excluded. Measurements for each variety were within a certain range, demonstrating the Nix™ Pro color sensor’s ability to distinguish variety, even within the same color category, by their L*, a*, b* values. For example, when outliers were excluded, both ‘Show Time’ and ‘Tiffany’ are within the pink category, but ‘Show Time’ had an a* value range (green to red) of 17.3–23.8 and ‘Tiffany’ had an a* value range of 31.9–36.9 (Table 6). Each variety had its own unique green-to-red range, suggesting that varieties could be distinguished by their color range. Overall, the Nix™ Pro color sensor had high precision, with high R-squared values and relatively low standard deviations.

3.4. Sensor-Based Color Measurements in Horticulture

The technology used to measure plant color has undergone various stages of applications in horticulture. For example, an inexpensive Epson document scanner was previously used to accurately estimate leaf color [26]. The process used a combination of color and contrast to determine the amount of chlorophyll within a leaf [26]. When compared to a lab spectrophotometer, linear regressions between the readings were significant, at p < 0.05 [26]. However, the procedure to reach these results was laborious, requiring 43 individual steps [26]. Digital and smartphone cameras were evaluated to measure leaf and flower color [27]. Flower and leaf colors were measured repeatedly, and the results were accurate when plant and leaf parts were uniform in color [27]. However, color variations were found between the five cameras tested because of the differences in color sensors [27]. Variations in lighting conditions influenced the reported color values [27].
Consumer-level digital cameras were successfully modified to capture ultraviolet images and to take multiple images of varying wavelengths to provide an accurate depiction of a petal’s color [28]. When compared to an Ocean Optics spectrophotometer equipped with a PX-2 pulsed xenon light source, the digital camera’s results had a high correlation to the Ocean Optic’s readings, highlighting the potential for this new color measuring technology [28]. The main limitations of that study were that it was difficult to standardize lighting conditions and each individual camera had its own specific color profile and space [28]. These digital camera limitations produced results that had a correlation with highly saturated yellow samples, but higher variation in red and green flower petals [28]. That technology required color calibration tools, expensive digital cameras, and multiple filters and ultraviolet camera modifications in order to produce accurate color results [28].
This study utilized the Nix™ Pro color sensor, which uses a standardized light source and is factory calibrated to accurately report object color by utilizing red, blue, and green filters, with a design which has the ability to block out exterior light [29]. This represents a readily adoptable technology, compared to the earlier attempts to use digital cameras and scanners. The Nix™ Pro color sensor is portable, accurate, and low-cost, and may represent an accessible innovation to standardize horticultural petal color measurements. Applications of sensor technology in plant color determination is critical for herbarium collections, landscaping, agriculture (e.g., mineral deficiencies in plants, chlorosis etc.) and other applications [30,31,32].

4. Conclusions

The Nix™ Pro color sensor’s readings were repeatable and unique to specific camellia varieties, with high R-squared values and low standard deviation values for the precision tests. When outliers were removed, each variety of camellia fit within a specific range of L*, a*, and b* values, which was statistically significantly correlated to RHS classification values. The Nix™ Pro color sensor was considerably easier to operate, as it does not require specific lighting, does not fade with use, and does not require the time-consuming process of comparing different cards in order to find an exact match. However, the data did reflect a wider variation with the b* value (blue to yellow) color range between measurements. This may indicate that the Nix™ Pro color sensor produces values in this color range with a higher variation. Overall, the p-values less than 0.01 mean that there is a statistically significant correlation between the measurements produced by the Nix™ Pro color sensor and the values of the matching RHS identification. This high degree of correlation signifies that the Nix™ Pro color sensor can act as a highly accurate and precise substitute for the RHS Colour Chart card system. The application of the Nix™ Pro color sensor to measure petal color quickly, inexpensively, and effectively allows for a more convenient method of categorizing camellias. This provides a high value to horticulturists, as the Nix™ Pro color sensor can detect minute changes in values, detecting changes in genetic variation and enabling horticulturists to breed certain colors. The Nix™ Pro color sensor also potentially provides a value to consumers and sellers of camellias. This is because sellers can provide consumers with the exact color of their camellias rather than a category, allowing for more confidence in camellia transactions. The Nix™ Pro color sensor can provide digital readings within seconds while maintaining a high level of precision and accuracy, no matter of the lighting conditions, potentially providing a cost-effective tool to horticulturists, consumers, and sellers alike.

Author Contributions

Conceptualization, P.C.P.; methodology, P.C.P.; formal analysis, P.C.P. and M.A.S.; writing—original draft preparation, P.C.P.; writing—review and editing, P.C.P. and M.A.S.; visualization, P.C.P. All authors have read and agreed to the published version of the manuscript.

Funding

This research received no external funding.

Acknowledgments

The authors would like to thank the South Carolina Botanical Gardens for their camellia collection.

Conflicts of Interest

The authors declare no conflict of interest.

References

  1. Van der Kooi, C.; Elzenga, J.T.M.; Staal, M.; Stavenga, D.G. How to colour a flower: On the optical principles of flower coloration. Proc. R. Soc. B 2016, 283, 20160429. [Google Scholar] [CrossRef] [PubMed] [Green Version]
  2. Hill, B.; Roger, T.; Vorhagen, F.W. Comparative analysis of the quantization of color spaces on the basis of the CIELAB color-difference formula. ACM Trans. Graph. (TOG) 1997, 16, 109–154. [Google Scholar] [CrossRef]
  3. Ganesan, P.; Rajini, V.; Rajkumar, R.I. Segmentation and edge detection of color images using CIELAB color space and edge detectors. In Proceedings of the INTERACT-2010, Chennai, India, 3–5 December 2010; pp. 393–397. [Google Scholar] [CrossRef]
  4. Ayala-Silva, T.; Meerow, A.W. Evaluation of flower color using a colorimeter and the Royal Horticultural Society charts. Interam. Soc. Trop. Hortic. 2006, 50, 138–144. [Google Scholar]
  5. Zhao, D.; Tao, J. Recent advances on the development and regulation of flower color in ornamental plants. Front. Plant Sci. 2015, 6, 261. [Google Scholar] [CrossRef] [PubMed] [Green Version]
  6. Nassau, K. The Fifteen Causes of Color: The Physics and Chemistry of Color; Wiley: Hoboken, NJ, USA, 1987. [Google Scholar] [CrossRef]
  7. Agostini, T.; Galmonte, A. Perceptual organization overcomes the effects of local surround in determining simultaneous lightness contrast. Psychol. Sci. 2002, 13, 89–93. [Google Scholar] [CrossRef] [PubMed]
  8. Mylechreest, M. Thomas Andrew Knight and the founding of the Royal Horticultural Society. J. Gard. Hist. 1984, 12, 132–137. [Google Scholar] [CrossRef]
  9. A Horticultural Colour Chart. 1936. Available online: https://www.nature.com/articles/138322d0 (accessed on 15 April 2020).
  10. RHS Media. Royal Horticultural Society (RHS) Colour Chart, 6th ed.; Royal Horticultural Society: London, UK, 2015. [Google Scholar]
  11. NixTM Pro. 2020. Available online: https://www.nixsensor.com/ (accessed on 10 April 2020).
  12. Stiglitz, R.Y.; Mikhailova, E.A.; Sharp, J.L.; Post, C.J.; Schlautman, M.A.; Gerard, P.D.; Cope, M.P. Predicting soil organic carbon and total nitrogen at the farm scale using quantitative color sensor measurements. Agronomy 2018, 8, 212. [Google Scholar] [CrossRef] [Green Version]
  13. Holman, B.W.B.; Hopkins, D.L. A comparison of the Nix Colour Sensor ProTM and HunterLab MiniScanTM colorimetric instruments when assessing aged beef colour stability over 72 h display. Meat Sci. 2019, 147, 162–165. [Google Scholar] [CrossRef] [PubMed]
  14. Mikhailova, E.A.; Stiglitz, R.Y.; Post, C.J.; Schlautman, M.A.; Sharp, J.L.; Gerard, P.D. Predicting soil organic carbon and total nitrogen in the Russian Chernozem from depth and wireless color sensor measurements. Eurasian Soil Sci. 2017, 50, 1414–1419. [Google Scholar] [CrossRef]
  15. Stiglitz, R.; Mikhailova, E.; Post, C.; Schlautman, M.; Sharp, J.L. Evaluation of an inexpensive sensor to measure soil color. Comput. Electron. Agr. 2016, 121, 141–148. [Google Scholar] [CrossRef] [Green Version]
  16. Carter, K. Camellias. Available online: https://ucanr.edu/sites/urbanhort/files/80153.pdf (accessed on 15 April 2020).
  17. Robards, K.; Prenzler, P.; Ryan, D.; Zhong, H. Camellia Oil and Tea Oil. Available online: https://www.sciencedirect.com/science/article/pii/B9781893997974500176 (accessed on 15 April 2020).
  18. Haque, M.; South Carolina Botanical Garden. Scencyclopedia.org. Available online: http://www.scencyclopedia.org/sce/entries/south-carolina-otanical-garden/ (accessed on 10 April 2020).
  19. Discover South Carolina. South Carolina Botanical Garden. Available online: https://discoversouthcarolina.com/products/2703 (accessed on 10 April 2020).
  20. U.S. Climate Data. Weather Averages Clemson, South Carolina. Available online: https://www.usclimatedata.com/climate/clemson/south-carolina/united-states/ussc0059 (accessed on 10 April 2020).
  21. Royal Horticultural Society Colour Charts Edition V. Available online: http://rhscf.orgfree.com (accessed on 9 August 2020).
  22. International Camellia Society. 2020. The On-line Camellia Registry. Available online: https://internationalcamellia.org/international-camellia-register?camelliaId=13256&state=b (accessed on 10 April 2020).
  23. RStudio Team. RStudio: Integrated Development for R. RStudio; PBC: Boston, MA, USA, 2020; Available online: http://www.rstudio.com/ (accessed on 10 April 2020).
  24. Sarkar, D. Lattice: Multivariate Data Visualization with R; Springer: New York, NY, USA, 2008; ISBN 978-0-387-75968-5. Available online: http://lmdvr.r-forge.r-project.org (accessed on 10 April 2020).
  25. Wickham, H. Elegant Graphics for Data Analysis; Springer: New York, NY, USA, 2016; ISBN 978-3-319-24277-4. Available online: https://ggplot2.tidyverse.org (accessed on 10 April 2020).
  26. Murakami, P.F. An Instructional Guide for Leaf Color Analysis Using Digital Imaging Software; U.S. Department of Agriculture, Forest Service, Northeastern Research Station: Newtown Square, PA, USA, 2005; Volume 327. [Google Scholar]
  27. Kendal, D.; Hauser, C.E.; Garrard, G.E.; Jellinek, S.; Giljohann, K.M.; Moore, J.L. Quantifying plant colour and colour difference as perceived by humans using digital images. PLoS ONE 2013, 8, e72296. [Google Scholar] [CrossRef]
  28. Garcia, J.E.; Greentree, A.D.; Shrestha, M.; Dorin, A.; Dyer, A.G. Flower colours through the lens: Quantitative measurement with visible and ultraviolet digital photography. PLoS ONE 2014, 9, e96646. [Google Scholar] [CrossRef] [PubMed] [Green Version]
  29. Mukhopadhyay, S.; Chakraborty, S. Use of diffuse reflectance spectroscopy and Nix pro color sensor in combination for rapid prediction of soil organic carbon. Comput. Electron. Agric. 2020, 176, 105630. [Google Scholar] [CrossRef]
  30. Griesbach, R.J.; Austin, S. Comparison of the Munsell and Royal Horticultural Society’s color charts in describing flower color. Taxon 2005, 54, 771–773. [Google Scholar] [CrossRef]
  31. Kasajima, I. Measuring plant colors. Plant Biotechnol. 2019, 36, 63–75. [Google Scholar] [CrossRef] [PubMed] [Green Version]
  32. Voss, D.H. Relating colorimeter measurement of plant color to the Royal Horticultural Society Colour Chart. HortScience 1992, 27, 1256–1260. [Google Scholar] [CrossRef]
Figure 1. Map of the study area and sampling locations in the South Carolina Botanical Garden in Clemson, SC, USA.
Horticulturae 06 00053 g001
Figure 2. Flowchart of camellia petal color measuring methodology.
Horticulturae 06 00053 g002
Figure 3. Example of measuring camellia petal color using: (a) the Royal Horticultural Society (RHS) Colour Chart [10], and (b) the NixTM Pro color sensor [11].
Horticulturae 06 00053 g003
Figure 4. Comparison of NixTM Pro sensor color values to Royal Horticultural Society (RHS) Colour Chart published values for: (a) L* (darkness to lightness), (b) a* (redness to greenness), and (c) b* (yellowness to blueness). The dashed line represents perfect agreement.
Horticulturae 06 00053 g004
Figure 5. Comparison of NixTM Pro sensor color values to Royal Horticultural Society (RHS) Colour Chart published values for: (a) L* (darkness to lightness), (b) a* (redness to greenness), and (c) b* (yellowness to blueness).
Horticulturae 06 00053 g005
Table 1. Sampled camellia (Camellia japonica L.) in the South Carolina Botanical Garden with information from the International Camellia Society (2020) [22].
VarietyInformation
Color: White
Snow on the MountainYashiro, Kôken, 1841, Kokon Yôrankô, vol. 310. Originated in Japan.
ChastityWoodroof 1947, SCCS., Bulletin, vol. 8, No. 6, p. 4; Valley Garden Supply Catalogue,1946–1947.
MasterpieceYokoyama & Kirino, 1989, Nihon no Chinka, p. 26, colour photo and description.
Ivory TowerSCCS., 1968, Camellia Nomenclature, p. 71.
Nuccio’s PearlNuccio’s Nurseries Catalogue, 1978, p. 12: (N #730l).
Color: Pink
Marie BraceyAmerican Camellia Yearbook, 1957, p. 301, Reg. No. 292.
In the PinkKramer Nursery Catalogue, 1971: Rose-pink formal double. American Camellia Yearbook, 1979, p. 107, Reg. No. 1541.
Ruth LennonAmerican Camellia Yearbook, 1991, p. 80, Reg. No. 2214, colour photo between pages 80–81.
CelestinaAnonymous, Mar. 1832, Revue Horticole, p. 203–204: Double. Light rose, fine form. Originated by Cunningham, England.
Show TimeNuccio’s Nurseries Catalogue, 1978: Light pink semi-double. American Camellia Yearbook, 1979, p. 111, Reg. No. 1528.
TiffanyWomak, 1962–1963, American Camellia Yearbook, p. 1.
Color: Red
Scarlet GloryAmerican Camellia Yearbook, 1984, p. 181, Reg. No. 1953.
Barbara MorganFruitland Nursery Catalogue, 1946–1947, p. 29; Fendig, 1952, American Camellia Catalogue.
MathotianaAnonymous, 1847, Gardeners’ Chronicle, (27):434. Spae, 1847, Société Royale d’Agriculture et de Botanique de Gand, Annales (1847), 3:459–460, pl. 170.
Dr. Clifford ParksAmerican Camellia Yearbook, 1972, p. 128, Reg. No. 1210.
Dr. W. G. LeeGerbing Azalea Nursery Catalogue Supplement, 1943–1944 as ‘Dr Lee’s No. 43’.
Joe HollandMagnolia Gardens and Nursery Catalogue, 1942–1943.
Table 2. The Royal Horticultural Society (RHS) Colour Chart [10] measurements for sampled camellia (Camellia japonica L.) in the South Carolina Botanical Garden with information from the International Camellia Society (2020) [22].
VarietyPetal 1Petal 2Petal 3
Color: White
Snow on the MountainNN155ANN155DNN155D
ChastityNN155ANN155DNN155D
MasterpieceNN155DNN155DNN155D
Ivory TowerNN155DNN155ANN155D
Ivory TowerNN155DNN155DNN155D
Nuccio’s PearlNN155DN155DN155D
Color: Pink
Marie Bracey58C58C58C
Marie Bracey55A55A55B
In the Pink47D47D52D
Ruth Lennon55A55A55A
Celestina58C58C58C
Show Time62C62D62C
Tiffany54C54C54D
Color: Red
Scarlet Glory45B45B45B
Scarlet Glory53C53B53B
Barbara Morgan53C53C53C
Mathotiana53C52A53C
Dr. Clifford Parks45B45B45B
Dr. W. G. Lee46C46C46C
Joe Holland50A50B50A
NOTE: RHS chip numbers with corresponding colors are NN155A = yellowish white, NN155D = white, N155D = yellowish white, 58C = strong purplish red, 55A = deep purplish pink, 55B = strong purplish pink, 47D = deep pink, 52D = strong pink, 62C = light purplish pink, 62D = pale purplish pink, 54C = strong pink, 54D = moderate purplish pink, 45B = vivid red, 53C = strong red, 53B = strong red, 46C = vivid red, 50A = strong red, 50B = deep pink.
Table 3. The Royal Horticultural Society (RHS) Colour Chart [10] identification and corresponding color measurements [21].
RHS ColourL*a*b*
NN155A Yellowish White9533
N155D White926−1
NN155D White965−5
NN155B White954−1
N45B Moderate Red35.356.618.1
N45C Moderate Red39.554.617.5
53C Strong Red465614
58C Strong Purplish Red59586
62C Light Purplish Pink8029−5
62D Pale Purplish Pink8617−3
54C Strong Pink68373
54D Moderate Purplish Pink78283
55A Deep Purplish Pink62558
55B Strong Purplish Pink6943−1
45B Vivid Red436027
46C Vivid Red486026
50A Strong Red505924
50B Deep Pink575318
51A Strong Red525514
52A Vivid Red545923
53C Strong Red465614
52D Strong Pink743910
47D Deep Pink614915
46D Deep Yellowish Pink525621
NOTE: L* (darkness to lightness), a* (redness to greenness), and b* (yellowness to blueness).
Table 4. Mean (standard deviation) of three NixTM Pro color sensor readings from one location within each of three sampled petals from the same camellia plant for each sampled plant.
VarietyL*a*b*
Color: White
Nuccio’s Pearl
- Petal 188.3 (0.1)1.9 (0.0)3.9 (0.0)
- Petal 287.3 (0.1)1.0 (0.0)9.0 (0.0)
- Petal 387.5 (0.0)1.6 (0.0)5.7 (0.0)
Color: Pink
Show Time
- Petal 173.2 (0.1)34.8 (0.1)5.1 (0.0)
- Petal 279.0 (0.0)23.8 (0.0)1.9 (0.0)
- Petal 366.3 (0.1)33.9 (0.1)3.3 (0.0)
Tiffany
- Petal 169.1 (0.1)38.9 (0.1)5.3 (0.0)
- Petal 269.6 (0.1)40.8 (0.0)6.0 (0.0)
- Petal 365.7 (0.6)41.9 (0.2)7.8 (0.1)
Color: Red
Scarlet Glory
- Petal 138.0 (0.0)46.1 (0.1)12.7 (0.0)
- Petal 238.4 (0.0)47.8 (0.0)11.8 (0.0)
- Petal 344.1 (0.1)55.0 (0.0)17.8 (0.0)
Joe Holland
- Petal 146.8 (0.2)51.2 (0.1)12.2 (0.1)
- Petal 250.1 (0.1)49.4 (0.1)10.6 (0.0)
- Petal 344.1 (0.6)50.0 (0.0)7.9 (0.0)
NOTE: L* (darkness to lightness), a* (redness to greenness), and b* (yellowness to blueness).
Table 5. Mean (standard deviation) of the NixTM Pro color sensor readings from three petals from the same camellia plant for each plant sampled.
VarietyL*a*b*
Color: White
Snow on the Mountain92.4 (2.4)−0.1 (0.3)4.0 (0.7)
Chastity89.2 (3.1)0.7 (0.4)2.9 (1.9)
Masterpiece91.9 (1.6)0.8 (0.2)1.9 (0.8)
Ivory Tower90.1 (0.7)0.2 (0.1)4.4 (2.1)
Ivory Tower90.1 (1.3)0.03 (0.1)3.6 (1.1)
Nuccio’s Pearl87.6 (0.8)1.8 (1.0)6.5 (3.5)
Color: Pink
Marie Bracey54.1 (0.8)52.2 (1.1)5.4 (0.6)
Marie Bracey52.4 (2.6)47.6 (1.0)2.6 (0.7)
In the Pink63.5 (1.1)44.9 (2.8)9.5 (1.7)
Ruth Lennon61.1 (1.5)50.1 (0.7)6.8 (0.8)
Ruth Lennon61.5 (2.1)52.0 (1.2)8.0 (0.1)
Celestina56.7 (0.4)50.9 (3.2)10.5 (1.3)
Show Time72.0 (7.1)31.8 (6.9)3.5 (1.7)
Tiffany57.2 (6.1)40.7 (2.4)22.9 (13.2)
Color: Red
Scarlet Glory39.2 (2.8)54.4 (1.7)17.0 (1.5)
Scarlet Glory39.9 (3.7)48.3 (5.9)13.2 (4.4)
Barbara Morgan38.9 (0.7)51.8 (1.6)13.4 (1.7)
Mathotiana45.0 (1.9)58.2 (1.4)17.0 (1.2)
Dr. Clifford Parks37.3 (1.8)53.6 (0.6)17.6 (1.6)
Dr. W. G. Lee45.1 (1.1)56.2 (0.6)18.4 (0.9)
Joe Holland52.9 (6.1)50.3 (1.1)10.1 (1.8)
NOTE: L* (darkness to lightness), a* (redness to greenness), and b* (yellowness to blueness).
Table 6. Mean (standard deviation) of one NixTM Pro color sensor’s readings from three locations within each of three sampled petals from the same camellia plant.
VarietyL*a*b*
Color: White
Nuccio’s Pearl
- Petal 188.0 (3.2)1.1 (1.1)5.8 (2.8)
- Petal 286.8 (1.7)1.3 (0.6)7.4 (3.8)
- Petal 386.7 (1.2)1.5 (1.5)5.6 (1.3)
Color: Pink
Show Time
- Petal 174.8 (3.6)30.0 (8.3)4.7 (4.1)
- Petal 279.8 (2.7)17.3 (2.6)4.0 (2.2)
- Petal 377.0 (6.1)23.8 (7.9)3.7 (1.7)
Tiffany
- Petal 169.7 (3.1)36.1 (4.7)7.0 (1.2)
- Petal 269.8 (4.5)36.9 (3.0)9.4 (1.3)
- Petal 371.7 (2.8)31.9 (2.6)7.1 (2.8)
Color: Red
Scarlet Glory
- Petal 136.8 (1.4)46.7 (3.7)12.3 (2.3)
- Petal 238.0 (1.0)47.2 (1.9)12.0 (0.7)
- Petal 344.8 (0.6)55.3 (0.8)17.1 (0.5)
Joe Holland
- Petal 152.9 (2.2)48.5 (2.2)9.4 (3.3)
- Petal 253.4 (0.9)48.4 (2.0)8.2 (1.5)
- Petal 346.4 (2.2)48.1 (1.9)7.2 (0.8)
NOTE: L* (darkness to lightness), a* (redness to greenness), and b* (yellowness to blueness).

