Abstract
The levels of different nutraceutical metabolites present in the jicama root were measured when subjecting the plant to induced biotic stress via infestation with Phyllophaga spp. (white grubs). The change in secondary metabolites on the stressed jicama roots (SJ), mostly antioxidants, was followed over 100, 140, and 180 days and compared against the non-infested control jicama (CJ). Our results show that infested (SJ) samples contained higher concentrations of tannins, flavonoids, and total phenols, measured using spectrophotometric methods, peaking at 140 days, and higher overall concentration of saponins. SJ samples showed higher DPPH inhibition, peaking at 100 days. Chlorogenic acid had the highest concentration among the phenolic compounds (7.47 mg g−1), followed by protocatechuic acid, both in SJ, which was possibly related to the lower observed concentrations of caffeic and ferulic acids. As for flavonoids, we observed a high concentration of rutin in CJ and a low concentration of pelargonidin and myricetin in SJ, possibly promoted via the dihydrokaempferol pathway. Taken together, these results show that Phyllophaga spp.-mediated biotic stress affects the concentrations of secondary metabolites in the different maturity stages in jicama, having an effect on its metabolic pathways, which presents an opportunity for the use of material such as agro-industrial waste.
1. Introduction
Jicama (Pachyrhizus erosus L.) is an herbaceous plant of the Fabaceae family that is usually consumed as a fresh vegetable [1]. Providing a feeling of satiety, it has a high water and fiber content, vitamins, minerals (folic acid, potassium, zinc, calcium, phosphorus, magnesium, and manganese), and is low in calories [2]. It has been reported that jicama has diuretic properties [3], reduces blood sugar level [4], decreases constipation [5] and cholesterol, and promotes the assimilation of calcium, facilitating the growth of the good bacteria that maintain a healthy colon. It has also been reported that this root favors the systematic metabolism of lipids, restores kidney activity, reduces phospholipids and triglycerides in the blood serum, promotes good intestinal function, and reduces duodenal ulcers and blood pressure problems, among other benefits [5,6]. However, there is a lack of information about which metabolites are related to these functional properties.
During the production of jicama, a lot of agricultural waste is generated due to the problems that this crop presents during its development, such as root breakage or the invasion of pests and fungal growth. Some authors have mentioned that jicama can be damaged by some insects, such as fleas, cutzo leaf miner, red spiders, mealy bugs [7,8], and American thrips [9]. However, the infestation by white grubs (Phyllophaga spp.) results in changes in growth patterns, morphology, and anatomy, occurring as a result of serious damage to the root [10]. Also, a symbiotic form of fungal growth has been reported, with macrostructural effects [11]. In this regard, some studies have shown that the pest infestation affects plant metabolism and chemical composition, as a resistance mechanism, limiting the penetration, development, or reproduction of the invading pathogen [12].
Published information shows that resistance in plants can be increased by physiological and biochemical changes [12]. These modifications in the chemical composition of plants have been reported to occur due to the presence of pests (nematodes and insects) and bacterial or fungal diseases (biotic stress), resulting in changes in protein expression and the concentration of nutrients or secondary metabolites (cyanogenic glycosides, flavonoid glycosides, and hydroxycoumarins [13]). These variations have also been associated with abiotic stress, such as high temperatures, humidity, shade, physical injury, or the presence of heavy metals [14], as well as harvest time, genotype, cultivation techniques, and operations carried out during post-harvest storage [15,16].
In some roots, such as cassava, the plant synthesizes cyanogenic glycosides when subjected to stress due to the presence of pests [17,18]. Other compounds, such as phenols and terpenoids, have also been found in the leaves and roots of cassava, which include flavonoid glycosides, hydroxycoumarins, ascorbic acid, and carotenoids [19,20,21,22], which play a principal role in plant defense [19]. Similarly, the presence of phytoalexins, induced by pathogen attack and wounding, has been reported [23,24,25].
Some hydroxycoumarins, such as scopoletin, esculetin, scopolin, and esculin, have been related to plant resistance to herbivores [26]. Simultaneously, nutraceutical activities have been attributed to these compounds, which make them a value-added material of industrial interest. For example, scopoletin is reported to have antimicrobial, anticancer, anti-inflammatory, anti-angiogenesis, antioxidant, antidiabetic, antihypertensive, hepatoprotective, and neuroprotective properties [27], while esculetin is also reported to have anti-inflammatory, antioxidant, antibacterial, and antitumor effects [28]. However, no studies have been found that evaluate the changes in the concentrations of secondary metabolites or phytochemicals in jicama crops such as cyanogenic glycosides, flavonoid glycosides, and hydroxycoumarins, which are related to pest infestations. This information would allow us to establish the basis to valorize damaged jicama as an agricultural residue, based on the types of secondary metabolites produced. Therefore, the aim of this study was to identify the effect of the presence of white grubs on the concentration of secondary metabolites in jicama under biotic stress during the three stages of ripening, focusing on phenolic compounds.
2. Materials and Methods
2.1. Materials
Two types of jicama roots (Pachyrhizus erosus): control and white grub-stressed samples, developed at three growth stages (100, 140, and 180 days) in two harvest cycles (2021 and 2022) in Apaseo el Grande, Guanajuato, Mexico, were studied. Only the roots were used as they are the only edible part of the plant. The first growing stage (100 days) was established based on the unstressed sample diameter (>5 cm), which allowed enough material for analysis to be collected [29]. The other two stages were selected considering the final harvesting time (180 days) and a halfway point (140 days). The 2021 cycle corresponded to the control jicama, which was sown in a pest-free field. The 2022 harvest cycle corresponded to the damaged jicama, using an already white grub-infected field (Figure 1). In both cases, the seeds were planted as reported by Gonzalez-Vazquez et al. [29]. The seed material (commercial yellow seed) was provided by the local jicama producers, who reproduced and stored the seed every season. The material used was registered as P-eV-7 and kept in the Seed Analysis Laboratory of the Tecnologico Nacional de Mexico, Campus Roque.
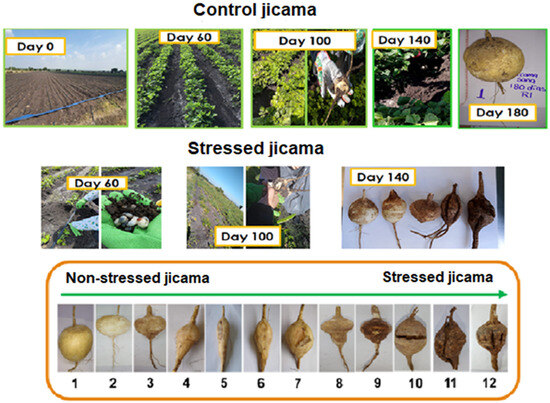
Figure 1.
Jicama crops stressed and control, pest images, and root damage degree.
After collection, the sample surface was cleaned by removing the dirt or soil present with a brush and then washed with sufficient water. Once cleaned, the samples were photographed, and only those that were healthy (control samples) and those with physical damage (stress samples) were used for analysis, looking to avoid microbiological contamination. Jicama roots were cut into slices of approximately 0.3 cm thick, and dried for 48 h (AFOS Ltd., AFOS MINI KLIN, Hull, UK) at 30 °C. Finally, the jicama was ground (Hamilton Beach Brands Inc., Glen Allen, VA, USA), for 10 min in 30 s lapses and sieved on a 0.5 mm monyl mesh (30 threads per inch and a 590-micron aperture). The materials were stored in Ziploc-sealable plastic bags in a desiccator at room temperature until further use. Then it refers to the control and storage nomenclature. Analyses were performed no more than one week after processing the samples.
2.2. Determination of Secondary Metabolites by Spectrophotometry
2.2.1. Determination of Saponins
To perform the spectrophotometric quantification of the saponins, the method of Hiai et al. [30] was followed, where 2 mg of sample was weighed and volume-adjusted to 10 mL with methanol. The solution was sonicated for 30 min (BRANSON 1510, Bransonic Ultrasonic Cleaner, Danbury, CT, USA) and filtered (Whatman filter paper No. 4), keeping the filtrate and adding 1 mL of 0.5% ρ-anisaldehyde (Sigma Aldrich, Saint Louis, MO, USA, A88107) solution in methanol (J.T. Baker, 9070-03, Avantor Performance Materials S.A. de C.V., Ecatepec de Morelos, Mexico) and 1 mL of 50% sulfuric acid (with distilled water) (Supelco, 1.1208, Merck KGaA, Darmstadt, Germany) in the dark. For the calibration curve (10–50 µg mL−1), diosgenin (Sigma Aldrich, D1634, Saint Louis, MO, USA) (0.2 mg mL−1) in methanol was used as the standard. The blank consisted of the same reaction mixture, but instead of the sample, 2 mL of methanol (J.T. Baker, 9070-03, Avantor Performance Materials S.A. de C.V., Ecatepec de Morelos, Mexico) was added. The tubes were shaken and incubated for 30 min at 100 °C. When finished, they were placed in an ice bath for 15 min to stop the reaction. Subsequently, each of the dilutions and the sample were read at a 430 nm absorbance in a UV/Vis spectrophotometer (Thermo Fisher Scientific, Genesys, Madison, WI, USA). The linear fitting equation of the calibration curve was used to calculate the saponin concentration.
2.2.2. Methanol Extracts for Flavonoids and Tannins
The methodology of Rosales-Castro et al. [31] was followed with some modifications. The Jicama powder sample (5 g) was mixed with 15 mL of 70% methanol (J.T. Baker, 9070-03, Avantor Performance Materials S.A. de C.V., Ecatepec de Morelos, Mexico), and left in this solution for 24 h at room temperature, with occasional manual agitation; the sample was then filtered through filter paper (Whatman, No. 4, GE Healthcare UK Limited, Buckinghamsire, UK). The same methanol extraction process was repeated with the remaining bark. The extracts obtained from the first and second procedures were combined and made up to 30 mL.
2.2.3. Determination of Flavonoids
The flavonoid content was determined using the aluminum trichloride assay [32]. The sample methanolic extract (1 mL) was combined with 1 mL of 2.0% (w/v) aluminum trichloride (Sigma Aldrich, 23701-8, Sant Louis, MO, USA) in ethanol (Sigma Aldrich, E7023), and left to rest for 1 h in dark conditions. Finally, the absorbance was measured at 420 nm using a UV/Vis spectrophotometer (Thermo Fisher Scientific, Genesys, Madison, WI, USA). 100% methanol (J.T. Baker, 9070-03, Avantor Performance Materials S.A. de C.V., Ecatepec de Morelos, Mexico) was used as a blank. The flavonoid concentrations of the extracts were determined using the quercetin standard curve (20–100 mg mL−1).
The quercetin standard (Sigma Aldrich, Q4951) sample for the calibration curve was prepared with a concentration of 400 ppm. Water and methanol 1:1 was used as solvent. The standard was protected from lighting and prepared immediately before use.
2.2.4. Determination of Tannins
The quantification of the tannins was carried out using the methodology of Gupta and Verma [33]. The methanolic extract (1 mL) was mixed with the vanillin hydrochloride reagent, prepared with mixtures of equal volumes of 8% (v/v) hydrochloric acid (Sigma Aldrich, 320331) and 4% (w/v) vanillin (Sigma Aldrich, V1104) in methanol (J.T. Baker, 9070-03, Avantor Performance Materials S.A. de C.V., Ecatepec de Morelos, Mexico). Subsequently, it was allowed to rest for 20 min at room temperature, and the absorbance was measured at 500 nm using a UV/Vis spectrophotometer (Thermo Fisher Scientific, Genesys, Madison, WI, USA). Absolute methanol was utilized as a blank. The tannin content in the samples was determined using the calibration curve (0.05–0.5 mg mL−1) for gallic acid (Sigma Aldrich, G7384).
2.2.5. Ethanolic Extracts for Total Phenols, DPPH, and ABTS
Ethanolic extracts were obtained using the methodology cited in Cuellar-Sanchez [34] with some modifications. The powdered jicama sample (2 g) and 20 mL of 80% ethanol (Sigma Aldrich, E7023) were mixed. Sonication was carried out for 30 min (BRANSON 1510, Bransonic Ultrasonic Cleaner, Danbury, CT, USA) and the mixture was subsequently filtered using Whatman No. 4 filter paper. The extracts were stored until later use.
2.2.6. Determination of Total Phenols
For the quantification of total phenols, the Folin–Ciocalteu technique was used as reported in Cuellar-Sanchez [34]. In this method, 1580 μL of distilled water, 100 μL of the Folin–Ciocalteu reagent (Sigma Aldrich, F9252), and 20 μL of the extract were mixed. After a 5-min rest, 300 μL of 20% sodium carbonate (J.T. Baker, 3602-01, Avantor Performance Materials S.A. de C.V., Ecatepec de Morelos, Mexico) was added and incubated at 40 °C for 30 min in the dark; the absorbance was measured at 765 nm using a UV/Vis spectrophotometer (Thermo Fisher Scientific, Genesys, Madison, WI, USA).
To obtain the concentration of phenolic compounds in the extracts, a gallic acid (Sigma Aldrich, G7384) calibration curve (0.01 to 0.7 mg mL−1) was developed. The blank was prepared with all the reagents except for the sample that was replaced by the extraction solvent. The results were expressed in gallic acid equivalents [34].
2.2.7. Determinations of Antioxidant Activity by DPPH
The antioxidant activity of the extract was determined using 0.003 g of the free radical DPPH (2,2-diphenyl-1-picryl-hydrazyl) (Sigma Aldrich, 440914) dissolved in 100 mL of methanol (Merck, 1038683929), which was allowed to stand for 5 min and was adjusted to an absorbance of 0.8 ± 0.02 at 517 nm (using pure MeOH as blank). The reference solution was prepared with 1 mL of DPPH and 50 µL of the extraction solvent in dark conditions. The percentage of antiradical activity was calculated as a percentage of the DPPH decolorization using the following equation:
where Am is the absorbance of the sample and Ar is the absorbance of the reference. The results were expressed as mg equivalents of ascorbic acid (Merck, 500078) and as percentages of inhibition. The calibration curve was obtained using a 1 mg mL−1 ascorbic acid (Merck, 500078) stock solution, which was diluted to obtain 0.01, 0.025, 0.05, 0.10, 0.15, and 0.2 mg mL−1 concentrations. The above methodology was followed as reported by Cuellar-Sanchez [34].
2.3. Determination of Secondary Metabolites (HPLC)
2.3.1. Stock Preparation and Work Standards
The reference standard stock solutions were prepared at a 1000 μg mL−1 concentration based on methanol (J.T. Baker, 9070-02, Avantor Performance Materials S.A. de C.V., Ecatepec de Morelos, Mexico) and stored at 4 °C, following the methodology reported by Mothibedi [35] and Gonzalez-Vazquez et al. [29].
2.3.2. Peak Separation for Phenolic Compounds by HPLC-DAD
An Agilent Zorbax Eclipse Plus C18 4.6 mm x 75 mm, 3.5 μm column was used with the conditions cited in Mothibedi [35] and Gonzalez-Vazquez et al. [29]: the column temperature was 35 °C, the injection volume was 5 µL, and the flow rate was 1 mL min−1. The mobile phase consisted of A: 0.5% phosphoric acid and B: Methanol and the isocratic phase of 40% A and 60% B. The run time was 8 min, and the absorbance reading was performed at 370 nm. A DAD detector at 20 nm was used (1260, Agilent Supports Scientists, Santa Clara, CA, USA).
The standards used for compound identifications in the jicama samples from the two crops were chlorogenic acid (Sigma Aldrich, C3878), ascorbic acid (Sigma Aldrich, A5960), protocatechuic acid (Sigma Aldrich, 03930590), ferulic acid (Sigma-Aldrich, 46278-1G-F, Merck KGaA, Darmstadt, Germany), pelargonidin (Sigma Aldrich, P1659), ρ-coumaric (Sigma Aldrich, C9008), quercetin (Sigma Aldrich, Q4951), caffeic acid (Sigma Aldrich, C0625), catechin (Sigma Aldrich, C-1251), myricetin (Sigma Aldrich, 70050), rutin (Sigma Aldrich, R5143), aloin (Sigma Aldrich, B6906), scopoletin (Sigma Aldrich, S2500), esculin (Sigma Aldrich, 2350), and gallic acid (Sigma Aldrich, G7384).
2.4. Statistical Analysis
Statistical analyses were performed using the Sigma-Plot software (v.12.5, SYSTAT Software Inc., San Jose, CA, USA) with a probability value of p < 0.05 considered as significant. The differences between the groups were assessed using the ANOVA-Tukey’s test. The results are presented as the mean of the three independent samples ± standard error.
3. Results and Discussion
3.1. Saponins
In the determination of the saponin content (Figure 2), the biotic stress significantly affected (p < 0.05) this parameter, with an almost two-fold increase in their values (41.88 mg g−1 and 42.68 mg g−1 at 100 and 140 days, respectively) compared with the control samples (21.02, 27.43, and 25.96 mg g−1 at 100, 140, and 180 days, respectively). The saponin content was not affected (p > 0.05) by the root development (100 and 140 days).
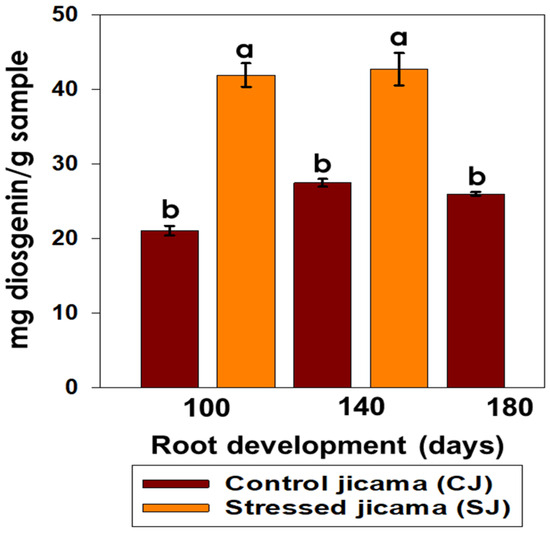
Figure 2.
Content of total saponins (mg diosgenin/g sample) in control (brown) and stressed jicama (orange) in the three development periods. Different letters represent the significant difference (p ≤ 0.05).
These differences between the control and stressed samples are related to the physical and chemical defense mechanisms in the plants, such as the production of saponins and phytoalexins [36]. It has been cited that during pathogen infection, the content of saponins in the tissue surrounding the infection site can significantly change due to the partial or complete hydrolysis of the compounds, appearing as part of either the plant defense response or their degradation by the pathogen [36]. Some studies have reported an increment in the concentration of saponins in cañihua from 8.7 to 43.2 mg g−1 or in quinoa [37], when the samples are under stress conditions, with values similar to those obtained in jicama samples. It has been also reported that in some plants, such as cassava, saponins are stored in their roots, up to 5–6% [38], suggesting that these metabolites act as phytoprotectors against pathogenic soil microbes and other pests that attack plant tissues [39]. Saponins also exert strong insecticidal activity by forming complexes with cholesterol, causing cellular toxicity and insects’ ecdysial failure [40]. Many researchers have proven the activities of plant-derived saponins against important insect pests, such as aphids, beetles, weevils, leafhoppers, worms, and moths [41].
3.2. Tannins
In the determination of the tannin content (Figure 3), the largest significant effect (p < 0.05) was observed at 140 days for the stressed jicama sample, reaching the highest value at this point (0.085 mg g−1 gallic acid). All other samples showed a much lower concentration for this metabolite (<0.04 mg g−1 gallic acid), while it only had an effect (p > 0.05) on the stressed sample.
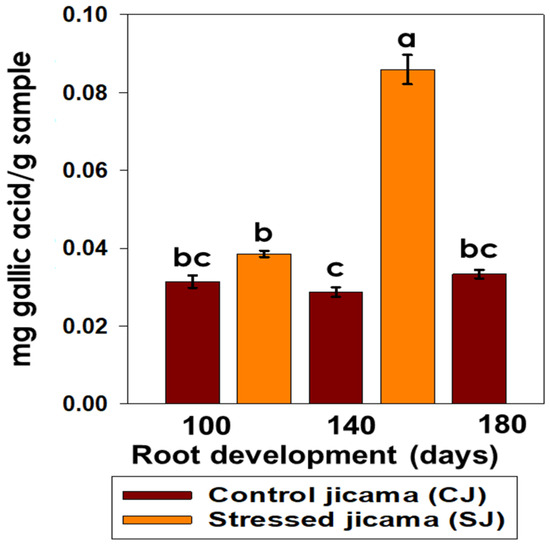
Figure 3.
Content of tannins (mg gallic acid/g sample) in control (brown) and stressed jicama (orange) in the three development periods. Results are the mean of at least four independent repetitions ± standard error. Different letters represent the significant difference (p ≤ 0.05).
Tannin buildup caused by stress may indicate that these components have additional functions in vegetative tissue. In this sense, Rubert-Nason and Lindroth [42] reported that in P. tremuloides, the leaf tannin content levels increase after injury and insect herbivory. Hence, the higher concentration of tannins observed in stressed jicama at 140 days’ development could be related to the generation of secondary metabolites as a defense mechanism against stress situations or against the attack of molds, bacteria, insects, and birds. Some reports have expressed that those plants use tannins as a source of amino acids, although their main function seems to be the defense of the plant against fungi, insects, and nematodes [43,44,45].
3.3. Flavonoids
In the determination of the flavonoid content, a significant difference (p < 0.05) was observed between the stressed and non-stressed materials, with the damaged jicama showing the highest values, and also the dependency of root development (Figure 4).
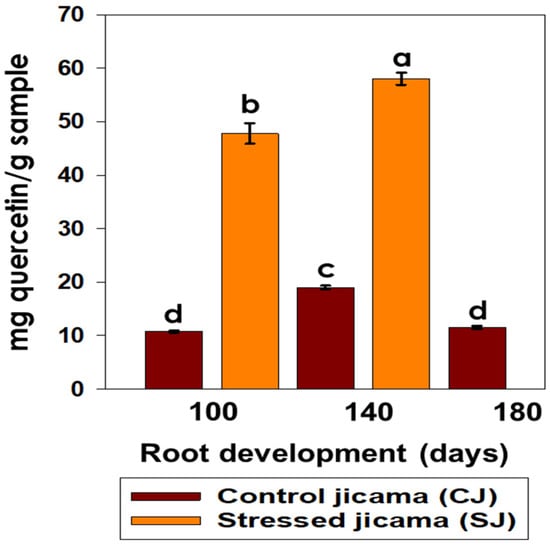
Figure 4.
Content of flavonoids (mg quercetin/g sample) in control (brown) and stressed jicama (orange) in the three development periods. Statistical analysis was carried out on all samples and is presented as the average of at least four repetitions ± standard error. Different letters represent the significant difference (p ≤ 0.05).
The sample that presented the highest flavonoid content was the stressed jicama at 140 days (58.06 mg g−1 quercetin), while the control jicama showed a lower content, observing a maximum value (19.015 mg g−1 quercetin) at 140 days of root development. These results coincided with those presented by Choi et al. [46] for six varieties of unstressed potato tubers (2.66 to 6.44 mg g−1) and also those by Perla et al. [47], who reported a low concentration of flavonoids in unstressed potato samples heated by different methods (raw, boiled, and baked).
The effect of stress conditions on the increase in flavonoid content could be related to the fact that these components play a key role in the stress response mechanisms in plants, when acting as enzyme inhibitors or precursors of toxic substances for pests [48]. In a previous study, the toxicity of the extracts of Acanthus montanus against corn weevil (Sitophilus zeamais) was proven, as it caused 80% mortality in adults after 24 h of treatment. The phytochemicals present in Acanthus montanus were alkaloids, saponins, tannins, and flavonoids [49].
3.4. Total Phenols
In the determination of phenolic content, the stress condition promoted a significant increase in the concentration of these components with respect to the control samples, which showed the opposite behavior (Figure 5). The stressed samples presented the highest total phenol concentration (p < 0.05) at 140 days of development, while in the control samples, the phenolic compounds remained invariable after 140 days of root development. This could be attributed to the biosynthesis of some components, such as phenylpropanoid and flavonoid, and the increase in the contents of caffeic acid and epicatechin, in accordance with what was reported by Liu et al. [21], where they mention that the total content of the phenolic compounds increased in the infested Citrus limon leaves as compared with control leaves. Furthermore, Mendoza [50] reported that the higher content of phenols may be due to the increase in the concentration of salicylic acid (SA), as a result of some biotic or abiotic stressor to which cells, organs, or plants are subjected. In the same context, it has been reported that abscisic acid (ABA) largely controls the abiotic stress responses, while defense against different biotic assailants is specified by the antagonism between the salicylic acid (SA) and jasmonic acid (JA)/ethylene signaling pathways [51]. ABA also plays important roles in many other physiological processes, such as seed dormancy, and delays its germination, the development of seeds, the promotion of stomatal closure, embryo morphogenesis, the synthesis of storage proteins and lipids, leaf senescence, and also defense against pathogens [52].
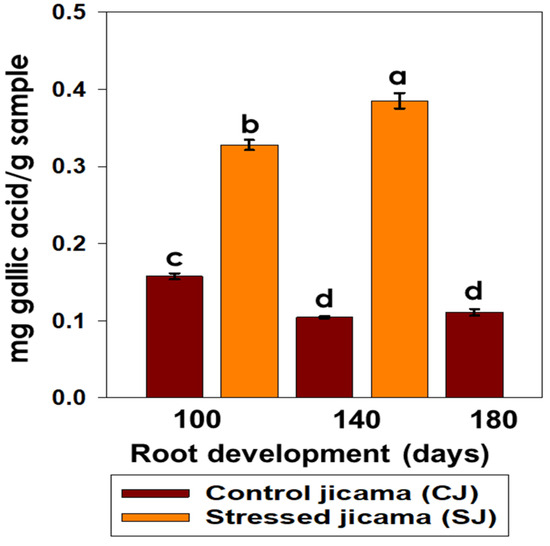
Figure 5.
Content of total phenols (mg gallic acid/g sample) in control (brown) and stressed jicama (orange) in the three development periods. Bars are the mean value of at least four independent repetitions ± standard error. Different letters represent the significant difference (p ≤ 0.05).
Despite the few investigations on the accumulation of SA during fruit development and its role in ripening [53], it is known that the endogenous concentration of its SA-free form is higher during fruit development, decreasing progressively towards the time of harvest [54].
3.5. DPPH Antioxidant Activity
As in the other cases, the stressed samples presented higher DPPH values than those of the control samples, ranging from 89.33% at 100 days to 68.45% at 140 days for the former, while the control varied from 68.67% to 43.80% at 100 and 180 days, respectively (Figure 6).
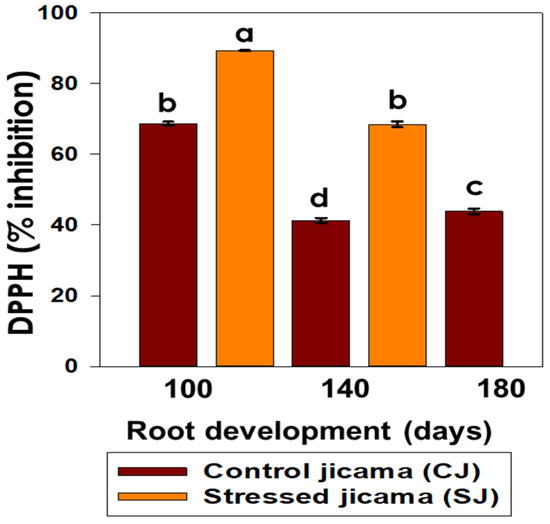
Figure 6.
Content of the percentage of inhibition by DPPH in control (brown) and stressed jicama (orange) in the three development periods. Bars are the mean value of at least 10 independent repetitions ± standard error. Different letters represent the significant difference (p ≤ 0.05).
The reported information established that the unstressed material had DPPH values ranging from 55.34% to 89.56%, referring to purple yam tuber [55], Terfezia truffles [56], and Pachyrhizus erosus [57]. No information, at least to our knowledge, has been reported regarding DPPH on stressed root tuber crops.
3.6. Determination of Secondary Metabolites by HPLC
The control and stressed jicama samples were analyzed using HPLC, looking for the presence of chlorogenic acid, ascorbic acid, protocatechuic acid, ferulic acid, pelargonidin, ρ-coumaric, quercetin, caffeic acid, catechin, myricetin, rutin, aloin, scopoletin, esculin, esculetin, and gallic acid. Of those mentioned compounds, catechin, quercetin, aloin, scopoletin, esculin, esculetin, and gallic acid were not found in any of the samples.
3.6.1. Phenolic Acids
A change in the concentration of phenolic acids was found in the two types of jicama roots (stress and control) during maturation, where only ferulic and caffeic acids were present in the control sample for all maturation stages (Figure 7). These metabolites observed opposite behaviors, with ferulic acid having the highest value at 100 days of root development, while caffeic acid showed its highest value at 180 days of development.
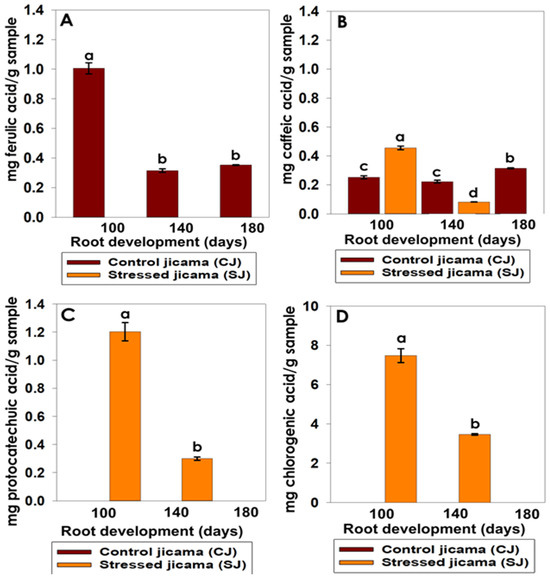
Figure 7.
Changes in phenolic acids analyzed using HPLC. (A) ferulic acid (mg ferulic acid/g sample), (B) caffeic acid (mg caffeic acid/g sample), (C) protocatechuic acid (mg protocatechuic acid/g sample), and (D) chlorogenic acid (mg chlorogenic acid/g sample), during the development stages in the control (brown) and stressed jicama (orange) samples. Statistical analysis was carried out on all samples and is presented as the average of at least 3 repetitions ± standard error. Different letters represent the significant difference (p ≤ 0.05).
We also observed that the stressed sample increased its caffeic acid level with respect to the control, reaching its highest concentration at 100 days of root development. Protocatechuic and chlorogenic acids were produced only under stress conditions, with the last one having the largest value (7.48 mg g−1).
It has been reported that caffeic and fumaric acids are involved in the shikimic acid pathway as precursors of complex compounds, such as coumarins, lignin, tannins, flavonoids, and isoflavonoids [58]. These metabolites have also been reported to have a significant impact on the immune response of S. litura larvae in tobacco, mainly as the concentration of caffeic acid increased [59]. It is also known that these components are found in the plant cell walls of different plant materials. Pacheco et al. [60] cited that they are present in jicama extracts, in the leaves [61] and roots of jicama, and in yacon tubers [62]. Some of these studies have mentioned that phenolic compounds increased the mortality of some larvae [63].
Considering these results, it is possible that the largest molecular weight phenolic acids, only present in the stressed sample (protocatechuic and chlorogenic acids), could be synthesized as response to the stress, via a more efficient biochemical pathway, instead of ρ-coumaric acid leading the production to flavonoids [64].
3.6.2. Flavonoids
The other class of secondary metabolites synthesized as a result of the development stages of stressed and unstressed jicama samples corresponds to flavonoids, specifically rutin, pelargonidin, and myricetin (Figure 8). From these data, it was observed that rutin, which is reported to have anti-inflammatory and anticancer properties [65], was the only metabolite present in the healthy crops, while pelargonidin and myricetin developed mainly in the stressed samples. In the jicama control samples, the rutin concentrations were 0.55, 0.31, and 0.4 mg g−1 at 100, 140, and 180 days, respectively, showing a significant difference between the samples at the different development stages, with 100 days being the highest concentration.
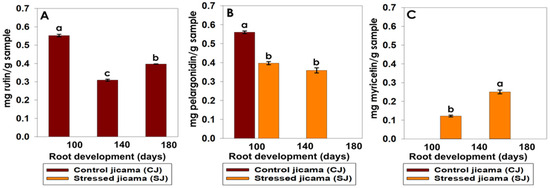
Figure 8.
Changes in flavonoids content by HPLC. (A) rutin (mg rutin/g sample), (B) pelargonidin (mg pelargonidin/g sample), and (C) myricetin (mg myricetin/g sample), in Pachyrhizus erosus L. as a result of development stages and stress conditions. Statistical analysis was carried out on all samples and is presented as the average of at least 3 repetitions ± standard error. Different letters represent the significant difference (p ≤ 0.05).
Flavonoids, such as rutin, apigenin, and luteolin, have been found in low concentrations in plants inoculated with N. aberrans, and this nematode could also induce modifications in phenylpropanoid metabolism [66].
Pelargonidin was found in both samples at 100 days, showing a significant difference between them; however, at 140 days it was found only in the jicama samples subjected to stress, without it being significantly different from that found at 100 days (Figure 7). Pelargonidin is reported to be an antioxidant, and is normally found in raspberries, strawberries, plums, and pomegranates [67], as well as in beans [68] and potatoes [60]. Anthocyanins are involved in secondary functions, such as survivor processes against pathogen attacks (fungi, viruses, insects, and nematodes), or as a response to stressful physical conditions (drought, salinity, temperature, and exposure to UV radiation) [69].
Finally, myricetin, a flavonoid with antioxidant properties that are very similar to quercetin and fisetin, was found at a concentration of 0.122 mg g−1 and 0.25 mg g−1 in jicama subjected to stress at 100 and 140 days, respectively, showing a significant difference between the periods and an increase according to the state of maturity (Figure 9). The presence of myricetin in other crops (mashua, melloco, onion, and lentils) under stress condition has been reported [60,70,71], citing a low concentration for all cases. Myricetin has also been shown to have a prominent capacity to counteract low-density lipoprotein (LDL) oxidation and the production of reactive oxygen species (ROS) [72].
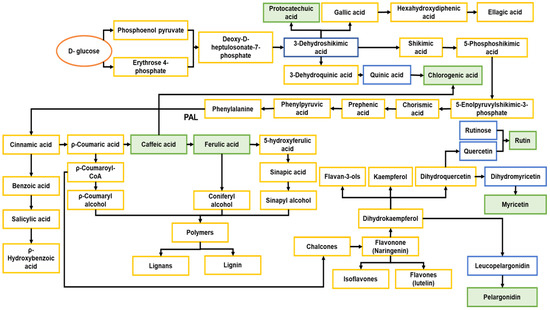
Figure 9.
Diagram of the metabolic pathways. Adapted from Dewick [73]. Orange: start of the metabolic pathway. Blue: precursors of the metabolites characterized in this study. Green: secondary metabolites detected in the control and stressed jicama samples. Yellow: all other compounds.
Many secondary metabolites are present in plants and provide a direct or indirect defense against predators or pests [13,24,73]. The chemical structures of some secondary metabolites are very similar, because they share intermediates derived from the same metabolic pathways [24], such as caffeic acid and ferulic acid, which are hydroxycinnamic acids, with caffeic acid being the precursor of ferulic acid [74] and a key intermediate in the biosynthesis of lignin [75]. In this sense, and based on our phenolic acid results, a shortcut in the metabolic pathway could be induced as a result of the biotic stress, directing to the formation of ρ-coumaric and caffeic acid, instead of caffeic acid and ferulic acid, and at the same time, promoting the formation of protocatechuic and chlorogenic acids, in a shorter pathway that could require a lower energy cost.
On the other hand, aromatic compounds, such as L-phenylalanine, L-tyrosine, and L-tryptophan, are derived from shikimic acid, an intermediate of the plant metabolic pathway. In the case of phenylalanine, it produces cinnamic acid, while tyrosine may produce 4-coumaric acid. All plants seem to have the ability to deaminate phenylalanine using the enzyme, phenylalanine ammonia-lyase (PAL). Cinnamic acids, as their coenzyme A esters, can also function as starting units for chain extension with malonyl-CoA units through polyketide synthases (PKSs), thus combining the elements of the shikimate and acetate pathways, resulting in flavonoids, classifying into chalcones, flavones, flavanones, anthocyanidins, and catechins as described in Figure 9. As in the case of phenolic acids, the production of flavonoids could change in the stress samples via a shorter biochemical pathway, leading to the formation of myricetin and pelargonidin, as less steps are required to produce these compounds (Figure 8). More studies are required to understand this behavior.
4. Conclusions
Jicama (Pachyrhizus erosus L.) is an herbaceous plant of the Fabaceae family that is usually consumed as a fresh vegetable and is known for its medicinal and nutritional properties. This crop is infected or infested by biotic stresses, with one such problem being white grub infestation. It has previously been published that resistance in plants can be increased by physiological and biochemical changes, having a significant role in the phenolic composition and bioactivity of these compounds, in particular its antioxidant properties, which have been proven to be beneficial in food and biological systems. Most phenolic compounds in food are naturally present in conjugated forms; in higher plants, low-molecular-weight phenols occur as glycosides or esters with sugars or related compounds. In plant cells, the antioxidant defense system and ROS accumulation uphold a steady-state balance. Antioxidants directly or indirectly scavenge ROS and/or control ROS production, helping in the protection of the plant. Plants have also adapted to use ROS as stress signal transduction molecules, and a unique footprint of ROS responsive genes is induced by each type of biotic and abiotic stress. Furthermore, ROS production is required for ABA-driven stomatal closure. This commonality between the biotic and abiotic stress-induced ROS production may contribute towards the positive effects of ABA, SA, and antioxidants on the early pathogen response.
In this study, the secondary metabolites found are related to the biotic stress to which the jicama samples were subjected, with the highest concentration of chlorogenic acid in these samples. A proposal on the changes in the secondary metabolite synthesis pathway was cited. The concentration of caffeic acid in the stressed samples was minimal, which is considered to be the reason why there was no production of ferulic acid in these samples, possibly by promoting the formation of chlorogenic acid. For the flavonoids (rutin, pelargonidin, and myricetin), these follow a longer route for their production, with the chalcones being the precursors. Rutin is the flavonoid with the highest content in this classification; however, it was only present in the control samples, while myricetin and pelargonidin were present only in the samples of the jicama subjected to stress. It is worth mentioning that these components are related by dihydrokaempferol. These results provide insights into the development of the secondary metabolites in jicama, Pachyrhizus erosus, under stress conditions, where a shorter metabolic route is suggested as a response to the stress.
Author Contributions
Conceptualization, V.C.-S., M.d.l.P.S.-C. and G.C.-D.; Data curation, V.C.-S.; Formal analysis, V.C.-S. and M.G.-V.; Investigation, V.C.-S.; Methodology, V.C.-S., J.H.A.-C., M.G.-V. and M.d.l.P.S.-C.; Project administration, G.C.-D.; Resources, J.H.A.-C., G.F.G.-L. and G.C.-D.; Software, M.G.-V., R.R.F.-R. and G.F.G.-L.; Supervision, M.d.l.P.S.-C. and G.C.-D.; Validation, V.C.-S. and G.C.-D.; Visualization, M.d.l.P.S.-C. and G.C.-D.; Writing—original draft, V.C.-S.; Writing—review and editing, M.d.l.P.S.-C., R.R.F.-R. and G.C.-D. All authors have read and agreed to the published version of the manuscript.
Funding
This research was funded by projects 20201695, 20210624, 20221471, and 20230985 from the Instituto Politécnico Nacional (IPN, Mexico), and 1668, 255741, and 189302 from CONAHCYT.
Data Availability Statement
The data presented in this study are available on request from the corresponding author.
Acknowledgments
Verónica Cuellar Sánchez thanks CONAHCYT and BEIFI-IPN for the scholarships provided.
Conflicts of Interest
The authors declare no conflicts of interest.
References
- Van Hoof, W.C.H.; Sorensen, M. Pachyrhizus erosus (L) Urbano. In Plant Resources of South-East Asia, a Selection; Westphal, E., Jansen, P.C.M., Eds.; Pudoc: Wageningen, The Netherlands, 1989; pp. 213–215. [Google Scholar]
- Barrera, V.; Tapia, R.; Monteros, A. Raíces y Tubérculos Andinos: Alternativas para la Conservación y uso Sostenible en el Ecuador; INIAP: Quito, Ecuador, 2004. [Google Scholar]
- Lomas Montesdeoca, A.E. Respuesta Al Uso de Jícama Como Tratamiento Coadyuvante en Riesgo y Diabetes Mellitus II. Licentiate Dissertation, Universidad Técnica del Norte, Ibarra, Ecuador, 2017. Available online: http://repositorio.utn.edu.ec/handle/123456789/7792 (accessed on 15 December 2020).
- Seminario, J.; Valderrama, M.; Manrique, I. El Yacón, Fundamentos para el Aprovechamiento de un Recurso Promisorio; Centro Internacional de la Papa (CIP), Universidad Nacional de Cajamarca, Agencia Suiza para el Desarrollo y la Cooperación: Lima, Perú, 2003. [Google Scholar]
- Villacrés, E.; Rubio, A.; Cuadrado, L.; Marcial, N.; Iñiguez, D. Estudio y Aprovechamiento de las Propiedades Funcionales de la Jícama. Proyecto PIC. 025; INAP: Quito, Ecuador, 2007. [Google Scholar]
- Leonella, n.G.V. Producción de Harina de Jícama (Smallanthus sonchifolius) para la Formulación de Galletas Enriquecida Con harina de Quinua (Chenopodium quinua willd). Ph. D. Dissertation, Facultad de Ciencias Agrarias, Universidad Agraria del Ecuador, Guayaquil, Ecuador, 2020. [Google Scholar]
- Duke, J.A. Handbook of Legumes of World Economic Importance; Plenum Press: New York, NY, USA; London, UK, 1981. [Google Scholar] [CrossRef]
- Schroeder, C.A. The jicama a root crop from Mexico. Proc. Trop. Region. J. Am. Soc. Hortic. Sci. 1968, 11, 65–71. [Google Scholar]
- Sorensen, M. Observationes on distribution, ecology, and cultivation of the tuber-bearing legume genus Pachyrhizus Rich. ex DC. Wagening. Agric. Univ. Pap. 1990, 90, 38. [Google Scholar]
- Cibrián, D. Manual para la Identificación y Manejo de Plagas en Plantaciones Forestales Comerciales; Comisión Nacional Forestal (CONAFOR); Universidad Autónoma Chapingo: Texcoco, Mexico, 2013; ISBN 978-607-12-0311-3. [Google Scholar]
- Becerra, L.J.M. Influencia del Daño de la Gallina Ciega Sobre la Incidencia de la Marchites por Fusarium Oxysporum (Nelson, 1970), en el Cultivo del Agave (Azul tequilana Weber). Master’s Dissertation, Universidad de Guadalajara. CUCBA, Guadalajara, Mexico, 2006. Available online: http://repositorio.cucba.udg.mx:8080/xmlui/handle/123456789/4561 (accessed on 20 February 2021).
- Huber, D.; Römheld, V.; Weinmann, M. Chapter 10 Relationship between Nutrition, Plant Diseases and Pests. In Marschner’s Mineral Nutrition of Higher Plants; Marschner, P., Ed.; Academic Press: Cambridge, MA, USA, 2012; pp. 283–298. [Google Scholar] [CrossRef]
- Pinto-Zevallos, D.M.; Pareja, M.; Ambrogi, B.G. Current knowledge and future research perspectives on cassava (Manihot esculenta Crantz) chemical defenses: An agroecological view. Phytochemistry 2016, 130, 10–21. [Google Scholar] [CrossRef] [PubMed]
- Pagare, S.; Bhatia, M.; Tripathi, N.; Pagare, S.; Bansal, Y.K. Secondary metabolites of plants and their role: Overview. Curr. Trends Biotechnol. Pharm. 2015, 9, 293–304. [Google Scholar]
- Lee, S.K.; Kader, A.A. Pre-harvest and post-harvest factors influencing vitamin C content of horticultural crops. Postharvest Biol. Technol. 2000, 20, 207–220. [Google Scholar] [CrossRef]
- Imeh, U.; Khokhar, S. Distribution of conjugated and free phenols in fruits: Antioxidant activity and cultivar variations. J. Agric. Food Chem. 2002, 50, 6301–6306. [Google Scholar] [CrossRef] [PubMed]
- Bellotti, A.C.; Smith, L.; Lapointe, S.L. Recent Advances in cassava pest management. Annu. Rev. Entomol. 1999, 44, 343–370. [Google Scholar] [CrossRef]
- FAO. Save and Grow: Cassava; Food and Agriculture Organization for United Nations: Rome, Italy, 2013. [Google Scholar]
- Simmonds, M.S. Flavonoid insect interactions: Recent advances in our knowledge. Phytochemistry 2003, 64, 21–30. [Google Scholar] [CrossRef] [PubMed]
- Hounsome, N.; Hounsome, B.; Tomos, D.; Edwards-Jones, G. Changes in antioxidant compounds in white cabbage during winter storage. Postharvest Biol. Technol. 2009, 52, 173–179. [Google Scholar] [CrossRef]
- Liu, Y.; Xue, A.; Wang, S.; Hao, Y.; Cui, M.; Liu, L.; Luo, L. Metabolic response of Citrus limon to Asian citrus psyllid infestation revealed by EESI-MS and HPLC. Anal. Biochem. 2020, 609, 113973. [Google Scholar] [CrossRef]
- Lombardo, S.; Pandino, G.; Mauromicale, G.; Knodler, M.; Carle, R.; Schieber, A. Influence of genotype, harvest time and plant part on polyphenolic composition of globe artichoke [Cynara cardunculus L. var. scolymus (L.) Fiori]. Food Chem. 2010, 119, 1175–1181. [Google Scholar] [CrossRef]
- Bourgaud, F.; Hehn, A.; Larbat, R.; Doerper, S.; Gontier, E.; Kellner, S.; Matern, U. Biosynthesis of coumarins in plants: A major pathway still to be unravelled for cytochrome P450 enzymes. Phytochem. Rev. 2006, 5, 293–308. [Google Scholar] [CrossRef]
- Yamane, H.; Konno, K.; Sabelis, M.; Takabayashi, J.; Sassa, T.; Oikawa, H. Chemical defense and toxins in plants. In Comprehensive Natural Products II: Chemistry and Biology; Mander, L., Liu, H.W., Eds.; Elsevier: Amsterdam, The Netherlands, 2010; pp. 339–385. [Google Scholar]
- Petrov, V.; Hille, J.; Mueller-Roeber, B.; Gechev, T.S. ROS-mediated abiotic stress-induced programmed cell death in plants. Front. Plant Sci. 2015, 6, 69. [Google Scholar] [CrossRef] [PubMed]
- Blagbrough, I.S.; Bayoumi, S.A.; Rowan, M.G.; Beeching, J.R. Cassava: An appraisal of its phytochemistry and its biotechnological prospects. Phytochemistry 2010, 71, 1940–1951. [Google Scholar] [CrossRef] [PubMed]
- Gao, X.Y.; Li, X.Y.; Zhang, C.Y.; Bai, C.Y. Scopoletin: A review of its pharmacology, pharmacokinetics, and toxicity. Front. Pharmacol. 2024, 15, 1268464. [Google Scholar] [CrossRef] [PubMed]
- Liang, C.; Ju, W.; Pei, S.; Tang, Y.; Xiao, Y. Pharmacological Activities and Synthesis of Esculetin and Its Derivatives: A Mini-Review. Molecules 2017, 22, 387. [Google Scholar] [CrossRef]
- González-Vázquez, M.; Calderón-Domínguez, G.; Mora-Escobedo, R.; Salgado-Cruz, M.P.; Arreguín-Centeno, J.H.; Monterrubio-López, R. Polysaccharides of nutritional interest in jicama (Pachyrhizus erosus) during root development. Food Sci. Nutr. 2022, 10, 1146–1158. [Google Scholar] [CrossRef]
- Hiai, S.; Oura, H.; Nakajima, T. Reaction of some sapogenins and saponins with vainillin and sulfuric acid. Planta Medica 1976, 29, 116–122. [Google Scholar] [CrossRef]
- Rosales-Castro, M.; González-Laredo, R.F.; Rocha-Guzmán, N.E.; Gallegos-Infante, J.A.; Peralta-Cruz, J.; Karchesy, J.J. Evaluación química y capacidad antioxidante de extractos polifenólicos de cortezas de Pinus cooperi, P. engelmannii, P. leiophylla y P. teocote. Madera Bosques 2009, 15, 87–105. [Google Scholar] [CrossRef][Green Version]
- Burns, R.E. Method for estimation of tannin in grain sorghum 1. J. Agron. 1971, 63, 511–512. [Google Scholar] [CrossRef]
- Gupta, C.; Verma, R. Visual estimation and spectrophotometric determination of tannin content and antioxidant activity of three common vegetables. Int. J. Pharm. Sci. Res. 2011, 2, 175–182. [Google Scholar]
- Cuellar Sánchez, V. Efecto del Método de Extracción Sobre el Perfil de Metabolitos y la Actividad Antirradical de Extractos de tejidos de Diferentes Variedades de Aguacate. Master’s Dissertation, Instituto Tecnológico de Veracruz (UNIDA), Veracruz, Mexico, 2018. Available online: https://rinacional.tecnm.mx/jspui/handle/TecNM/2508 (accessed on 20 October 2020).
- Mothibedi, K. A Study of Electrospun Nanofibers and Diatomaceous Earth Materials for the Extraction of Alkaloids, Flavonoids and Aromatic Amines in Various Matrices. Ph.D. Dissertation, Rhodes University, Grahamstown, South Africa, 2013. [Google Scholar]
- Szakiel, A.; Pączkowski, C.; Henry, M. Influence of environmental abiotic factors on the content of saponins in plants. Phytochem. Rev. 2011, 10, 471–491. [Google Scholar] [CrossRef]
- Guzmán, B.; L Cruz, D.; Alvarado, J.A.; Mollinedo, P. Cuantificación de saponinas en muestras de cañihua Chenopodiumpallidicaule aellen. Rev. Boliv. Química 2013, 30, 131–136. [Google Scholar]
- Uematsu, Y.; Hirata, K.; Saito, K.; Kudo, I. Spectrophotometric determination of saponin in Yucca extract used as food additive. J. AOAC Int. 2000, 83, 1451–1454. [Google Scholar] [CrossRef] [PubMed]
- Faizal, A.; Geelen, D. Saponins and their role in biological processes in plants. Phytochem. Rev. 2013, 12, 877–893. [Google Scholar] [CrossRef]
- Taylor, W.G.; Fields, P.G.; Asutherlande, D.H. Insecticidal components from field pea extracts: Soyasaponins and lysolecithins. J. Agric. Food Chem. 2004, 52, 7484–7490. [Google Scholar] [CrossRef] [PubMed]
- Singh, B.; Kaur, A. Control of insect pests in crop plants and stored food grains using plant saponins: A review. Lebensm.-Wiss. Technol. 2018, 87, 93–101. [Google Scholar] [CrossRef]
- Rubert-Nason, K.F.; Lindroth, R.L. Causes and consequences of condensed tannin variation in Populus: A Molecules to Ecosystems Perspective. Recent Adv. Polyphen. Res. 2021, 7, 69–112. [Google Scholar] [CrossRef]
- Centeno, P. Toxicants of Plant Origin; CRC Press: Boca Raton, FL, USA, 2002; Volume 2. [Google Scholar]
- Granados-Sánchez, D.; Ruíz-Puga, P.; Barrera-Escorcia, H. Ecología de la herbivoría. Revista Chapingo. Ser. Cienc. For. Ambiente. 2008, 14, 51–63. [Google Scholar]
- Martínez-Arias, C.; Macaya-Sanz, D.; Witzell, J.; Martín, J.A. Enhancement of Populus alba tolerance to Venturia tremulae upon inoculation with endophytes showing in vitro biocontrol Potential. Eur. J. Plant Pathol. 2019, 153, 1031–1042. [Google Scholar] [CrossRef]
- Choi, S.H.; Kozukue, N.; Kim, H.J.; Friedman, M. Analysis of protein amino acids, non-protein amino acids and metabolites, dietary protein, glucose, fructose, sucrose, phenolic, and flavonoid content and antioxidative properties of potato tubers, peels, and cortexes (pulps). J. Food Compos. Anal. 2016, 50, 77–87. [Google Scholar] [CrossRef]
- Perla, V.; Holm, D.G.; Jayanty, S.S. Effects of cooking methods on polyphenols, pigments and antioxidant activity in potato tubers. LWT-Food Sci. Technol. 2012, 45, 161–171. [Google Scholar] [CrossRef]
- Salunke, B.K.; Kotkar, H.M.; Mendki, P.S.; Upasani, S.M.; Maheshwari, V.L. Efficacy of flavonoids in controlling Callosobruchus chinensis (L.) (Coleoptera: Bruchidae), a post-harvest pest of grain legumes. Crop Prot. 2005, 24, 888–893. [Google Scholar] [CrossRef]
- Ileke, K.D.; Idoko, J.E.; Ojo, D.O.; Adesina, B.C. Evaluation of botanical powders and extracts from Nigerian plants as protectants of maize grains against maize weevil, Sitophilus zeamais (Motschulsky) [Coleoptera: Curculionidae]. Biocatal. Agric. Biotechnol. 2020, 27, 101702. [Google Scholar] [CrossRef] [PubMed]
- Mendoza, A.B. Ecofisiología y Bioquímica del Estrés en Plantas; Universidad Autónoma Agraria Antonio Narro, Departamento de Horticultura: Saltillo, Mexico, 2002; p. 287. ISBN 968-844-042-6. [Google Scholar]
- Atkinson, N.J.; Urwin, P.E. The interaction of plant biotic and abiotic stresses: From genes to the field. J. Exp. Bot. 2012, 63, 3523–3543. [Google Scholar] [CrossRef]
- Tuteja, N. Abscisic acid and abiotic stress signaling. Plant Signal. Behav. 2007, 2, 135–138. [Google Scholar] [CrossRef]
- Davies, C.; Böttcher, C. Other hormonal signals during ripening. In Fruit Ripening: Physiology, Signalling and Genomics; En, P., Nath, M., Bouzayen, A.K., Mattoo, J.C., Pech, Eds.; CABI: Oxfordshire, UK, 2014; pp. 202–216. [Google Scholar] [CrossRef]
- Pérez-Llorca, M.; Muñoz, P.; Müller, M.; Munné-Bosch, S. Biosynthesis, Metabolism and Function of Auxin, Salicylic Acid and Melatonin in Climacteric and Non-climacteric Fruits. Front. Plant Sci. 2019, 10, 136. [Google Scholar] [CrossRef]
- Zhang, J.; Tian, H.; Zhan, P.; Du, F.; Zong, A.; Xu, T. Isolation and identification of phenolic compounds in Chinese purple yam and evaluation of antioxidant activity. LWT-Food Sci. Technol. 2018, 96, 161–165. [Google Scholar] [CrossRef]
- Tejedor-Calvo, E.; Amara, K.; Reis, F.S.; Barros, L.; Martins, A.; Calhelha, R.C.; Venturini, M.E.; Blanco, D.; Redondo, D.; Marco, P.; et al. Chemical composition and evaluation of antioxidant, antimicrobial and antiproliferative activities of Tuber and Terfezia truffles. Int. Food Res. J. 2021, 140, 110071. [Google Scholar] [CrossRef] [PubMed]
- Bhanja, A.; Paikra, S.K.; Sutar, P.P.; Mishra, M. Characterization and identification of inulin from Pachyrhizus erosus and evaluation of its antioxidant and in-vitro prebiotic efficacy. J. Food Sci. Technol. 2023, 60, 328–339. [Google Scholar] [CrossRef]
- García, A.Á.; Carril, E.P.U. Metabolismo secundario de plantas. Reduca 2011, 2, 119–145. [Google Scholar]
- Punia, A.; Singh, V.; Thakur, A.; Chauhan, N.S. Impact of caffeic acid on growth, development and biochemical physiology of insect pest, Spodoptera litura (Fabricius). Heliyon 2023, 9, e14593. [Google Scholar] [CrossRef] [PubMed]
- Pacheco, M.T.; Escribano-Bailón, M.T.; Moreno, F.J.; Villamiel, M.; Dueñas, M. Determination by HPLC-DAD-ESI/MSn of phenolic compounds in Andean tubers grown in Ecuador. J. Food Compos. Anal. 2019, 84, 103258. [Google Scholar] [CrossRef]
- Simonovska, B.; Vovk, I.; Andrenšek, S.; Valentová, K.; Ulrichová, J. Investigation of phenolic acids in yacon (Smallanthus sonchifolius) leaves and tubers. J. Chromatogr. A 2003, 1016, 89–98. [Google Scholar] [CrossRef]
- Habib, N.C.; Serra-Barcellona, C.; Honoré, S.M.; Genta, S.B.; Sánchez, S.S. Yacon roots (Smallanthus sonchifolius) improve oxidative stress in diabetic rats. Pharm. Biol. 2015, 53, 1183–1193. [Google Scholar] [CrossRef] [PubMed]
- Bhattacharya, A.K.; Chenchaiah, K.C. Seed coat phenolic compounds of Cajanus cajan as chemical barrier in formulation of artificial diet of Spodoptera litura (F.). Ann. Plant Sci. 2007, 15, 92–96. [Google Scholar]
- Mandal, S.M.; Chakraborty, D.; Dey, S. Phenolic acids act as signaling molecules in plant-microbe symbioses. Plant Signal. Behav. 2010, 5, 359–368. [Google Scholar] [CrossRef] [PubMed]
- Chua, L.S. A review on plant-based rutin extraction methods and its pharmacological activities. J. Ethnopharmacol. 2013, 150, 805–817. [Google Scholar] [CrossRef]
- Martínez, N.L.; Trujillo, J.P.F.; Biesaga, M.; Mejía, E.Z. Modificaciones en el metabolismo fenilpropanoide inducido por el nematodo falso agallador Nacobbus aberrans en chile CM334. In Proceedings of the 6th Workshop on Agri-Food Research. WIA, Cartagena, Spain. 8–9 May 2017; Universidad Politécnica de Cartagena: Cartagena, Spain, 2018; Volume 17, pp. 39–42. [Google Scholar] [CrossRef]
- de Oliveira Schmidt, H.; Rockett, F.C.; Klen, A.V.B.; Schmidt, L.; Rodrigues, E.; Tischer, B.; Rossini, A.P.; de Oliveira, R.V.; Lima, S.V.; Hickman, F.S.; et al. New insights into the phenolic compounds and antioxidant capacity of feijoa and cherry fruits cultivated in Brazil. Int. Food Res. J. 2020, 136, 109564. [Google Scholar] [CrossRef]
- Han, K.H.; Kitano-Okada, T.; Seo, J.M.; Kim, S.J.; Sasaki, K.; Shimada, K.I.; Fukushima, M. Characterisation of anthocyanins and proanthocyanidins of adzuki bean extracts and their antioxidant activity. J. Funct. Foods 2015, 14, 692–701. [Google Scholar] [CrossRef]
- Thakur, M.; Bhattacharya, S.; Khosla, P.K.; Puri, S. Improving production of plant secondary metabolites through biotic and abiotic elicitation. J. Appl. Res. Med. Aromat. Plants 2019, 12, 1–12. [Google Scholar] [CrossRef]
- Ren, H.; Endo, H.; Hayashi, T. Antioxidative and antimutagenic activities and polyphenol content of pesticide-free and organically cultivated green vegetables using water-soluble chitosan as a soil modifier and leaf surface spray. J. Sci. Food Agric. 2001, 81, 1426–1432. [Google Scholar] [CrossRef]
- Dueñas, M.; Hernandez, T.; Estrella, I. Changes in the content of bioactive polyphenolic compounds of lentils by the action of exogenous enzymes. Effect on their antioxidant activity. Food Chem. 2007, 101, 90–97. [Google Scholar] [CrossRef]
- Bertin, R.; Chen, Z.; Marin, R.; Donati, M.; Feltrinelli, A.; Montopoli, M.; Zambon, S.; Manzato, E.; Froldi, G. Activity of myricetin and other plant-derived polyhydroxyl compounds in human LDL and human vascular endothelial cells against oxidative stress. Biomed. Pharmacother. 2016, 82, 472–478. [Google Scholar] [CrossRef] [PubMed]
- Dewick, P.M. Medicinal Natural Products: A Biosynthetic Approach, 3rd ed.; Wiley: Chichester, UK, 2009. [Google Scholar]
- Benoit, I.; Asther, M.; Bourne, Y.; Navarro, D.; Canaan, S.; Lesage-Meessen, L.; Herwijer, M.; Coutinho, P.M.; Asther, M.; Record, E. Gene overexpression and biochemical characterization of the biotechnologically relevant chlorogenic acid hydrolase from Aspergillus niger. Appl. Environ. Microbiol. 2007, 73, 5624–5632. [Google Scholar] [CrossRef]
- Boerjan, W.; Ralph, J.; Baucher, M. Lignin biosynthesis. Annu. Rev. Plant Biol. 2003, 54, 519–546. [Google Scholar] [CrossRef]
Disclaimer/Publisher’s Note: The statements, opinions and data contained in all publications are solely those of the individual author(s) and contributor(s) and not of MDPI and/or the editor(s). MDPI and/or the editor(s) disclaim responsibility for any injury to people or property resulting from any ideas, methods, instructions or products referred to in the content. |
© 2024 by the authors. Licensee MDPI, Basel, Switzerland. This article is an open access article distributed under the terms and conditions of the Creative Commons Attribution (CC BY) license (https://creativecommons.org/licenses/by/4.0/).