Article

Genome-Wide Analysis of the NBS-LRR Gene Family and SSR Molecular Markers Development in Solanaceae

1
Key Laboratory of Horticultural Crop Germplasm Innovation and Utilization (Co-Construction by Ministry and Province), Institute of Horticulture, Anhui Academy of Agricultural Sciences, Hefei 230001, China
2
Institute of Vegetables, Anhui Academy of Agricultural Sciences, Hefei 230001, China
3
School of Life Sciences, North China University of Science and Technology, Tangshan 063210, China
4
College of Horticulture, Nanjing Agricultural University, Nanjing 210095, China
5
Department of Food Science, Aarhus University, 8200 Aarhus, Denmark
*
Authors to whom correspondence should be addressed.
These authors contributed equally to this work.
Horticulturae 2024, 10(12), 1293; https://doi.org/10.3390/horticulturae10121293
Submission received: 28 October 2024 / Revised: 28 November 2024 / Accepted: 3 December 2024 / Published: 4 December 2024
(This article belongs to the Special Issue A Decade of Research on Vegetable Crops: From Omics to Biotechnology)

Abstract

:
The Solanaceae family occupies a significant position, and the study of resistance genes within this family is extremely valuable. Therefore, our goal is to examine disease resistance genes based on the high-quality representative genomes of Solanaceae crops, and to develop corresponding Simple Sequence Repeat (SSR) molecular markers. Among nine representative Solanaceae species, we identified 819 NBS-LRR genes, which were further divided into 583 CC-NBS-LRR (CNL), 54 RPW8-NBS-LRR (RNL), and 182 TIR-NBS-LRR (TNL) genes. Whole genome duplication (WGD) has played a very important role in the expansion of NBS-LRR genes in Solanaceae crops. Gene structure analysis showed the striking similarity in the conserved motifs of NBS-LRR genes, which suggests a common ancestral origin, followed by evolutionary differentiation and amplification. Gene clustering and events like rearrangement within the NBS-LRR family contribute to their scattered chromosomal distribution. Our findings reveal that the majority of NBS-LRR family genes across all examined species predominantly localize to chromosomal termini. The analysis indicates the significant impact of the most recent whole genome triplication (WGT) on the NBS-LRR family genes. Moreover, we constructed Protein–Protein Interaction (PPI) networks for all 819 NBS-LRR genes, identifying 3820 potential PPI pairs. Notably, 97 genes displayed clear interactive relationships, highlighting their potential role in disease resistance processes. A total of 22,226 SSRs were detected from all genes of nine Solanaceae species. Among these SSRs, we screened 43 NBS-LRR-associated SSRs. Our study lays the foundation for further exploration into SSR development and genetic mapping related to disease resistance in Solanaceae species.

1. Introduction

The Solanaceae family, part of the Asterid suborder, boasts an impressive diversity, with approximately 90 genera and between 3000 and 4000 species [1]. It plays a pivotal role in agriculture and commerce, offering a treasure trove of vegetables, crops, and ornamentals with substantial economic and nutritional value. Solanaceae plants exhibit remarkable adaptability, thriving in diverse climates from arid deserts to lush tropical rainforests, with a pronounced presence and variety in South America [2,3,4]. Based on their importance in economic, medicinal, genomic research, biosynthesis, plant domestication, phylogenetics, stress resistance, and genetic breeding studies, we selected nine Solanaceae species for bioinformatic analysis. Among them, Atropa belladonna (A. belladonna) [5], Datura stramonium (D. stramonium) [6], and Nicotiana tabacum (N. tabacum) [7,8] contain a variety of alkaloids with significant pharmacological effects. Solanum lycopersicum (S. lycopersicum) [9,10], Capsicum annuum (C. annuum) [11,12], and Solanum melongena (S. melongena) [13,14] are among the most valuable vegetable crops globally. Solanum macrocarpon (S. macrocarpon) [15] possesses antioxidant and anti-inflammatory effects. Solanum pennellii (S. pennellii) [16] exhibits strong salt tolerance, drought resistance, and heat tolerance, which are crucial for enhancing adaptability and stability. Solanum pimpinellifolium (S. pimpinellifolium) [17] harbors numerous genes that confer resistance to biotic and abiotic stresses, such as resistance to gray leaf spot and Fusarium wilt. The comparative genomics studies reveal a high degree of genome conservation among Solanaceae species [18]. This insight paves the way for the further exploration and utilization of their genetic potential in agricultural advancements.
Resistance (R) genes are the guardians of the plant kingdom, encoding specialized receptors that selectively bind to ligands from pathogen avirulence genes [19,20]. A comprehensive survey revealed that over 300 distinct R genes have been identified and cloned across the plant kingdom, with a significant majority—exceeding 60%—belonging to the NBS-LRR gene family [21,22]. These genes are characterized by their encoding of proteins with several common structural domains.
The central nucleotide-binding site (NBS) domain, which is the most conserved region among the family [23,24], plays a crucial role in the innate immune system of plants, capable of recognizing effector proteins known as avirulence (Avr) proteins from pathogens, thereby triggering an immune response [25]. The C-terminal leucine-rich repeat (LRR) domain, known for its role in pathogen recognition, is an essential component of plant innate immune receptors, capable of recognizing pathogen-associated molecular patterns (PAMPs) and pathogen effectors. NBS-LRR proteins, through their LRR domain, recognize the effector products of avirulence genes from pathogens, thereby activating the immune response [25]. The N-terminal domain, which may be homologous to the Toll/interleukin-1 receptor (TIR), plays a role in signal transduction; it is involved in the signal transduction process initiated after the recognition of effector proteins delivered by plant pathogens, and may participate in effector-triggered immunity (ETI) [26]. The coiled coil (CC) domain is associated with the recognition of toxic proteins secreted by pathogens, thereby activating the plant’s immune response [27,28], or alternatively, the resistance to the powdery mildew 8 (RPW8) domain, which is associated with specific resistance mechanisms. The proteins associated with the RPW8 domain can enhance the resistance of plants to a variety of pathogens [29]. The NBS-LRR genes, with their diverse domains, represent the frontline of defense in the plant’s immune system, providing a sophisticated means of detecting and responding to a wide array of pathogens [30].
Phylogenetic analysis delineates NBS-LRR genes in plants into two primary categories, based on the presence or absence of a TIR domain at the N-terminus of the encoded proteins. The first category, TIR-NBS-LRR (TNL) types, features a TIR domain and is primarily involved in the recognition of specific pathogens. In contrast, non-TIR-NBS-LRR (non-TNL) types lack a TIR domain, and are further divided into two types: CC-NBS-LRR (CNL), which contain a CC domain at the N-terminus, and RPW8-NBS-LRR (RNL), characterized by the presence of an RPW8 domain [31]. The NB-ARC domain, highly conserved in NBS-LRR proteins [32], serves as a crucial sequence foundation for cloning resistance gene analogues (RGAs) across various crops.
Molecular marker development technology is an indispensable tool in germplasm resource identification and molecular marker-assisted breeding. Simple Sequence Repeat (SSR) markers stand out for their abundant polymorphism, excellent repeatability, ease of detection, co-dominant expression, and ubiquitous genomic distribution [33,34]. SSR technology has become a staple in genetic mapping, variety fingerprint profiling, purity assessment, and trait-specific molecular marker selection [35]. SSR marker technology plays a significant role in various fields such as genetic research, variety identification, population genetic structure analysis, gene map construction, and molecular-assisted breeding. Particularly, in uncovering genetic connections between populations, SSR marker technology can provide crucial information [36]. Moreover, it demonstrates great potential in revealing genetic distances and kinship relationships among different varieties, offering substantial assistance in breeding work and genetic improvement [37]. Additionally, SSR marker technology also plays an important role in the management and utilization of germplasm resources [38].
The advent of high-throughput sequencing has accelerated the completion of high-quality genome sequencing projects for Solanaceae species. Research on the disease resistance genes of Solanaceae species helps us to understand how plants recognize and respond to pathogens, which is crucial for developing new plant protection strategies [39]. Additionally, the study of disease resistance genes in Solanaceae plants aids in revealing the genetic basis of these genes and their distribution across different Solanaceae species, which is significant for understanding plant resistance mechanisms against pathogens and developing new resistant varieties [40]. Therefore, we have employed bioinformatic methods to identify NBS-LRR genes in the genomes of nine representative Solanaceae species, revealing key genes associated with plant resistance and studying their characteristics. Additionally, we systematically mapped SSR loci within Solanaceae genomes. These endeavors provide a solid foundation for genetic diversity analysis, high-density genetic map construction, the mapping and cloning of significant genes, and molecular marker-assisted breeding of Solanaceae crops.

2. Materials and Methods

2.1. Genome and Transcriptome Data Acquisition of Solanaceae Species

The genomic data of A. belladonna [41], D. stramonium [13], and S. macrocarpon [13] were downloaded from the National Genomics Data Center (NGDC, https://ngdc.cncb.ac.cn/ (accessed on 10 May 2024)) database. The genomic data of C. annuum were downloaded from Plantgarden [42]. The genomic data of N. tabacum [7], S. lycopersicum, and S. pimpinellifolium [43] were downloaded from the Sol Genomics Network and SoIR database [44]. The genomic data of S. melongena [45] were downloaded from the Eggplant Genome Database, and the genomic data of S. pennellii [46] were downloaded from the European Bioinformatics Institute (EMBL-EBI, https://www.ebi.ac.uk/ (accessed on 10 May 2024)). Then, we used Perl scripts to remove genes with alternative splicing and incomplete structures for subsequent analysis, according to the previous reports [47,48].
Transcriptomic data of Solanaceae species were downloaded from the National Center for Biotechnology Information (NCBI, https://www.ncbi.nlm.nih.gov/ (accessed on 12 June 2024)) [49].

2.2. Construction of Solanaceae Species Phylogenetic Trees and Identification of Gene Duplication Types

We constructed a species tree for these 9 species using the OrthoFinder (v2.5.4) [50] software on their whole-genome data. We used the DupGen_finder (v1.0) program to analyze the classification of gene duplication types, including whole genome duplications (WGD), tandem duplications (TD), proximal duplications (PD), transposon related duplications (TRD), and dispersed segmental duplications (DSD), according to the previous reports [51,52].

2.3. Identification of NBS-LRR Family Genes and Distribution on Chromosomes

We utilized the RGAugury pipeline [53] to predict RGAs in the whole genomes of 9 Solanaceae species, and after screening, we obtained genes of the NBS-LRR family. We used scripts to process the genome location information files of Solanaceae species and then used TBtools [54] software (v2.0) to graphically display the distribution of NBS-LRR family genes on the chromosomes. We performed the Ka/Ks calculations for the NBS-LRR family genes using the WGDI [55] software (v1.0), with the following parameters: -icl and -ks. Finally, we used Python scripts to plot the graphs.

2.4. Developmental Tree Construction and Domain Analysis of the NBS-LRR Genes

We used the MAFFT [56] software (v7.520) for the sequence alignment of the NBS-LRR family genes and then constructed a phylogenetic tree using FastTree (v2.1) [57]. We employed the Multiple Expectation Maximization for Motif Elicitation (MEME, Version 5.5.0) [58] to analyze the conserved motifs in the NBS-LRR proteins of Solanaceae species. The settings included a motif number of 10, with a minimum width of 6 and a maximum width of 50. We utilized the iTOL [59] software (v7.0) for the visualization of the evolutionary tree of the NBS-LRR family genes along with the conserved motifs.

2.5. Prediction of NBS-LRR Family Protein Interactions

We utilized the online STRING database (https://string-db.org/ (accessed on 16 July 2024)) [60] to complete the prediction of Protein–Protein Interaction (PPI) networks for the NBS-LRR family in Solanaceae species. After constructing the network map, we beautified the graphical representation using Cytoscape [61] software (v3.10.3) and calculated using the Betweenness Centrality parameter.

2.6. Analysis of the Expression Patterns

The transcriptome data of Solanaceae were obtained from the Sequence Read Archive (SRA) database of the NCBI. FastQC software (v0.12.1) was used to evaluate the quality of the original sequencing data, and Trimmomatic software (v0.40) was used to remove the joints and filter low-quality reads to obtain clean data. HISAT2 [62] software (v2.2.1) was used to compare the genome and transcriptome data and feature counts. The R package (v4.3.3) was used for quantitative analysis, and TBtools (v2.0) was used to construct an expression heatmap.

2.7. Development of SSR Molecular Markers

For the development and analysis of SSR molecular markers in the whole genome of Solanaceae species, we used the MISA (http://pgrc.ipk-gatersleben.de/misa/Misa.html (accessed on 25 July 2024)) [63] tool to analyze the whole-genome sequences. The search criteria were as follows: (1) The minimum repeat numbers for mononucleotide, dinucleotide, trinucleotide, tetranucleotide, pentanucleotide, and hexanucleotide motifs were set to 10, 6, 5, 5, 5, and 5, respectively. (2) The minimum distance between two SSR sites was 100 base pairs. We then screened for SSR molecular markers within the NBS-LRR family genes of Solanaceae plants from the whole genome, observing the distribution of these genes on the chromosomes and their structural information.

3. Results

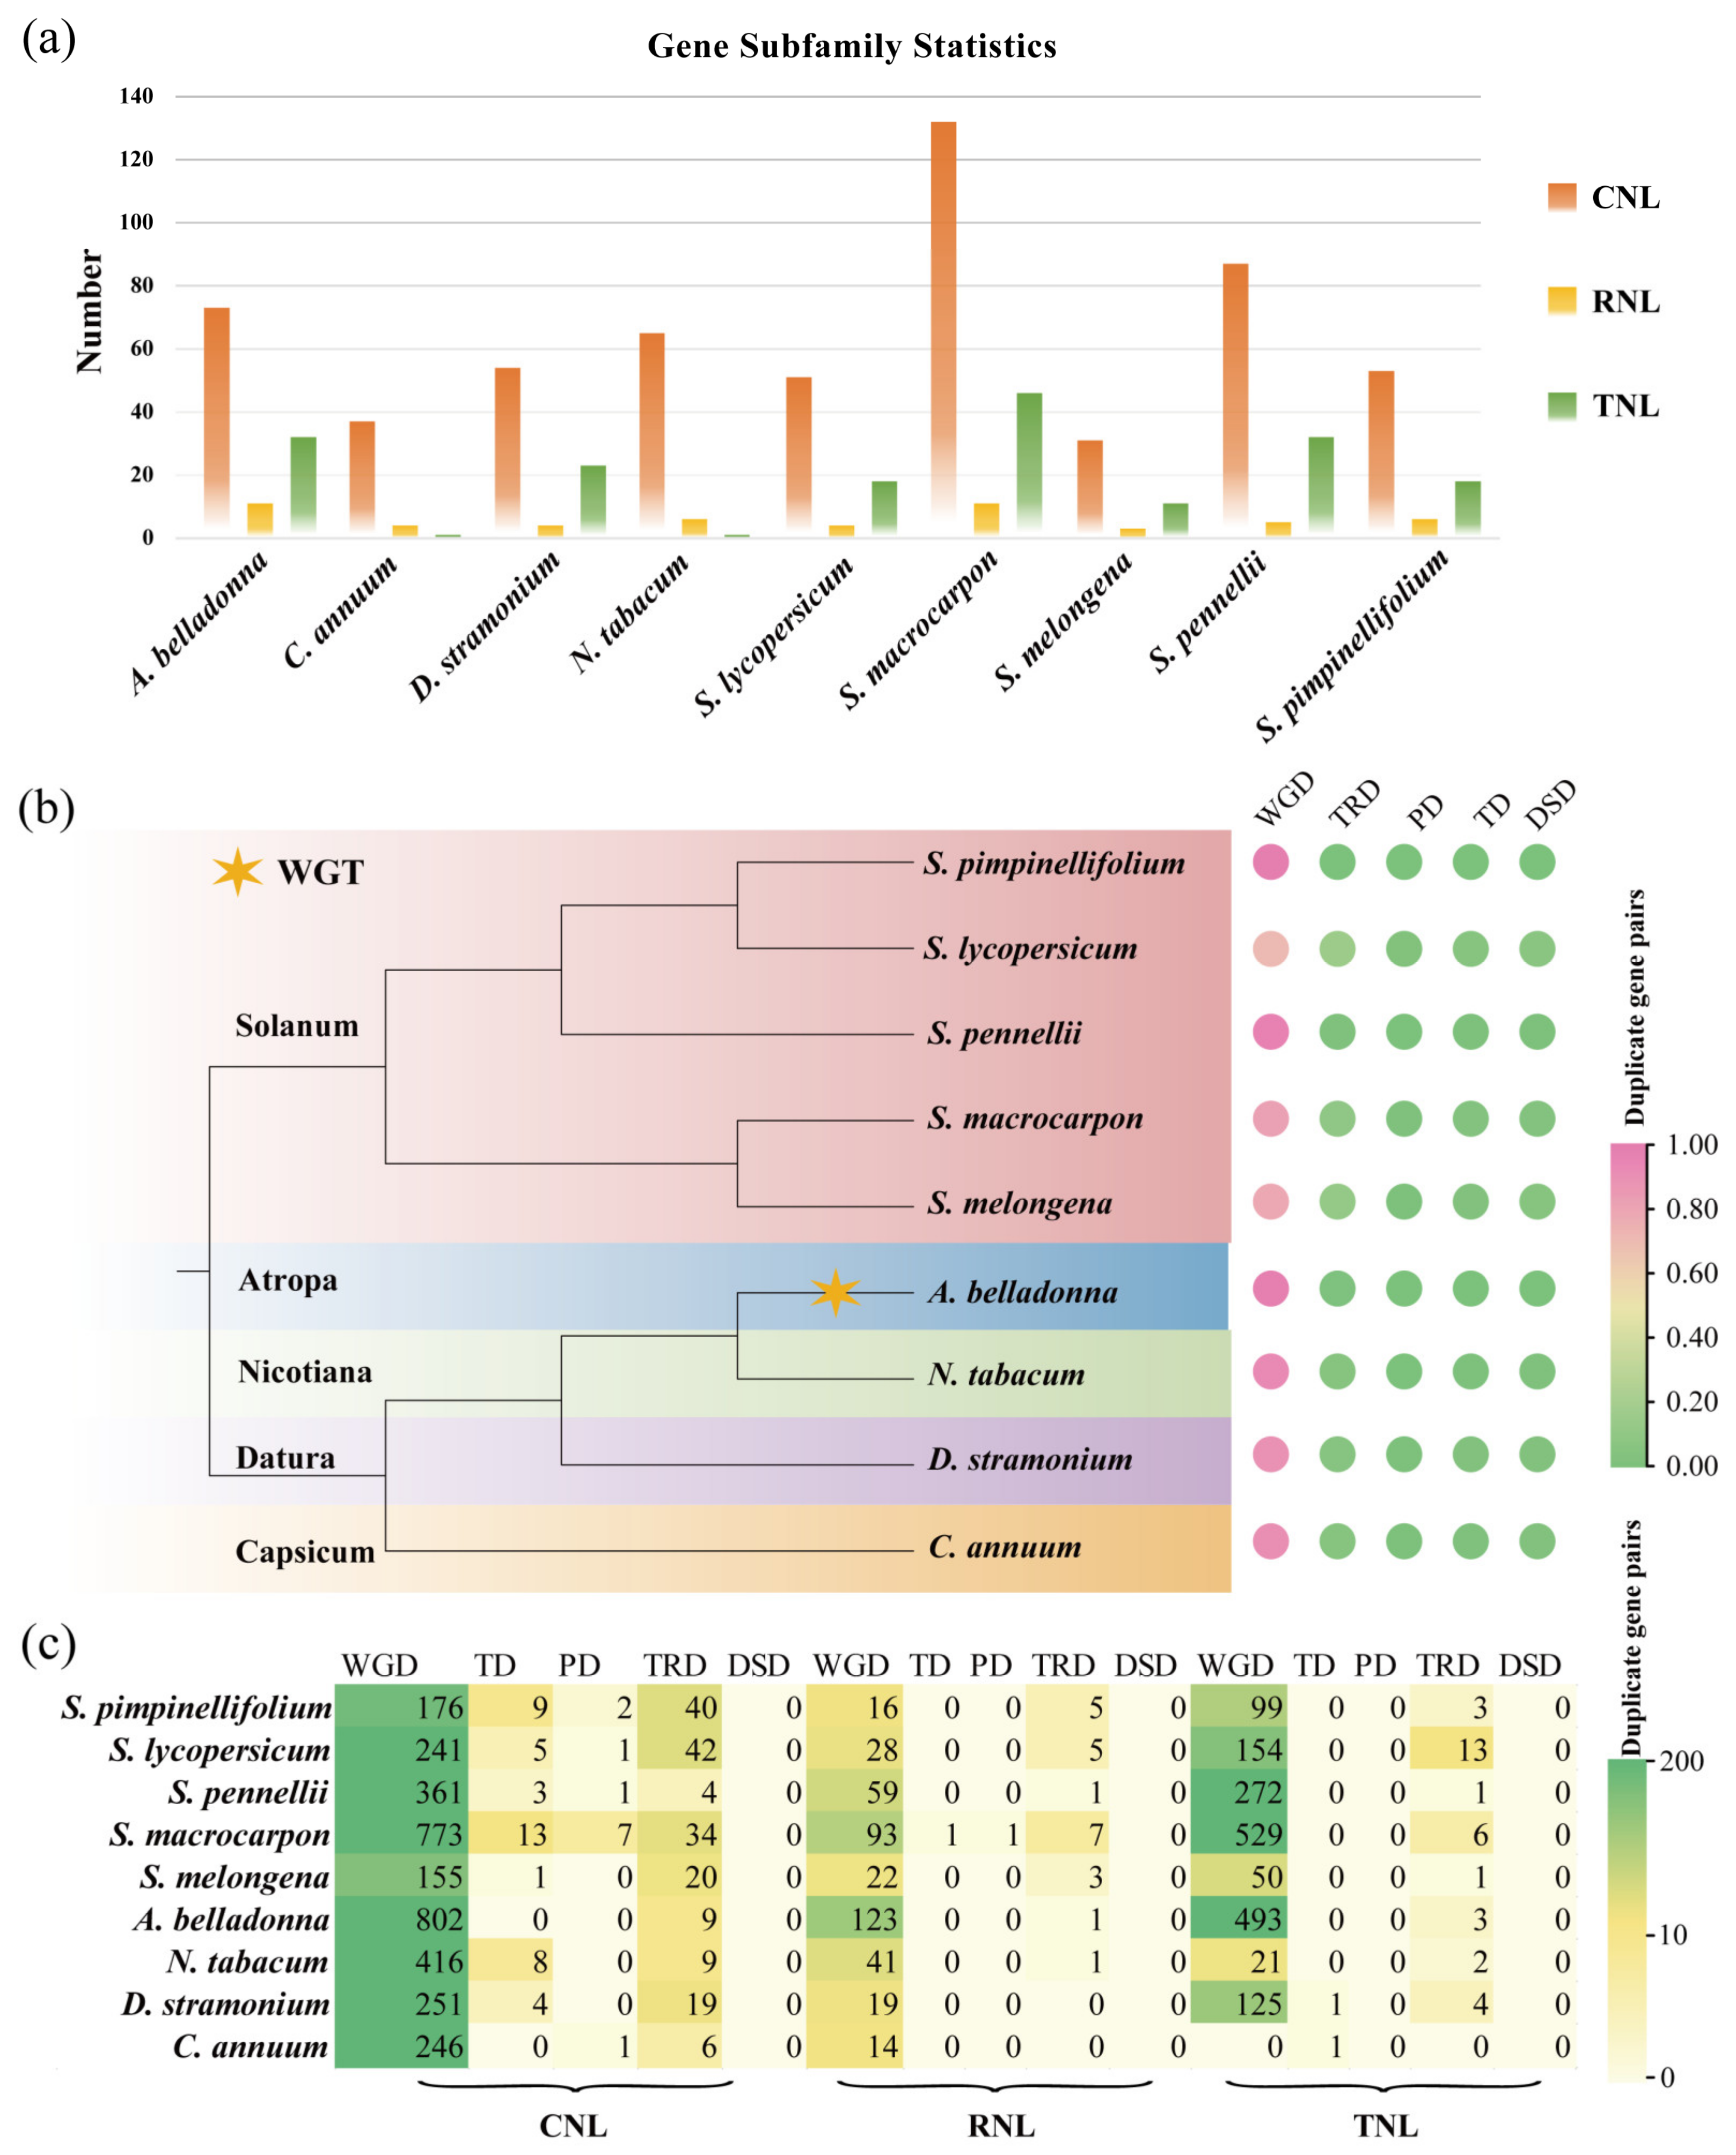
3.1. Identification, Classification, Gene Duplication Analysis of NBS-LRR Family Genes in Solanaceae

To explore the gene duplication of the whole genome, our analysis involved a screening of the genomic data of nine Solanaceae species. After excluding genes with alternative splicing and those with an incomplete structure, we constructed a phylogenetic tree of nine Solanaceae species (Figure 1b). Our findings showed that in all Solanaceae species, the number of the WGD type of duplication genes was significantly higher than the other four types of duplication, including TRD, PD, TD, and DSD (Figure 1b, Table S3). For the NBS-LRR gene, all three subfamilies of genes exhibited a similar phenomenon, that is, the number of WGD type was significantly higher than the other four types of duplications (Figure 1c, Table S3). This phenomenon may be due to the fact that all Solanaceae species have witnessed two notable WGT events. The older WGT event is shared with grapes and most of the Asteraceae family (γ-WGT), dating back to approximately 115–130 million years ago (Mya) [64]. A more recent and Solanaceae-specific WGT event occurred around 45.37–51.28 Mya [65]. Notably, A. belladonna experienced an additional WGT event approximately 0.125–0.130 Mya [41].
We have identified a total of 819 NBS-LRR family genes from nine chromosome-level Solanaceae species, including A. belladonna (73 CNL, 11 RNL, 32 TNL), C. annuum (37 CNL, 4 RNL, 1 TNL), D. stramonium (54 CNL, 4 RNL, 23 TNL), N. tabacum (65 CNL, 6 RNL, 1 TNL), S. lycopersicum (51 CNL, 4 RNL, 18 TNL), S. macrocarpon (132 CNL, 11 RNL, 46 TNL), S. melongena (31 CNL, 3 RNL, 11 TNL), S. pennellii (87 CNL, 5 RNL, 32 TNL), and S. pimpinellifolium (53 CNL, 6 RNL, 18 TNL) (Figure 1a, Table S1). All the NBS-LRR family genes were further divided into three subfamilies, including 583 CNL, 54 RNL, and 182 TNL genes (Figure 1a, Table S2). We have observed that S. macrocarpon, S. pennellii, and A. belladonna possess a higher number of NBS-LRR genes compared to other Solanaceae species. Apart from A. belladonna, which has undergone a WGT event, the other two species exhibit a significant amount of WGD type of duplication. This suggests that both WGT and WGD events may have contributed to the expansion and diversification of the NBS-LRR family.

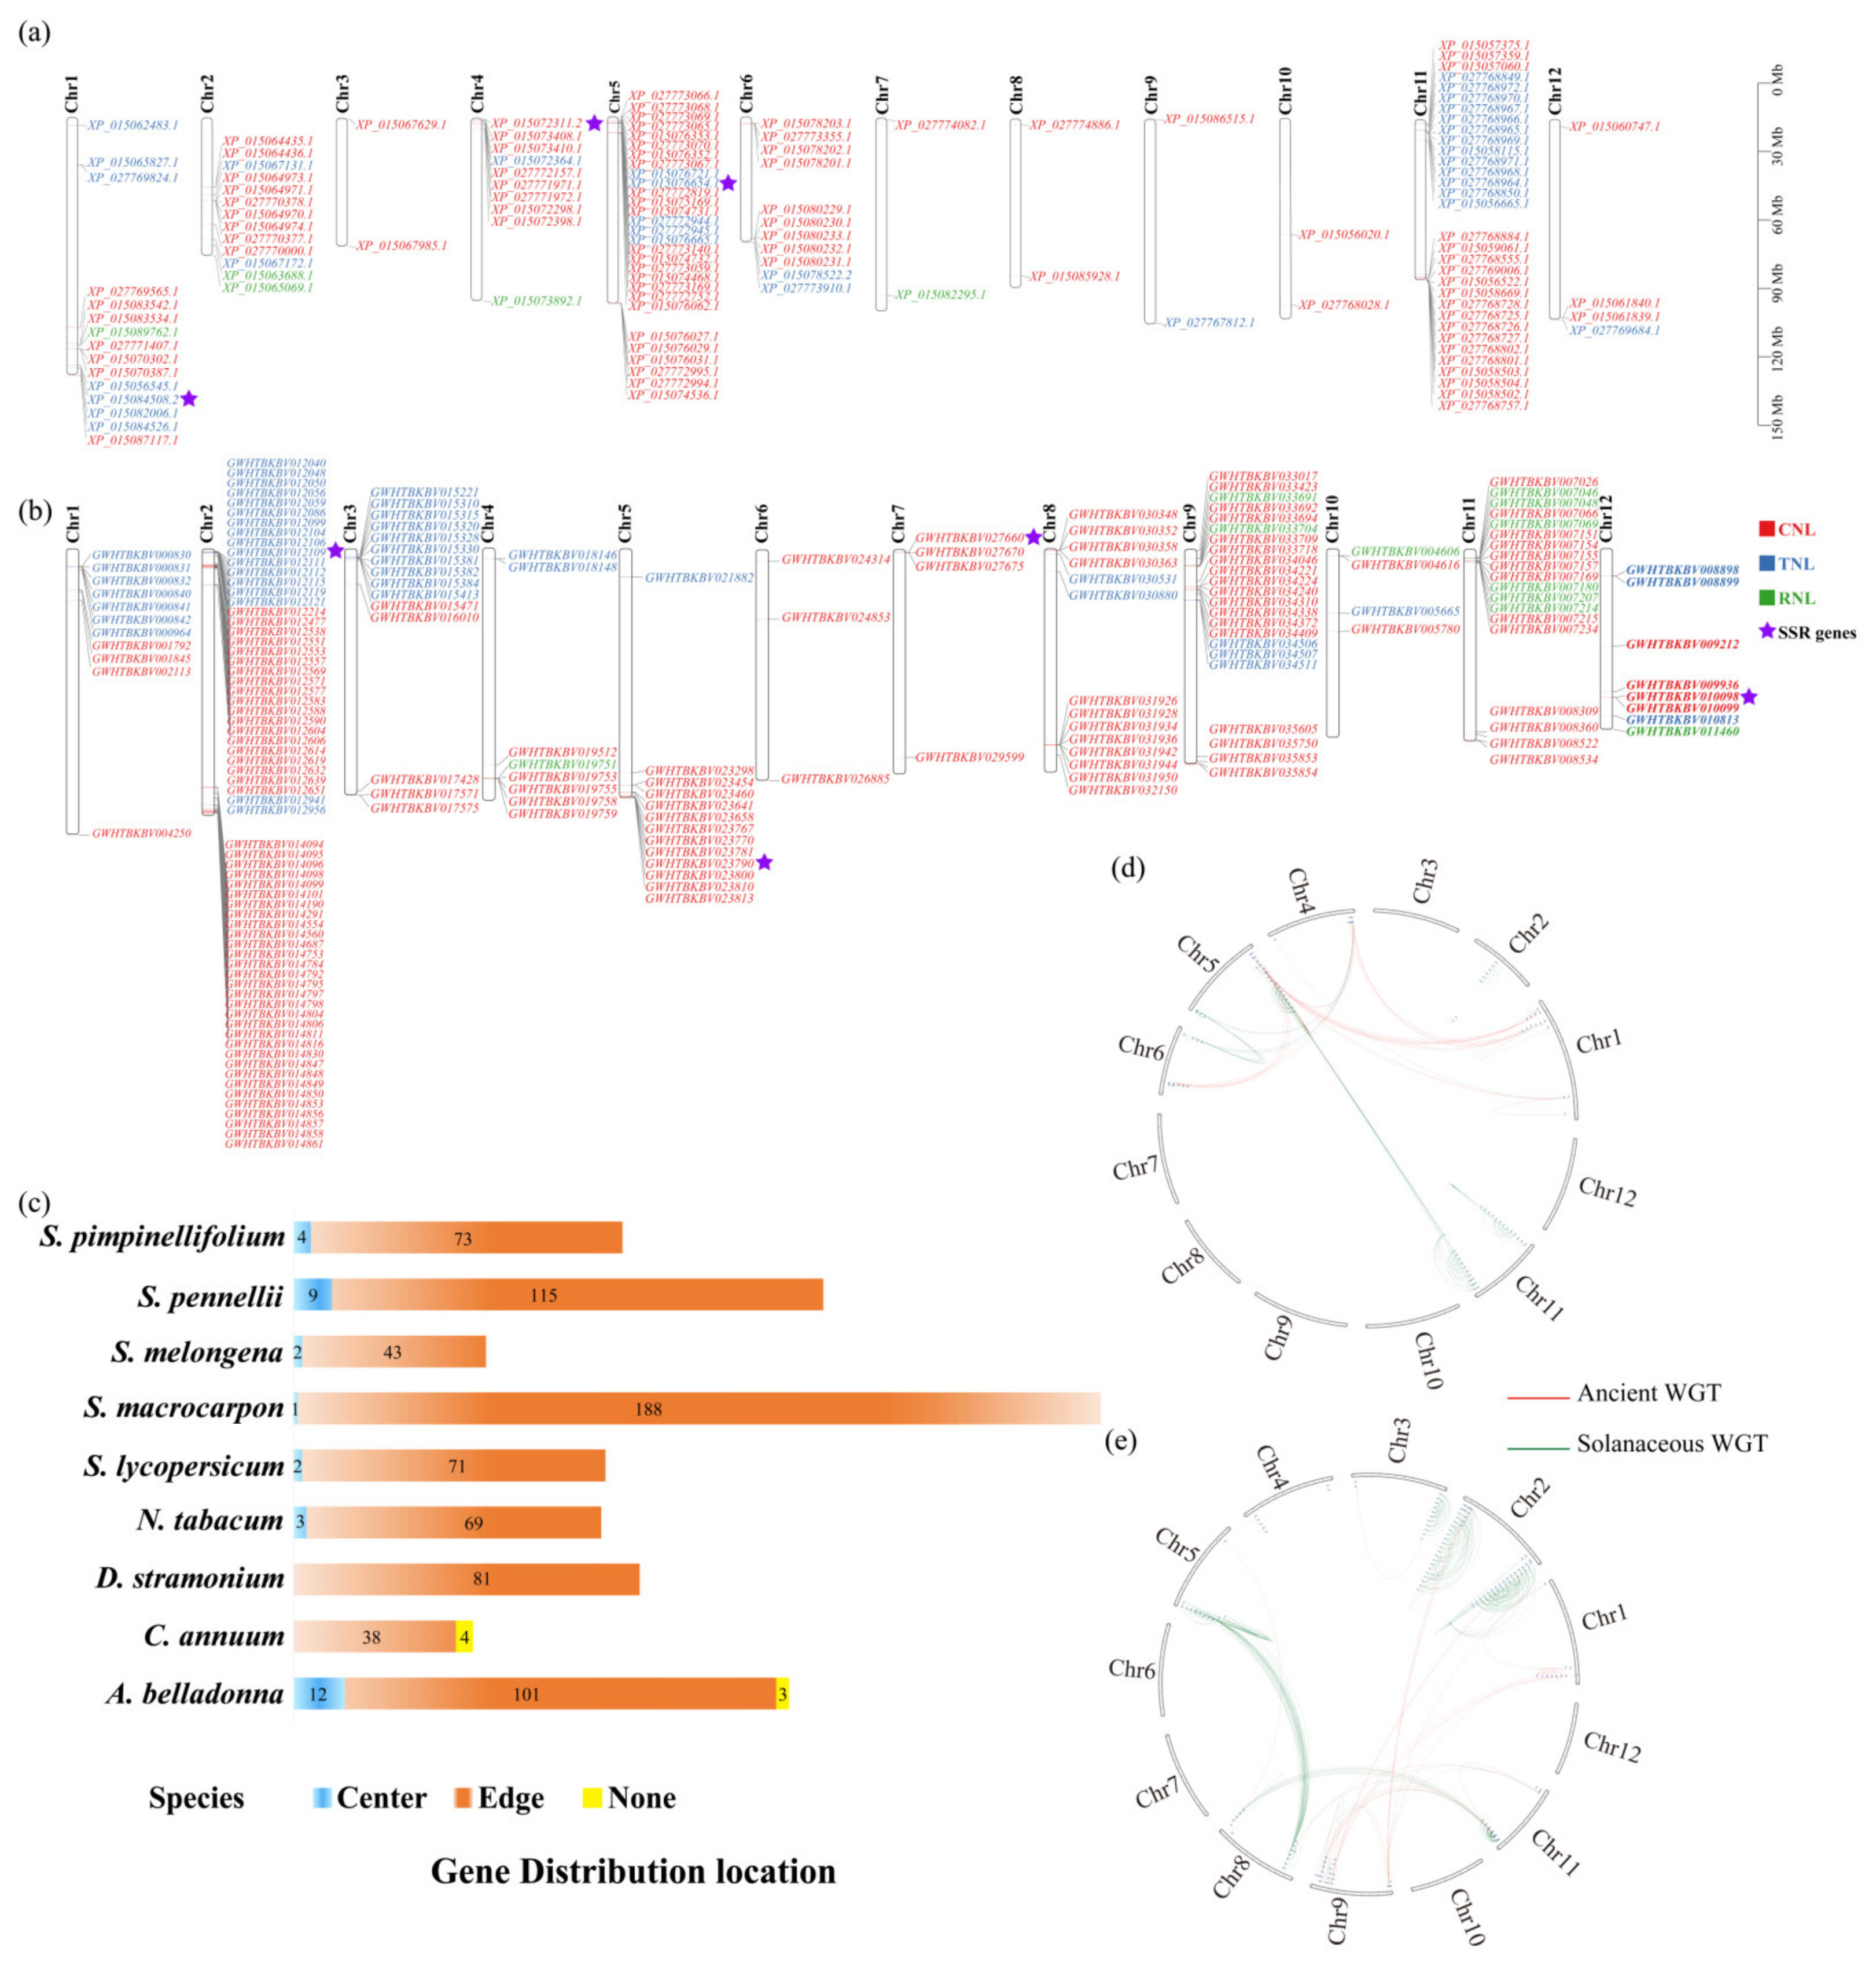
3.2. Chromosomal Distribution and Expansion Events of NBS-LRR Family Genes

To explore the distribution patterns of NBS-LRR family genes on chromosomes in nine Solanaceae species, we conducted an analysis of the chromosomal distribution of NBS-LRR family genes (Figure 2a,b, Figures S1–S7). The previous report indicated that genes situated in the chromosomal interior exhibit a diminished influence on genetic trait variation relative to those positioned at the periphery [64]. In this study, genes were classified as central or peripheral based on their position relative to a 5 Mb threshold from the chromosomal midpoint (Figure 2c, Table S4). It was found that there are 812 NBS-LRR genes located on chromosomes. Although the distribution of each species on the chromosomes varies, most of the genes are located at the edge of the chromosomes (Figure 2c). Among them, A. belladonna (101), S. macrocarpon (188), S. pennellii (115), and even C. annuum (38) and D. stramonium (81) have all their NBS-LRR genes distributed at the edge of the chromosomes. This suggests that genes at the edge of chromosomes may be more prone to recombination events, leading to rapid gene dissemination and the formation of new genes. Moreover, genes located at the edges of chromosomes may be subject to different selective pressures compared to those in the interior, which could affect their evolutionary rates and functional divergence.
The distribution patterns of NBS-LRR genes across diverse chromosomes display considerable heterogeneity, with some occurring as solitary genes and others in dense clusters. Our analysis indicates a preponderance of genes existing within gene clusters, predominantly positioned at chromosomal termini, especially for the S. pennellii and S. macrocarpon. This phenomenon indicates that a duplication event engenders a substantial repertoire of homologous NBS-LRR genes. This result is further mirrored in the synonymous substitutions (Ks) values, revealing a multitude of homologous NBS-LRR gene pairs with closely matched Ks values. With an understanding of the duplication event chronologies and the associated Ks value fluctuations, we inferred the temporal dynamics of gene duplication events (Table S5).
Ks values leave the amino acid composition unaltered and thus remain neutral to the forces of natural selection. Consequently, Ks values serve as indicators of the substitution rate among conserved genetic backgrounds throughout evolution. Our analysis revealed a pronounced disparity in the frequency of homologous gene pairs across species, with S. macrocarpon exhibiting the highest count (362 pairs), followed by S. pennellii (187 pairs), D. stramonium (73 pairs), S. pimpinellifolium (70 pairs), and S. lycopersicum (58 pairs). In contrast, the lowest numbers were observed in C. annuum (5 pairs), S. melongena (13 pairs), A. belladonna (21 pairs), and N. tabacum (25 pairs). Based on the results, we have identified 30 gene pairs with a Ka/Ks ratio greater than 1, suggesting that these genes may have been under positive selection during the evolutionary process. Particularly in S. macrocarpon, 21 gene pairs exhibit this characteristic, which could be related to certain special adaptive traits of the species. In contrast, the number of gene pairs with a Ka/Ks ratio less than 1 is relatively high, reaching 783 pairs, especially in S. macrocarpon (340) and S. pennellii (180). This indicates that the majority of genes are under the influence of purifying selection, where non-synonymous mutations are mostly deleterious and thus eliminated by natural selection. This widespread purifying selection phenomenon may reflect that most genes maintain functional stability during the evolutionary process to sustain the normal physiological functions and adaptability of the organism.
By correlating the Ks values with the temporal framework of known duplication events, we delineated the distribution of genes implicated in these genomic expansions. We categorized the timing of duplication events based on the Ks thresholds as follows: events prior to the first duplication are marked by Ks values exceeding 1.23 and indicated with a red line; those within the range of 0.7–1.23 signify the second duplication event, denoted by a green line; and events with Ks values no greater than 0.7 correspond to the third duplication event, represented by a blue line (Figure 2d,e). Notably, the third event is exclusive to A. belladonna. Despite interspecific variations in homologous pair counts, the majority emerged from Solanaceae-specific WGT events. Particularly noteworthy is S. macrocarpon, which harbors a substantial number of genes affected by these events, underscoring the profound influence of WGT on the evolution of the NBS-LRR family. This indicates that genome duplication events may have provided the NBS-LRR family with abundant genetic variation, promoting the differentiation of gene functions and the formation of new genes, thereby playing a significant role in plant adaptation to environmental changes and disease resistance.

3.3. Phylogenetic Analysis and Identification of Conserved Motifs Within the NBS-LRR Genes

Considering the distinct evolutionary trajectories and roles in pathogen resistance, the NBS-LRR genes are classified into three subfamilies: TNL, CNL, and RNL. We have constructed a phylogenetic tree to delineate the relationships among these three subfamilies and have classified them accordingly (Figure 3a, Figure S8). Our observations indicate that CNL and RNL subfamilies do not form distinct clusters on the phylogenetic tree, a pattern potentially attributable to the inherent complexity and diversity that characterize their evolutionary histories. These gene families have experienced substantial expansion, with each subfamily encountering unique evolutionary pathways and selective pressures. Such factors likely drove congruent alterations in gene sequences and structural configurations.
Structural domain analysis revealed the conserved motif distribution across the species examined (Figure 3b). However, notable divergences were observed when comparing the motifs between the distinct subfamilies (Figure 3c). The CNL subfamily exhibited the most substantial gene count, a finding that suggests it experienced considerable amplification throughout its evolutionary trajectory. Collectively, the presence of multiple identical conserved domains within each subfamily underscores the high degree of conservation characterizing the NBS-LRR gene family.

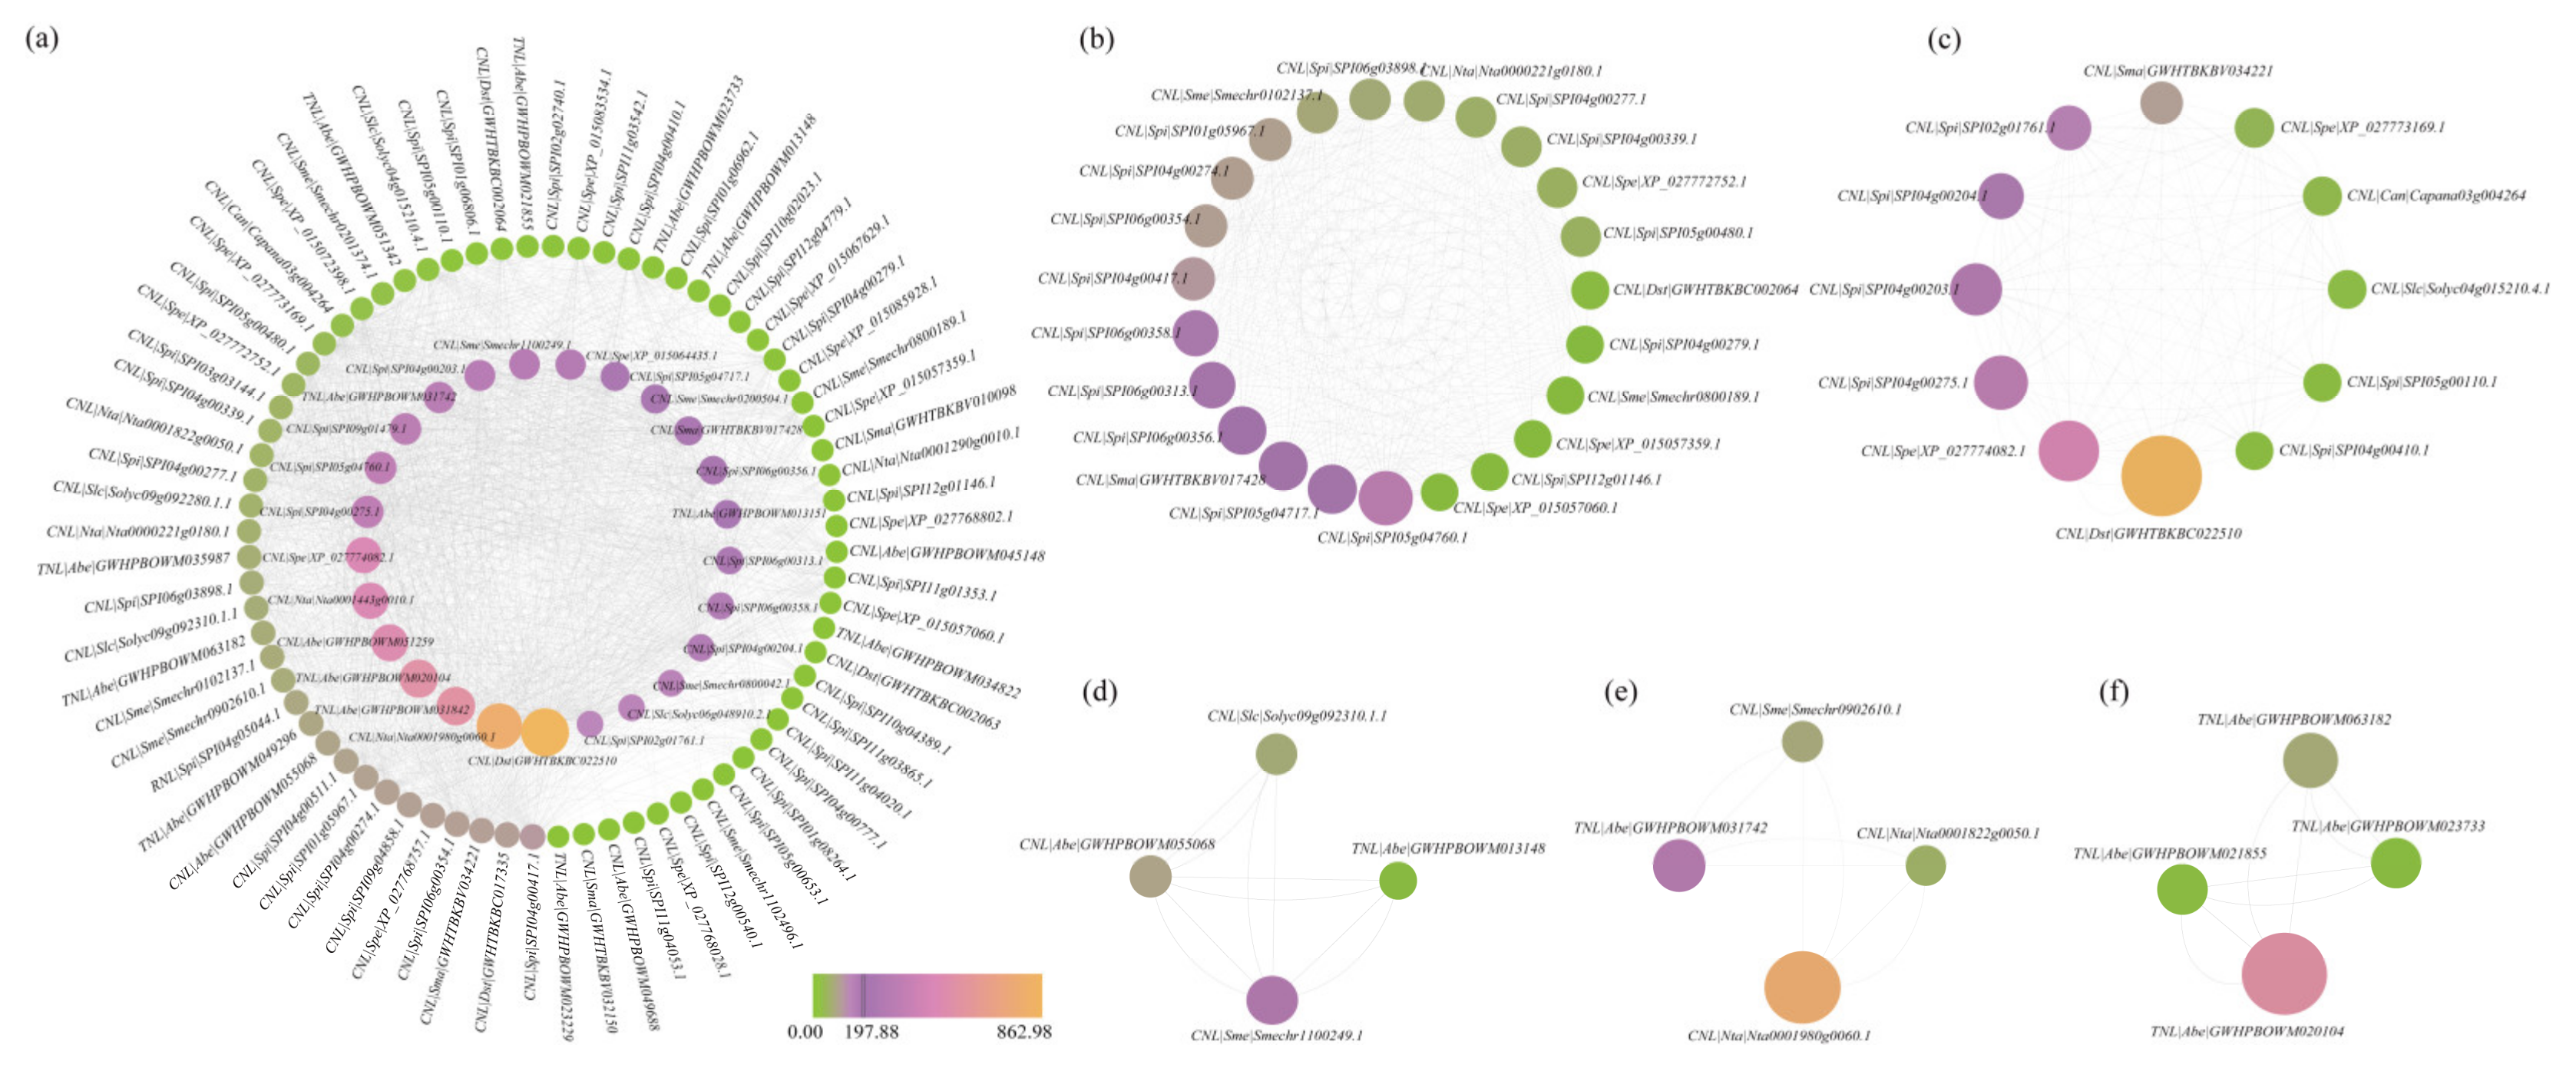
3.4. Comprehensive Analysis of PPI Networks Within the NBS-LRR Family Genes

PPI networks encompass a complex array of proteins engaged in critical life processes, including signal transduction, regulation of gene expression, metabolic pathways for energy and material transformation, and cell cycle regulation. We performed a comprehensive search for 819 NBS-LRR proteins from nine Solanaceae species, identifying 3820 potential PPI pairs, thereby constructing an extensive interaction network. Genes with the highest Betweenness Centrality, indicative of their network centrality, are prominently featured in the inner circle (Figure 4a, Table S6).
Following closely is the TNL subfamily, with interacting genes found in only one species, namely A. belladonna (13). In contrast, the RNL subfamily is less represented, with only one gene involved in interactions, which is S. pimpinellifolium (1). Subsequent cluster analysis of the network delineated five core clusters: Cluster 1, comprising 23 CNL subfamily genes (Figure 4b); Cluster 2, with 12 CNL subfamily genes (Figure 4c); Cluster 3, a mix of 3 CNL and 1 TNL subfamily genes (Figure 4d); Cluster 4, similarly composed of 3 CNL and 1 TNL subfamily genes (Figure 4e); and Cluster 5, exclusively containing 4 TNL subfamily genes (Figure 4f). These NBS-LRR genes in the interaction network may play a significant role in disease resistance in Solanaceae crops.
Based on the PPI analysis, we have identified a total of 83 genes within the CNL subfamily that exhibit interactions. These include genes from various species such as A. belladonna (4), C. annuum (1), D. stramonium (4), N. tabacum (5), S. lycopersicum (4), S. macrocarpon (4), S. melongena (8), S. pennellii (13), and S. pimpinellifolium (40). The extensive interactions observed among CNL genes across multiple species suggest a significant role for the CNL subfamily in plant immunity. In contrast, interactions within the TNL subfamily were detected in only one species, A. belladonna (13), which may imply a higher specificity of the TNL subfamily in plant immunity. The RNL subfamily is less represented, with only one gene involved in interactions, S. pimpinellifolium (1). The widespread distribution and diversity of the CNL subfamily may be related to its multifunctionality in plant immunity, while the distribution and functions of the TNL and RNL subfamilies appear to be more specific and supplementary. These findings contribute to a deeper understanding of the evolution and functional mechanisms of plant disease resistance genes. The analysis uncovered a plethora of homologous proteins within the genome, underscoring the intricate nature of the Solanaceae NBS-LRR family genes. Additionally, the prevalence of duplication events has been a driving force behind the substantial expansion of this gene family.

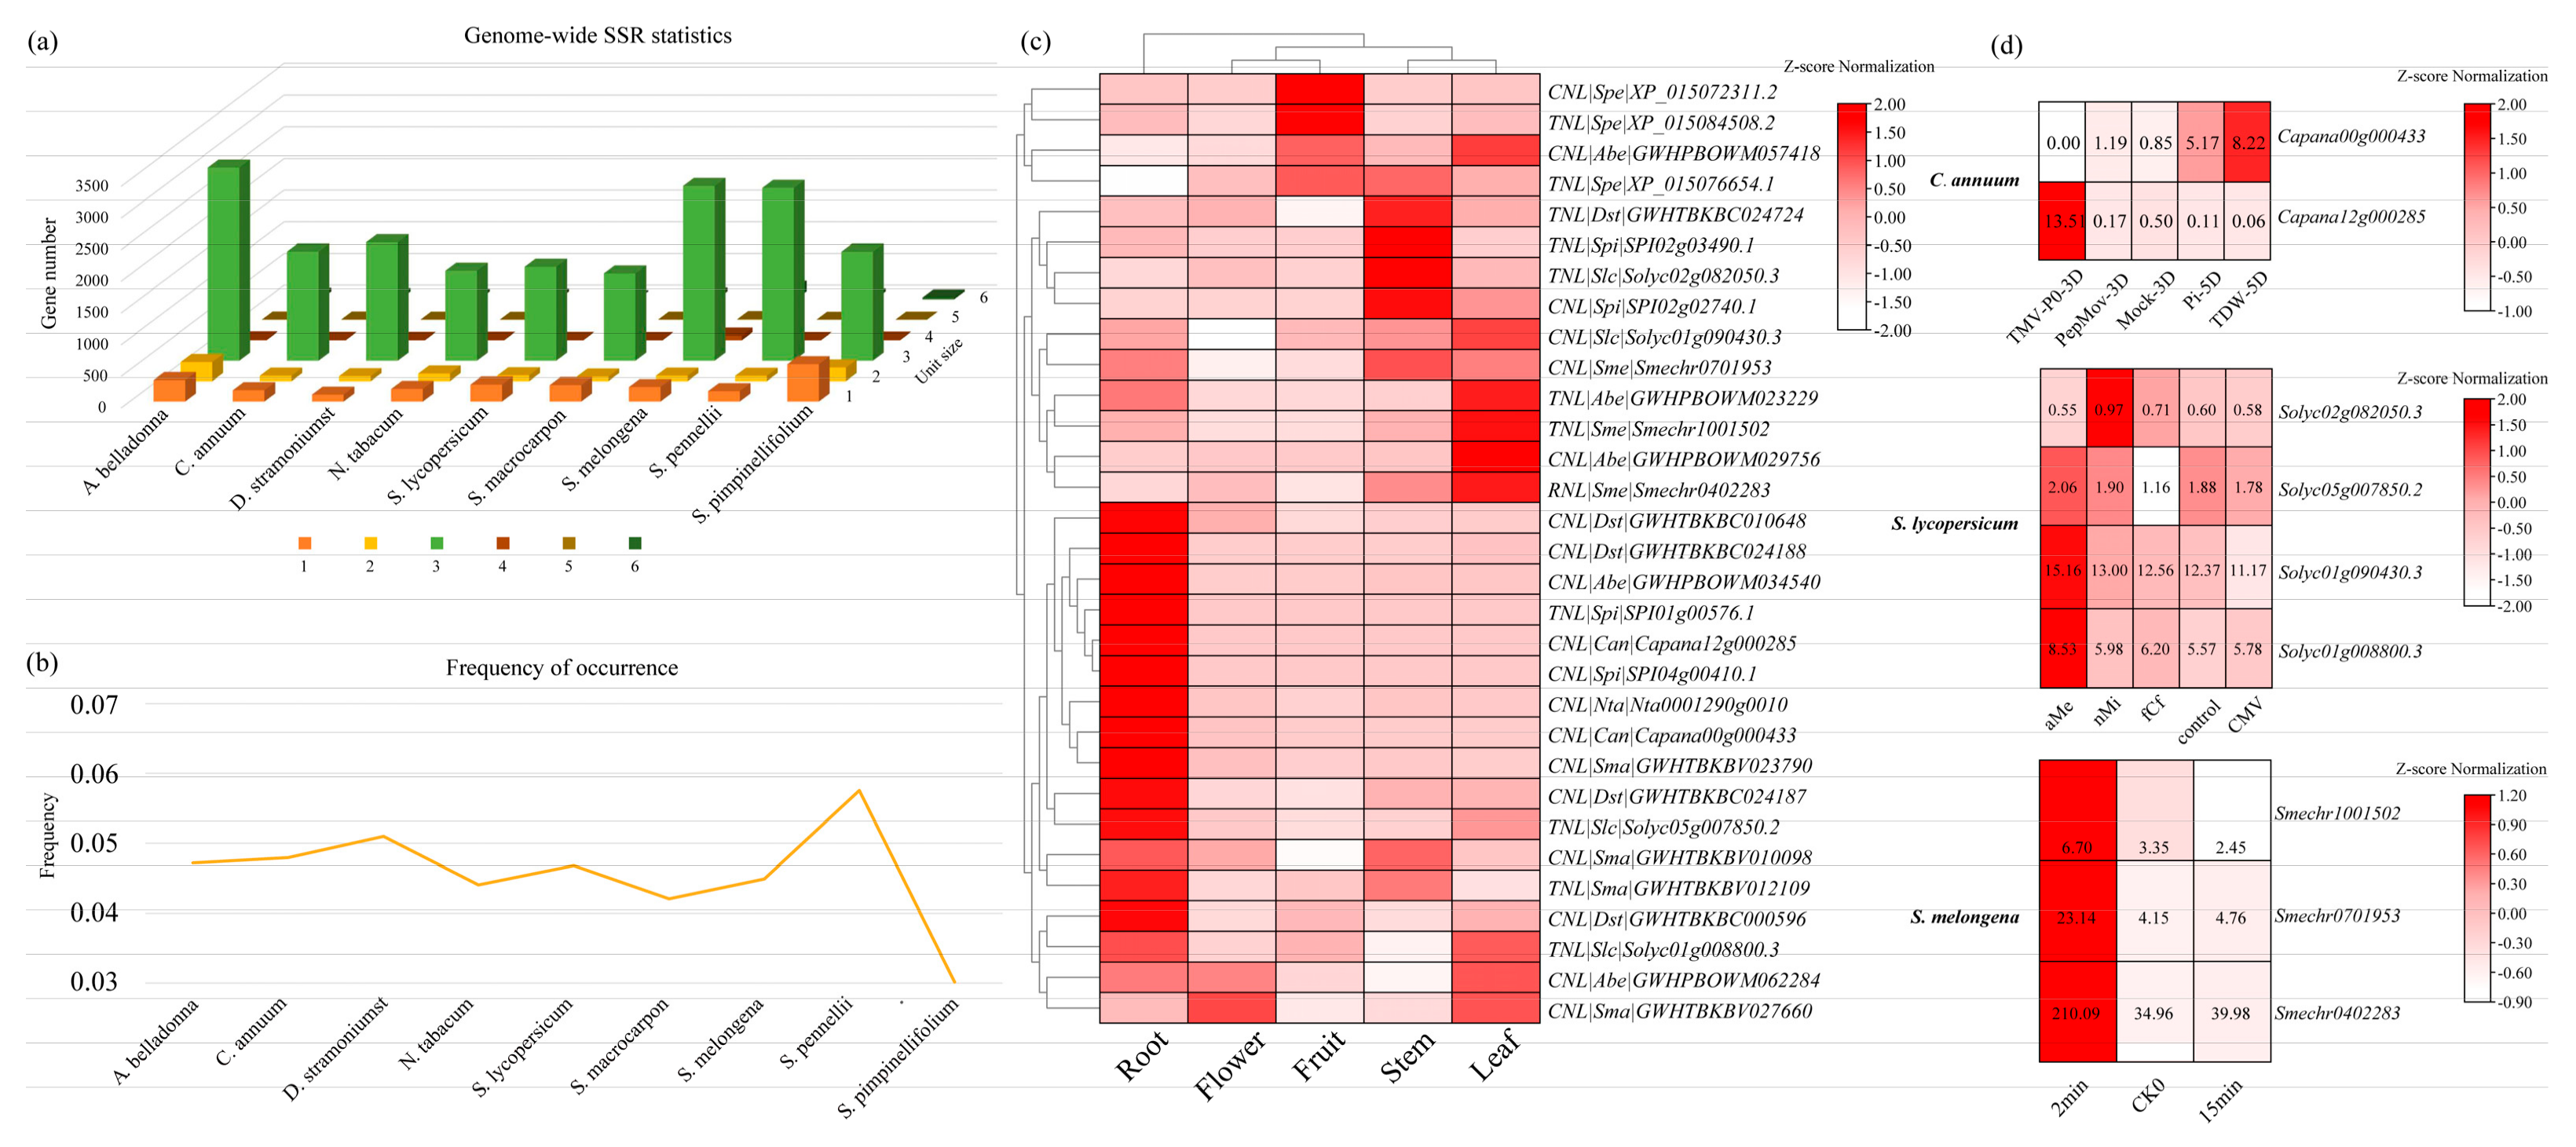
3.5. Development and Characterization of SSR Markers in All Genes from Solanaceae Species

To explore the role of SSRs in disease resistance in Solanaceae crops, we first utilized all genes from the whole genome of Solanaceae species to develop SSR molecular markers. We found that 22,226 SSR loci in nine examined Solanaceae species, including A. belladonna (3759), C. annuum (2040), D. stramonium (2098), N. tabacum (1786), S. lycopersicum (1866), S. macrocarpon (1771), S. melongena (3322), S. pennellii (3022), and S. pimpinellifolium (2562), exhibited distribution characteristics of different repeat types (Table S7). The distribution characteristics of SSRs in the genomes of different Solanaceae species were found to be relatively similar, but there were significant differences in the types of intraspecific repeat types. The frequency of SSR occurrence across Solanaceae species genomes did not vary greatly (3.01–5.09%) (Table S8). It is believed that the differences in SSR distribution frequency are not only due to differences between species but also related to the depth of the sequencing data, the quality of the sequence assembly data, the software used for SSR locus searches, and the criteria for SSR searches. Mono-, di-, and trinucleotide repeat motifs are the dominant repeat types in the SSR sequences of the Solanaceae species genomes (Figure 5a,b, Table S8).
This study found that mono-, di-, and trinucleotide repeat motif types account for 5.49–22.99%, 2.56–8.31%, and 67.21–90.30% of the genomic SSRs, respectively. The dimeric motif type is predominantly AG/CT, with the following percentages for A. belladonna (4.19%), C. annuum (2.81%), D. stramonium (2.96%), N. tabacum (4.00%), S. lycopersicum (2.38%), S. macrocarpon (3.16%), S. melongena (1.80%), and S. pennellii (1.64%). However, the dominant type for S. pimpinellifolium is AT/AT (3.71%), which is 0.71% higher than the AG/CT type (3.00%). Overall, the findings of this study are consistent with observations made in the majority of plants [66]. The dominant types of trinucleotide repeat motifs vary among species [67]. For C. annuum (21.01%), D. stramonium (25.01%), N. tabacum (24.49%), S. lycopersicum (18.02%), S. macrocarpon (23.14%), and S. melongena (40.85%), AAG/CTT is the dominant type, which aligns with the conclusion that AAG/CTT is the dominant repeat motif type in the genomic SSR trinucleotide repeats of Eucalyptus gunnii [68]. However, the dominant type of A. beladonna was ATC/ATG (15.37%) and the dominant type of S. pennellii was AAC/GTT (21.74%) (Table S8).

3.6. Identification and Expression Analysis of NBS-LRR Family Genes Containing SSR Markers

To explore the presence of SSR molecular markers within the NBS-LRR gene family in Solanaceae plants, we further screened for SSR loci within the NBS-LRR family genes. We discovered 43 SSR loci within 33 genes (Table S9). These genes include 19 CNL subfamily genes, 1 RNL subfamily gene, and 13 TNL subfamily genes. Our analysis of the SSRs in the NBS-LRR family genes of Solanaceae plants revealed a considerable distribution of SSRs, particularly the mono-, di-, and trinucleotide repeat types. The sequences of these SSRs are predominantly composed of adenine (A) and thymine (T) bases, with a variety of repeat motif types and a high representation of motifs across multiple types. The distribution of SSRs is uneven among the various species. These research findings will provide a data foundation for further screening of effective SSRs.
We calculated the expression levels of the entire genomes of nine Solanaceae species in various tissues (Tables S10 and S11) and against different pathogens (Tables S13–S16). We then quantified the expression of NBS-LRR genes across different tissues (Table S12) and in response to various pathogens (Figure S9, Table S17). Our findings reveal significant differences in expression levels among different species across various tissues. Some genes appear to play specific roles in certain tissues, while they may be inactive or less active in others. This tissue-specific expression could be related to the particular roles these genes play in plant growth and development, as well as in stress response. The differential expression of resistance genes in Solanaceae upon infection by distinct pathogens highlights the complexity and diversity of plant defense mechanisms, enabling specific responses to various pathogens. In C. annuum, Capana12g000285 is upregulated following infection with Tobacco mosaic virus P0, whereas Capana10g002284 exhibits increased expression after exposure to Pepper mottle virus, and Capana07g001559 shows heightened expression post-infection with Phytophthora infestans. Furthermore, the temporal dynamics of resistance gene expression in Solanum melongena reveal that the expression levels of these genes are influenced by the duration of pathogen exposure. Specifically, a significant upregulation of resistance genes is observed after 15 min of browning, in contrast to the lower expression levels detected after only 2 min. This temporal variation in gene expression suggests that plants may employ distinct defense strategies at different stages of pathogen invasion.
We calculated the expression levels of genes containing SSR loci in various tissues (Figure 5c, Table S18) and found that in D. stramonium, GWHTBKBC010648 and GWHTBKBC024187 had higher expression levels in roots, and in N. tabacum, Nta0001290g0010 also showed higher expression in roots. In S. macrocarpon, GWHTBKBV027660 exhibited higher expression levels in flowers, while in S. pennellii, XP_015076654.1 had increased expression in fruits. In S. melongena, Smechr0701953 demonstrated higher expression in stems, and Smechr0402283 showed higher expression in leaves. Therefore, the presence of SSR loci and high expression levels of a gene may indicate that it plays a significant regulatory role in cellular processes and may be associated with disease resistance mechanisms. This could also imply that these genes are highly conserved and have important functions within the Solanaceae.
We have statistically analyzed the expression levels of SSR locus genes in resisting various pathogen infections (Figure 5d, Table S19). We found that SSR locus genes exhibit different expression levels during the resistance to different pathogen infections, indicating a correlation between gene expression and plant resistance to pathogens. Different genes show varying expression responses to different pathogens, demonstrating the specificity of genes in pathogen resistance. For instance, the Capana00g000433 in C. annuum has a high expression against Pepper mottle virus, while the Capana12g000285 has a high expression against Tobacco mosaic virus P0. In S. lycopersicum, the Solyc01g008800.3 shows resistance to four diseases or viruses, suggesting that this gene may have broad-spectrum resistance. In S. melongena, the Smechr0701953 and Smechr0402283 exhibit high expression during the pathological process, which may be related to the plant’s activation of the immune system to combat pathogen invasion. Some genes have low expression levels when infected by specific pathogens, such as the Capana00g000433 not being expressed during Tobacco mosaic virus P0 infection, which may reflect the plant’s weaker immune response or weaker resistance to specific pathogens. The high expression of these genes may be related to the mechanisms by which plants activate the immune system to combat pathogen invasion, indicating that these genes play an active role in the disease resistance process.

4. Discussion

The NBS-LRR genes are among the largest resistance gene families in plants, with the majority of cloned plant disease resistance genes originating from this family [69]. Studying these genes aids in understanding how plants recognize and respond to pathogens through these genes, providing new strategies and tools for plant disease management. NBS-LRR proteins primarily activate plant innate immune responses by recognizing PAMPs and effectors. Specifically, NBS-LRR proteins may indirectly detect pathogens by monitoring the status of plant proteins, which has been termed “the guard hypothesis” [70]. Within this hypothesis framework, NBS-LRR proteins may interact with plant proteins targeted by pathogen effectors, thereby triggering defense mechanisms. The NBS-LRR genes in Solanaceae plants exhibit different evolutionary patterns across species, such as “expansion” in potatoes, “expansion followed by contraction” in tomatoes, and “contraction” in peppers [71]. These studies help reveal the evolutionary mechanisms of plant resistance genes and the adaptive differences in disease resistance among different plant species. Furthermore, the regulatory networks involving NBS-LRR genes are extremely complex and diverse [70]. They may also participate in the regulation of plant immune responses to pathogens through interactions with various signaling molecules. Therefore, NBS-LRR genes and their encoded proteins play a multifaceted role in plant immunity, not only participating in direct pathogen recognition but also potentially engaging in broader regulatory networks, thereby affecting plant responses to environmental changes.
All Solanaceae species have undergone at least two rounds of WGT events. The ancient genome duplication event is shared with grapes and the majority of Compositae plants (γ-WGT), and is estimated to have occurred around 115–130 Mya [64]. The recent WGT event was specific to Solanaceae and dates to approximately 45.37–51.28 Mya [65]. Interestingly, A. belladonna underwent a distinctive WGT event around 0.125–0.130 million years ago, which significantly influenced the proliferation of NBS-LRR genes in Solanaceae.
We identified a total of 819 NBS-LRR family genes, categorized into 583 CNL, 54 RNL, and 182 TNL genes. The high similarity among the conserved motifs of these subfamily genes suggests a common ancestral origin, with subsequent divergence and amplification throughout evolution. NBS-LRR family genes are extensively distributed across chromosomal termini, with some localized in gene clusters. Ks-based selection pressures suggest the profound impact of the most recent WGT event on the NBS-LRR gene family. Notable interactions were detected among 97 genes, offering crucial insights for further analysis into protein functions, signal transduction pathways, and regulatory networks. We screened a total of 43 SSR loci from the NBS-LRR subfamily genes across the whole-genome SSR loci, comprising 21 CNL, 1 RNL, and 13 TNL genes.
SSR markers have been extensively applied in the study of resistance genes across various crops. For instance, in rice, SSR markers are utilized to screen for genes resistant to rice blast disease, as evidenced by research findings [72]. Comparative genomic sequencing of multiple spinach varieties has led to the discovery of SSR markers [38]. Additionally, in wheat, SSR markers have been identified for the stripe rust resistance gene Yr26 [73]. These applications highlight the significance of SSR markers in the genetic study and breeding of crops for disease resistance. SSR marker data, due to their high polymorphism, stability, and reliability, are highly suitable for application in the genetic diversity and phylogenetic studies of Solanaceae crops. These markers can assist researchers in evaluating the genetic diversity of germplasm resources, determining genetic distances, and clarifying kinship relationships, which are of significance for the full utilization of germplasm resources, genetic research, and breeding practices.
Solanaceae plants such as tomatoes, peppers, and eggplants are important crops, and the study of NBS-LRR genes helps to discover and utilize new disease resistance gene resources, enhancing crop resistance and yield. Through comparative genomics and transcriptome analysis, key disease resistance genes in Solanaceae plants can be identified and functionally validated using molecular biology methods, which are of great significance for molecular breeding and crop improvement. Thus, the study of the NBS-LRR family in Solanaceae bioinformatics not only helps to reveal plant disease resistance mechanisms, but also holds significant scientific and applied value in the fields of plant genomics, evolutionary biology, and molecular breeding. This study offers a rich genetic dataset, instrumental for deciphering genomic architecture and evolutionary patterns, and serves as a vital reference for germplasm resource identification, evolutionary studies, and molecular breeding endeavors.

5. Conclusions

In this study, we began with a comprehensive genome-wide examination of nine Solanaceae species to elucidate the nature of their polyploidization. Retained duplicated genes that undergo structural and functional changes can enhance the species’ adaptive capacity for environmental stresses, or help them occupy new ecological niches. Subsequently, we conducted the identification and analysis of conserved motifs within the NBS-LRR gene family, discovering that the structure and function of NBS-LRR genes may vary among different plants. The chromosomal positioning of the NBS-LRR family genes was examined, followed by an assessment of Ks selection pressures to discern the impact of polyploidization events on these gene family members. Furthermore, we analyzed the interaction profiles of NBS-LRR family proteins, identifying genes with significant interactive potential. Subsequently, we developed and analyzed SSR molecular markers across the entire genome, establishing a foundational resource for the utilization of NBS-LRR family genes in molecular breeding strategies, aimed at enhancing Solanaceae disease resistance. The utilization of NBS-LRR genes in molecular breeding strategies can enhance the disease resistance of Solanaceae plants, which is of significance for crop disease management and yield improvement.

Supplementary Materials

The following supporting information can be downloaded at: https://www.mdpi.com/article/10.3390/horticulturae10121293/s1.

Author Contributions

Conceptualization, X.S., N.L. and L.J.; methodology, X.S., C.L. and Z.L.; software, C.L. and S.S.; validation, R.Z. and L.J.; formal analysis, C.L., Z.L. and S.S.; investigation, X.S. and N.L.; resources, X.S. and L.J.; data curation, C.L. and T.Y.; writing—original draft preparation, X.S. and C.L.; writing—review and editing, X.S., C.L., R.Z., L.J. and N.L.; visualization, C.L. and Z.L.; supervision, X.S., N.L. and L.J.; project administration, X.S.; funding acquisition, X.S. and L.J. All authors have read and agreed to the published version of the manuscript.

Funding

This work was supported by Open Research Fund Program of Key Laboratory of Horticultural Crop Germplasm Innovation and Utilization (Co-construction by Ministry and Province) (AHYY2023007), the Youth Development Fund from the Anhui Academy of Agricultural Sciences (QNYC-202121), the Anhui Province Vegetable industry Technology System (2021-711), and the National Natural Science Foundation of China (32172583).

Data Availability Statement

The genome datasets analyzed during the current study are available in our Solanaceae genome database (https://soir.bio2db.com (accessed on 10 May 2024)). All materials and related data in this study are provided in the Supplementary Files.

Conflicts of Interest

The authors declare no competing interests.

References

  1. Gebhardt, C. The historical role of species from the Solanaceae plant family in genetic research. Theor. Appl. Genet. 2016, 129, 2281–2294. [Google Scholar] [CrossRef] [PubMed]
  2. Barchi, L.; Pietrella, M.; Venturini, L.; Minio, A.; Toppino, L.; Acquadro, A.; Andolfo, G.; Aprea, G.; Avanzato, C.; Bassolino, L.; et al. A chromosome-anchored eggplant genome sequence reveals key events in Solanaceae evolution. Sci. Rep. 2019, 9, 11769. [Google Scholar] [CrossRef] [PubMed]
  3. Luo, L.; Niu, Y.; Li, Q.; Xia, L.; Wang, C.; Luo, S.; Li, N.; Xuan, S.; Wang, Y.; Shen, S.; et al. Mapping and identification of genes responsible for less-photosensitive fruit coloration in eggplant. Veg. Res. 2023, 3, 32. [Google Scholar] [CrossRef]
  4. Kumar, M.; Chandran, D.; Tomar, M.; Bhuyan, D.J.; Grasso, S.; Sá, A.G.; Carciofi, B.A.; Radha; Dhumal, S.; Singh, S.; et al. Valorization Potential of Tomato (Solanum lycopersicum L.) Seed: Nutraceutical Quality, Food Properties, Safety Aspects, and Application as a Health-Promoting Ingredient in Foods. Horticulturae 2022, 8, 265. [Google Scholar] [CrossRef]
  5. Akbar, S. Atropa belladonna L. (Solanaceae). In Handbook of 200 Medicinal Plants: A Comprehensive Review of Their Traditional Medical Uses and Scientific Justifications; Akbar, S., Ed.; Springer International Publishing: Cham, Switzerland, 2020; pp. 373–379. [Google Scholar]
  6. Sharma, M.; Dhaliwal, I.; Rana, K.; Delta, A.K.; Kaushik, P. Phytochemistry, Pharmacology, and Toxicology of Datura Species-A Review. Antioxidants 2021, 10, 1291. [Google Scholar] [CrossRef]
  7. Edwards, K.D.; Fernandez-Pozo, N.; Drake-Stowe, K.; Humphry, M.; Evans, A.D.; Bombarely, A.; Allen, F.; Hurst, R.; White, B.; Kernodle, S.P.; et al. A reference genome for Nicotiana tabacum enables map-based cloning of homeologous loci implicated in nitrogen utilization efficiency. BMC Genom. 2017, 18, 448. [Google Scholar] [CrossRef]
  8. Polashock, J.; Zelzion, E.; Fajardo, D.; Zalapa, J.; Georgi, L.; Bhattacharya, D.; Vorsa, N. The American cranberry: First insights into the whole genome of a species adapted to bog habitat. BMC Plant Biol. 2014, 14, 165. [Google Scholar] [CrossRef]
  9. Bai, C.; Wu, C.; Ma, L.; Fu, A.; Zheng, Y.; Han, J.; Li, C.; Yuan, S.; Zheng, S.; Gao, L.; et al. Transcriptomics and metabolomics analyses provide insights into postharvest ripening and senescence of tomato fruit under low temperature. Hortic. Plant J. 2023, 9, 109–121. [Google Scholar] [CrossRef]
  10. Li, N.; Wang, Y.; Zheng, R.; Song, X. Research progress on biological functions of lncRNAs in major vegetable crops. Veg. Res. 2022, 2, 14. [Google Scholar] [CrossRef]
  11. Kim, S.; Park, M.; Yeom, S.-I.; Kim, Y.-M.; Lee, J.M.; Lee, H.-A.; Seo, E.; Choi, J.; Cheong, K.; Kim, K.-T.; et al. Genome sequence of the hot pepper provides insights into the evolution of pungency in Capsicum species. Nat. Genet. 2014, 46, 270–278. [Google Scholar] [CrossRef]
  12. Liu, F.; Yu, H.; Deng, Y.; Zheng, J.; Liu, M.; Ou, L.; Yang, B.; Dai, X.; Ma, Y.; Feng, S.; et al. PepperHub, an Informatics Hub for the Chili Pepper Research Community. Mol. Plant 2017, 10, 1129–1132. [Google Scholar] [CrossRef] [PubMed]
  13. Wu, Y.; Li, D.; Hu, Y.; Li, H.; Ramstein, G.; Zhou, S.; Zhang, X.; Bao, Z.; Zhang, Y.; Song, B.; et al. Phylogenomic discovery of deleterious mutations facilitates hybrid potato breeding. Cell 2023, 186, 2313–2328.e15. [Google Scholar] [CrossRef] [PubMed]
  14. Gürbüz, N.; Uluişik, S.; Frary, A.; Frary, A.; Doğanlar, S. Health benefits and bioactive compounds of eggplant. Food Chem. 2018, 268, 602–610. [Google Scholar] [CrossRef] [PubMed]
  15. Ezechukwu, C.S.; Mbegbu, E.C.; Nwani, C.D.; Onoja, S.O.; Orji, E.A.; Ugwu, G.C.; Nnamonu, E.I.; Ugwu, G.N. Spermicidal and antioxidant potency of Solanum macrocarpon L. (African eggplant) leaf ethanol extract in albino rats. Comp. Clin. Pathol. 2024, 33, 367–377. [Google Scholar] [CrossRef]
  16. Bolger, A.; Scossa, F.; Bolger, M.E.; Lanz, C.; Maumus, F.; Tohge, T.; Quesneville, H.; Alseekh, S.; Sørensen, I.; Lichtenstein, G.; et al. The genome of the stress-tolerant wild tomato species Solanum pennellii. Nat. Genet. 2014, 46, 1034–1038. [Google Scholar] [CrossRef]
  17. Han, H.; Li, X.; Li, T.; Chen, Q.; Zhao, J.; Zhai, H.; Deng, L.; Meng, X.; Li, C. Chromosome-level genome assembly of Solanum pimpinellifolium. Sci. Data 2024, 11, 577. [Google Scholar] [CrossRef]
  18. Doganlar, S.; Frary, A.; Daunay, M.C.; Lester, R.N.; Tanksley, S.D. A comparative genetic linkage map of eggplant (Solanum melongena) and its implications for genome evolution in the solanaceae. Genetics 2002, 161, 1697–1711. [Google Scholar] [CrossRef]
  19. Ellis, J.; Dodds, P.; Pryor, T. Structure, function and evolution of plant disease resistance genes. Curr. Opin. Plant Biol. 2000, 3, 278–284. [Google Scholar] [CrossRef]
  20. Du, J.; Wang, B.; Huang, M.; Chen, X.; Nie, L.; Wang, T.; Chen, H.; Song, B. Advancements in unraveling and enhancing bacterial wilt resistance in Solanaceous crops. Veg. Res. 2023, 3, 29. [Google Scholar] [CrossRef]
  21. Gassmann, W.; Hinsch, M.E.; Staskawicz, B.J. The Arabidopsis RPS4 bacterial-resistance gene is a member of the TIR-NBS-LRR family of disease-resistance genes. Plant J. 1999, 20, 265–277. [Google Scholar] [CrossRef]
  22. Kourelis, J.; van der Hoorn, R.A.L. Defended to the Nines: 25 Years of Resistance Gene Cloning Identifies Nine Mechanisms for R Protein Function. Plant Cell 2018, 30, 285–299. [Google Scholar] [CrossRef] [PubMed]
  23. Wang, Z.X.; Yano, M.; Yamanouchi, U.; Iwamoto, M.; Monna, L.; Hayasaka, H.; Katayose, Y.; Sasaki, T. The Pib gene for rice blast resistance belongs to the nucleotide binding and leucine-rich repeat class of plant disease resistance genes. Plant J. 1999, 19, 55–64. [Google Scholar] [CrossRef]
  24. Yu, T.; Ma, X.; Liu, Z.; Feng, X.; Wang, Z.; Ren, J.; Cao, R.; Zhang, Y.; Nie, F.; Song, X. TVIR: A comprehensive vegetable information resource database for comparative and functional genomic studies. Hortic. Res. 2022, 9, uhac213. [Google Scholar] [CrossRef] [PubMed]
  25. Ng, A.; Xavier, R.J. Leucine-rich repeat (LRR) proteins: Integrators of pattern recognition and signaling in immunity. Autophagy 2011, 7, 1082–1084. [Google Scholar] [CrossRef] [PubMed]
  26. Maruta, N.; Sorbello, M.; Lim, B.Y.J.; McGuinness, H.Y.; Shi, Y.; Ve, T.; Kobe, B. TIR domain-associated nucleotides with functions in plant immunity and beyond. Curr. Opin. Plant Biol. 2023, 73, 102364. [Google Scholar] [CrossRef]
  27. Dangl, J.L.; Jones, J.D.G. Plant pathogens and integrated defence responses to infection. Nature 2001, 411, 826–833. [Google Scholar] [CrossRef]
  28. Rairdan, G.J.; Collier, S.M.; Sacco, M.A.; Baldwin, T.T.; Boettrich, T.; Moffett, P. The coiled-coil and nucleotide binding domains of the Potato Rx disease resistance protein function in pathogen recognition and signaling. Plant Cell 2008, 20, 739–751. [Google Scholar] [CrossRef]
  29. Li, Q.; Li, J.; Sun, J.-L.; Ma, X.-F.; Wang, T.-T.; Berkey, R.; Yang, H.; Niu, Y.-Z.; Fan, J.; Li, Y.; et al. Multiple Evolutionary Events Involved in Maintaining Homologs of Resistance to Powdery Mildew 8 in Brassica napus. Front. Plant Sci. 2016, 7, 1065. [Google Scholar] [CrossRef]
  30. Zhou, H.; Yan, F.; Hao, F.; Ye, H.; Yue, M.; Woeste, K.; Zhao, P.; Zhang, S. Pan-genome and transcriptome analyses provide insights into genomic variation and differential gene expression profiles related to disease resistance and fatty acid biosynthesis in eastern black walnut (Juglans nigra). Hortic. Res. 2023, 10, uhad015. [Google Scholar] [CrossRef]
  31. Collier, S.M.; Hamel, L.P.; Moffett, P. Cell death mediated by the N-terminal domains of a unique and highly conserved class of NB-LRR protein. Mol. Plant Microbe Interact. 2011, 24, 918–931. [Google Scholar] [CrossRef]
  32. Qi, D.; Innes, R.W. Recent Advances in Plant NLR Structure, Function, Localization, and Signaling. Front. Immunol. 2013, 4, 348. [Google Scholar] [CrossRef] [PubMed]
  33. Sharma, P.C.; Grover, A.; Kahl, G. Mining microsatellites in eukaryotic genomes. Trends Biotechnol. 2007, 25, 490–498. [Google Scholar] [CrossRef] [PubMed]
  34. Gao, Y.; Li, N.; Li, X.; Lu, Y.; Feng, D.; Zhang, X.; Gu, A.; Ge, Y.; Tabusam, J.; Liu, M.; et al. Genome-wide development and utilization of Simple Sequence Repeats in Chinese cabbage (Brassica rapa L. ssp. pekinensis). Veg. Res. 2022, 2, 9. [Google Scholar] [CrossRef]
  35. Sharma, J.; Manjunatha, N.; Pokhare, S.S.; Patil, P.G.; Agarrwal, R.; Chakranarayan, M.G.; Aralimar, A.; Devagire, P.; Marathe, R.A. Genetic Diversity and Streptomycin Sensitivity in Xanthomonas axonopodis pv. punicae Causing Oily Spot Disease in Pomegranates. Horticulturae 2022, 8, 441. [Google Scholar] [CrossRef]
  36. Zhu, Y.; Ma, T.; Lin, Y.; Peng, Y.; Huang, Y.; Jiang, J. SSR molecular marker developments and genetic diversity analysis of Zanthoxylum nitidum (Roxb.) DC. Sci. Rep. 2023, 13, 20767. [Google Scholar] [CrossRef]
  37. Ahmad, A.; Wang, J.-D.; Pan, Y.-B.; Sharif, R.; Gao, S.-J. Development and Use of Simple Sequence Repeats (SSRs) Markers for Sugarcane Breeding and Genetic Studies. Agronomy 2018, 8, 260. [Google Scholar] [CrossRef]
  38. Bhattarai, G.; Shi, A.; Kandel, D.R.; Solís-Gracia, N.; da Silva, J.A.; Avila, C.A. Genome-wide simple sequence repeats (SSR) markers discovered from whole-genome sequence comparisons of multiple spinach accessions. Sci. Rep. 2021, 11, 9999. [Google Scholar] [CrossRef]
  39. Lin, X.; Jia, Y.; Heal, R.; Prokchorchik, M.; Sindalovskaya, M.; Olave-Achury, A.; Makechemu, M.; Fairhead, S.; Noureen, A.; Heo, J.; et al. Solanum americanum genome-assisted discovery of immune receptors that detect potato late blight pathogen effectors. Nat. Genet. 2023, 55, 1579–1588. [Google Scholar] [CrossRef]
  40. Bradeen, J.M. On the Value of Wild Solanum Species for Improved Crop Disease Resistance: Resistances to Nematodes and Viruses. In The Wild Solanums Genomes; Carputo, D., Aversano, R., Ercolano, M.R., Eds.; Springer International Publishing: Cham, Switzerland, 2021; pp. 95–118. [Google Scholar]
  41. Zhang, F.; Qiu, F.; Zeng, J.; Xu, Z.; Tang, Y.; Zhao, T.; Gou, Y.; Su, F.; Wang, S.; Sun, X.; et al. Revealing evolution of tropane alkaloid biosynthesis by analyzing two genomes in the Solanaceae family. Nat. Commun. 2023, 14, 1446. [Google Scholar] [CrossRef]
  42. Ichihara, H.; Yamada, M.; Kohara, M.; Hirakawa, H.; Ghelfi, A.; Tamura, T.; Nakaya, A.; Nakamura, Y.; Shirasawa, S.; Yamashita, S.; et al. Plant GARDEN: A portal website for cross-searching between different types of genomic and genetic resources in a wide variety of plant species. BMC Plant Biol. 2023, 23, 391. [Google Scholar] [CrossRef]
  43. Wang, X.; Gao, L.; Jiao, C.; Stravoravdis, S.; Hosmani, P.S.; Saha, S.; Zhang, J.; Mainiero, S.; Strickler, S.R.; Catala, C.; et al. Genome of Solanum pimpinellifolium provides insights into structural variants during tomato breeding. Nat. Commun. 2020, 11, 5817. [Google Scholar] [CrossRef] [PubMed]
  44. Liu, Z.; Shen, S.; Li, C.; Zhang, C.; Chen, X.; Fu, Y.; Yu, T.; Zhou, R.; Liu, D.; Yang, Q.Y.; et al. SoIR: A comprehensive Solanaceae information resource for comparative and functional genomic study. Nucleic Acids Res. 2024, gkae1040. [Google Scholar] [CrossRef] [PubMed]
  45. Wei, Q.; Wang, J.; Wang, W.; Hu, T.; Hu, H.; Bao, C. A high-quality chromosome-level genome assembly reveals genetics for important traits in eggplant. Hortic. Res. 2020, 7, 153. [Google Scholar] [CrossRef] [PubMed]
  46. Schmidt, M.H.; Vogel, A.; Denton, A.K.; Istace, B.; Wormit, A.; van de Geest, H.; Bolger, M.E.; Alseekh, S.; Maß, J.; Pfaff, C.; et al. De Novo Assembly of a New Solanum pennellii Accession Using Nanopore Sequencing. Plant Cell 2017, 29, 2336–2348. [Google Scholar] [CrossRef]
  47. Feng, S.; Liu, Z.; Chen, H.; Li, N.; Yu, T.; Zhou, R.; Nie, F.; Guo, D.; Ma, X.; Song, X. PHGD: An integrative and user-friendly database for plant hormone-related genes. Imeta 2024, 3, e164. [Google Scholar] [CrossRef]
  48. Yu, T.; Bai, Y.; Liu, Z.; Wang, Z.; Yang, Q.; Wu, T.; Feng, S.; Zhang, Y.; Shen, S.; Li, Q.; et al. Large-scale analyses of heat shock transcription factors and database construction based on whole-genome genes in horticultural and representative plants. Hortic. Res. 2022, 9, uhac035. [Google Scholar] [CrossRef]
  49. Sayers, E.W.; Bolton, E.E.; Brister, J.R.; Canese, K.; Chan, J.; Comeau, D.C.; Connor, R.; Funk, K.; Kelly, C.; Kim, S.; et al. Database resources of the national center for biotechnology information. Nucleic Acids Res. 2022, 50, D20–D26. [Google Scholar] [CrossRef]
  50. Emms, D.M.; Kelly, S. OrthoFinder: Phylogenetic orthology inference for comparative genomics. Genome Biol. 2019, 20, 238. [Google Scholar] [CrossRef]
  51. Qiao, X.; Li, Q.; Yin, H.; Qi, K.; Li, L.; Wang, R.; Zhang, S.; Paterson, A.H. Gene duplication and evolution in recurring polyploidization–diploidization cycles in plants. Genome Biol. 2019, 20, 38. [Google Scholar] [CrossRef]
  52. Song, X.; Zhang, Y.; Li, C.; Li, N.; Shen, S.; Yu, T.; Liu, Z.; Zhou, R.; Cao, R.; Ma, X.; et al. Two major duplication events shaped the transcription factor repertoires in Solanaceae species. Sci. Hortic. 2024, 323, 112484. [Google Scholar] [CrossRef]
  53. Li, P.; Quan, X.; Jia, G.; Xiao, J.; Cloutier, S.; You, F.M. RGAugury: A pipeline for genome-wide prediction of resistance gene analogs (RGAs) in plants. BMC Genom. 2016, 17, 852. [Google Scholar] [CrossRef] [PubMed]
  54. Chen, C.; Chen, H.; Zhang, Y.; Thomas, H.R.; Frank, M.H.; He, Y.; Xia, R. TBtools: An Integrative Toolkit Developed for Interactive Analyses of Big Biological Data. Mol. Plant 2020, 13, 1194–1202. [Google Scholar] [CrossRef] [PubMed]
  55. Sun, P.; Jiao, B.; Yang, Y.; Shan, L.; Li, T.; Li, X.; Xi, Z.; Wang, X.; Liu, J. WGDI: A user-friendly toolkit for evolutionary analyses of whole-genome duplications and ancestral karyotypes. Mol. Plant 2022, 15, 1841–1851. [Google Scholar] [CrossRef] [PubMed]
  56. Rozewicki, J.; Li, S.; Amada, K.M.; Standley, D.M.; Katoh, K. MAFFT-DASH: Integrated protein sequence and structural alignment. Nucleic Acids Res. 2019, 47, W5–W10. [Google Scholar] [CrossRef]
  57. Price, M.N.; Dehal, P.S.; Arkin, A.P. FastTree: Computing large minimum evolution trees with profiles instead of a distance matrix. Mol. Biol. Evol. 2009, 26, 1641–1650. [Google Scholar] [CrossRef]
  58. Bailey, T.L.; Johnson, J.; Grant, C.E.; Noble, W.S. The MEME Suite. Nucleic Acids Res. 2015, 43, W39–W49. [Google Scholar] [CrossRef]
  59. Letunic, I.; Bork, P. Interactive Tree of Life (iTOL) v6: Recent updates to the phylogenetic tree display and annotation tool. Nucleic Acids Res. 2024, 52, W78–W82. [Google Scholar] [CrossRef]
  60. Szklarczyk, D.; Kirsch, R.; Koutrouli, M.; Nastou, K.; Mehryary, F.; Hachilif, R.; Gable, A.L.; Fang, T.; Doncheva, N.T.; Pyysalo, S.; et al. The STRING database in 2023: Protein-protein association networks and functional enrichment analyses for any sequenced genome of interest. Nucleic Acids Res 2023, 51, D638–D646. [Google Scholar] [CrossRef]
  61. Shannon, P.; Markiel, A.; Ozier, O.; Baliga, N.S.; Wang, J.T.; Ramage, D.; Amin, N.; Schwikowski, B.; Ideker, T. Cytoscape: A software environment for integrated models of biomolecular interaction networks. Genome Res. 2003, 13, 2498–2504. [Google Scholar] [CrossRef]
  62. Kim, D.; Paggi, J.M.; Park, C.; Bennett, C.; Salzberg, S.L. Graph-based genome alignment and genotyping with HISAT2 and HISAT-genotype. Nat. Biotechnol. 2019, 37, 907–915. [Google Scholar] [CrossRef]
  63. Beier, S.; Thiel, T.; Münch, T.; Scholz, U.; Mascher, M. MISA-web: A web server for microsatellite prediction. Bioinformatics 2017, 33, 2583–2585. [Google Scholar] [CrossRef] [PubMed]
  64. Jaillon, O.; Aury, J.-M.; Noel, B.; Policriti, A.; Clepet, C.; Casagrande, A.; Choisne, N.; Aubourg, S.; Vitulo, N.; Jubin, C.; et al. The grapevine genome sequence suggests ancestral hexaploidization in major angiosperm phyla. Nature 2007, 449, 463–467. [Google Scholar] [PubMed]
  65. Song, X.; Liu, H.; Shen, S.; Huang, Z.; Yu, T.; Liu, Z.; Yang, Q.; Wu, T.; Feng, S.; Zhang, Y.; et al. Chromosome-level pepino genome provides insights into genome evolution and anthocyanin biosynthesis in Solanaceae. Plant J. 2022, 110, 1128–1143. [Google Scholar] [CrossRef] [PubMed]
  66. Sumathi, M.; Yasodha, R. Microsatellite resources of Eucalyptus: Current status and future perspectives. Bot. Stud. 2014, 55, 73. [Google Scholar] [CrossRef]
  67. Victoria, F.C.; da Maia, L.C.; de Oliveira, A.C. In silico comparative analysis of SSR markers in plants. BMC Plant Biol. 2011, 11, 15. [Google Scholar] [CrossRef]
  68. Rengel, D.; Clemente, H.S.; Servant, F.; Ladouce, N.; Paux, E.; Wincker, P.; Couloux, A.; Sivadon, P.; Grima-Pettenati, J. A new genomic resource dedicated to wood formation in Eucalyptus. BMC Plant Biol. 2009, 9, 36. [Google Scholar] [CrossRef]
  69. Zhuang, Y.; Zhou, X.; Wang, S. Genetic diversity of NBS–LRR class disease-resistance gene analogs in cultivated and wild eggplants. Plant Syst. Evol. 2012, 298, 1399–1406. [Google Scholar] [CrossRef]
  70. Belkhadir, Y.; Subramaniam, R.; Dangl, J.L. Plant disease resistance protein signaling: NBS–LRR proteins and their partners. Curr. Opin. Plant Biol. 2004, 7, 391–399. [Google Scholar] [CrossRef]
  71. Qian, L.-H.; Zhou, G.-C.; Sun, X.-Q.; Lei, Z.; Zhang, Y.-M.; Xue, J.-Y.; Hang, Y.-Y. Distinct Patterns of Gene Gain and Loss: Diverse Evolutionary Modes of NBS-Encoding Genes in Three Solanaceae Crop Species. G3 Genes|Genomes|Genet. 2017, 7, 1577–1585. [Google Scholar] [CrossRef]
  72. Singh, A.K.; Singh, P.K.; Arya, M.; Singh, N.K.; Singh, U.S. Molecular Screening of Blast Resistance Genes in Rice using SSR Markers. Plant Pathol. J. 2015, 31, 12–24. [Google Scholar] [CrossRef]
  73. Wang, C.; Zhang, Y.; Han, D.; Kang, Z.; Li, G.; Cao, A.; Chen, P. SSR and STS markers for wheat stripe rust resistance gene Yr26. Euphytica 2008, 159, 359–366. [Google Scholar] [CrossRef]
Figure 1. Identification and duplication analysis of NBS-LRR gene family in 9 Solanaceae species. CNL: CC-NBS-LRR, RNL: RPW8-NBS-LRR, TNL: TIR-NBS-LRR. (a) Classification of NBS-LRR family genes in Solanaceae species. (b) The left panel presents a species phylogenetic tree of Solanaceae, where hexagonal markers denote WGT events. The right panel contains a heatmap that illustrates the types of gene duplication across the Solanaceae genome. The more duplicate gene pairs in the whole genome, the more the color tends towards pink; conversely, the fewer the duplicate gene pairs, the more the color tends towards green. (c) The duplication types of NBS-LRR gene family in the Solanaceae genome. In each subfamily, the greater the number of duplicate gene pairs, the more the color tends towards green, and the fewer the duplicate gene pairs, the more the color tends towards yellow. WGD: Whole Genome Duplications, TD: Tandem Duplications, PD: proximal duplications, TRD: Transposon Related Duplications, DSD: Dispersed Segmental Duplications.
Horticulturae 10 01293 g001
Figure 2. Chromosomal localization and selective pressure analysis of NBS-LRR family in S. pennellii and S. macrocarpon. (a,b) The distribution of NBS-LRR genes on chromosomes for S. pennellii and S. macrocarpon, respectively. Red: CNL; blue: TNL; green: RNL; purple: SSR marker genes. (c) Statistical distribution map of NBS-LRR genes on chromosomes. Blue: genes located at the center of the chromosome; orange: genes located at the edge of the chromosome; yellow: genes are not located on the chromosomes. (d,e) The distribution of Ks homologs across various species for S. pennellii and S. macrocarpon, respectively. The red segments: ancient WGT event; green segments: Solanaceae-specific WGT event.
Horticulturae 10 01293 g002
Figure 3. NBS-LRR family gene tree and distribution of conserved motifs. (a) The gene tree of the TNL, CNL, and RNL subfamilies. The colors of the branches within the circle represent different species, the color in the middle of the tree represents the classification of the subfamilies, and the color of the outer circle of the tree represents the motif distribution. (b) The structure of the motifs. (c) The distribution of motifs in subfamily genes across different species.
Horticulturae 10 01293 g003
Figure 4. TNL, CNL, and RNL subfamily network maps. (a) Interaction map of all NBS-LRR genes, and (bf) the map after clustering according to (a).
Horticulturae 10 01293 g004
Figure 5. Expression heatmap and distribution of genes containing SSR. (a) Whole-genome SSR locus statistical information. (b) Proportion of SSR genes in the whole genome. (c) The expression heatmap of SSR genes in different tissues. The color bands correspond to the heatmap matrix data, with colors close to red indicating high expression, and colors close to white indicating low expression. (d) The expression heatmap of SSR genes in response to various pathogen infections. The color bands correspond to the heatmap matrix data, with colors close to red indicating high expression, and colors close to white indicating low expression. Pi-5D: Phytophthora infestans; TDW-5D: Control; PepMov-3D: Pepper mottle virus; TMV-P0-3D: Tobacco mosaic virus P0; Mock-3D: Control; aMe: aphid Macrosiphum euphorbiae; CMV: Cauliflower Mosaic Virus; fCf: fungus Cladosporium fulvum; nMi: nematode Meloidogyne incognita.
Horticulturae 10 01293 g005
Disclaimer/Publisher’s Note: The statements, opinions and data contained in all publications are solely those of the individual author(s) and contributor(s) and not of MDPI and/or the editor(s). MDPI and/or the editor(s) disclaim responsibility for any injury to people or property resulting from any ideas, methods, instructions or products referred to in the content.

