
Validity of a Centrifuge-Based Method for Determining the Water Retention Curve of Growing Media


Abstract
1. Introduction
2. Materials and Methods
2.1. The Studied Growing Media
2.2. Reference DIN Method (DIN EN 13041, 2011)
2.3. Centrifuge Method
2.3.1. Theoretical Background
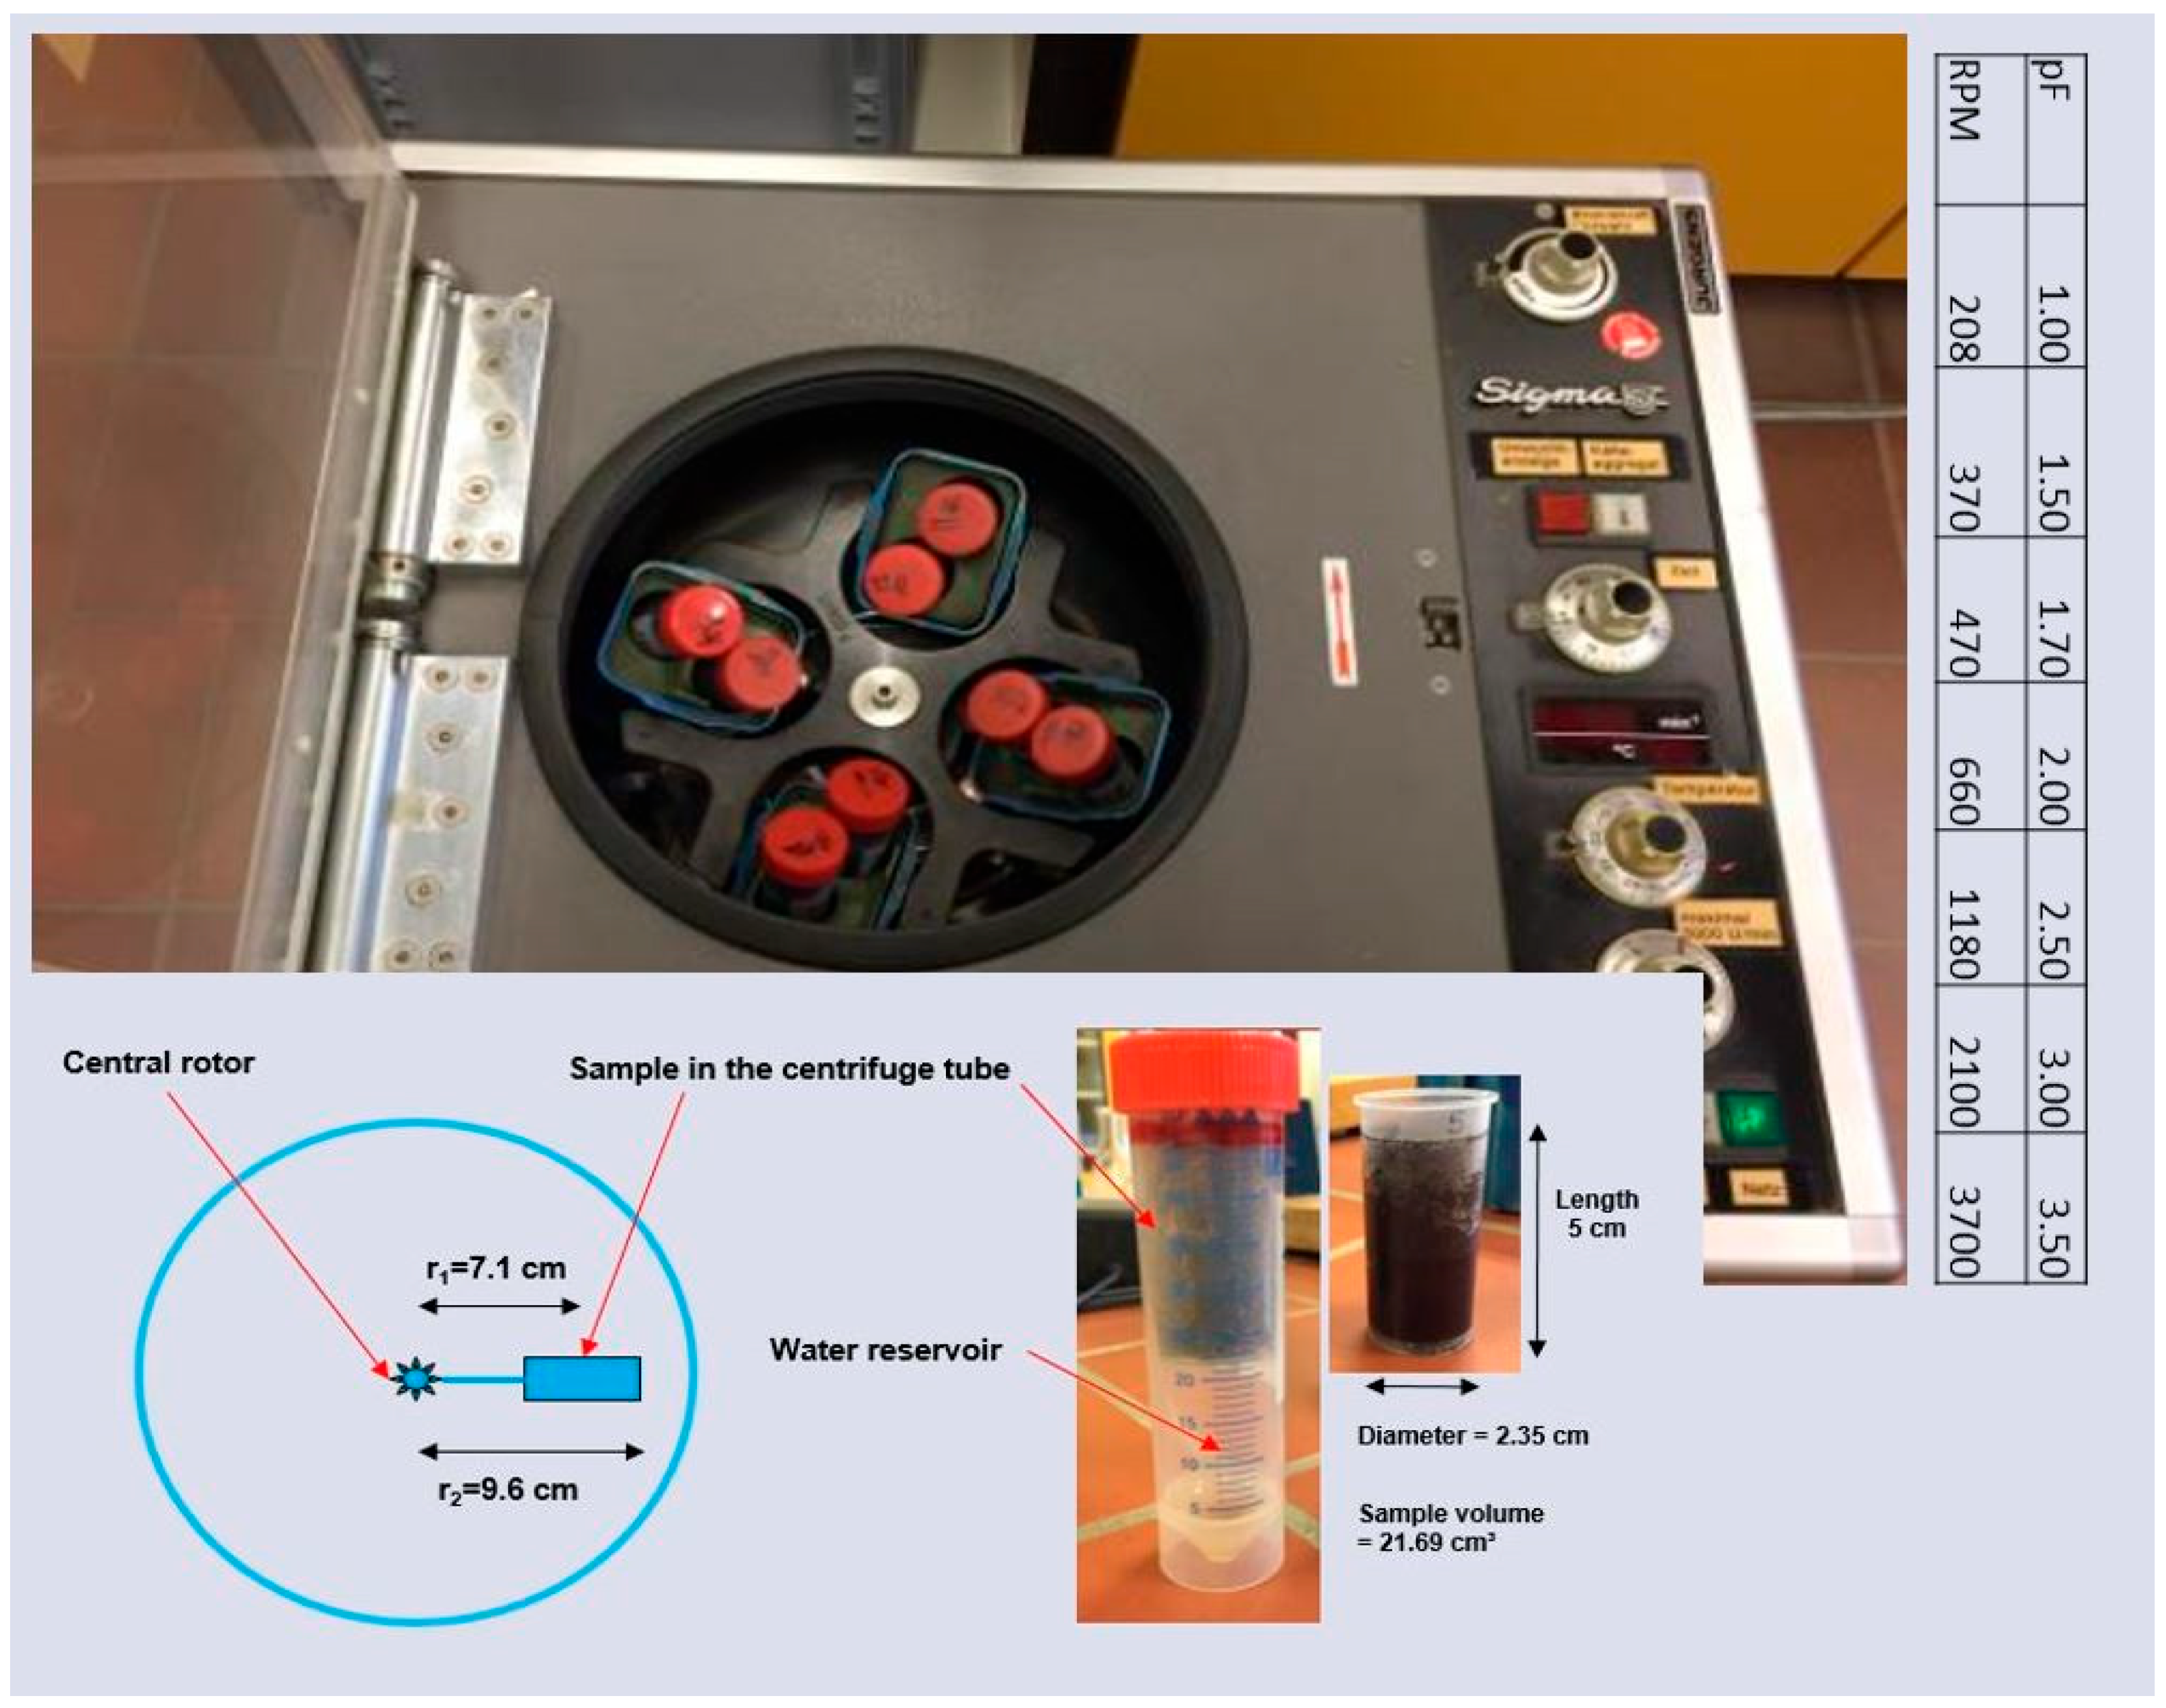
2.3.2. Description of the Centrifuge Apparatus
2.3.3. The Measurement Procedure
2.4. Statistical Indicators
3. Results and Discussion
3.1. Bulk Density of the Substrates
3.2. Duration of the Centrifugation
3.3. Comparison of the Centrifuge Method to the Reference DIN Method
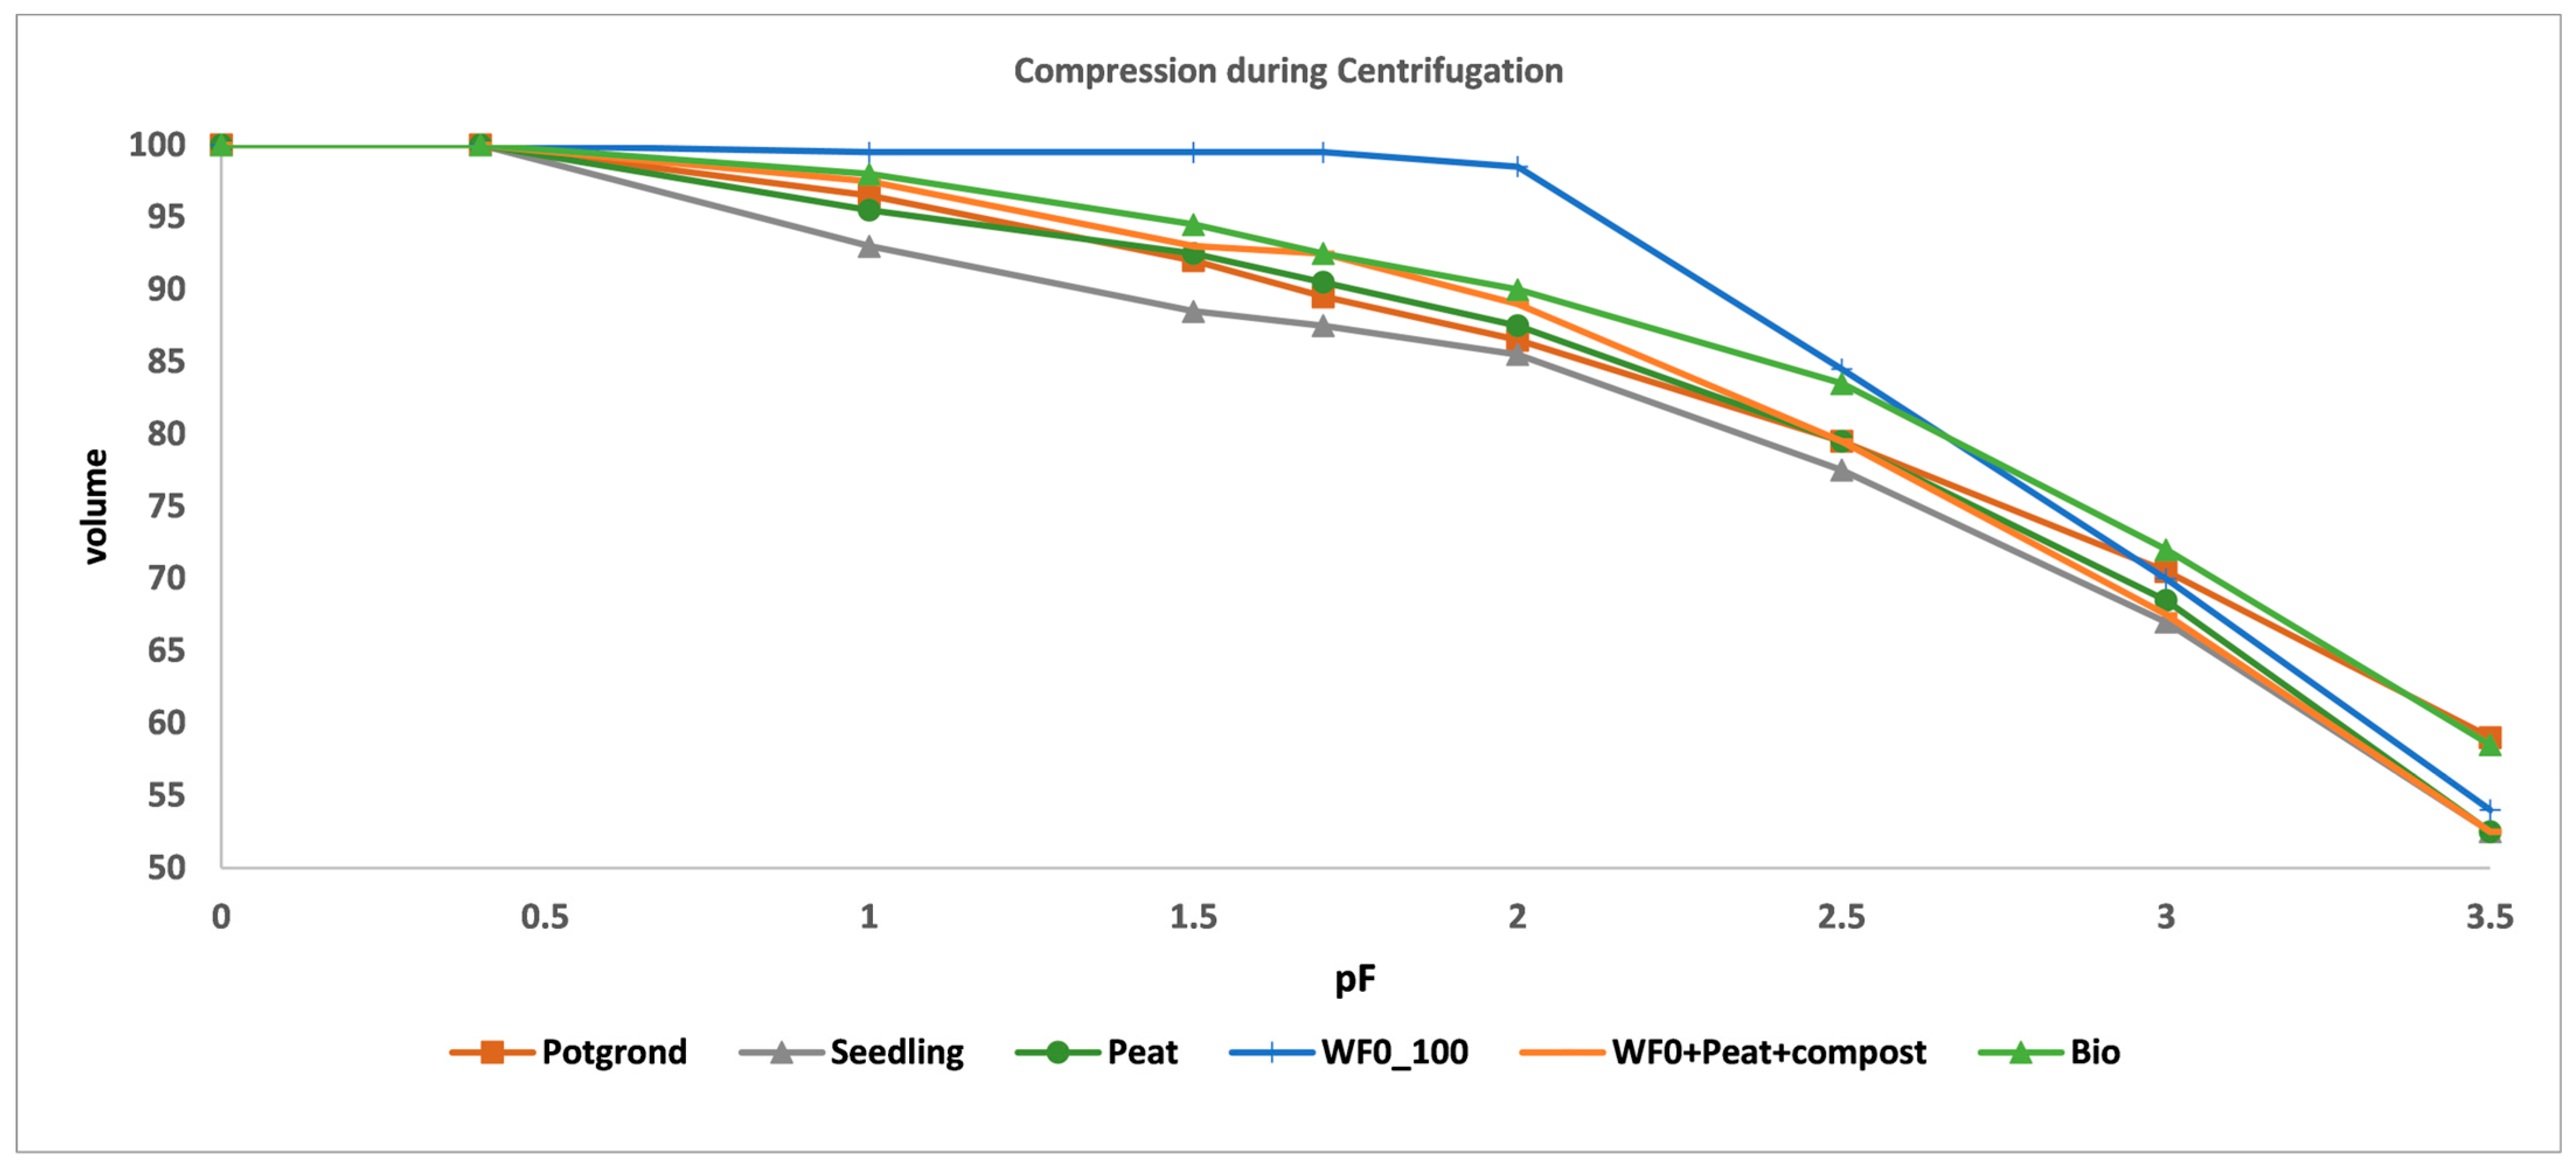
3.4. Compression During Centrifugation
4. Conclusions
Author Contributions
Funding
Data Availability Statement
Conflicts of Interest
References
- Chamindu Deepagoda, T.; Chen Lopez, J.C.; Møldrup, P.; De Jonge, L.W.; Tuller, M. Integral parameters for characterizing water, energy, and aeration properties of soilless plant growth media. J. Hydrol. 2013, 502, 120–127. [Google Scholar] [CrossRef]
- Gruda, N.S. Advances in Soilless Culture and Growing Media in Today’s Horticulture—An Editorial. Agronomy 2022, 12, 2773. [Google Scholar] [CrossRef]
- Gruda, N.S.; Fernández, J.A. Optimising Soilless Culture Systems and Alternative Growing Media to Current Used Materials. Horticulturae 2022, 8, 292. [Google Scholar] [CrossRef]
- Raviv, M. Theory and Practice. In Soilless Culture: Theory and Practice, 2nd ed.; Lieth, J.H., Bar-Tal, A., Eds.; Elsevier: Amsterdam, The Netherlands, 2019. [Google Scholar]
- Barrett, G.E.; Alexander, P.D.; Robinson, J.S.; Bragg, N.C. Achieving environmentally sustainable growing media for soilless plant cultivation systems—A review. Sci. Hortic. 2016, 212, 220–234. [Google Scholar] [CrossRef]
- Caron, J.; Price, J.S.; Rochefort, L. Physical Properties of Organic Soil: Adapting Mineral Soil Concepts to Horticultural Growing Media and Histosol Characterization. Vadose Zone J. 2015, 14, vzj2014.10.0146. [Google Scholar] [CrossRef]
- Bunt, A.C. Some physical properties of pot-plant composts and their effect on plant growth: I. Bulky physical conditioners. Plant Soil 1960, 13, 322–332. [Google Scholar] [CrossRef]
- Lai, Y.; Garg, A.; Chang, K.; Xing, X.; Fan, J.; Liang, J.; Yu, M. A novel method to inverse the water retention curves with consideration of volume change during centrifuge testing. Soil Sci. Soc. Am. J. 2021, 85, 207–216. [Google Scholar] [CrossRef]
- Liang, J.; Xing, X.; Gao, Y. A modified physical-based water-retention model for continuous soil moisture estimation during infiltration: Experiments on saline and non-saline soils. Arch. Agron. Soil Sci. 2020, 66, 1344–1357. [Google Scholar] [CrossRef]
- Bayat, H.; Mazaheri, B.; Mohanty, B.P. Estimating soil water characteristic curve using landscape features and soil thermal properties. Soil Tillage Res. 2019, 189, 1–14. [Google Scholar] [CrossRef]
- Khanzode, R.M.; Vanapalli, S.K.; Fredlund, D.G. Measurement of soil-water characteristic curves for fine-grained soils using a small-scale centrifuge. Can. Geotech. J. 2002, 39, 1209–1217. [Google Scholar] [CrossRef]
- Rezanezhad, F.; Price, J.S.; Quinton, W.L.; Lennartz, B.; Milojevic, T.; Van Cappellen, P. Structure of peat soils and implications for water storage, flow and solute transport: A review update for geochemists. Chem. Geol. 2016, 429, 75–84. [Google Scholar] [CrossRef]
- Blanco, C.M.G.; Gomez, V.M.B.; Crespo, P.; Ließ, M. Spatial prediction of soil water retention in a Páramo landscape: Methodological insight into machine learning using random forest. Geoderma 2018, 316, 100–114. [Google Scholar] [CrossRef]
- Nimmo, J.R.; Perkins, K.; Lewis, A.M. Steady-state centrifuge [simultaneous determination of water transmission and retention properties--direct methods--laboratory]. In Methods of Soil Analysis, Part 4, Physical Methods; Dane, J.H., Topp, G.C., Eds.; Soil Science Society of America, Inc.: Madison, WI, USA, 2002; pp. 903–916. [Google Scholar]
- Van Genuchten, M.T. A closed-form equation for predicting the hydraulic conductivity of unsaturated soils. Soil Sci. Soc. Am. J. 1980, 44, 892–898. [Google Scholar] [CrossRef]
- Fredlund, D.G.; Xing, A. Equations for the soil-water characteristic curve. Can. Geotech. J. 1994, 31, 521–532. [Google Scholar] [CrossRef]
- Kosugi, K. Three-parameter lognormal distribution model for soil water retention. Water Resour. Res. 1994, 30, 891–901. [Google Scholar] [CrossRef]
- Khaksar Najafi, E.; Arabani, M.; Chenari, R.J. Investigation of Water-Retention Characteristics of Alkali-Activated Clay-Fly Ash Using Small Geotechnical Centrifuge. J. Mater. Civ. Eng. 2022, 34. [Google Scholar] [CrossRef]
- Brooks, R.H.; Corey, A.T. Hydraulic Properties of Porous Media; Hydrology Paper, No. 3; Civil Engineering Department, Colorado State University: Fort Collins, CO, USA, 1964. [Google Scholar]
- Zhang, X.; Mavroulidou, M.; Gunn, M.J. A study of the water retention curve of lime-treated London Clay. Acta Geotech. 2017, 12, 23–45. [Google Scholar] [CrossRef]
- DIN EN 13041; Soil Improvers and Growing Media-Determination of Physical Properties-Dry Bulk Density, Air Volume, Water Volume, Shrinkage Value and Total Pore Space. European Committee for Standardization (CEN): Brussels, Belgium, 2011.
- Amonette, J.E.; Flury, M.; Zhang, J. A Rapid Test for Plant-Available Water-Holding Capacity in Soil-Biochar Mixtures. In A Report for The Waste to Fuels Technology Partnership 2017–2019 Biennium: Advancing Organics Management In; Washington State University: Pullman, WA, USA, 2019. [Google Scholar]
- Reatto, A.; Da Silva, E.M.; Bruand, A.; Martins, E.S.; Lima, J.E.F.W. Validity of the centrifuge method for determining the water retention properties of tropical soils. Soil Sci. Soc. Am. J. 2008, 72, 1547–1553. [Google Scholar] [CrossRef]
- Smagin, A.V. Column-centrifugation method for determining water retention curves of soils and disperse sediments. Eurasian Soil Sc. 2012, 45, 416–422. [Google Scholar] [CrossRef]
- VDLUFA—Association of German Agricultural Analytic and Research Institutes. Methods Book I “Soil Analysis” (1st-6th Supplement Delivery), 4th ed.; VDLUFA-Verlag: Darmstadt, Germany, 1991. [Google Scholar]
- DIN EN 13039; Soil Improvers and Growing Media—Determination of Organic Content and ash. European Committee for Standardization (CEN): Berlin, Germany, 2009. (In German)
- Kemper, W.D.; Rosenau, R.C. Aggregate stability and size distribution. Methods Soil Anal.: Part 1 Phys. Mineral. Methods 1986, 5, 425–442. [Google Scholar]
- DIN EN ISO 11274; Soil Quality—Determination of the Water-Retention Characteristic—Laboratory Methods. International Organization for Standardization: Geneva, Switzerland, 2019.
- Gardner, R. A method of measuring the capillary tension of soil moisture over a wide moisture range. Soil Sci. 1937, 43, 277–284. [Google Scholar] [CrossRef]
- Smagin, A.V.; Sadovnikova, N.B.; Ali, M.M.B. The determination of the primary hydrophysical function of soil by the centrifuge method. Eurasian Soil Sci. 1998, 31, 1237–1244. [Google Scholar]
- Nimmo, J.R. Experimental testing of transient unsaturated flow theory at low water content in a centrifugal field. Water Resour. Res. 1990, 26, 1951–1960. [Google Scholar] [CrossRef]
- Bowers, W.H.; Mercer, J.J.; Pleasants, M.S.; Williams, D.G. A combination of soil water extraction methods quantifies the isotopic mixing of waters held at separate tensions in soil. Hydrol. Earth Syst. Sci. 2020, 24, 4045–4060. [Google Scholar] [CrossRef]
- Gruda, N.; Schnitzler, W.H. Suitability of wood fiber substrate for production of vegetable transplants: I. Physical properties of wood fiber substrates. Sci. Hortic. 2004, 100, 309–322. [Google Scholar] [CrossRef]
- Domeño, I.; Irigoyen, I.; Muro, J. New wood fibre substrates characterization and evaluation in hydroponic tomato culture. Eur. J. Hortic. Sci. 2010, 75, 89. [Google Scholar]


| Substrate | Composition | Type | Source |
|---|---|---|---|
| Peat | 100%vol black peat | Wholesale (comm. farms) | Floragard, Oldenburg, Germany |
| WF0 | 100%vol untreated wood fibre | Own mixture | --- |
| WF0_mixt. | 47.5%vol untreated wood fibre, 47.5% black peat, 5%vol green compost | Own mixture | --- |
| WF4 | 100%vol thermally treated wood fibre | Own mixture | --- |
| WF4_mixt. | 47.5%vol thermally treated wood fibre, 47.5% black peat, 5%vol green compost | Own mixture | --- |
| Black Potting Soil | 98% black peat, decorative material for covering grave areas | Garden market (end user) | Dehner Gartencenter, Rain, Germany |
| Potgrond | 100% black and white peat, used mainly for press pots | Wholesale (comm. farms) | Klasmann-Deilmann, Geeste, Germany |
| Clay substrate | 80%vol white and black peat, 20%vol clay granules | Wholesale (comm. farms) | Klasmann-Deilmann, Geeste, Germany |
| RHP15: special mixture | Black and white sphagnum peat, perlite, GreenFibre, TerrAktiv, and Argile | Wholesale (comm. farms) | Klasmann-Deilmann, Geeste, Germany |
| Seedling | 80% black and white peat, 20%vol coco fibre, mainly used for vegetable seedlings | Wholesale (comm. farms) | Klasmann-Deilmann, Geeste, Germany |
| Bio mixture | Green compost, coco fibre, composted pine bark, wood fibre, perlite, clay; percentages not given | Garden market (end user) | Dehner Gartencenter, Rain, Germany |
| Coco fibre | 100%vol composted coco fibre | Garden market (end user) | Pokon Evergreen BV, Veenendal, The Netherlands |
| Compost | 100%vol green compost | Wholesale (comm. farms) | Klasmann-Deilmann, Geeste, Germany |
| Typha_mixt. | 30%vol shredded Typha, 30%vol composted coco fibre, 10%vol compost, 30%vol composted pine bark | Own mixture | --- |
| MiscTyPt | 15%vol Miscanthus compost, 15%vol shredded Typha, 70% black peat | Own mixture | --- |
| Misc_mixt. | 30%vol Miscanthus compost, 30%vol composted coco fibre, 10%vol compost, 30%vol composted pine bark | Own mixture | --- |
| Substrate | pH | EC | Organic Matter | Particle Density | MWD | Pore Volume | Container Capacity | Air Capacity | Easily Available Water |
|---|---|---|---|---|---|---|---|---|---|
| --- | [dS·m−1] | [%mas] | [g·cm−3] | [mm] | [cm3·cm−3] | [cm3·cm−3] | [cm3·cm−3] | [cm3·cm−3] | |
| Peat | 3.2 | 0.05 | 96.47 | 1.57 | 1.18 | 0.935 | 0.785 | 0.151 | 0.295 |
| WF0 | 4.1 | 0.07 | 99.72 | 1.55 | 2.87 | 0.946 | 0.323 | 0.623 | 0.099 |
| WF0_mixt. | 3.8 | 0.11 | 81.43 | 1.68 | 1.71 | 0.930 | 0.615 | 0.316 | 0.218 |
| WF4 | 4.3 | 0.16 | 99.47 | 1.55 | 1.30 | 0.942 | 0.337 | 0.605 | 0.118 |
| WF4_mixt. | 3.9 | 0.13 | 83.56 | 1.66 | 1.19 | 0.925 | 0.627 | 0.298 | 0.277 |
| Black Potting Soil | 4.8 | 1.23 | 77.34 | 1.71 | 2.10 | 0.885 | 0.757 | 0.128 | 0.223 |
| Potgrond | 5.6 | 0.57 | 91.22 | 1.61 | 1.66 | 0.904 | 0.780 | 0.124 | 0.184 |
| Clay substrate | 5.8 | 0.57 | 68.83 | 1.78 | 3.62 | 0.918 | 0.720 | 0.199 | 0.253 |
| RHP15 | 5.9 | 0.29 | 65.09 | 1.81 | 4.93 | 0.924 | 0.626 | 0.298 | 0.203 |
| Seedling | 5.7 | 0.28 | 89.91 | 1.62 | 2.08 | 0.933 | 0.781 | 0.151 | 0.325 |
| Bio mixture | 6.5 | 0.80 | 51.67 | 1.93 | 2.94 | 0.888 | 0.434 | 0.454 | 0.100 |
| Coco fiber | 4.9 | 0.21 | 88.76 | 1.63 | 0.97 | 0.958 | 0.563 | 0.395 | 0.206 |
| Compost | 7.4 | 0.53 | 29.35 | 2.19 | 1.05 | 0.785 | 0.664 | 0.122 | 0.149 |
| MiscTyPt | 3.4 | 0.12 | 95.90 | 1.58 | 1.52 | 0.936 | 0.734 | 0.203 | 0.276 |
| Typha_mixt. | 6.4 | 0.21 | 65.35 | 1.81 | 2.52 | 0.918 | 0.484 | 0.433 | 0.086 |
| Misc_mixt. | 6.3 | 0.15 | 69.63 | 1.77 | 2.80 | 0.905 | 0.568 | 0.337 | 0.120 |
| Tapping Frequency | R2 | Slope | Bias Din vs. Tap | RMSE | Bias% |
|---|---|---|---|---|---|
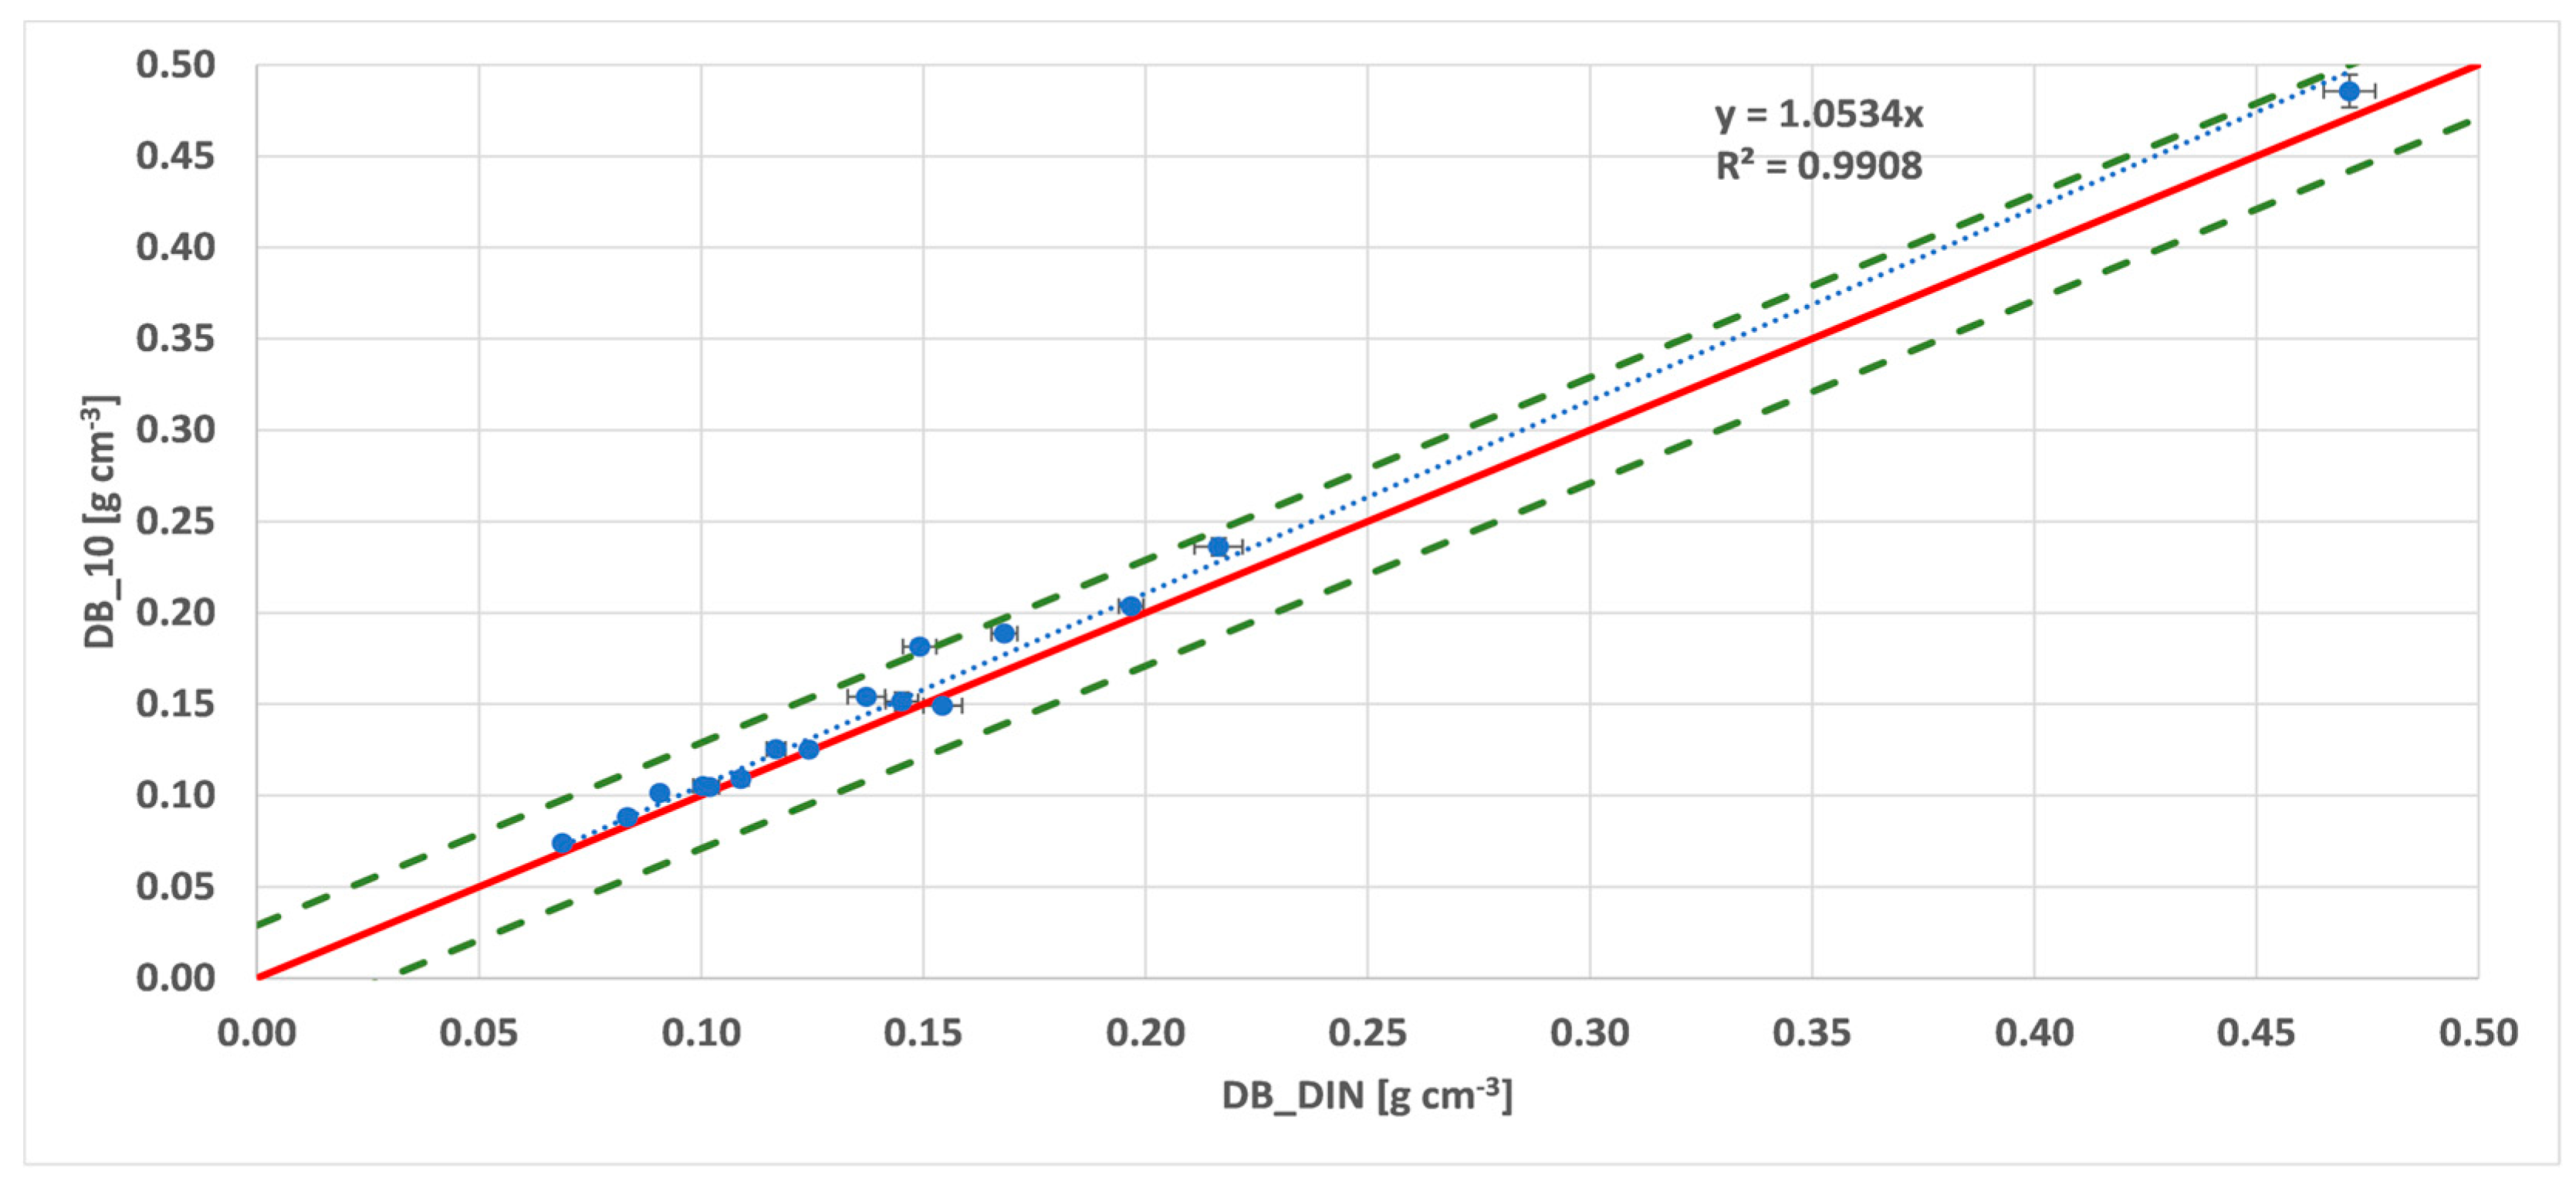
| tap 10 | 0.9908 | 1.0534 | −0.0094 | 0.0131 | −6.15 |
| tap 15 | 0.9882 | 1.0883 | −0.0157 | 0.0188 | −10.34 |
| tap 20 | 0.9865 | 1.1159 | −0.0202 | 0.0235 | −13.26 |
| pF Value | R2 | Slope | Bias Centr. vs. DIN | RMSE | Reproducibility Range of the DIN Method | Average Reproducibility Limit of the DIN Method |
|---|---|---|---|---|---|---|
| %vol | %vol | %vol | %vol | |||
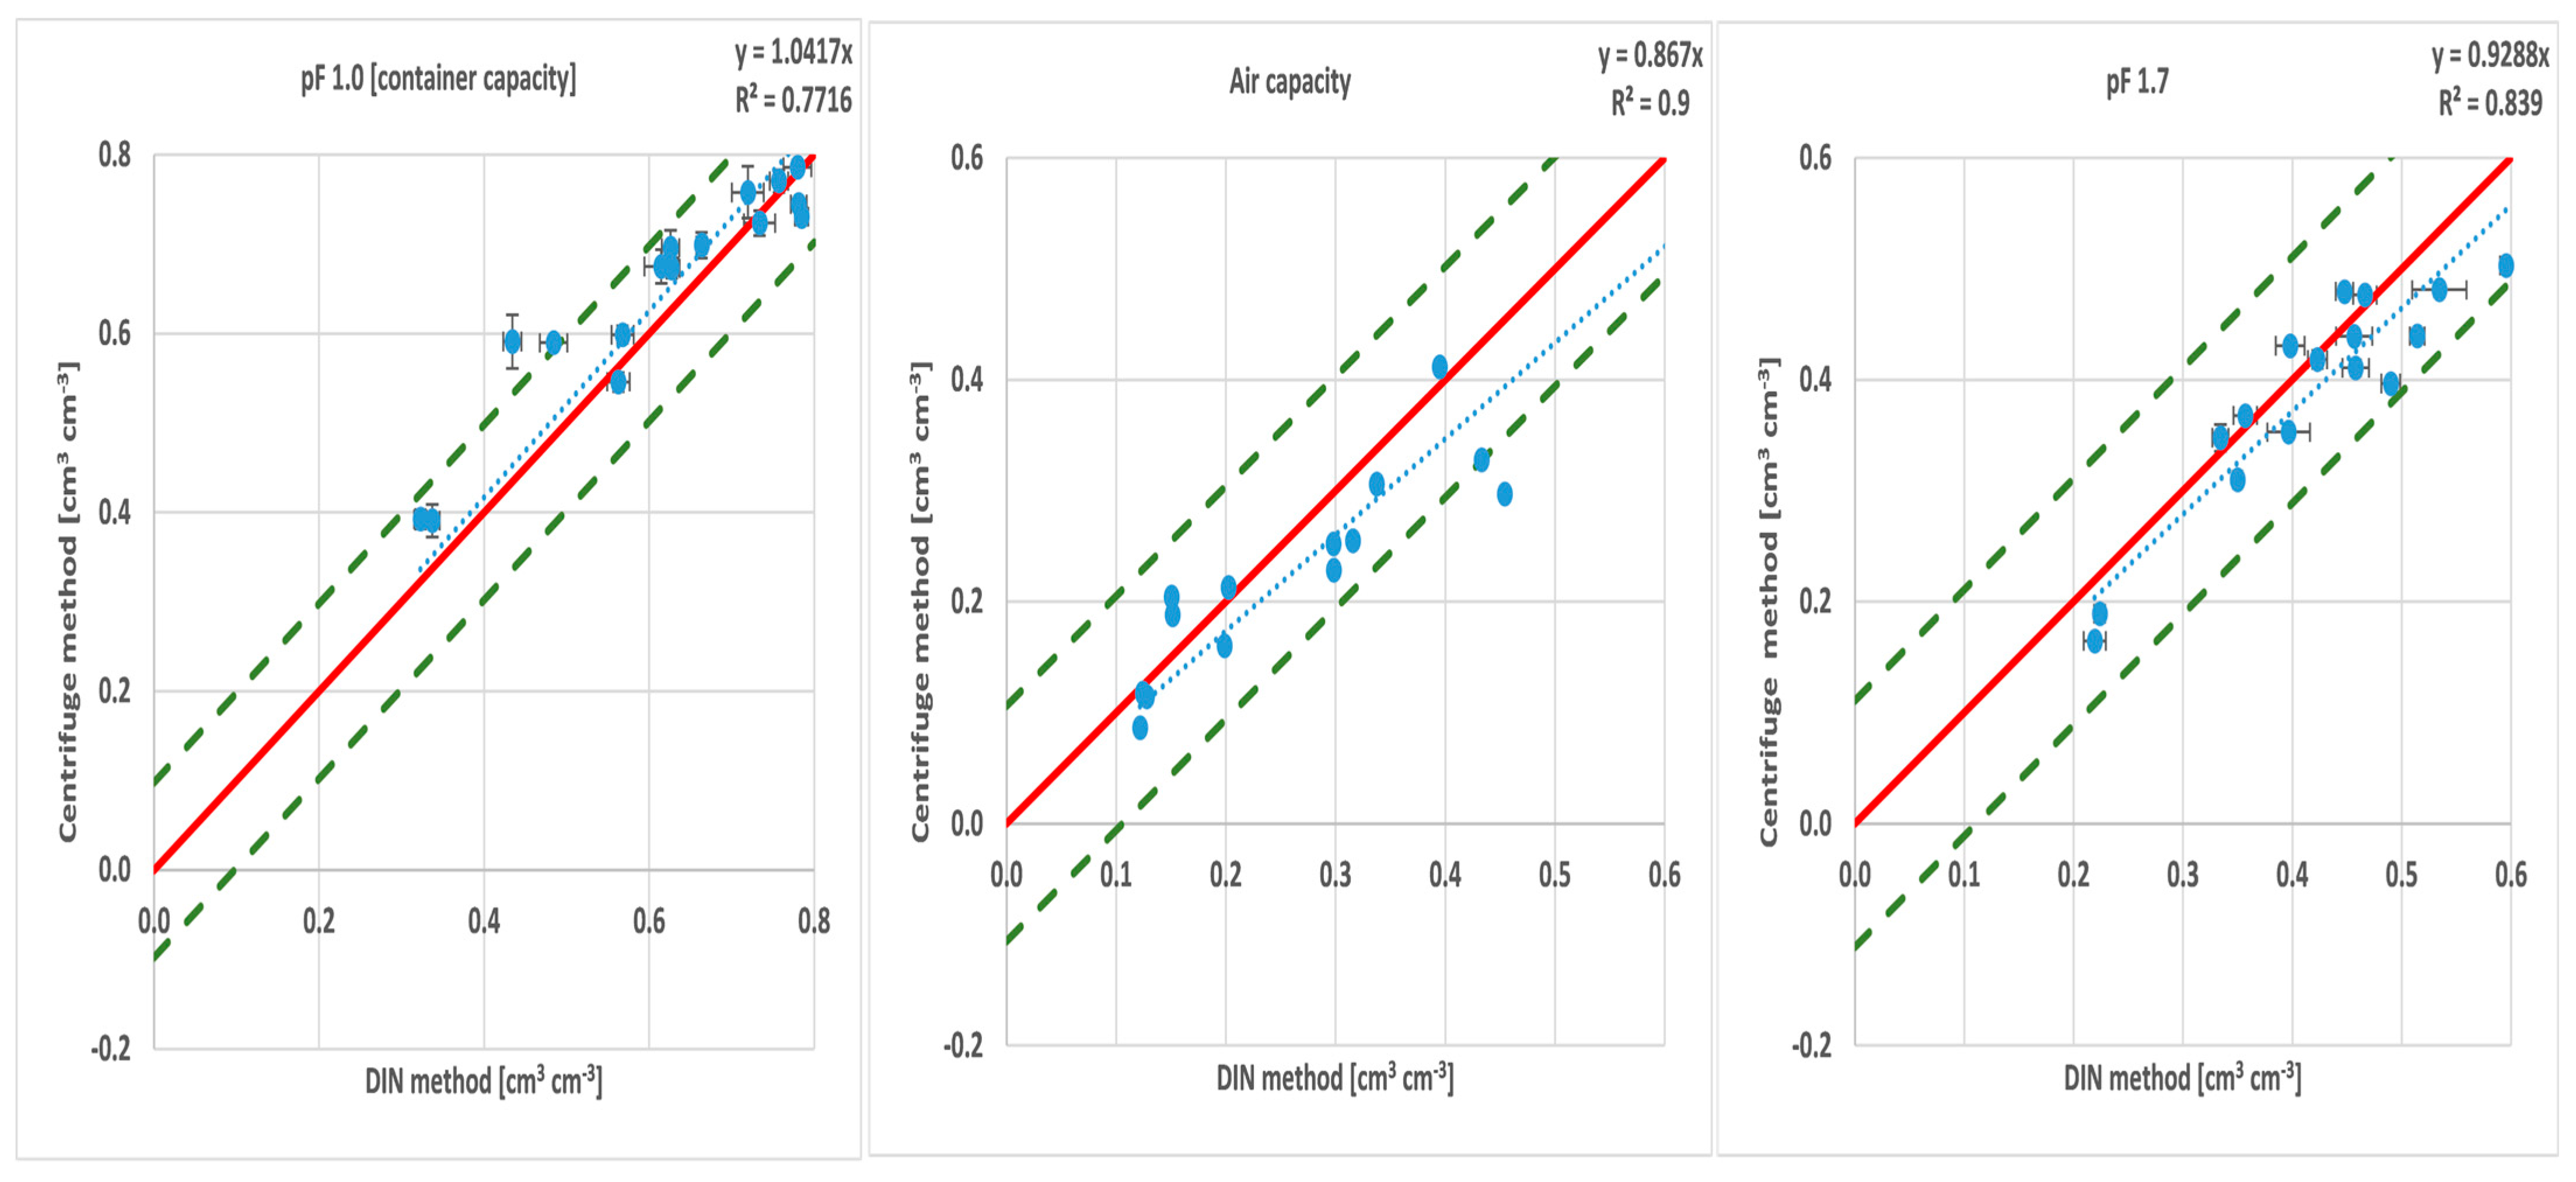
| pF1.0 | 0.9926 | 1.0417 | 3.5 | 6.3 | 9.13–10.68 | 9.80 |
| pF1.7 | 0.9908 | 0.9288 | −2.8 | 4.9 | 8.89–15.46 | 11.09 |
| pF2.5 | 0.9946 | 1.0658 | 1.6 | 2.9 | --- | --- |
| pF3.0 | 0.9877 | 1.054 | 1.0 | 3.2 | --- | --- |
| pF3.5 | 0.9684 | 1.0188 | 0.6 | 4.0 | --- | --- |
| EAW | 0.9265 | 1.0743 | 6.5 | 8.1 | --- | --- |
| AC | 0.9795 | 0.8670 | -3.5 | 6.3 | 9.31–11.94 | 10.62 |
| pF and Derived Values | R2 | Sign. at 95% |
|---|---|---|
| pF 1.0 | 0.2541 | * |
| pF 1.7 | 0.1342 | * |
| pF 2.5 | 0.0775 | * |
| pF 3.0 | 0.0142 | - |
| pF 3.5 | 0.0162 | - |
| EAW | 0.0009 | - |
| AC | 0.1832 | * |
Disclaimer/Publisher’s Note: The statements, opinions and data contained in all publications are solely those of the individual author(s) and contributor(s) and not of MDPI and/or the editor(s). MDPI and/or the editor(s) disclaim responsibility for any injury to people or property resulting from any ideas, methods, instructions or products referred to in the content. |
© 2024 by the authors. Licensee MDPI, Basel, Switzerland. This article is an open access article distributed under the terms and conditions of the Creative Commons Attribution (CC BY) license (https://creativecommons.org/licenses/by/4.0/).
Share and Cite
Muhammed, H.H.; Schumm, L.; Anlauf, R.; Reineke, T.; Daum, D. Validity of a Centrifuge-Based Method for Determining the Water Retention Curve of Growing Media. Horticulturae 2024, 10, 1255. https://doi.org/10.3390/horticulturae10121255
Muhammed HH, Schumm L, Anlauf R, Reineke T, Daum D. Validity of a Centrifuge-Based Method for Determining the Water Retention Curve of Growing Media. Horticulturae. 2024; 10(12):1255. https://doi.org/10.3390/horticulturae10121255
Chicago/Turabian StyleMuhammed, Hadi Hamaaziz, Lisa Schumm, Ruediger Anlauf, Tobias Reineke, and Diemo Daum. 2024. "Validity of a Centrifuge-Based Method for Determining the Water Retention Curve of Growing Media" Horticulturae 10, no. 12: 1255. https://doi.org/10.3390/horticulturae10121255
APA StyleMuhammed, H. H., Schumm, L., Anlauf, R., Reineke, T., & Daum, D. (2024). Validity of a Centrifuge-Based Method for Determining the Water Retention Curve of Growing Media. Horticulturae, 10(12), 1255. https://doi.org/10.3390/horticulturae10121255