Red Cell Distribution Width and Patient Outcome in Cardiovascular Disease: A ‘’Real-World’’ Analysis

 , ,
, , 
 and
and 
Abstract
:1. Introduction
2. Materials and Methods
2.1. Patients’ Selection
2.2. Study Outcomes
2.3. Statistical Analysis
3. Results
4. Discussion
5. Conclusions
Supplementary Materials
Author Contributions
Funding
Institutional Review Board Statement
Informed Consent Statement
Data Availability Statement
Conflicts of Interest
References
- Fava, C.; Cattazzo, F.; Hu, Z.D.; Lippi, G.; Montagnana, M. The role of red blood cell distribution width (RDW) in cardiovascular risk assessment: Useful or hype? Ann. Transl. Med. 2019, 7, 581. [Google Scholar] [CrossRef] [PubMed]
- Valenti, A.C.; Vitolo, M.; Manicardi, M.; Arrotti, S.; Magnavacchi, P.; Gabbieri, D.; Tondi, S.; Guiducci, V.; Losi, L.; Vignali, L.; et al. Red blood cell distribution width in patients undergoing transcatheter aortic valve implantation: Implications for outcomes. Int. J. Clin. Pract. 2021, 75, e14153. [Google Scholar] [CrossRef] [PubMed]
- Arbel, Y.; Weitzman, D.; Raz, R.; Steinvil, A.; Zeltser, D.; Berliner, S.; Chodick, G.; Shalev, V. Red blood cell distribution width and the risk of cardiovascular morbidity and all-cause mortality. A population-based study. Thromb. Haemost. 2014, 112, 300–307. [Google Scholar] [CrossRef]
- Dabbah, S.; Hammerman, H.; Markiewicz, W.; Aronson, D. Relation between red cell distribution width and clinical out-comes after acute myocardial infarction. Am. J. Cardiol. 2010, 105, 312–317. [Google Scholar] [CrossRef]
- Bujak, K.; Wasilewski, J.; Osadnik, T.; Jonczyk, S.; Kołodziejska, A.; Gierlotka, M.; Gąsior, M. The Prognostic Role of Red Blood Cell Distribution Width in Coronary Artery Disease: A Review of the Pathophysiology. Dis. Mark. 2015, 2015, 824624. (In English) [Google Scholar] [CrossRef] [Green Version]
- Su, C.; Liao, L.Z.; Song, Y.; Xu, Z.W.; Mei, W.Y. The role of red blood cell distribution width in mortality and cardiovascular risk among patients with coronary artery diseases: A systematic review and meta-analysis. J. Thorac. Dis. 2014, 6, 1429–1440. [Google Scholar] [CrossRef] [PubMed]
- Xanthopoulos, A.; Giamouzis, G.; Melidonis, A.; Kitai, T.; Paraskevopoulou, E.; Paraskevopoulou, P.; Patsilinakos, S.; Triposkidias, F.; Skoulargis, J. Red blood cell distribution width as a prognostic marker in patients with heart failure and diabetes mellitus. Cardiovasc. Diabetol. 2017, 16, 81. [Google Scholar] [CrossRef]
- Montagnana, M.; Cervellin, G.; Meschi, T.; Lippi, G. The role of red blood cell distribution width in cardiovascular and thrombotic disorders. Clin. Chem. Lab. Med. 2011, 50, 635–641. [Google Scholar] [CrossRef]
- Malavasi, V.L.; Proietti, M.; Spagni, S.; Valenti, A.C.; Battista, A.; Pettorelli, D.; Colella, J.; Vitolo, M.; Lip, G.Y.; Boriani, G. Usefulness of Red Cells Distribution Width to Predict Worse Outcomes in Patients With Atrial Fibrillation. Am. J. Cardiol. 2019, 124, 1561–1567. [Google Scholar] [CrossRef] [PubMed]
- Boriani, G.; Valenti, A.C.; Vitolo, M. Biomarkers in atrial fibrillation: A constant search for simplicity, practicality, and cost-effectiveness. Kardiol. Pol. 2021, 79, 243–245. [Google Scholar] [CrossRef]
- Valenti, A.C.; Vitolo, M.J.; Imberti, F.; Malavasi, V.L.; Boriani, G. Red cell distribution width: A routinely available biomarker with important clinical implications in patients with atrial fibrillation. Curr. Pharm. Des. 2021. [Google Scholar] [CrossRef]
- Wang, Y.L.; Hua, Q.; Bai, C.R.; Tang, Q. Relationship between red cell distribution width and short-term outcomes in acute coronary syndrome in a Chinese population. Intern. Med. 2011, 50, 2941–2945. [Google Scholar] [CrossRef] [Green Version]
- Abrahan, L.L.; Ramos, J.D.A.; Cunanan, E.L.; Tiongson, M.D.A.; Punzalan, F.E.R. Red Cell Distribution Width and Mortality in Patients With Acute Coronary Syndrome: A Meta-Analysis on Prognosis. Cardiol. Res. 2018, 9, 144–152. [Google Scholar] [CrossRef]
- Bao, D.; Luo, G.; Kan, F.; Wang, X.; Luo, J.; Jiang, C. Prognostic value of red cell distribution width in patients undergoing percutaneous coronary intervention: A meta-analysis. BMJ Open 2020, 10, e033378. [Google Scholar] [CrossRef]
- Huang, Y.L.; Hu, Z.D.; Liu, S.J.; Sun, Y.; Qin, Q.; Quin, B.D.; Zhang, W.W.; Zhang, J.R.; Zhong, R.Q.; Deng, A.M. Prognostic value of red blood cell distribution width for patients with heart failure: A systematic review and meta-analysis of cohort studies. PLoS ONE 2014, 9, e104861. [Google Scholar] [CrossRef] [PubMed] [Green Version]
- Shao, Q.; Li, L.; Li, G.; Liu, T. Prognostic value of red blood cell distribution width in heart failure patients: A meta-analysis. Int. J. Cardiol. 2015, 179, 495–499. [Google Scholar] [CrossRef] [PubMed]
- Hou, H.; Sun, T.; Li, C.; Li, Y.; Gou, Z.; Wang, W.; Li, D. An overall and dose-response meta-analysis of red blood cell distribution width and CVD outcomes. Sci. Rep. 2017, 7, 43420. [Google Scholar] [CrossRef] [Green Version]
- Liu, S.; Wang, P.; Shen, P.P.; Zhou, J.H. Predictive Values of Red Blood Cell Distribution Width in Assessing Severity of Chronic Heart Failure. Med. Sci. Monit. 2016, 22, 2119–2125. [Google Scholar] [CrossRef] [Green Version]
- Núñez, J.; Núñez, E.; Rizopoulos, D.; Miñana, G.; Bodì, V.; Bondanza, L.; Husser, O.; Merlos, P.; Santas, E.; Pascual-Figal, D.; et al. Red blood cell distribution width is longitudinally associated with mortality and anemia in heart failure patients. Circ. J. 2014, 78, 410–418. [Google Scholar] [CrossRef] [Green Version]
- Lippi, G.; Turcato, G.; Cervellin, G.; Sanchis-Gomar, F. Red blood cell distribution width in heart failure: A narrative review. World J. Cardiol. 2018, 10, 6–14. [Google Scholar] [CrossRef]
- Patel, M.R.; Peterson, E.D.; Dai, D.; Brennan, M.J.; Redberg, R.F.; Anderson, H.V.; Brindis, R.G.; Douglas, P.S. Low diagnostic yield of elective coronary angiography. N. Engl. J. Med. 2010, 362, 886–895. [Google Scholar] [CrossRef] [PubMed] [Green Version]
- Patel, K.V.; Ferrucci, L.; Ershler, W.B.; Longo, D.L.; Guralnik, J.M. Red blood cell distribution width and the risk of death in middle-aged and older adults. Arch. Intern. Med. 2009, 169, 515–523. [Google Scholar] [CrossRef] [PubMed] [Green Version]
- Pan, J.; Borné, Y.; Engström, G. The relationship between red cell distribution width and all-cause and cause-specific mortality in a general population. Sci. Rep. 2019, 9, 16208. [Google Scholar] [CrossRef] [PubMed] [Green Version]
- Pilling, L.C.; Atkins, J.L.; Duff, M.O.; Beaumont, R.N.; Jones, S.E.; Tyrell, J.; Kuo, C.L.; Ruth, K.S.; Tuke, M.A.; Yaghootkar, H.; et al. Red blood cell distribution width: Genetic evidence for aging pathways in 116,666 volunteers. PLoS ONE 2017, 12, e0185083. [Google Scholar] [CrossRef] [PubMed] [Green Version]

| RDW Tertiles | |||||
|---|---|---|---|---|---|
| Overall Cohort (n = 700) | Lowest (≤13.1% cv) (n = 211) | Intermediate (13.2%–14% cv) (n = 254) | Highest (≥14.1% cv) (n = 235) | p-Value | |
| Demographic Characteristics | |||||
| Age | 72.7 [62.6–80] | 67.7 [56.5–76.7] | 72.6 [62.9–79.8] | 76.7 [67.5–83] | <0.01 |
| Male sex | 434 (62%) | 132 (62.6%) | 163 (64.2%) | 139 (59.1%) | 0.510 |
| BMI | 26.6 [23.8–29.4] | 25.8 [24.1–29.2] | 27 [23.6–29.4] | 26.8 [23.9–30.1] | 0.546 |
| Clinical Characteristics | |||||
| Left ventricular ejection fraction <40% | 115 (16.4%) | 24 (11.6%) | 30 (11.8%) | 61 (26%) | <0.001 |
| GFR CKD-EPI < 60 mL/min | 209 (29.9%) | 28 (13.3%) | 63 (24.8%) | 118 (50.2%) | <0.001 |
| Hypertension | 471 (67.3%) | 132 (62.6%) | 172 (67.7%) | 167 (71.1%) | 0.158 |
| Diabetes | 168 (24%) | 36 (17.1%) | 72 (28.3%) | 60 (25.5%) | 0.014 |
| Dyslipidemia | 353 (50.4%) | 121 (57.3%) | 126 (49.6%) | 106 (45.1%) | 0.034 |
| Active smokers | 196 (28%) | 60 (28.4%) | 80 (31.5%) | 56 (23.8%) | 0.166 |
| Non elective hospital admissions | 527 (75.3%) | 152 (72%) | 183 (72%) | 192 (81.7%) | 0.020 |
| Diagnosis at discharge | <0.001 | ||||
| Chronic coronary syndromes | 93 (13.3%) | 33 (15.6%) | 43 (16.9%) | 17 (7.2%) | |
| Acute coronary syndromes | 289 (41.3%) | 107 (50.7%) | 105 (41.3%) | 77 (32.8%) | |
| Heart failure | 103 (14.7%) | 9 (4.3%) | 25 (9.8%) | 69 (24.4%) | |
| Valvular diseases and PE | 86 (12.3%) | 33 (15.6%) | 30 (11.8%) | 23 (9.8%) | |
| Arrhythmias | 129 (18.4%) | 29 (13.7%) | 51 (20.1%) | 40 (20.9%) | |
| Laboratory Parameters | |||||
| HB (g/dL), median [IQR] | 13.3 [11.9–14.4] | 13.9 [12.9–14.7] | 13.5 [12.3–14.6] | 12 [10.8–13.4] | <0.001 |
| MCV (fl), median [IQR] | 88 [85–91.2] | 88.4 [85.9–90.9] | 88 [85.7–91.4] | 86.9 [81.8–91.5] | 0.004 |
| MCH (pg), median [IQR] | 29.7 [28.3–30.8] | 29.9 [29.2–31] | 29.9 [28.9–30.8] | 28.6 [26.2–30.3] | <0.001 |
| MCHC (g/dL), median [IQR] | 33.6 [32.7–34.3] | 34 [33.5–34.5] | 33.7 [33–34.4] | 32.6 [31.6–33.7] | <0.001 |
| WBC (× 103/mm3), median [IQR] | 7.4 [6–9.1] | 7.2 [5.7–9] | 7.3 [6–9.2] | 7.5 [6–9.3] | 0.430 |
| RBC (× 109/mm3), median [IQR] | 4.5 [4.1–4.9] | 4.5 [4.2–4.9] | 4.5 [4.1–4.9] | 4.3 [3.9–4.8] | <0.001 |
| PLT (× 103/mmc), median [IQR] | 203 [169–244] | 206 [177–239] | 199 [165.5–235] | 204 [163–257] | 0.469 |
| HCT (%), median [IQR] | 39.5 [36–42.9] | 40.6 [37.8–43.4] | 40 [36.7–43.1] | 37.2 [34.1–41.2] | <0.001 |
| Neutrophils (× 10 3/mm3), median [IQR] | 4.7 [3.5–6.1] | 4.4 [3.4–5.7] | 4.7 [3.4–6] | 4.9 [3.8–6.6] | 0.007 |
| Lymphocyte (× 103/mm3), median [IQR] | 1.8 [1.3–2.3] | 1.9 [1.4–2.4] | 1.8 [1.4–2.3] | 1.6 [1.2–2.3] | <0.001 |
| RDW (cv%), median [IQR] | 13.7 [13–14.6] | 12.7 [12.4–13] | 13.6 [13.4–13.8] | 15.2 [14.6–16.4] | <0.001 |
| Creatinine (mg/dL), median [IQR] | 0.9 [0.8–1.2] | 0.9 [0.7–1] | 0.9 [0.8–1.1] | 1 [0.9–1.5] | <0.001 |
| GFR CKD-EPI (mL/min BSA), median [IQR] | 75.5 [52.9–89.4] | 85.3 [73.5–96.2] | 77.4 [59–89.8] | 58.9 [37.9–77.1] | <0.001 |
| RDW Tertiles | |||||
|---|---|---|---|---|---|
| Overall Cohort (n = 700) | Lowest (≤13.1% cv) (n = 211) | Intermediate (13.2%–14% cv) (n = 254) | Highest (≥14.1% cv) (n = 235) | p-Value | |
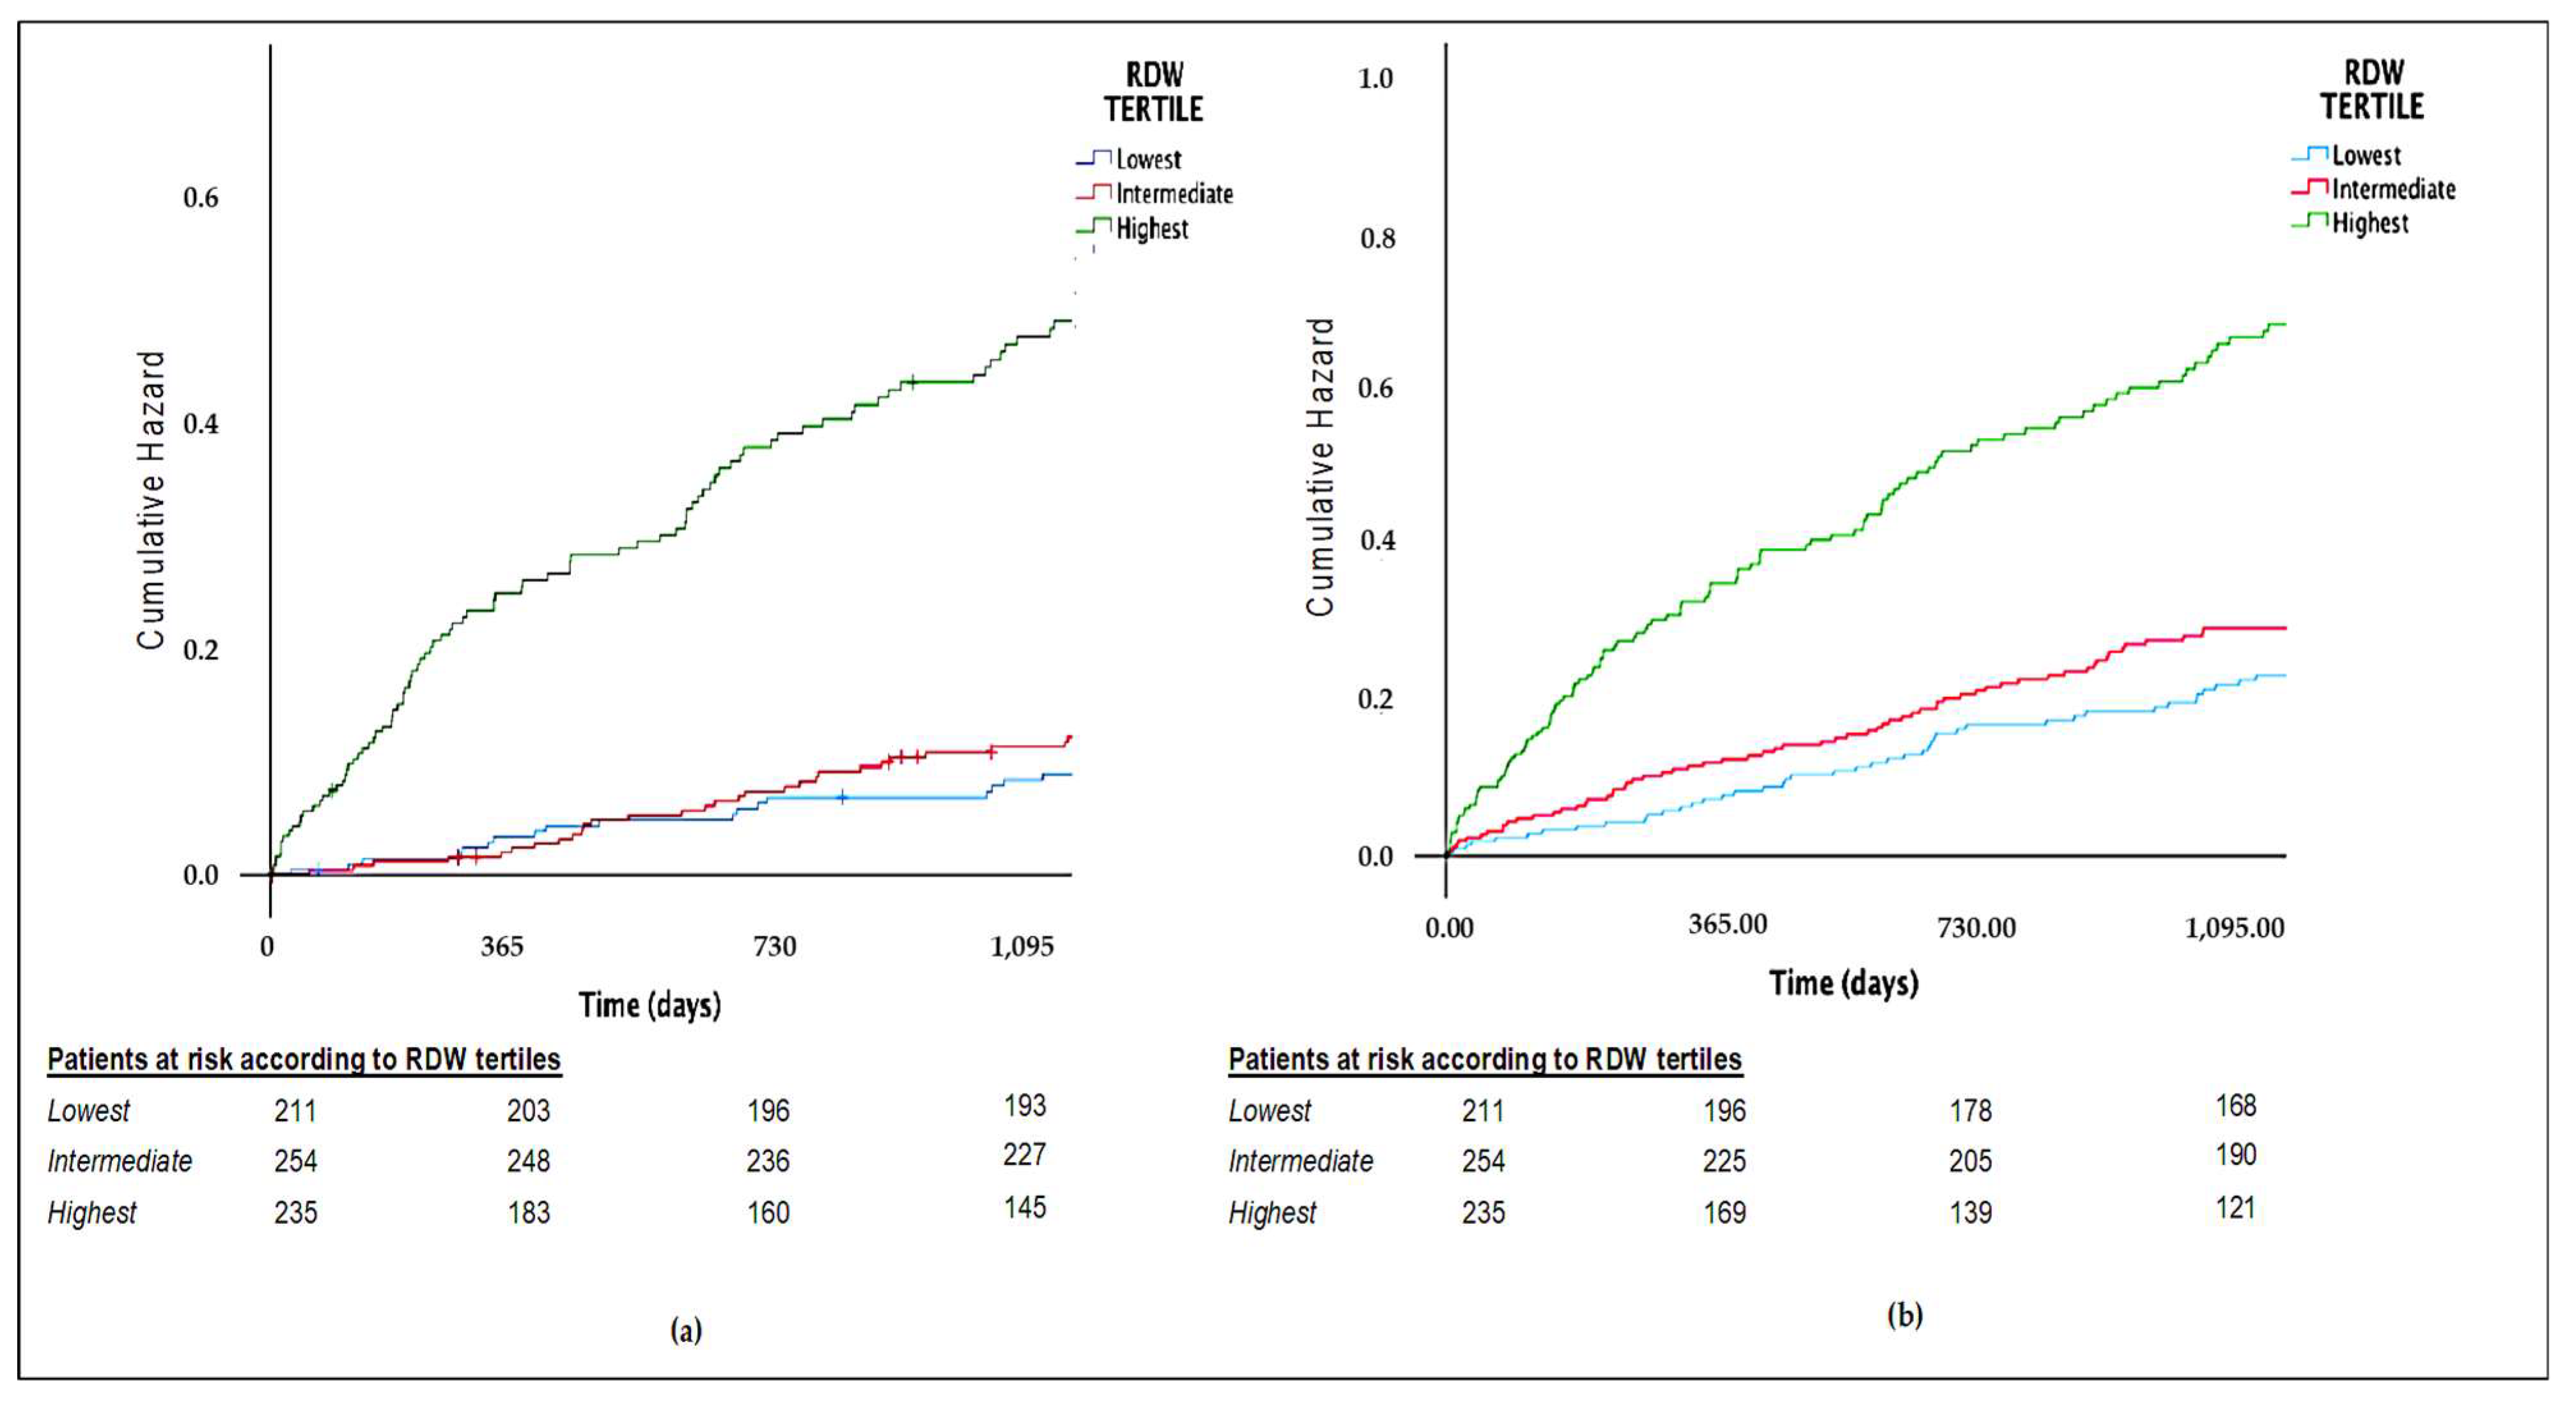
| All cause deaths | 153 (21.9%) | 21 (10%) | 33 (13%) | 99 (42.1%) | <0.001 |
| Acute coronary syndromes | 104 (14.9%) | 24 (11.4%) | 40 (15.7%) | 40 (17%) | 0.217 |
| TIA/stroke | 26 (3.7%) | 5 (2.4%) | 9 (3.5%) | 12 (5.1%) | 0.307 |
| Thromboembolic events | 3 (0.4%) | 1 (0.5%) | 1 (0.4%) | 1 (0.4%) | 0.991 |
| Composite end-point | 247 (35.3%) | 74 (23.8%) | 66 (31.4%) | 107 (59.8%) | <0.001 |
| Adjusted Analysis | ||||||||
|---|---|---|---|---|---|---|---|---|
| RDW Tertile | Unadjusted Analysis | Model 1 * | Model 2 ** | Model 3 *** | ||||
| HR | 95% CI, p-Value | HR | 95% CI, p-Value | HR | 95% CI, p-Value | HR | 95% CI, p-Value | |
| Lowest (ref.) | - | - | - | - | - | - | - | - |
| Intermediate | 1.34 | 0.77–2.31, p = 0.298 | 1.02 | 0.59–1.77, p = 0.942 | 0.89 | 0.52–1.56, p = 0.699 | 0.92 | 0.52–1.60, p = 0.763 |
| Highest | 5.42 | 3.39–8.7, p < 0.001 | 3.36 | 2.06–5.46, p < 0.001 | 2.70 | 1.64–4.44, p < 0.001 | 2.73 | 1.63–4.56, p < 0.001 |
| Adjusted Analysis | ||||||||
|---|---|---|---|---|---|---|---|---|
| RDW Tertile | Unadjusted Analysis | Model 1 * | Model 2 ** | Model 3 *** | ||||
| HR | 95% CI, p-Value | HR | 95% CI, p-Value | HR | 95% CI, p-Value | HR | 95% CI, p-Value | |
| Lowest (ref.) | - | - | - | - | - | - | - | - |
| Intermediate | 1.35 | 0.94–1.95, p = 0.106 | 1.15 | 0.80–1.67, p = 0.439 | 1.09 | 0.75–1.59, p = 0.638 | 1.13 | 0.78–1.63, p = 0.532 |
| Highest | 3.20 | 2.29–4.48, p < 0.001 | 2.45 | 1.73–3.47, p < 0.001 | 2.13 | 1.49–3.01, p < 0.001 | 2.23 | 1.53–3.24, p < 0.001 |
Publisher’s Note: MDPI stays neutral with regard to jurisdictional claims in published maps and institutional affiliations. |
© 2021 by the authors. Licensee MDPI, Basel, Switzerland. This article is an open access article distributed under the terms and conditions of the Creative Commons Attribution (CC BY) license (https://creativecommons.org/licenses/by/4.0/).
Share and Cite
Talarico, M.; Manicardi, M.; Vitolo, M.; Malavasi, V.L.; Valenti, A.C.; Sgreccia, D.; Rossi, R.; Boriani, G. Red Cell Distribution Width and Patient Outcome in Cardiovascular Disease: A ‘’Real-World’’ Analysis. J. Cardiovasc. Dev. Dis. 2021, 8, 120. https://doi.org/10.3390/jcdd8100120
Talarico M, Manicardi M, Vitolo M, Malavasi VL, Valenti AC, Sgreccia D, Rossi R, Boriani G. Red Cell Distribution Width and Patient Outcome in Cardiovascular Disease: A ‘’Real-World’’ Analysis. Journal of Cardiovascular Development and Disease. 2021; 8(10):120. https://doi.org/10.3390/jcdd8100120
Chicago/Turabian StyleTalarico, Marisa, Marcella Manicardi, Marco Vitolo, Vincenzo Livio Malavasi, Anna Chiara Valenti, Daria Sgreccia, Rosario Rossi, and Giuseppe Boriani. 2021. "Red Cell Distribution Width and Patient Outcome in Cardiovascular Disease: A ‘’Real-World’’ Analysis" Journal of Cardiovascular Development and Disease 8, no. 10: 120. https://doi.org/10.3390/jcdd8100120
APA StyleTalarico, M., Manicardi, M., Vitolo, M., Malavasi, V. L., Valenti, A. C., Sgreccia, D., Rossi, R., & Boriani, G. (2021). Red Cell Distribution Width and Patient Outcome in Cardiovascular Disease: A ‘’Real-World’’ Analysis. Journal of Cardiovascular Development and Disease, 8(10), 120. https://doi.org/10.3390/jcdd8100120