Postprandial Hypertriglyceridemia Is Associated with the Variant 54 Threonine FABP2 Gene

 , , ,
, , ,
Abstract
1. Introduction
2. Methods
2.1. Studied Subjects’ Cohort
2.2. Bioethical Norms
2.3. Sample Collection
2.4. Biochemical Parameters
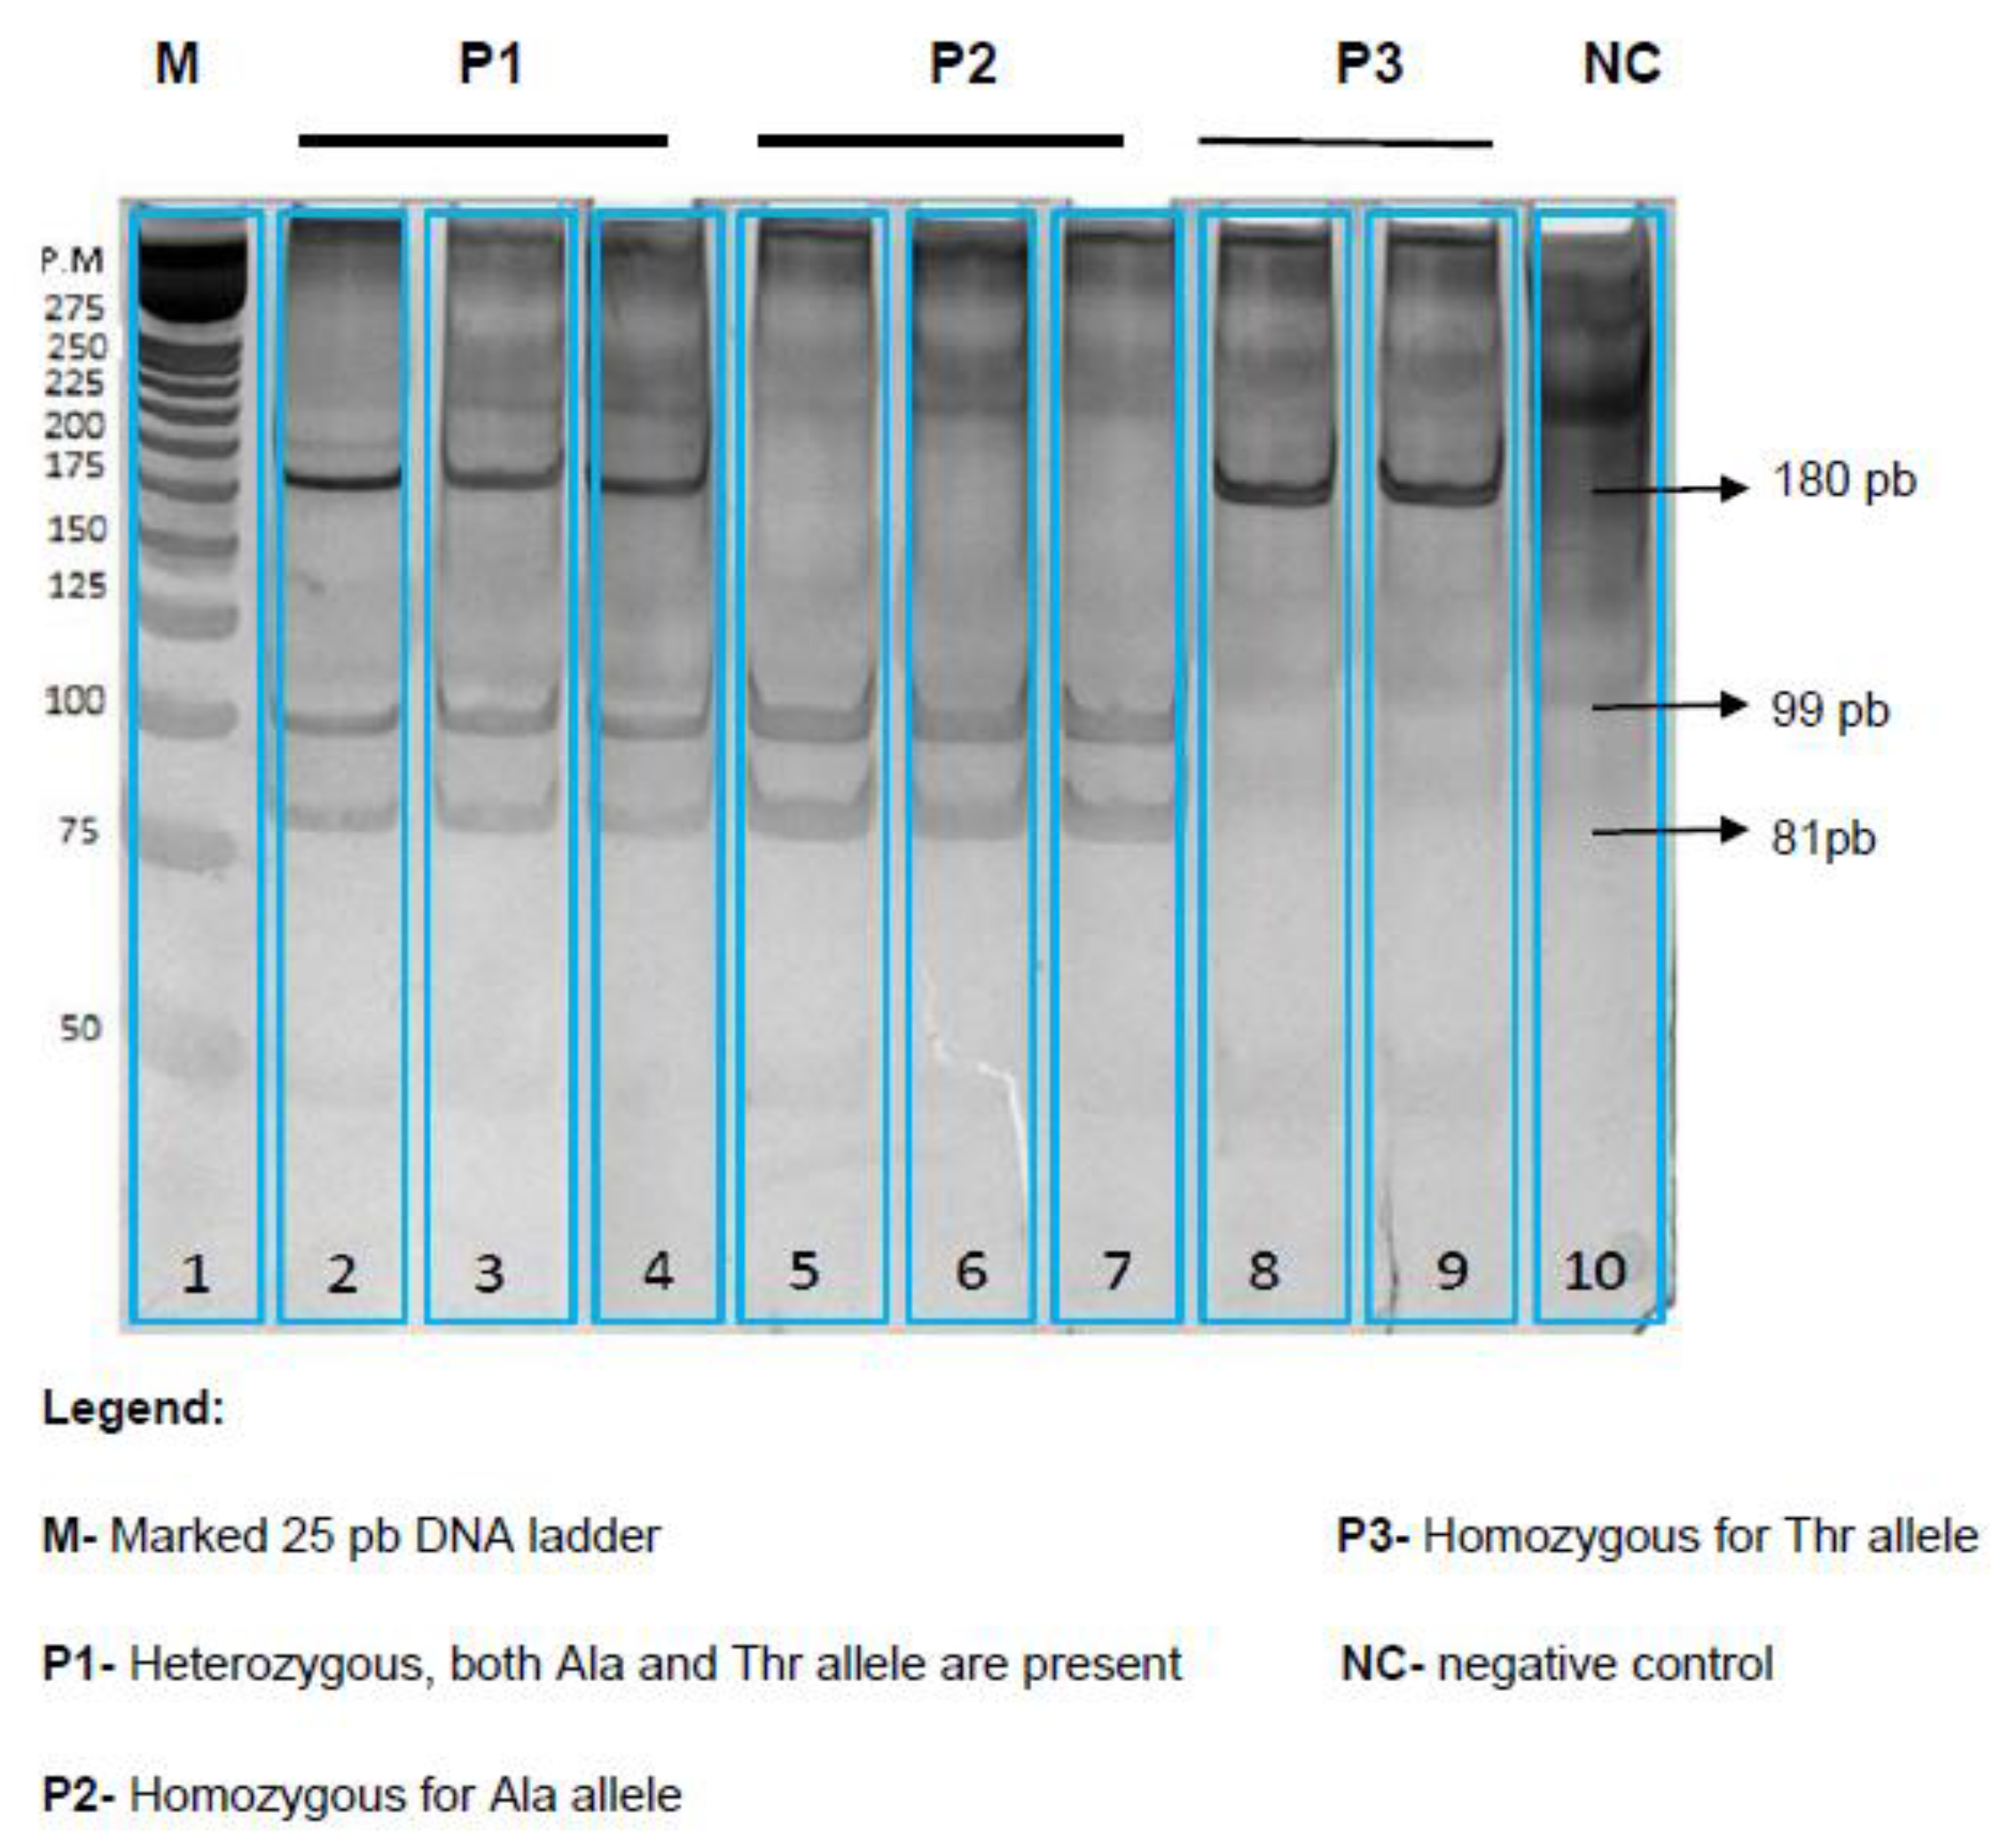
2.5. FABP2 Genotype Analysis
2.6. Statistical Analysis
3. Results
3.1. General Characteristics of Individuals Studied
3.2. Frequency of FABP2 Polymorphisms in Normal Tolerance and Intolerance Fat Group
3.3. Correlation of FABP2 Polymorphism and Biochemical Parameters and BMI
4. Discussion
5. Conclusions
Author Contributions
Funding
Acknowledgments
Conflicts of Interest
References
- Ginsberg, H.N.; Jones, J.; Blaner, W.S.; Thomas, A.; Karmally, W.; Fields, L.; Blood, D.; Begg, M.D. Association of postprandial triglyceride and retinyl palmitate responses with newly diagnosed exercise-induced myocardial ischemia in middle-aged men and women. Arterioscler. Thromb. Vasc. Biol. 1995, 15, 1829–1838. [Google Scholar] [CrossRef] [PubMed]
- Karpe, F. Postprandial lipoprotein metabolism and atherosclerosis. J. Intern. Med. 1999, 246, 341–355. [Google Scholar] [CrossRef] [PubMed]
- Bansal, S.; Buring, J.E.; Rifai, N.; Mora, S.; Sacks, F.M.; Ridker, P.M. Fasting compared with nonfasting triglycerides and risk of cardiovascular events in women. JAMA 2007, 298, 309–316. [Google Scholar] [CrossRef] [PubMed]
- Shaikh, M.; Wootton, R.; Nordestgaard, B.G.; Baskerville, P.; Lumley, J.S.; La Ville, A.E.; Quiney, J.; Lewis, B. Quantitative studies of transfer in vivo of low density, Sf 12-60, and Sf 60-400 lipoproteins between plasma and arterial intima in humans. Arterioscler. Thromb. 1991, 11, 569–577. [Google Scholar] [CrossRef] [PubMed]
- Nordestgaard, B.G. Triglyceride-rich lipoproteins and atherosclerotic cardiovascular disease: New insights from epidemiology, genetics, and biology. Circ. Res. 2016, 118, 547–563. [Google Scholar] [CrossRef] [PubMed]
- Forrester, J.S. Triglycerides: Risk factor or fellow traveler? Curr. Opin. Cardiol. 2001, 16, 261–264. [Google Scholar] [CrossRef] [PubMed]
- Hokanson, J.E.; Austin, M.A. Plasma triglyceride level is a risk factor for cardiovascular disease independent of high-density lipoprotein cholesterol level: A meta-analysis of population-based prospective studies. J. Cardiovasc. Risk. 1996, 3, 213–219. [Google Scholar] [CrossRef] [PubMed]
- Garcés, M.F.; Guarin, Y.; Carrero, Y.; Stekman, H.; Hernández, C.; Núñez, M.L.; Apitz, R.; Camejo, G. Fat intolerance in apparently healthy individuals with normal fasting lipoproteins is associated with markers of cardiovascular risk. J. Appl. Lab. Med. 2016, 1, 250–259. [Google Scholar] [CrossRef]
- Gajda, A.M.; Storch, J. Enterocyte fatty acid-binding proteins (FABPs): Different functions of liver and intestinal FABPs in the intestine. Prostaglandins Leukot. Essent. Fat. Acids. 2015, 93, 9–16. [Google Scholar] [CrossRef] [PubMed]
- Baier, L.J.; Sacchettini, J.C.; Knowler, W.C.; Eads, J.; Paolisso, G.; Tataranni, P.A.; Mochizuki, H.; Bennett, P.H.; Bogardus, C.; Prochazka, M. An amino acid substitution in the human intestinal fatty acid binding protein is associated with increased fatty acid binding, increased fat oxidation, and insulin resistance. J. Clin. Investig. 1995, 95, 1281–1287. [Google Scholar] [CrossRef] [PubMed]
- Georgopoulos, A.; Aras, O.; Tsai, M.Y. Codon-54 polymorphism of the fatty acid-binding protein 2 gene is associated with elevation of fasting and postprandial triglyceride in type 2 diabetes. J. Clin. Endocrinol. Metab. 2000, 85, 3155–3160. [Google Scholar] [CrossRef] [PubMed]
- Albala, C.; Santos, J.L.; Cifuentes, M.; Villarroel, A.C.; Lera, L.; Liberman, C.; Angel, B.; Pérez-Bravo, F. Intestinal FABP2 A54T polymorphism: Association with insulin resistance and obesity in women. Obes. Res. 2004, 12, 340–345. [Google Scholar] [CrossRef] [PubMed]
- Liu, P.; Yu, D.; Jin, X.; Li, C.; Zhu, F.; Zheng, Z.; Lv, C.; He, X. The association between the FABP2 Ala54Thr variant and the risk of type 2 diabetes mellitus: A meta-analysis based on 11 case-control studies. Int. J. Clin. Exp. Med. 2015, 8, 5422–5429. [Google Scholar] [PubMed]
- Qiu, C.J.; Ye, X.Z.; Yu, X.J.; Peng, X.R.; Li, T.H. Association between FABP2 Ala54Thr polymorphisms and type 2 diabetes mellitus risk: A HuGE Review and Meta-Analysis. J. Cell. Mol. Med. 2014, 18, 2530–2535. [Google Scholar] [CrossRef] [PubMed]
- Rissanen, J.; Pihlajamäki, J.; Heikkinen, S.; Kekäläinen, P.; Kuusisto, J.; Laakso, M. The Ala54Thr polymorphism of the fatty acid binding protein 2 gene does not influence insulin sensitivity in Finnish nondiabetic and NIDDM subjects. Diabetes 1997, 46, 711–712. [Google Scholar] [CrossRef] [PubMed]
- Gomez, L.C.; Real, S.M.; Ojeda, M.S.; Gimenez, S.; Mayorga, L.S.; Roqué, M. Polymorphism of the FABP2 gene: A population frequency analysis and an association study with cardiovascular risk markers in Argentina. BMC Med. Genet. 2007, 8, 39. [Google Scholar] [CrossRef] [PubMed]
- Hayakawa, T.; Nagai, Y.; Nohara, E.; Yamashita, H.; Takamura, T.; Abe, T.; Nomura, G.; Kobayashi, K. Variation of the fatty acid binding protein 2 gene is not associated with obesity and insulin resistance in Japanese subjects. Metabolism 1999, 48, 655–657. [Google Scholar] [CrossRef]
- Guerra, D.C.; Pérez, C.F.; Izaguirre, M.H.; Barahona, E.A.; Larralde, A.R.; Lugo, M.V. Gender differences in ancestral contribution and admixture in Venezuelan populations. Hum Biol. 2011, 83, 345–361. [Google Scholar] [CrossRef] [PubMed]
- Welsh, K.; Bunce, M. Molecular typing for the MHC with PCR-SSP. Rev. Immunogenet. 1999, 1, 157–176. [Google Scholar] [PubMed]
- Ribalta, J.; Halkes, C.J.M.; Salazar, J.; Masana, L.; Castro Cabezas, M. Additive effects of the PPARγ, APOE, and FABP-2 genes in increasing daylong triglycerides of normolipidemic women to concentrations comparable to those in men. Clin. Chem. 2005, 51, 864–871. [Google Scholar] [CrossRef] [PubMed]
- Solberg, H. Approved recommendation on the theory of reference values part 5. Statistical treatment of collected reference values determination of reference limits. J. Clin. Chem. Clin. Biochem. 1987, 25, 645–656. [Google Scholar]
- Svejgaard, A.; Ryder, L.P. HLA and disease associations: Detecting the strongest association. Tissue Antigens. 1994, 43, 18–27. [Google Scholar] [CrossRef] [PubMed]
- Solé, X.; Guinó, E.; Valls, J.; Iniesta, R.; Moreno, V. SNPStats: A web tool for the analysis of association studies. Bioinformatics 2006, 22, 1928–1929. [Google Scholar] [CrossRef] [PubMed]
- Weiss, E.P.; Brown, M.D.; Shuldiner, A.R.; Hagberg, J.M. Fatty acid binding protein 2 gene variants and insulin resistance: Gene and gene-environment interaction effects. Physiol. Genomics. 2002, 10, 145–157. [Google Scholar] [CrossRef] [PubMed]
- Agren, J.J.; Valve, R.; Vidgren, H.; Laakso, M.; Uusitupa, M. Postprandial lipemic response is modified by the polymorphism at codon 54 of the fatty acid-binding protein 2 gene. Arterioscler. Thromb. Vasc. Biol. 1998, 18, 1606–1610. [Google Scholar] [CrossRef] [PubMed]
- Pratley, R.E.; Baier, L.; Pan, D.A.; Salbe, A.D.; Storlien, L.; Ravussin, E.; Bogardus, C. Effects of an Ala54Thr polymorphism in the intestinal fatty acid-binding protein on responses to dietary fat in humans. J. Lipid Res. 2000, 41, 2002–2008. [Google Scholar] [PubMed]
- Quispe, R.; Manalac, R.J.; Faridi, K.F.; Blaha, M.J.; Toth, P.P.; Kulkarni, K.R.; Nasir, K.; Virani, S.S.; Banach, M.; Blumenthal, R.S.; et al. Relationship of the triglyceride to high-density lipoprotein cholesterol (TG/HDL-C) ratio to the remainder of the lipid profile: The very large database of Lipids-4 (VLDL-4) study. Atherosclerosis 2015, 242, 243–250. [Google Scholar] [CrossRef] [PubMed]
- Tahvanainen, E.; Molin, M.; Vainio, S.; Tiret, L.; Nicaud, V.; Farinaro, E.; Masana, L.; Ehnholm, C. Intestinal fatty acid binding protein polymorphism at codon 54 is not associated with postprandial responses to fat and glucose tolerance tests in healthy young Europeans. Results from EARS II participants. Atherosclerosis 2000, 152, 317–325. [Google Scholar] [CrossRef]
- Oguri, M.; Kato, K.; Yokoi, K.; Itoh, T.; Yoshida, T.; Watanabe, S.; Metoki, N.; Yoshida, H.; Satoh, K.; Aoyagi, Y.; et al. Association of genetic variants with myocardial infarction in Japanese individuals with metabolic síndrome. Atherosclerosis 2009, 206, 486–493. [Google Scholar] [CrossRef] [PubMed]
- Pérez-Bravo, F.; Fuentes, M.; Angel, B.; Sanchez, H.; Carrasco, E.; Santos, J.; Lera, L.; Albala, C. Lack of association between the fatty acid binding protein 2 (FABP2) polymorphism with obesity and insulin resistance in two aboriginal populations from Chile. Acta Diabetol. 2006, 43, 93–98. [Google Scholar] [CrossRef] [PubMed]
- Lei, H.; Coresh, J.; Shuldiner, A.; Boerwinkle, E.; Brancati, F. Variants of the insulin receptor substrate-1 and fatty acid binding protein 2 genes and the risk of type 2 diabetes, obesity, and hyperinsulinemia in African-Americans. The atherosclerosis risk in communities study. Diabetes 1999, 48, 1868–1872. [Google Scholar] [CrossRef] [PubMed]


| Biochemical Parameters | All Subjects | Fat Tolerances | Fat Intolerances |
|---|---|---|---|
| BMI (kg/m2) | 22.8 ± 2.4 | 22.4 ± 2.4 | 23.6 ± 2.7 * |
| Insulin (pmol/L) | 61.8 ± 27.8 | 59.7±26.6 | 65.2 ± 39.1 |
| Fasting glucose mmol/L) | 4.84 ± 0.44 | 4.81 ± 0.45 | 4.89 ± 0.42 |
| Total Cholesterol (mmol/L) | 4.78 ± 0.98 | 4.76 ± 1.03 | 4.97 ± 0.82 |
| HDL-C (mmol/L) | 1.3 ± 0.44 | 1.35 ± 0.45 | 1.06 ± 0.37 ** |
| VLDL-C (mmol/L) | 0.52 ± 0.17 | 0.5 ± 0.17 | 0.61 ± 0.18 ** |
| LDL-C (mmol/L) | 2.91 ± 0.82 | 2.86 ±0.84 | 3.19 ± 0.77 * |
| Fasting Tg (mmol/L) | 1.33 ± 0.41 | 1.24 ± 0.38 | 1.63 ± 0.38 *** |
| Tg postprandial 2 h (mmol/L) | 1.63 ± 0.55 | 1.43± 0.40 | 2.34 ± 0.41 *** |
| Tg postprandial 4 h (mmol/L) | 1.58 ± 0.60 | 1.37 ± 0.40 | 2.34 ± 0.42 *** |
| Triglycerides AUC (mmol * h/L) | 6.18 ± 1.99 | 5.48 ± 1.46 | 8.66 ± 1.59 *** |
| Remnants Cholesterol (mmol/L) | 0.59 ± 0.21 | 0.56 ± 0.21 | 0.73 ± 0.20 ** |
| Apo A1 (g/L) | 1.15 ± 0.23 | 1.17 ± 0.23 | 1.09 ± 0.21 |
| Apo B (g/L) | 1.03 ± 0.24 | 0.99 ± 0.25 | 1.17 ± 0.36 * |
| Ratio Tg/HDL-C | 2.31 ± 1.25 | 2.00 ± 0.96 | 3.39 ± 1.53 *** |
| Ratio Total Cholesterol/HDL | 4.07 ± 1.49 | 3.76 ± 1.14 | 5.16 ± 2.01 ** |
| Ratio Apo B/ApoA1 | 0.89 ± 1.04 | 0.84 ± 1.09 | 1.07 ± 1.71 ** |
| FABP2 Ala54Thr Polymorphism Genotype | Normal Tolerance Fats Group n = 123 | Intolerance Fats Group n = 35 | OR (IC 95%) | pc |
|---|---|---|---|---|
| Codominant inheritance model | ||||
| Ala54Ala | 50.4 (62) | 17.1 (6) | 1.00 (Reference) | |
| Ala54Thr | 45.5 (56) | 60.0 (21) | 3.87 (1.46–10.29) | 0.0003 * |
| Thr54Thr | 4.1 (5) | 22.9 (8) | 16.53 (4.09–66.82) | |
| Dominant inheritance model | ||||
| Ala54Ala Ala54Thr + Thr54Thr | 50.4 (62) 49.6 (61) | 17.1 (6) 82.9 (29) | 1.00 (Reference) 6.35 (1.86–21.59) | 0.0009 * |
| Recessive inheritance model | ||||
| Ala54Ala + Ala54Thr | 95.9 (118) | 77.1 (27) | 1.00 (Reference) | 0.0039 * |
| Thr54Thr | 4.1 (5) | 22.9 (8) | 6.99 (2.12–23.06) | |
| Alleles Ala54 | 73.2 (180) | 47.1 (33) | 1.00 (Reference) | 0.00013 * |
| Thr54 | 26.8 (66) | 52.9 (37) | 3.05 (1.76–5.28) | |
| Biochemical Variables | Genotype | ||
|---|---|---|---|
| Ala54Ala | Ala54Thr + Thr54Thr | Statistical Significance | |
| BMI (kg/m2) | 22.2 ± 2.4 | 23.0 ± 2.5 | p < 0.05 |
| Fasting glucose (mmol/L) | 4.85 ± 0.38 | 4.91 ± 0.49 | n.s. |
| Insulin (pmol/L) | 62.4 ± 27.2 | 60.8 ± 28.3 | n.s. |
| Total Cholesterol (mmol/L) | 4.75 ± 1.04 | 4.80 ± 0.94 | n.s. |
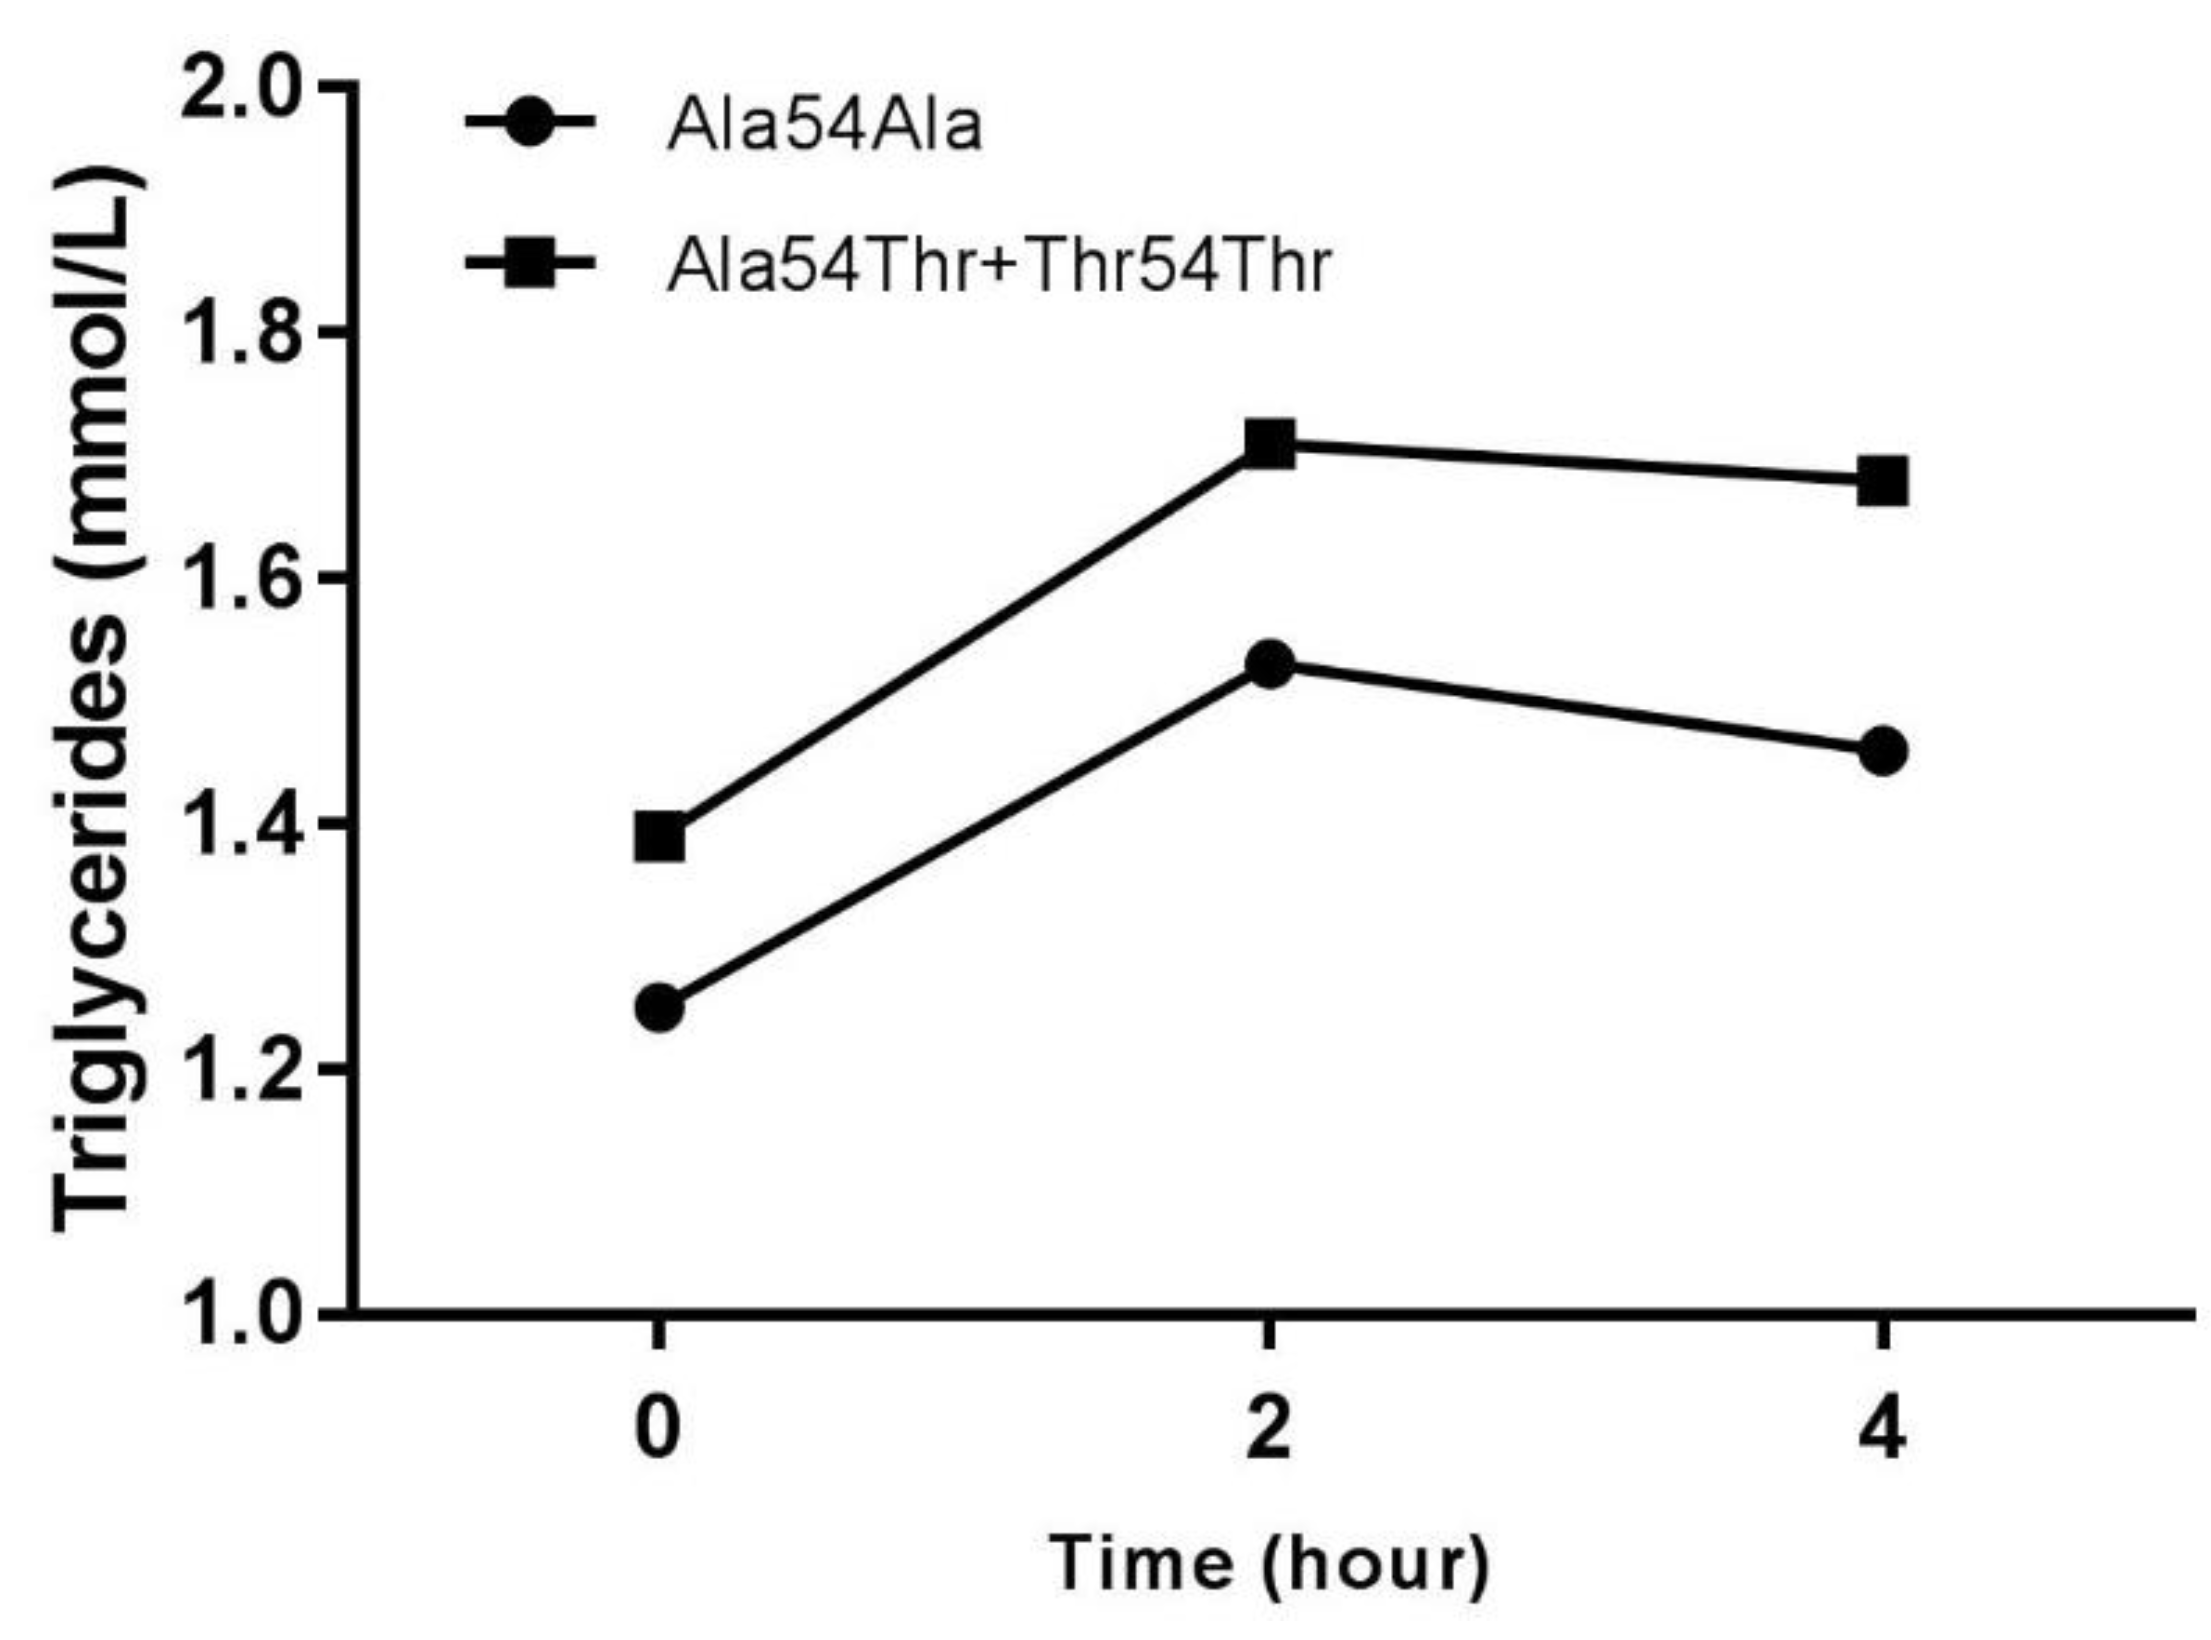
| Fasting Tg (mmol/L) | 1.25 ± 0.38 | 1.39 ± 0.42 | p < 0.05 |
| Tg postprandial 2 h (mmol/L) | 1.53 ± 0.48 | 1.71 ± 0.59 | p < 0.05 |
| Tg postprandial 4 h (mmol/L) | 1.46 ± 0.48 | 1.68 ± 0.68 | p < 0.05 |
| Triglycerides AUC (mmol * h/L) | 5.77 ± 1.70 | 6.50 ± 2.13 | p < 0.05 |
| HDL-C (mmol/L) | 1.33 ± 0.48 | 1.25 ± 0.40 | n.s. |
| LDL-C (mmol/L) | 2.84 ± 0.86 | 2.97 ± 0.79 | n.s. |
| VLDL-C (mmol/L) | 0.51 ± 0.16 | 0.54 ± 0.19 | n.s. |
| Ratio Tg/HDL-C | 2.12 ± 1.20 | 2.45 ± 1.28 | p < 0.05 |
| Apo B (g/L) | 1.02 ± 0.26 | 1.04 ± 0.31 | n.s. |
| Biochemical Variables | Genotype | ||
|---|---|---|---|
| Ala54Ala | Ala54Thr + Thr54Thr | Statistical Significance | |
| BMI (kg/m2) | −0.177 | 0.177 | p < 0.05 |
| Fasting glucose (mmol/L) | −0.076 | 0.076 | n.s. |
| Insulin (pmol/L) | 0.025 | −0.025 | n.s. |
| Total Cholesterol (mmol/L) | −0.014 | 0.014 | n.s. |
| Fasting Tg (mmol/L) | −0.196 | 0.196 | p < 0.01 |
| Tg postprandial 4 h (mmol/L) | −0.24 | 0.24 | p < 0.005 |
| Triglycerides AUC (mmol * h/L) | −0.236 | 0.236 | p < 0.005 |
| HDL-C (mmol/L) | 0.126 | −0.126 | n.s. |
| LDL-C (mmol/L) | −0.087 | 0.087 | n.s. |
| VLDL-C (mmol/L) | −0.073 | 0.073 | n.s. |
| Ratio Tg/HDL-C | −0.204 | 0.204 | p < 0.01 |
| Ratio TC/HDL-C | −0.132 | 0.132 | n.s. |
| Apo B (g/L) | −0.011 | 0.011 | n.s. |
© 2018 by the authors. Licensee MDPI, Basel, Switzerland. This article is an open access article distributed under the terms and conditions of the Creative Commons Attribution (CC BY) license (http://creativecommons.org/licenses/by/4.0/).
Share and Cite
Garcés Da Silva, M.F.; Guarin, Y.A.; Carrero, Y.; Stekman, H.; Núñez Bello, M.L.; Hernández, C.; Apitz, R.; Fernández-Mestre, M.; Camejo, G. Postprandial Hypertriglyceridemia Is Associated with the Variant 54 Threonine FABP2 Gene. J. Cardiovasc. Dev. Dis. 2018, 5, 47. https://doi.org/10.3390/jcdd5030047
Garcés Da Silva MF, Guarin YA, Carrero Y, Stekman H, Núñez Bello ML, Hernández C, Apitz R, Fernández-Mestre M, Camejo G. Postprandial Hypertriglyceridemia Is Associated with the Variant 54 Threonine FABP2 Gene. Journal of Cardiovascular Development and Disease. 2018; 5(3):47. https://doi.org/10.3390/jcdd5030047
Chicago/Turabian StyleGarcés Da Silva, María Fatima, Yamil Adrian Guarin, Yenny Carrero, Hilda Stekman, María Luisa Núñez Bello, Celsy Hernández, Rafael Apitz, Mercedes Fernández-Mestre, and Germán Camejo. 2018. "Postprandial Hypertriglyceridemia Is Associated with the Variant 54 Threonine FABP2 Gene" Journal of Cardiovascular Development and Disease 5, no. 3: 47. https://doi.org/10.3390/jcdd5030047
APA StyleGarcés Da Silva, M. F., Guarin, Y. A., Carrero, Y., Stekman, H., Núñez Bello, M. L., Hernández, C., Apitz, R., Fernández-Mestre, M., & Camejo, G. (2018). Postprandial Hypertriglyceridemia Is Associated with the Variant 54 Threonine FABP2 Gene. Journal of Cardiovascular Development and Disease, 5(3), 47. https://doi.org/10.3390/jcdd5030047