
Application of Patient-Specific Computational Fluid Dynamics in Anomalous Aortic Origin of Coronary Artery: A Systematic Review

 , , and
Abstract
:1. Introduction
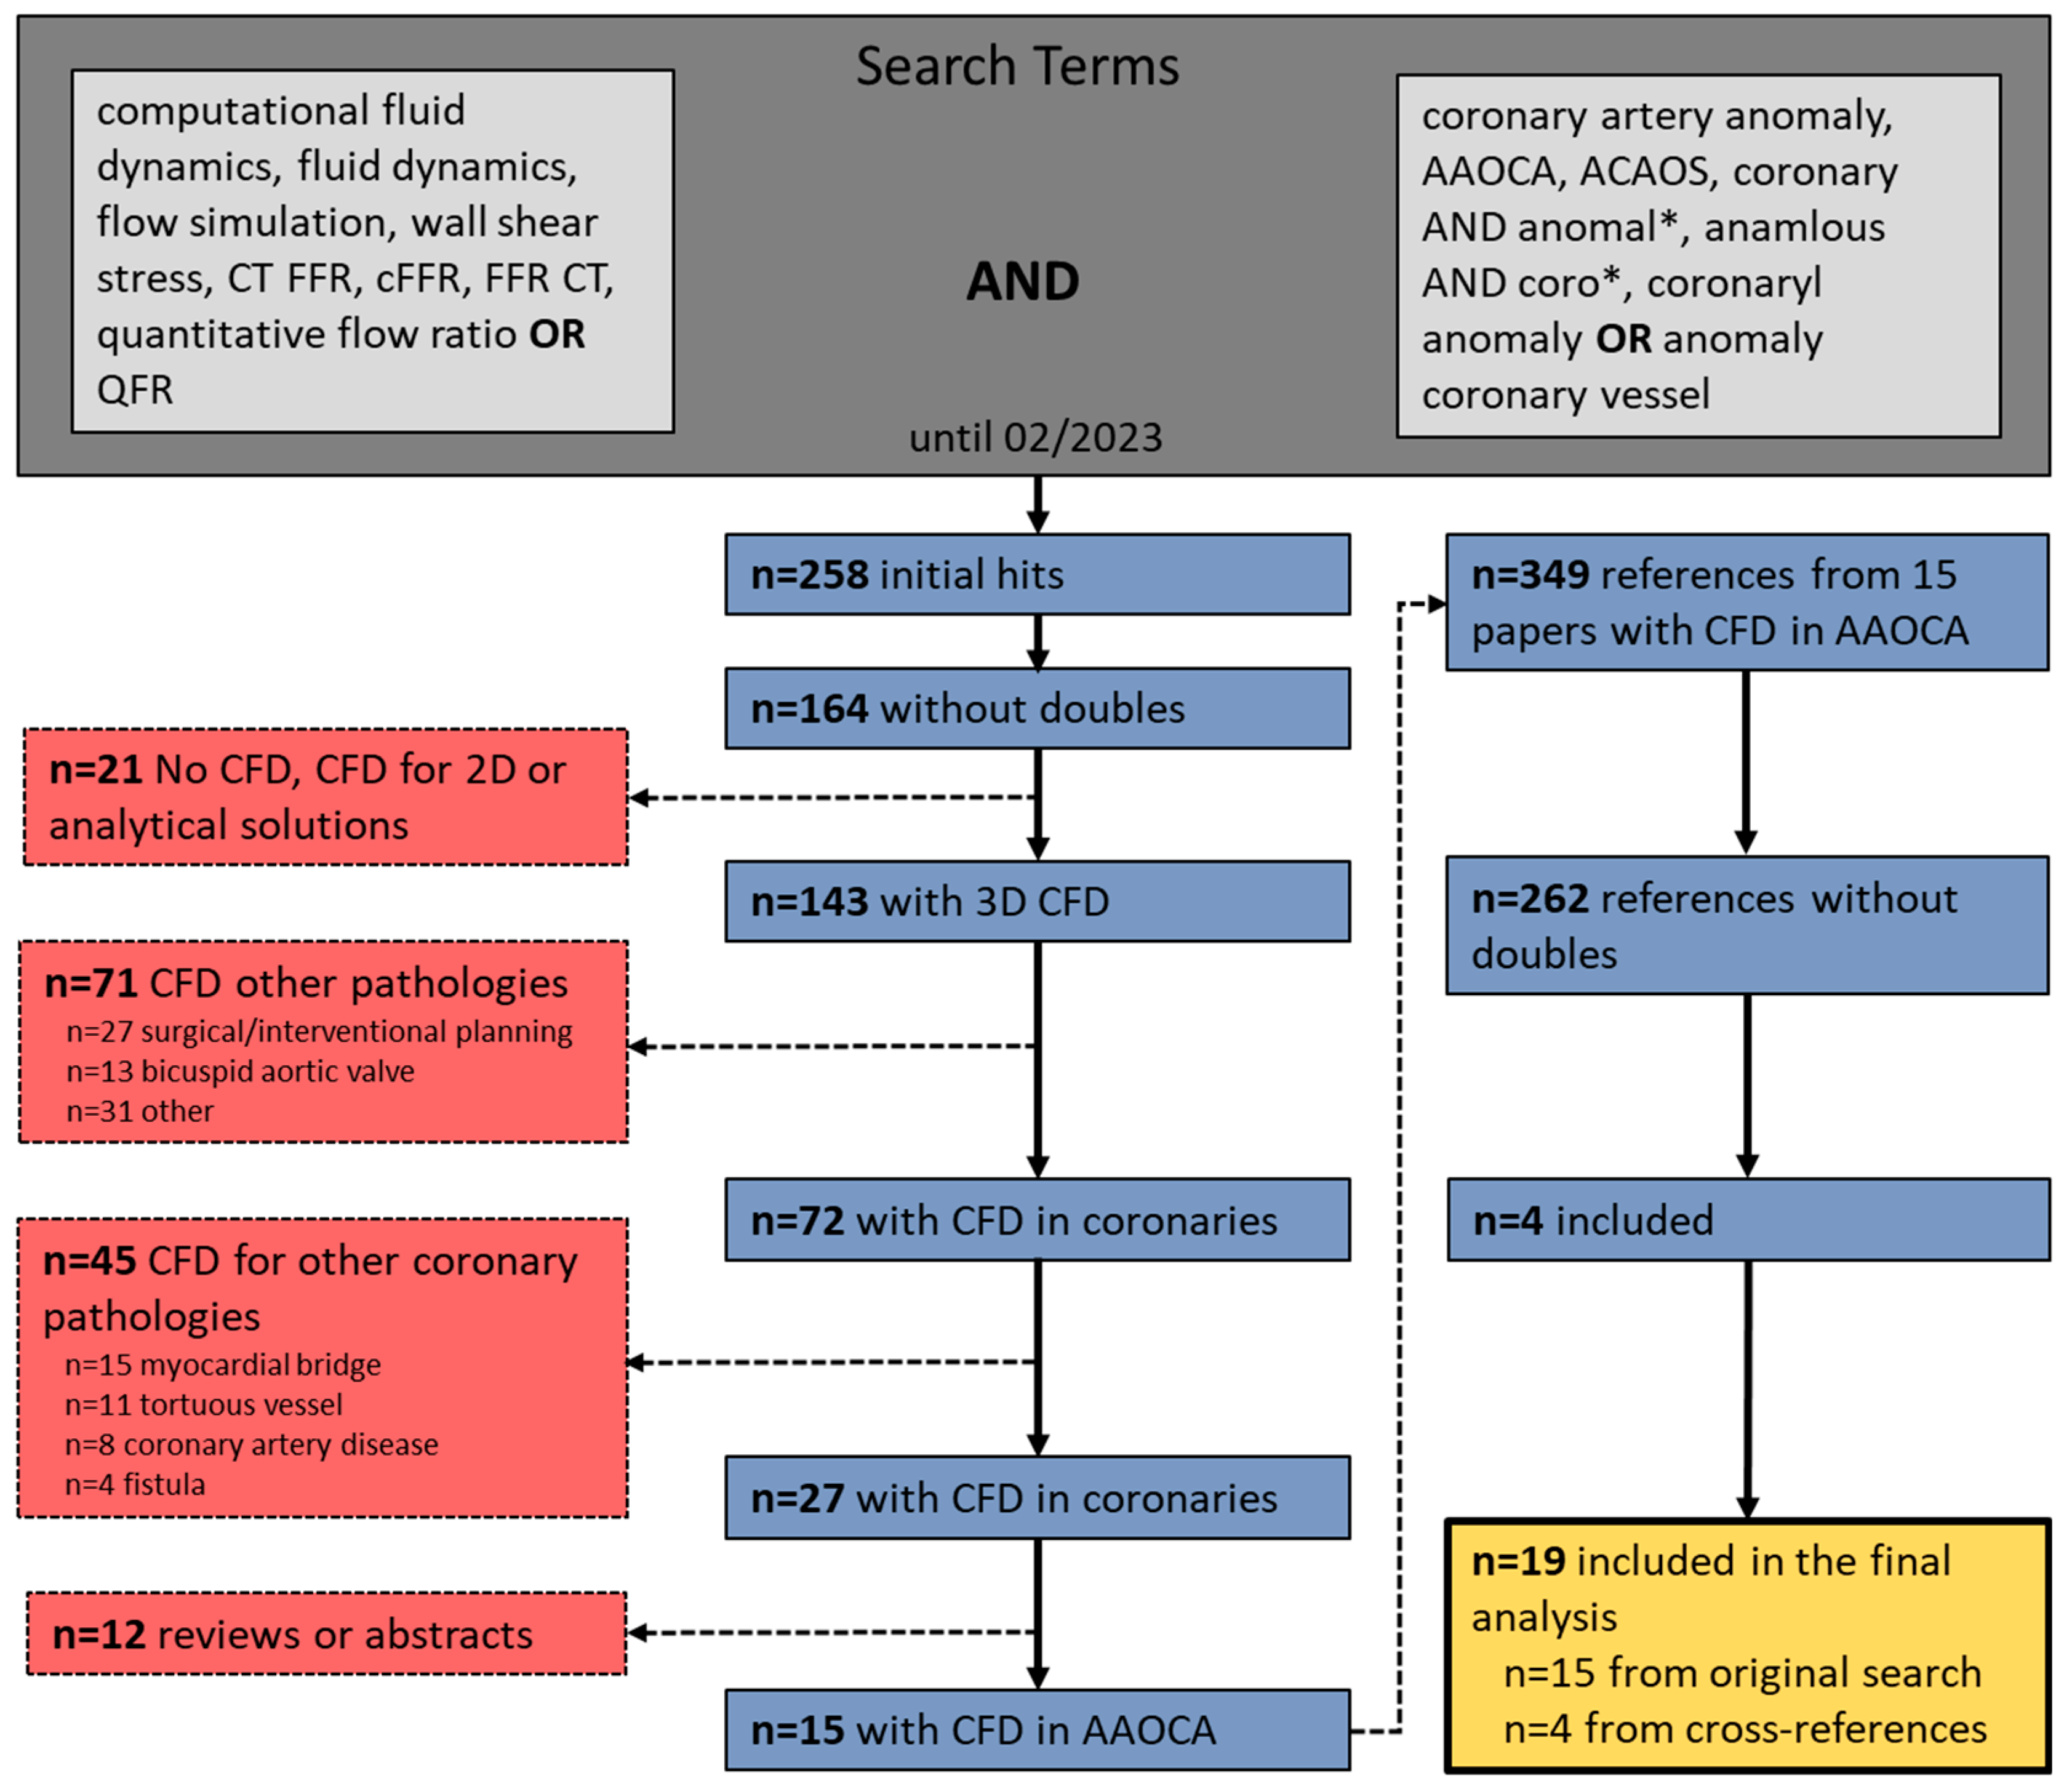
2. Materials and Methods
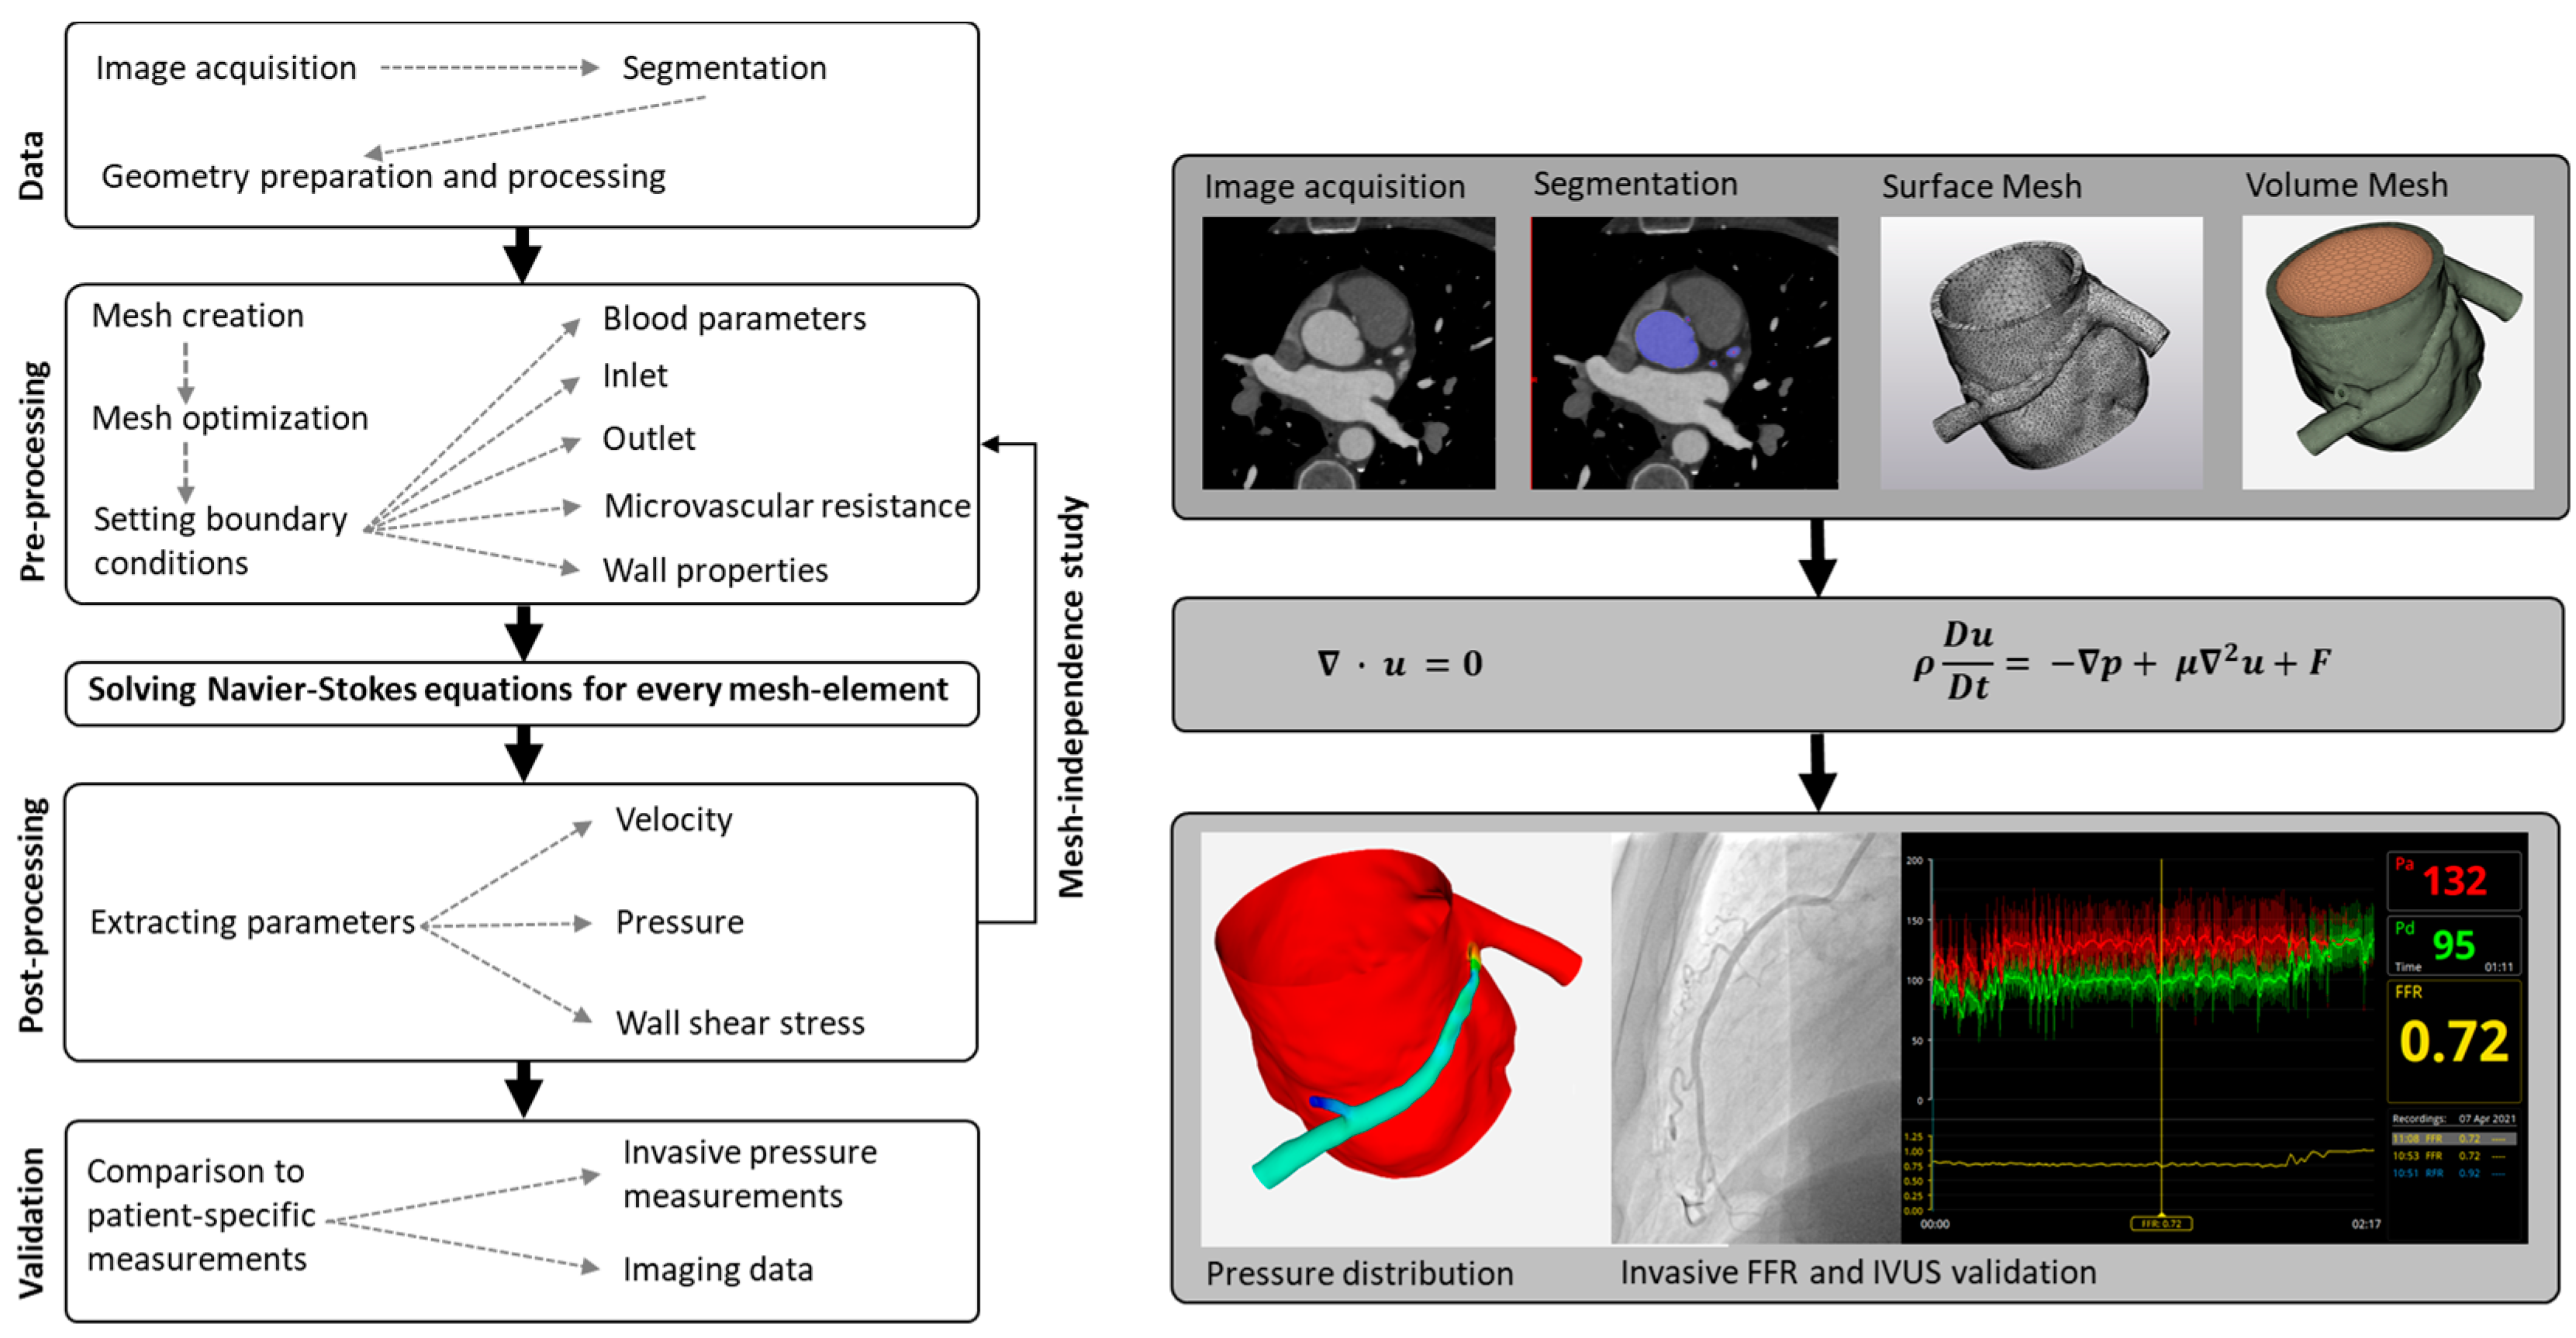
2.1. General Workflow of Computational Fluid Dynamics Modelling
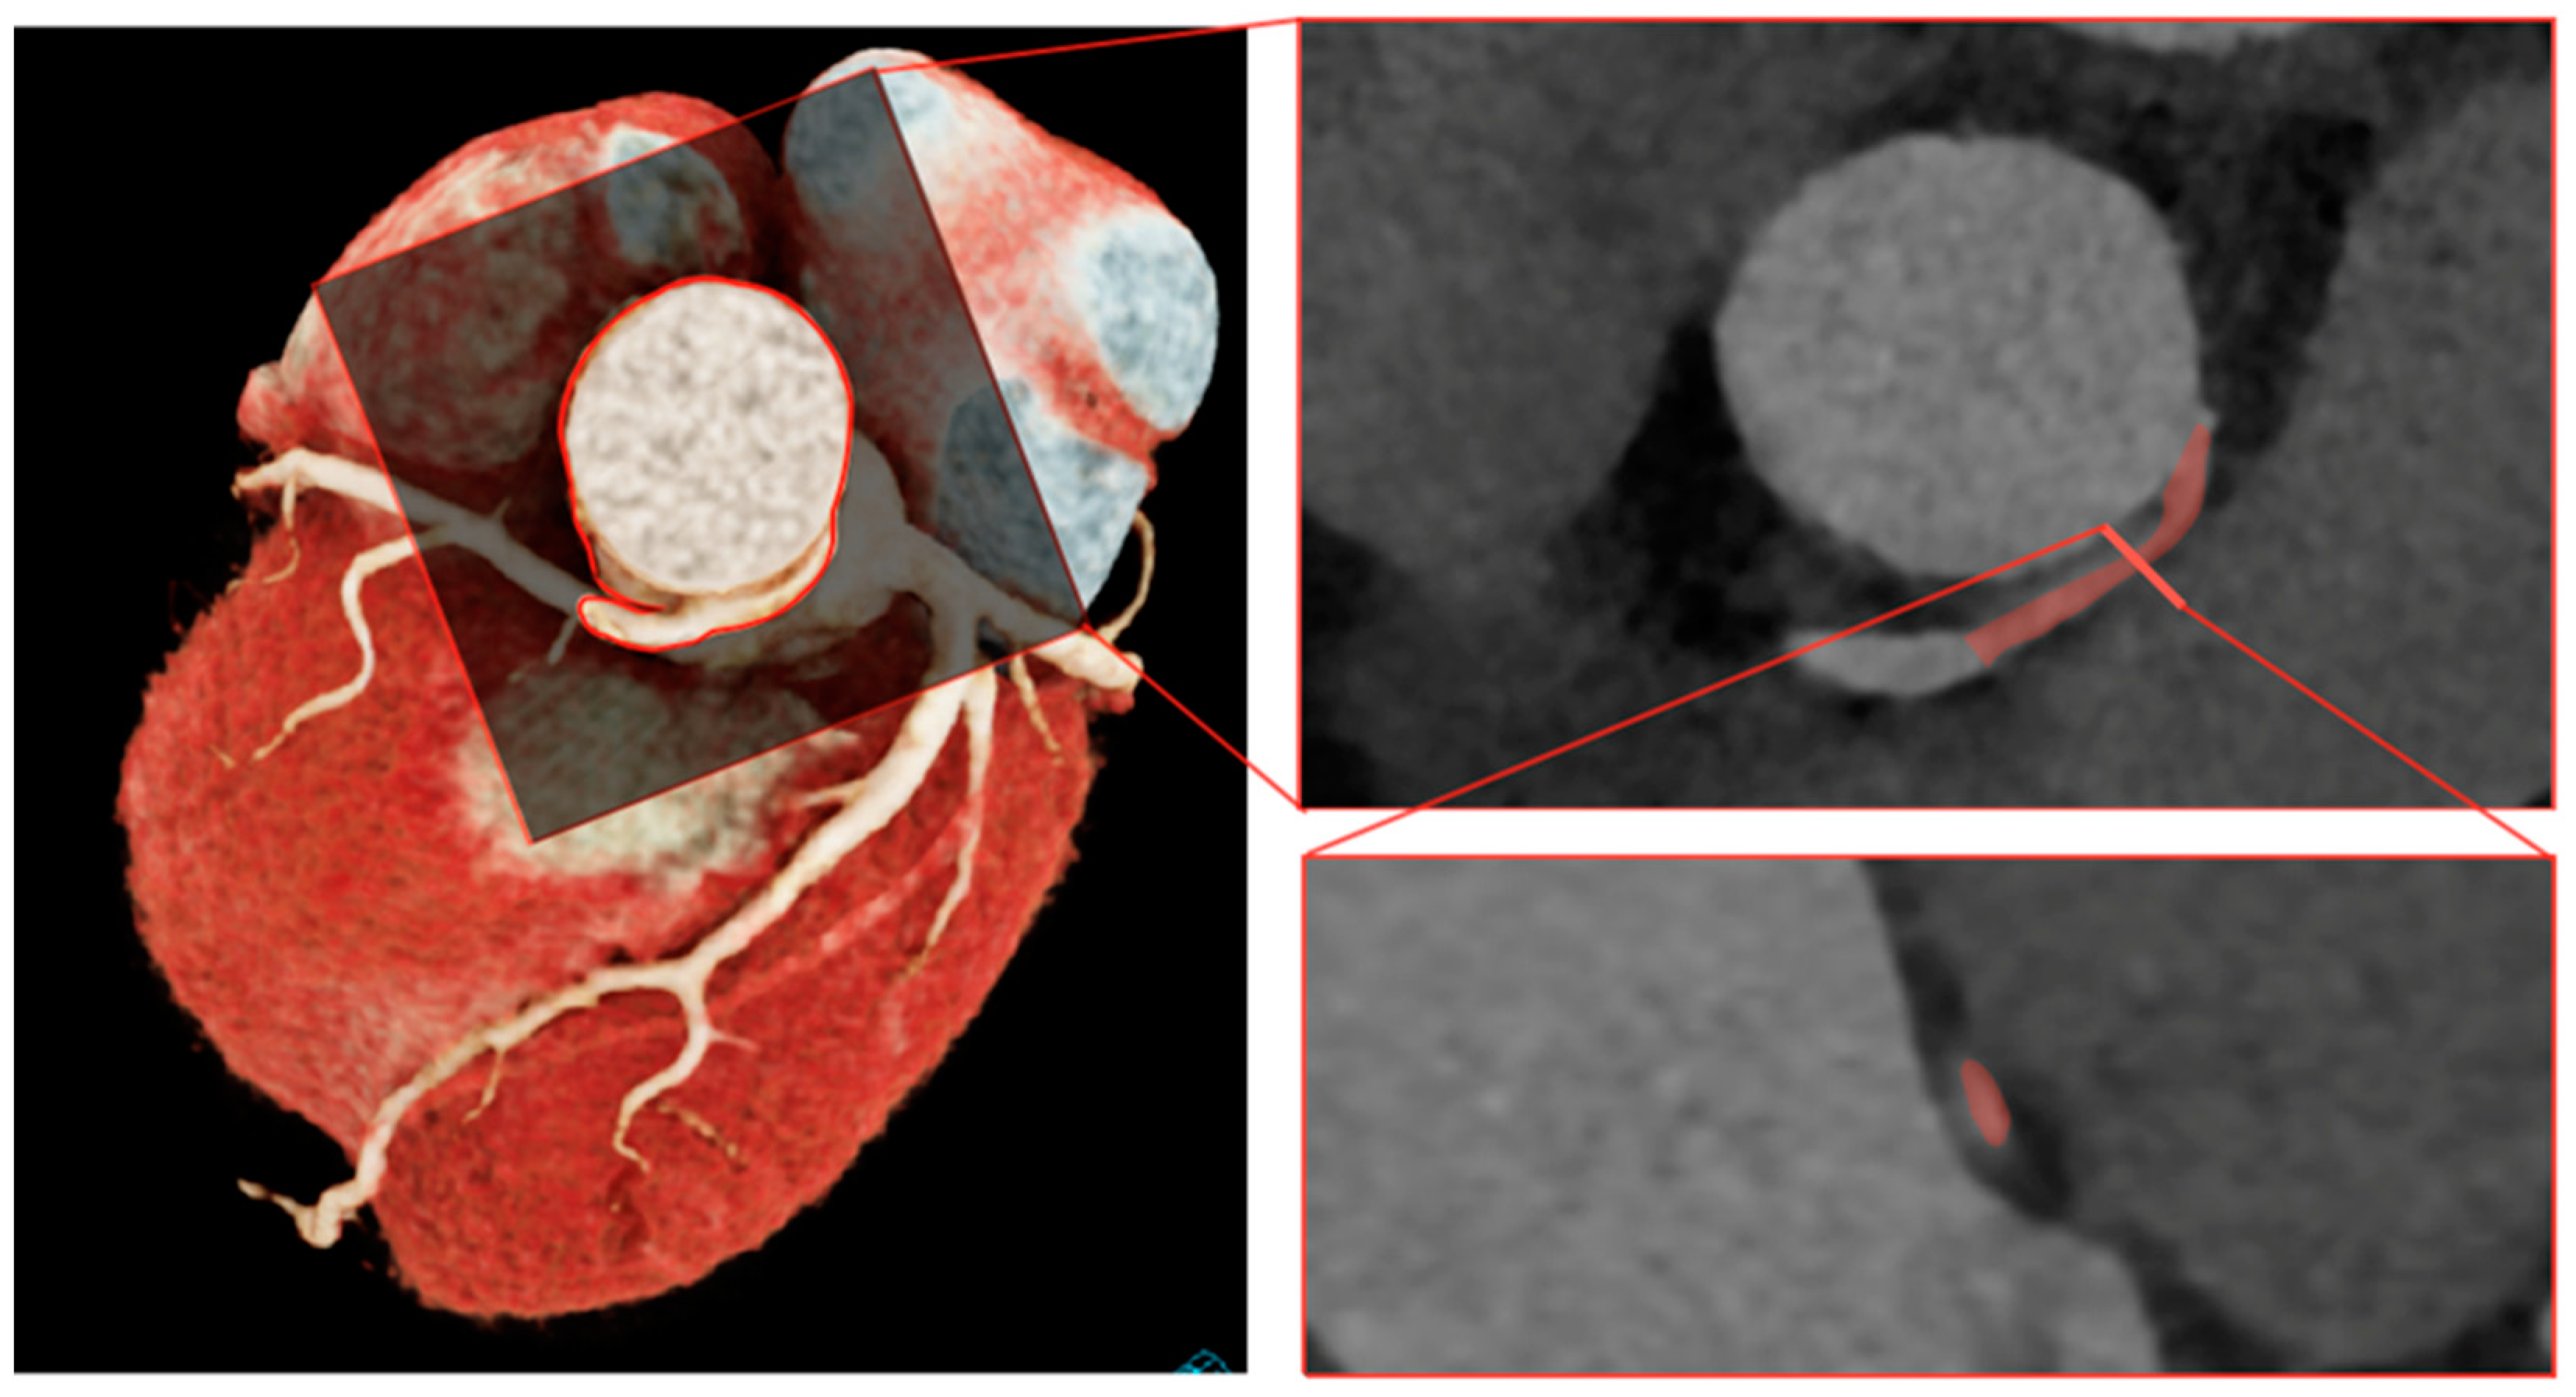
2.1.1. Step 1: Segmentation
2.1.2. Step 2: Mesh Creation
2.1.3. Step 3: Setting Boundary Conditions
2.1.4. Step 4: Solve Navier–Stokes Equations
2.1.5. Step 5: Post-Processing
2.1.6. Step 6: Validation against Clinical Data
2.2. Statistics
3. Results
3.1. Dedicated CFD Coronary Artery Software
3.2. General-Purpose CFD Models
3.2.1. Image Acquisition and Segmentation
3.2.2. Mesh Generation
3.2.3. Blood Model
3.2.4. Boundary Conditions at the Inlet
3.2.5. Boundary Conditions at the Outlet
3.2.6. Modelling of the Aortic and Coronary Walls
3.2.7. Post-Processing
4. Discussion
4.1. Dedicated CFD Models
4.2. General-Purpose CFD Models
4.2.1. Image Acquisition and Segmentation
4.2.2. Mesh Generation
4.2.3. Blood Rheology
4.2.4. Boundary Conditions of the Inlet and Outlet, Vessel Wall Properties
4.2.5. Validation
4.3. Model Complexity
4.4. Technical Considerations
4.5. Limitations
5. Conclusions
Author Contributions
Funding
Institutional Review Board Statement
Informed Consent Statement
Data Availability Statement
Conflicts of Interest
References
- Grani, C.; Benz, D.; Schmied, C.; Vontobel, J.; Possner, M.; Clerc, O.; Mikulicic, F.; Stehli, J.; Fuchs, T.; Pazhenkottil, A.; et al. Prevalence and characteristics of coronary artery anomalies detected by coronary computed tomography angiography in 5634 consecutive patients in a single centre in Switzerland. Swiss Med. Wkly. 2016, 146, w14294. [Google Scholar] [PubMed]
- Angelini, P. Coronary artery anomalies: An entity in search of an identity. Circulation 2007, 115, 1296–1305. [Google Scholar] [CrossRef] [PubMed]
- Basso, C.; Maron, B.J.; Corrado, D.; Thiene, G. Clinical profile of congenital coronary artery anomalies with origin from the wrong aortic sinus leading to sudden death in young competitive athletes. J. Am. Coll. Cardiol. 2000, 35, 1493–1501. [Google Scholar] [CrossRef] [PubMed]
- Eckart, R.E.; Scoville, S.L.; Campbell, C.L.; Shry, E.A.; Stajduhar, K.C.; Potter, R.N.; Pearse, L.A.; Virmani, R. Sudden death in young adults: A 25-year review of autopsies in military recruits. Ann. Intern. Med. 2004, 141, 829–834. [Google Scholar] [CrossRef]
- Lim, J.C.; Beale, A.; Ramcharitar, S.; Medscape. Anomalous origination of a coronary artery from the opposite sinus. Nat. Rev. Cardiol. 2011, 8, 706–719. [Google Scholar] [CrossRef] [PubMed]
- Grani, C.; Benz, D.C.; Steffen, D.A.; Clerc, O.F.; Schmied, C.; Possner, M.; Vontobel, J.; Mikulicic, F.; Gebhard, C.; Pazhenkottil, A.P.; et al. Outcome in middle-aged individuals with anomalous origin of the coronary artery from the opposite sinus: A matched cohort study. Eur. Heart J. 2017, 38, 2009–2016. [Google Scholar] [CrossRef]
- Gräni, C.; Grunwald, C.; Windecker, S.; Siontis, G.C.M. Coronary Artery Anomaly in Takotsubo Cardiomyopathy: Cause or Innocent Bystander? Tex. Heart Inst. J. 2020, 47, 44–46. [Google Scholar] [CrossRef]
- Grani, C.; Buechel, R.R.; Kaufmann, P.A.; Kwong, R.Y. Multimodality Imaging in Individuals With Anomalous Coronary Arteries. JACC Cardiovasc. Imaging 2017, 10, 471–481. [Google Scholar] [CrossRef]
- Gräni, C.; Kaufmann, P.A.; Windecker, S.; Buechel, R.R. Diagnosis and Management of Anomalous Coronary Arteries with a Malignant Course. Interv. Cardiol. 2019, 14, 83–88. [Google Scholar] [CrossRef]
- Angelini, P.; Velasco, J.A.; Ott, D.; Khoshnevis, G.R. Anomalous coronary artery arising from the opposite sinus: Descriptive features and pathophysiologic mechanisms, as documented by intravascular ultrasonography. J. Invasive Cardiol. 2003, 15, 507–514. [Google Scholar]
- Angelini, P.; Flamm, S.D. Newer concepts for imaging anomalous aortic origin of the coronary arteries in adults. Catheter. Cardiovasc. Interv. 2007, 69, 942–954. [Google Scholar] [CrossRef] [PubMed]
- Angelini, P.; Uribe, C. Symptomatic right coronary anomaly with dynamic systolic intramural obliteration and isolated right ventricular ischemia. Catheter. Cardiovasc. Interv. 2019, 93, 445–447. [Google Scholar] [CrossRef] [PubMed]
- Lee, S.E.; Yu, C.W.; Park, K.; Park, K.W.; Suh, J.W.; Cho, Y.S.; Youn, T.J.; Chae, I.H.; Choi, D.J.; Jang, H.J.; et al. Physiological and clinical relevance of anomalous right coronary artery originating from left sinus of Valsalva in adults. Heart 2016, 102, 114–119. [Google Scholar] [CrossRef] [PubMed]
- Polanczyk, A.; Piechota-Polanczyk, A.; Huk, I.; Neumayer, C.; Balcer, J.; Strzelecki, M. Computational Fluid Dynamic Technique for Assessment of How Changing Character of Blood Flow and Different Value of Hct Influence Blood Hemodynamic in Dissected Aorta. Diagnostics 2021, 11, 1866. [Google Scholar] [CrossRef] [PubMed]
- Polanczyk, A.; Podyma, M.; Stefanczyk, L.; Szubert, W.; Zbicinski, I. A 3D model of thrombus formation in a stent-graft after implantation in the abdominal aorta. J. Biomech. 2015, 48, 425–431. [Google Scholar] [CrossRef]
- Adjedj, J.; Ferrara, A.; Penicka, M.; Van Mieghem, C.; Wijns, W. Coronary artery anomaly and evaluation by FFR computed tomography. Eur. Heart J. Cardiovasc. Imaging 2016, 17, 468. [Google Scholar] [CrossRef]
- Kawaji, T.; Shiomi, H.; Shizuta, S.; Kimura, T. Diagnosis of functional ischemia in a right coronary artery with anomalous aortic origin. J. Cardiovasc. Comput. Tomogr. 2016, 10, 188–190. [Google Scholar] [CrossRef]
- Zimmermann, F.M.; Kobayashi, Y.; Mullen, W.L.; Fearon, W.F. Non-invasive FFRCT revealing severe inducible ischaemia in an anomalous right coronary artery. Eur. Heart J. 2017, 38, 2569. [Google Scholar] [CrossRef]
- Miki, T.; Miyoshi, T.; Watanabe, A.; Osawa, K.; Amioka, N.; Ito, H. Anomalous aortic origin of the right coronary artery with functional ischemia determined with fractional flow reserve derived from computed tomography. Clin. Case Rep. 2018, 6, 1371–1372. [Google Scholar] [CrossRef]
- Tahir, H.; Ahmad, S.; Awan, M.U.; Omar, B.; Glass, J.; Cole, J. Anomalous Origin of Left Anterior Descending Artery and Left Circumflex Artery from Right Coronary Sinus with Malignant Left Anterior Descending Artery Course: Role of Coronary CT Angiography Derived Fractional Flow Reserve in Decision Making. Cureus 2018, 10, e3220. [Google Scholar] [CrossRef]
- Pascoe, H.M.; Lui, E.; Joshi, S.B.; Bui, J.; Hawson, J.; Iyer, R.; McCusker, M.W.; Langenberg, F.; Better, N. On-site CT-FFR of an anomalous right coronary artery to influence revascularization strategy. J. Nucl. Cardiol. 2019, 26, 1020–1022. [Google Scholar] [CrossRef]
- Tang, C.X.; Lu, M.J.; Schoepf, J.U.; Tesche, C.; Bauer, M.; Nance, J.; Griffith, P.; Lu, G.M.; Zhang, L.J. Coronary Computed Tomography Angiography-Derived Fractional Flow Reserve in Patients with Anomalous Origin of the Right Coronary Artery from the Left Coronary Sinus. Korean J. Radiol. 2020, 21, 192–202. [Google Scholar] [CrossRef] [PubMed]
- Adjedj, J.; Hyafil, F.; Halna du Fretay, X.; Dupouy, P.; Juliard, J.M.; Ou, P.; Laissy, J.P.; Muller, O.; Wijns, W.; Aubry, P.; et al. Physiological Evaluation of Anomalous Aortic Origin of a Coronary Artery Using Computed Tomography-Derived Fractional Flow Reserve. J. Am. Heart Assoc. 2021, 10, e018593. [Google Scholar] [CrossRef]
- Ferrag, W.; Scalbert, F.; Adjedj, J.; Dupouy, P.; Ou, P.; Juliard, J.M.; Farnoud, R.; Benadji, A.A.; Du Fretay, X.H.; Wijns, W.; et al. Role of FFR-CT for the Evaluation of Patients With Anomalous Aortic Origin of Coronary Artery. JACC Cardiovasc. Imaging 2021, 14, 1074–1076. [Google Scholar] [CrossRef] [PubMed]
- Medepalli, L.C.; Medepalli, V.M.; Scully, T.A. The complementary nature of multimodal imaging in the management of an anomalous aortic origin of the right coronary artery from the left coronary cusp. J. Nucl. Cardiol. 2021, 28, 2399–2402. [Google Scholar] [CrossRef] [PubMed]
- Bigler, M.R.; Stark, A.W.; Giannopoulos, A.A.; Huber, A.T.; Siepe, M.; Kadner, A.; Raber, L.; Grani, C. Coronary CT FFR vs Invasive Adenosine and Dobutamine FFR in a Right Anomalous Coronary Artery. JACC Case Rep. 2022, 4, 929–933. [Google Scholar] [CrossRef] [PubMed]
- Adjedj, J.; Hyafil, F.; Aminfar, F.; Halna du Fretay, X.; Picard, F.; Dupouy, P.; Juliard, J.M.; Muller, O.; Wijns, W.; Aubry, P.; et al. Feasibility of Quantitative Flow Ratio in Adult Patients With Anomalous Aortic Origin of the Coronary Artery With 5 Years of Clinical Follow-up. J. Invasive Cardiol. 2021, 33, E269–E274. [Google Scholar]
- Rigatelli, G.; Zuin, M.; Galasso, P.; Carraro, M.; D’Elia, K.; Daniela, L.; Roncon, L.; Truyen, T.; Nguyen, T. Mechanisms of Myocardial Ischemia Inducing Sudden Cardiac Death in Athletes with Anomalous Coronary Origin from the Opposite Sinus: Insights from a computational fluid dynamic study. Cardiovasc. Revascularization Med. 2019, 20, 1112–1116. [Google Scholar] [CrossRef]
- Cong, M.; Xu, X.; Qiu, J.; Dai, S.; Chen, C.; Qian, X.; Zhang, H.; Qin, S.; Zhao, H. Influence of malformation of right coronary artery originating from the left sinus in hemodynamic environment. Biomed. Eng. Online 2020, 19, 59. [Google Scholar] [CrossRef]
- Rigatelli, G.; Zuin, M. Computed Tomography-based Patient-specific Biomechanical and Fluid Dynamic Study of Anomalous Coronary Arteries with Origin from the Opposite Sinus and Intramural Course. Heart Int. 2020, 14, 105–111. [Google Scholar] [CrossRef]
- Cong, M.; Zhao, H.; Dai, S.; Chen, C.; Xu, X.; Qiu, J.; Qin, S. Transient numerical simulation of the right coronary artery originating from the left sinus and the effect of its acute take-off angle on hemodynamics. Quant. Imaging Med. Surg. 2021, 11, 2062–2075. [Google Scholar] [CrossRef] [PubMed]
- Razavi, A.; Sachdeva, S.; Frommelt, P.C.; LaDisa, J.F., Jr. Patient-Specific Numerical Analysis of Coronary Flow in Children With Intramural Anomalous Aortic Origin of Coronary Arteries. Semin. Thorac. Cardiovasc. Surg. 2021, 33, 155–167. [Google Scholar] [CrossRef] [PubMed]
- Chidyagwai, S.G.; Vardhan, M.; Kaplan, M.; Chamberlain, R.; Barker, P.; Randles, A. Characterization of hemodynamics in anomalous aortic origin of coronary arteries using patient-specific modeling. J. Biomech. 2022, 132, 110919. [Google Scholar] [CrossRef] [PubMed]
- Jiang, M.X.; Khan, M.O.; Ghobrial, J.; Rogers, I.S.; Pettersson, G.B.; Blackstone, E.H.; Marsden, A.L. Patient-specific fluid-structure simulations of anomalous aortic origin of right coronary arteries. JTCVS Tech. 2022, 13, 144–162. [Google Scholar] [CrossRef] [PubMed]
- Gasser, T.C. Vascular Biomechanics: Concepts, Models, and Applications; Springer: Berlin/Heidelberg, Germany, 2021. [Google Scholar]
- Robertson, A.S.A.; Owens, R. Cardiovascular Mathematics Modeling and Simulation of the Circulatory System; Springer: Berlin/Heidelberg, Germany, 2009. [Google Scholar]
- Li, S.; Tang, X.; Peng, L.; Luo, Y.; Dong, R.; Liu, J. The diagnostic performance of CT-derived fractional flow reserve for evaluation of myocardial ischaemia confirmed by invasive fractional flow reserve: A meta-analysis. Clin. Radiol. 2015, 70, 476–486. [Google Scholar] [CrossRef]
- Douglas, P.S.; De Bruyne, B.; Pontone, G.; Patel, M.R.; Norgaard, B.L.; Byrne, R.A.; Curzen, N.; Purcell, I.; Gutberlet, M.; Rioufol, G.; et al. 1-Year Outcomes of FFRCT-Guided Care in Patients With Suspected Coronary Disease: The PLATFORM Study. J. Am. Coll. Cardiol. 2016, 68, 435–445. [Google Scholar] [CrossRef]
- Lu, M.T.; Ferencik, M.; Roberts, R.S.; Lee, K.L.; Ivanov, A.; Adami, E.; Mark, D.B.; Jaffer, F.A.; Leipsic, J.A.; Douglas, P.S.; et al. Noninvasive FFR Derived From Coronary CT Angiography: Management and Outcomes in the PROMISE Trial. JACC Cardiovasc. Imaging 2017, 10, 1350–1358. [Google Scholar] [CrossRef]
- Norgaard, B.L.; Terkelsen, C.J.; Mathiassen, O.N.; Grove, E.L.; Botker, H.E.; Parner, E.; Leipsic, J.; Steffensen, F.H.; Riis, A.H.; Pedersen, K.; et al. Coronary CT Angiographic and Flow Reserve-Guided Management of Patients With Stable Ischemic Heart Disease. J. Am. Coll. Cardiol. 2018, 72, 2123–2134. [Google Scholar] [CrossRef]
- Coenen, A.; Lubbers, M.M.; Kurata, A.; Kono, A.; Dedic, A.; Chelu, R.G.; Dijkshoorn, M.L.; Gijsen, F.J.; Ouhlous, M.; van Geuns, R.J.; et al. Fractional flow reserve computed from noninvasive CT angiography data: Diagnostic performance of an on-site clinician-operated computational fluid dynamics algorithm. Radiology 2015, 274, 674–683. [Google Scholar] [CrossRef]
- Xu, B.; Tu, S.; Song, L.; Jin, Z.; Yu, B.; Fu, G.; Zhou, Y.; Wang, J.; Chen, Y.; Pu, J.; et al. Angiographic quantitative flow ratio-guided coronary intervention (FAVOR III China): A multicentre, randomised, sham-controlled trial. Lancet 2021, 398, 2149–2159. [Google Scholar] [CrossRef]
- Echavarria-Pinto, M.; Van de Hoef, T.P.; Pacheco-Beltran, N.; Reyes-Carrera, J.E.; Rangel-Alvarado, E.; Ledezma-Ledezma, E.; Aguilar-Castillo, L.A.; Tovar-Becerra, A.I.; Arellano, J.E.M.; Ramirez, M.N.M.; et al. Diagnostic agreement of quantitative flow ratio with fractional flow reserve in a Latin-American population. Int. J. Cardiovasc. Imaging 2022, 38, 1423–1430. [Google Scholar] [CrossRef] [PubMed]
- Dai, N.; Zhang, R.; Yuan, S.; Hu, N.; Guan, C.; Zou, T.; Qiao, Z.; He, J.; Duan, S.; Xie, L.; et al. Prognostic Implications of Quantitative Flow Ratio-Derived Physiological 2-Dimensional Residual Disease Patterns After Stenting. JACC Cardiovasc. Interv. 2022, 15, 1624–1634. [Google Scholar] [CrossRef] [PubMed]
- Biscaglia, S.; Verardi, F.M.; Tebaldi, M.; Guiducci, V.; Caglioni, S.; Campana, R.; Scala, A.; Marrone, A.; Pompei, G.; Marchini, F.; et al. QFR-Based Virtual PCI or Conventional Angiography to Guide PCI: The AQVA Trial. JACC Cardiovasc. Interv. 2023, 16, 783–794. [Google Scholar] [CrossRef] [PubMed]
- Koo, B.K.; Erglis, A.; Doh, J.H.; Daniels, D.V.; Jegere, S.; Kim, H.S.; Dunning, A.; DeFrance, T.; Lansky, A.; Leipsic, J.; et al. Diagnosis of ischemia-causing coronary stenoses by noninvasive fractional flow reserve computed from coronary computed tomographic angiograms. Results from the prospective multicenter DISCOVER-FLOW (Diagnosis of Ischemia-Causing Stenoses Obtained Via Noninvasive Fractional Flow Reserve) study. J. Am. Coll. Cardiol. 2011, 58, 1989–1997. [Google Scholar] [CrossRef]
- Min, J.K.; Taylor, C.A.; Achenbach, S.; Koo, B.K.; Leipsic, J.; Norgaard, B.L.; Pijls, N.J.; De Bruyne, B. Noninvasive Fractional Flow Reserve Derived From Coronary CT Angiography: Clinical Data and Scientific Principles. JACC Cardiovasc. Imaging 2015, 8, 1209–1222. [Google Scholar] [CrossRef]
- Taylor, C.A.; Fonte, T.A.; Min, J.K. Computational fluid dynamics applied to cardiac computed tomography for noninvasive quantification of fractional flow reserve: Scientific basis. J. Am. Coll. Cardiol. 2013, 61, 2233–2241. [Google Scholar] [CrossRef]
- Bigler, M.R.; Ashraf, A.; Seiler, C.; Praz, F.; Ueki, Y.; Windecker, S.; Kadner, A.; Raber, L.; Grani, C. Hemodynamic Relevance of Anomalous Coronary Arteries Originating From the Opposite Sinus of Valsalva-In Search of the Evidence. Front. Cardiovasc. Med. 2020, 7, 591326. [Google Scholar] [CrossRef]
- Angelini, P.; Uribe, C.; Monge, J.; Tobis, J.M.; Elayda, M.A.; Willerson, J.T. Origin of the right coronary artery from the opposite sinus of Valsalva in adults: Characterization by intravascular ultrasonography at baseline and after stent angioplasty. Catheter. Cardiovasc. Interv. 2015, 86, 199–208. [Google Scholar] [CrossRef]
- Lim, M.J.; Forsberg, M.J.; Lee, R.; Kern, M.J. Hemodynamic abnormalities across an anomalous left main coronary artery assessment: Evidence for a dynamic ostial obstruction. Catheter. Cardiovasc. Interv. 2004, 63, 294–298. [Google Scholar] [CrossRef]
- Kaushal, S.; Backer, C.L.; Popescu, A.R.; Walker, B.L.; Russell, H.M.; Koenig, P.R.; Rigsby, C.K.; Mavroudis, C. Intramural coronary length correlates with symptoms in patients with anomalous aortic origin of the coronary artery. Ann. Thorac. Surg. 2011, 92, 986–991. [Google Scholar] [CrossRef]
- Lin, E.; Alessio, A. What are the basic concepts of temporal, contrast, and spatial resolution in cardiac CT? J. Cardiovasc. Comput. Tomogr. 2009, 3, 403–408. [Google Scholar] [CrossRef]
- Thomsen, F.S.L.; Horstmeier, S.; Niehoff, J.H.; Pena, J.A.; Borggrefe, J. Effective Spatial Resolution of Photon Counting CT for Imaging of Trabecular Structures is Superior to Conventional Clinical CT and Similar to High Resolution Peripheral CT. Investig. Radiol. 2022, 57, 620–626. [Google Scholar] [CrossRef]
- van der Bie, J.; van Straten, M.; Booij, R.; Bos, D.; Dijkshoorn, M.L.; Hirsch, A.; Sharma, S.P.; Oei, E.H.G.; Budde, R.P.J. Photon-counting CT: Review of initial clinical results. Eur. J. Radiol. 2023, 163, 110829. [Google Scholar] [CrossRef]
- Bezerra, H.G.; Costa, M.A.; Guagliumi, G.; Rollins, A.M.; Simon, D.I. Intracoronary optical coherence tomography: A comprehensive review clinical and research applications. JACC Cardiovasc. Interv. 2009, 2, 1035–1046. [Google Scholar] [CrossRef]
- Kim, C.; Hong, S.J.; Shin, D.H.; Kim, J.S.; Kim, B.K.; Ko, Y.G.; Choi, D.; Jang, Y.; Hong, M.K. Limitations of coronary computed tomographic angiography for delineating the lumen and vessel contours of coronary arteries in patients with stable angina. Eur. Heart J. Cardiovasc. Imaging 2015, 16, 1358–1365. [Google Scholar] [CrossRef]
- Gijsen, F.; Katagiri, Y.; Barlis, P.; Bourantas, C.; Collet, C.; Coskun, U.; Daemen, J.; Dijkstra, J.; Edelman, E.; Evans, P.; et al. Expert recommendations on the assessment of wall shear stress in human coronary arteries: Existing methodologies, technical considerations, and clinical applications. Eur. Heart J. 2019, 40, 3421–3433. [Google Scholar] [CrossRef] [PubMed]
- Ferraro, A.M.; Uslenghi, A.; Lu, M.; Newburger, J.W.; Nathan, M.; Quinonez, L.G.; Beroukhim, R.S. Computed tomography angiography (CTA) of anomalous aortic origin of a coronary artery (AAOCA): Which measurements are accurate and reliable? J. Cardiovasc. Comput. Tomogr. 2023, 17, 130–137. [Google Scholar] [CrossRef] [PubMed]
- Ballyk, P.D.; Steinman, D.A.; Ethier, C.R. Simulation of non-Newtonian blood flow in an end-to-side anastomosis. Biorheology 1994, 31, 565–586. [Google Scholar] [CrossRef]
- Morbiducci, U.; Gallo, D.; Massai, D.; Ponzini, R.; Deriu, M.A.; Antiga, L.; Redaelli, A.; Montevecchi, F.M. On the importance of blood rheology for bulk flow in hemodynamic models of the carotid bifurcation. J. Biomech. 2011, 44, 2427–2438. [Google Scholar] [CrossRef] [PubMed]
- Cho, Y.I.; Kensey, K.R. Effects of the non-Newtonian viscosity of blood on flows in a diseased arterial vessel. Part 1: Steady flows. Biorheology 1991, 28, 241–262. [Google Scholar] [CrossRef]
- Thondapu, V.; Shishikura, D.; Dijkstra, J.; Zhu, S.J.; Revalor, E.; Serruys, P.W.; van Gaal, W.J.; Poon, E.K.W.; Ooi, A.; Barlis, P. Non-Newtonian Endothelial Shear Stress Simulation: Does It Matter? Front. Cardiovasc. Med. 2022, 9, 835270. [Google Scholar] [CrossRef] [PubMed]
- Hennigan, B.; Oldroyd, K.G.; Berry, C.; Johnson, N.; McClure, J.; McCartney, P.; McEntegart, M.B.; Eteiba, H.; Petrie, M.C.; Rocchiccioli, P.; et al. Discordance Between Resting and Hyperemic Indices of Coronary Stenosis Severity: The VERIFY 2 Study (A Comparative Study of Resting Coronary Pressure Gradient, Instantaneous Wave-Free Ratio and Fractional Flow Reserve in an Unselected Population Referred for Invasive Angiography). Circ. Cardiovasc. Interv. 2016, 9, e004016. [Google Scholar] [CrossRef] [PubMed]
- Berry, C.; van’t Veer, M.; Witt, N.; Kala, P.; Bocek, O.; Pyxaras, S.A.; McClure, J.D.; Fearon, W.F.; Barbato, E.; Tonino, P.A.; et al. VERIFY (VERification of Instantaneous Wave-Free Ratio and Fractional Flow Reserve for the Assessment of Coronary Artery Stenosis Severity in EverydaY Practice): A multicenter study in consecutive patients. J. Am. Coll. Cardiol. 2013, 61, 1421–1427. [Google Scholar] [CrossRef]
- Nijjer, S.S.; de Waard, G.A.; Sen, S.; van de Hoef, T.P.; Petraco, R.; Echavarria-Pinto, M.; van Lavieren, M.A.; Meuwissen, M.; Danad, I.; Knaapen, P.; et al. Coronary pressure and flow relationships in humans: Phasic analysis of normal and pathological vessels and the implications for stenosis assessment: A report from the Iberian-Dutch-English (IDEAL) collaborators. Eur. Heart J. 2016, 37, 2069–2080. [Google Scholar] [CrossRef] [PubMed]
- McCray, L.C.; Fogwe, D.T.; Aggarwal, K.; Karuparthi, P.R. Novel Assessment of Ischemia in Patients With Anomalous Right Coronary Artery. JACC Case Rep. 2019, 1, 819–822. [Google Scholar] [CrossRef]
- Escaned, J.; Cortes, J.; Flores, A.; Goicolea, J.; Alfonso, F.; Hernandez, R.; Fernandez-Ortiz, A.; Sabate, M.; Banuelos, C.; Macaya, C. Importance of diastolic fractional flow reserve and dobutamine challenge in physiologic assessment of myocardial bridging. J. Am. Coll. Cardiol. 2003, 42, 226–233. [Google Scholar] [CrossRef]
- Everaars, H.; de Waard, G.A.; Driessen, R.S.; Danad, I.; van de Ven, P.M.; Raijmakers, P.G.; Lammertsma, A.A.; van Rossum, A.C.; Knaapen, P.; van Royen, N. Doppler Flow Velocity and Thermodilution to Assess Coronary Flow Reserve: A Head-to-Head Comparison With [(15)O]H(2)O PET. JACC Cardiovasc. Interv. 2018, 11, 2044–2054. [Google Scholar] [CrossRef]
- Feenstra, R.G.T.; Seitz, A.; Boerhout, C.K.M.; de Winter, R.J.; Ong, P.; Beijk, M.A.M.; Piek, J.J.; Sechtem, U.; van de Hoef, T.P. Reference values for intracoronary Doppler flow velocity-derived hyperaemic microvascular resistance index. Int. J. Cardiol. 2023, 371, 16–20. [Google Scholar] [CrossRef]
- Heller, L.I.; Silver, K.H.; Villegas, B.J.; Balcom, S.J.; Weiner, B.H. Blood flow velocity in the right coronary artery: Assessment before and after angioplasty. J. Am. Coll. Cardiol. 1994, 24, 1012–1017. [Google Scholar] [CrossRef]
- Shi, Y.; Lawford, P.; Hose, R. Review of zero-D and 1-D models of blood flow in the cardiovascular system. Biomed. Eng. Online 2011, 10, 33. [Google Scholar] [CrossRef]
- Wichmann, K.K.M.; Löhner, R.; Wall, W.A. A runtime based comparison of highly tuned lattice Boltzmann and finite difference solvers. IJHPCA 2021, 35, 370–390. [Google Scholar] [CrossRef]
- Newman, T.; Borker, R.; Aubiniere-Robb, L.; Hendrickson, J.; Choudhury, D.; Halliday, I.; Fenner, J.; Narracott, A.; Hose, D.R.; Gosling, R.; et al. Rapid virtual fractional flow reserve using 3D computational fluid dynamics. Eur. Heart J. Digit. Health 2023, 4, 283–290. [Google Scholar] [CrossRef] [PubMed]

| First Author | Year | n | Type | Solver | Setting (R-AAOCA, L-AAOCA, Both) | Aim | Validation with Invasive Measurements |
|---|---|---|---|---|---|---|---|
| Adjedj et al. [16] | 2016 | 1 | Case Report | FFRCT * | Left | CT-FFR for decision making | N/A |
| Kawaji et al. [17] | 2017 | 1 | Case Report | FFRCT * | Right | CT-FFR for decision making | FFR adenosine |
| Zimmermann et al. [18] | 2017 | 1 | Case Report | FFRCT * | Right | CT-FFR for decision making | FFR adenosine |
| Miki et al. [19] | 2018 | 1 | Case Report | FFRCT * | Right | CT-FFR for decision making | FFR adenosine |
| Tahir et al. [20] | 2018 | 1 | Case Report | FFRCT * | Left | CT-FFR for decision making | N/A |
| Pascoe et al. [21] | 2019 | 1 | Case Report | cFFR * | Right | CT-FFR for decision making | FFR adenosine |
| Tang et al. [22] | 2020 | 94 | Systematic Study | cFFR * | Right | Anatomical high-risk features correlation with CT-FFR | N/A |
| Adjedj et al. [23] | 2021 | 54 | Systematic Study | FFRCT * | Both and Cx and single coronary arteries | CT-FFR in patients with an interarterial course versus other anomalous vessels | N/A |
| Ferrag et al. [24] | 2021 | 62 | Systematic Study | FFRCT * | Both and Cx | CT-FFR in patients with and without high-risk features. Optimal cut-off to detect IMC | N/A |
| Medepalli et al. [25] | 2021 | 1 | Case Report | FFRCT * | Right | CT-FFR for decision making | N/A |
| Bigler et al. [26] | 2022 | 1 | Case Report | cFFR * | Right | CT-FFR compared to invasively measured FFR | FFR adenosine and FFR dobutamine |
| Adjedj et al. [27] | 2021 | 41 | Systematic Study | QFR * | Right | QFR for outcome prediction in R-AAOCA | N/A |
| Rigatelli et al. [28] | 2019 | 13 | Systematic Study | ANSYS (CFD) ** | Left | Comparison of WSS and vorticity magnitude of AAOCA with and without IMC | N/A |
| Cong et al. [29] | 2020 | 26 | Systematic Study | ANSYS (CFD) ** | Right | Comparison of WSS and pressure between normal RCA and R-AAOCA | N/A |
| Rigatelli et al. [30] | 2020 | 21 | Systematic Study | ANSYS (CFD & FEA) ** | Both | Virtual stenting of the IMC and post-procedural WSS and vorticity magnitude | N/A |
| Cong et al. [31] | 2021 | 26 | Systematic Study | ANSYS (FSI) ** | Right | Comparison of WSS, volumetric flow and pressure between a normal RCA and R-AAOCA | N/A |
| Razavi et al. [32] | 2021 | 6 | Systematic Study | SimVascular (CFD) ** | Both | Comparison of pre- and postoperative WSS and oscillatory shear index for different high-risk features | N/A |
| Chidyagwai et al. [33] | 2022 | 13 | Systematic Study | HARVEY (CFD) ** | Both | Comparison of rest and stress conditions for AAOCA and then compared to normal coronaries | N/A |
| Jiang et al. [34] | 2022 | 6 | Systematic Study | SimVascular (FSI) ** | Right | Comparison of FSI model of aortic root during dobutamine stress to invasively measured iFR | iFR dobutamine |
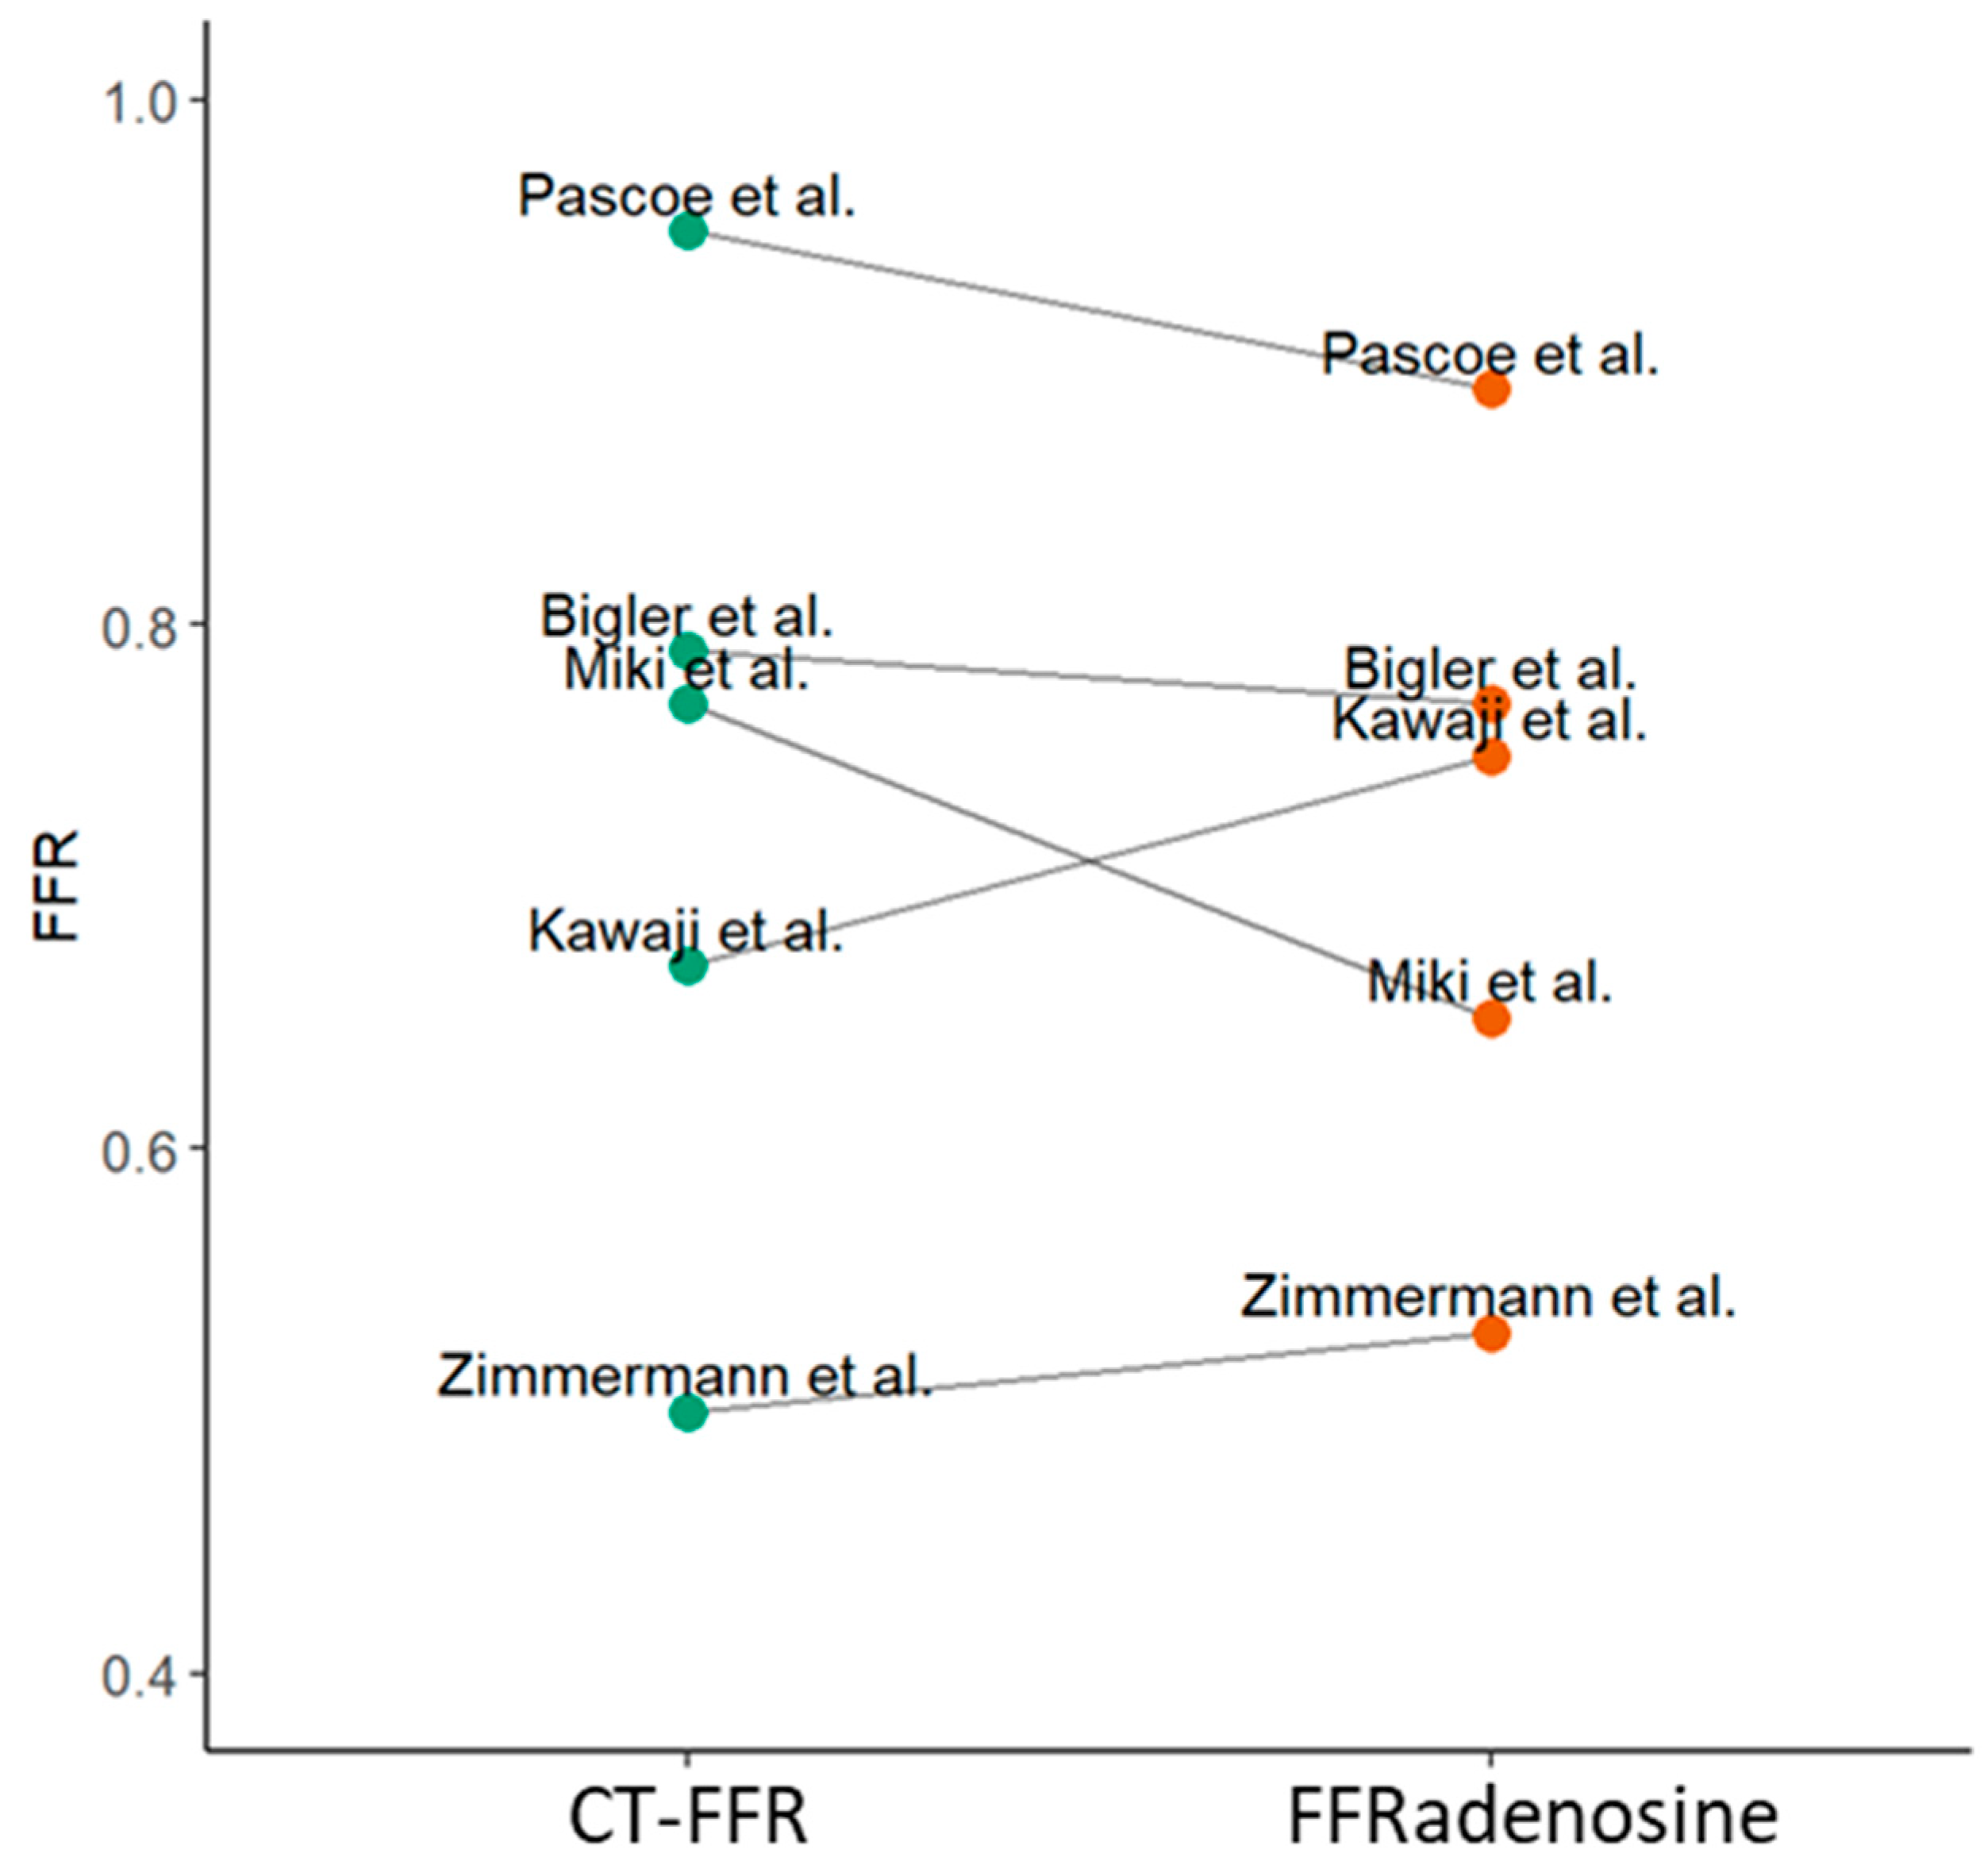
| First Author | Software | Year | n (Patients) | n (IA) | n (R-AAOCA) | n (L-AAOCA) | CT-FFR All | CT-FFR Right | CT-FFR Left | FFRadenosine | FFRdobutamine |
|---|---|---|---|---|---|---|---|---|---|---|---|
| Pascoe et al. [21] | cFFR | 2019 | 1 | 1 | 1 | 0 | 0.95 | 0.89 | |||
| Tang et al. [22] | cFFR | 2020 | 94 | 94 | 1 | 0 | 0.94 (0.88–0.96) | ||||
| Bigler et al. [26] | cFFR | 2022 | 1 | 1 | 1 | 0 | 0.79 | 0.77 | 0.72 | ||
| Adjedj et al. [16] | FFRCT | 2016 | 1 | 1 | 0 | 1 | 0.82 | ||||
| Kawaji et al. [17] | FFRCT | 2017 | 1 | 1 | 1 | 0 | 0.67 | 0.75 | |||
| Zimmermann et al. [18] | FFRCT | 2017 | 1 | 1 | 1 | 0 | 0.5 | 0.53 | |||
| Miki et al. [19] | FFRCT | 2018 | 1 | 1 | 1 | 0 | 0.77 | 0.65 | |||
| Tahir et al. [20] | FFRCT | 2018 | 1 | 1 | 0 | 1 | 0.82 | ||||
| Ferrag et al. [24] | FFRCT | 2021 | 62 | 37 | 37 | 11 | 0.8 (0.74–0.88 IMC), 0.96 (0.93–0.98 not IMC) | ||||
| Medepalli et al. [25] | FFRCT | 2021 | 1 | 1 | 1 | 0 | 0.75 | ||||
| Adjedj et al. [16] | FFRCT | 2021 | 54 | 33 | 31 | 2 | 0.90 ± 0.10 | 0.89 ± 0.20 | 0.85 ± 0.09 | ||
| Adjedj et al. [27] | QFR | 2021 | 41 | 41 | 41 | 0 | 0.90 ± 0.10 |
| First Author | Number of Models Made | Imaging Modality and Segmentation | Mesh Quality | Newtonian/non-Newtonian, Blood Density [kg/m3] and Viscosity | Inlet Boundary Condition | Outlet Boundary Conditions | Wall Boundary Conditions | Steady State vs. Transient | Post Processing |
|---|---|---|---|---|---|---|---|---|---|
| Cong et al. [31] | 26 (16 normal RCAs and 10 R-AAOCA) | CCTA and half-automatic segmentation with Materialize Mimics, aortic root, and coronaries | Mesh independence study performed, maximum face size 0.0008 m, 3 expansion layers | Newtonian, 1060, viscosity of 3.5 × 10−³ Pa s | Pulsatile flow matching human condition with Fourier series | Constant value with outflow pressure of Aorta to 56 Pa and coronary to 0 Pa | No slip, elastic with Young’s modulus of 5 MPa, and Poisson’s ratio of 0.45 | Transient | Comparison of WSS, pressure, and volumetric flow over cardiac cycle in R-AAOCA compared to normal RCA |
| Rigatelli et al. [28] | 13 L-AAOCA (6 intramural vs. 7 only interarterial) | CCTA and manual segmentation with OsiriX, postprocessed with Rhinoceros, aortic root, and coronaries | Ansys Meshing but no specifications | Non-Newtonian, 1060, Carreau | Diastolic pressure from stress tests of healthy athletes, constant inlet pressure | N/A | N/A | Steady | WSS and vorticity magnitude in patients with and without an IMC in rest and stress conditions |
| Cong et al. [29] | 42 (16 normal RCA and 26 R-AAOCA) | CCTA and Mimics for segmentation, Geomagic Studio for optimizing geometry, aortic root, and coronaries | ICEM with mesh size between 0.06 and 1 mm, for fluid 5 mesh layers with 1.2 height ratio and 0.5 mm mesh size | Newtonian, 1060, - | Velocity inlet with tangential velocity of 1 m/s and normal velocity of 0 m/s | Aorta tangential pressure of 93 mmHg, LCA 81.83 mmHg, RCA 92.71 mmHg and normal pressure of 0 | Vessel wall density 1150, Young’s modulus 5 MPa, Poisson ratio 0.45 | Steady | Volumetric flow and pressure in normal RCA and R-AAOCA |
| Rigatelli et al. [30] | 12 R-AAOCA and 9 L-AAOCA with IMC | CCTA and manual segmentation with OsiriX and postprocessed with Rhinoceros, aortic root, and coronaries | Ansys Meshing but no specifications | Non-Newtonian, 1060, Carreau | Pressure inlet with diastolic pressure from patient-specific stress test | N/A | N/A | Steady | WSS and vorticity magnitude before and after virtual stenting. Deformation analysis on geometries before and after |
| Chidyagwai et al. [33] | 6 R-AAOCA, 2 L-AAOCA, 5 Controls | CCTA, Segmentation with Materialize Mimics, only coronaries | Mesh independence study showed convergence at 0.02 mm | Newtonian, 1060, - | Pulsatile Velocity profile at inlet, based on Doppler measurements. For exercise 3x higher cardiac output chosen | Lumped parameter model with microcirculation resistance, chosen to match clinical diastolic and systolic pressure. | Rigid walls, no slip condition, | Transient | WSS and oscillatory shear index in the intramural segment during rest and stress compared to normal anatomy |
| Razavi et al. [32] | 3 R-AAOCA, 3 L-AAOCA (2 pre-unroofing and 2 post-unroofing), further virtual models with different acute take-off angles | CMR, Segmentation with SimVascular, aortic root, and coronaries | Mesh independence study until <5% change in results resulting in volumetric mesh of 3.5 × 10⁶elements | Newtonian,-, viscosity of 4cP | Inlet with volumetric flow derived from CMR for aorta, flow to each branch with Murray’s law and 4% of total cardiac output | Lumped parameter model with flow and resistance modelled to match 4% of total cardiac output and mean blood pressure | Aortic and coronary compliance in lumped parameter model to match measured blood pressure curve | Transient | WSS and oscillatory shear index pre- and post-unroofing |
| Jiang et al. [34] | 6 R-AAOCA, 5 with an IMC | CCTA, segmentation performed in SimVascular, optimization in MeshMixer, aortic root, and coronaries with offset for aortic wall 1.7 mm and coronaries 0.9 mm then adjusted to match IMC | Mesh generated such as at least 2 elements for walls and 5 elements for fluid domain, mesh independence study performed | Newtonian, 1040, viscosity of 0.4 dynes/cm2 | Neumann boundary condition to match aorta pressure waveform from iFR measurements at rest and stress (high frequency artefacts removed with fast Fourier transform) | Lumped parameter model to match cardiac output based on echocardiography, for stress increase 3×, resistance for aorta and coronaries based on heathy patients, capacitance 0.001cm5/dyne | Elastic wall for aorta and coronaries with E 1.5 MPa, poison ratio of 0.49, and density of 1.2 g/cm3 | Transient FSI model | Comparison of CFD iFR during stress conditions compared to invasively measured iFR under dobutamine stress |
Disclaimer/Publisher’s Note: The statements, opinions and data contained in all publications are solely those of the individual author(s) and contributor(s) and not of MDPI and/or the editor(s). MDPI and/or the editor(s) disclaim responsibility for any injury to people or property resulting from any ideas, methods, instructions or products referred to in the content. |
© 2023 by the authors. Licensee MDPI, Basel, Switzerland. This article is an open access article distributed under the terms and conditions of the Creative Commons Attribution (CC BY) license (https://creativecommons.org/licenses/by/4.0/).
Share and Cite
Stark, A.W.; Giannopoulos, A.A.; Pugachev, A.; Shiri, I.; Haeberlin, A.; Räber, L.; Obrist, D.; Gräni, C. Application of Patient-Specific Computational Fluid Dynamics in Anomalous Aortic Origin of Coronary Artery: A Systematic Review. J. Cardiovasc. Dev. Dis. 2023, 10, 384. https://doi.org/10.3390/jcdd10090384
Stark AW, Giannopoulos AA, Pugachev A, Shiri I, Haeberlin A, Räber L, Obrist D, Gräni C. Application of Patient-Specific Computational Fluid Dynamics in Anomalous Aortic Origin of Coronary Artery: A Systematic Review. Journal of Cardiovascular Development and Disease. 2023; 10(9):384. https://doi.org/10.3390/jcdd10090384
Chicago/Turabian StyleStark, Anselm W., Andreas A. Giannopoulos, Alexander Pugachev, Isaac Shiri, Andreas Haeberlin, Lorenz Räber, Dominik Obrist, and Christoph Gräni. 2023. "Application of Patient-Specific Computational Fluid Dynamics in Anomalous Aortic Origin of Coronary Artery: A Systematic Review" Journal of Cardiovascular Development and Disease 10, no. 9: 384. https://doi.org/10.3390/jcdd10090384
APA StyleStark, A. W., Giannopoulos, A. A., Pugachev, A., Shiri, I., Haeberlin, A., Räber, L., Obrist, D., & Gräni, C. (2023). Application of Patient-Specific Computational Fluid Dynamics in Anomalous Aortic Origin of Coronary Artery: A Systematic Review. Journal of Cardiovascular Development and Disease, 10(9), 384. https://doi.org/10.3390/jcdd10090384