How Well Do Seniors Estimate Distance to Food? The Accuracy of Older Adults’ Reported Proximity to Local Grocery Stores
Abstract
1. Introduction
Study Objectives
2. Materials and Methods
2.1. Study Overview
2.2. Measures
2.2.1. Survey Measures
2.2.2. Geographic Information Systems (GIS) Measures
2.3. Accuracy of Distance to Supermarket Perception
2.4. Statistical Procedures
3. Results
3.1. Study Population
3.2. Analysis I: Associations with Objective Supermarket Distance
3.3. Analysis II: Accuracy of Perceived Supermarket Access in Relation to Objective Access
4. Discussion
Limitations
5. Conclusions
Supplementary Materials
Author Contributions
Funding
Conflicts of Interest
References
- Kärmeniemi, M.; Lankila, T.; Ikäheimo, T.; Koivumaa-Honkanen, H.; Korpelainen, R. The Built Environment as a Determinant of Physical Activity: A Systematic Review of Longitudinal Studies and Natural Experiments. Ann. Behav. Med. 2018, 52, 239–251. [Google Scholar] [CrossRef] [PubMed]
- Mayne, S.L.; Auchincloss, A.H.; Michael, Y.L. Impact of policy and built environment changes on obesity-related outcomes: A systematic review of naturally occurring experiments. Obes. Rev. 2015, 16, 362–375. [Google Scholar] [CrossRef] [PubMed]
- Hernandez, D.C.; Johnston, C.A. Individual and Environmental Barriers to Successful Aging: The Importance of Considering Environmental Supports. Am. J. Lifestyle Med. 2017, 11, 21–23. [Google Scholar] [CrossRef] [PubMed]
- Yen, I.H.; Michael, Y.L.; Perdue, L. Neighborhood Environment in Studies of Health of Older Adults. Am. J. Prev. Med. 2009, 37, 455–463. [Google Scholar] [CrossRef] [PubMed]
- Cerin, E.; Nathan, A.; van Cauwenberg, J.; Barnett, D.W.; Barnett, A. The neighbourhood physical environment and active travel in older adults: A systematic review and meta-analysis. Int. J. Behav. Nutr. Phys. Act. 2017, 14, 15. [Google Scholar] [CrossRef]
- Barnett, D.W.; Barnett, A.; Nathan, A.; Van Cauwenberg, J.; Cerin, E. Built environmental correlates of older adults’ total physical activity and walking: A systematic review and meta-analysis. Int. J. Behav. Nutr. Phys. Act. 2017, 14, 103. [Google Scholar] [CrossRef]
- Kirtland, K.A.; Porter, D.E.; Addy, C.L.; Neet, M.J.; Williams, J.E.; Sharpe, P.A.; Neff, L.J.; Kimsey, C.D., Jr.; Ainsworth, B.E. Environmental measures of physical activity supports: Perception versus reality. Am. J. Prev. Med. 2003, 24, 323–331. [Google Scholar] [CrossRef]
- Kweon, B.-S.; Ellis, C.D.; Lee, S.-W.; Rogers, G.O. Large-Scale Environmental Knowledge: Investigating the Relationship between Self-Reported and Objectively Measured Physical Environments. Environ. Behav. 2006, 38, 72–91. [Google Scholar] [CrossRef]
- Won, J.; Lee, C.; Forjuoh, S.N.; Ory, M.G. Neighborhood safety factors associated with older adults’ health-related outcomes: A systematic literature review. Soc. Sci. Med. 2016, 165, 177–186. [Google Scholar] [CrossRef]
- Lee, S.M.; Conway, T.L.; Frank, L.D.; Saelens, B.E.; Cain, K.L.; Sallis, J.F. The Relation of Perceived and Objective Environment Attributes to Neighborhood Satisfaction. Environ. Behav. 2017, 49, 136–160. [Google Scholar] [CrossRef]
- Sohi, I.; Bell, B.A.; Liu, J.; Battersby, S.E.; Liese, A.D. Differences in Food Environment Perceptions and Spatial Attributes of Food Shopping Between Residents of Low and High Food Access Areas. J. Nutr. Educ. Behav. 2014, 46, 241–249. [Google Scholar] [CrossRef] [PubMed]
- Barnes, T.L.; Freedman, D.A.; Bell, B.A.; Colabianchi, N.; Liese, A.D. Geographic measures of retail food outlets and perceived availability of healthy foods in neighbourhoods. Public Health Nutr. 2016, 19, 1368–1374. [Google Scholar] [CrossRef] [PubMed]
- Caspi, C.E.; Kawachi, I.; Subramanian, S.V.; Adamkiewicz, G.; Sorensen, G. The relationship between diet and perceived and objective access to supermarkets among low-income housing residents. Soc. Sci. Med. 2012, 75, 1254–1262. [Google Scholar] [CrossRef]
- Cummins, S.; Flint, E.; Matthews, S.A. New Neighborhood Grocery Store Increased Awareness of Food Access But Did Not Alter Dietary Habits or Obesity. Health Aff. 2014, 33, 283–291. [Google Scholar] [CrossRef] [PubMed]
- Sharkey, J.R.; Johnson, C.M.; Dean, W.R. Food Access and Perceptions of the Community and Household Food Environment as Correlates of Fruit and Vegetable Intake among Rural Seniors. BMC Geriatr. 2010, 10, 32. [Google Scholar] [CrossRef] [PubMed]
- Glanz, K.; Sallis, J.F.; Saelens, B.E.; Frank, L.D. Healthy Nutrition Environments: Concepts and Measures. Am. J. Health Promot. 2005, 19, 330–333. [Google Scholar] [CrossRef] [PubMed]
- Nicklett, E.J.; Kadell, A.R. Fruit and vegetable intake among older adults: A scoping review. Maturitas 2013, 75, 305–312. [Google Scholar] [CrossRef] [PubMed]
- Clum, G.; Gustat, J.; O’Malley, K.; Begalieva, M.; Luckett, B.; Rice, J.; Johnson, C. Factors influencing consumption of fruits and vegetables in older adults in New Orleans, Louisiana. J. Nutr. Health Aging 2016, 20, 678–684. [Google Scholar] [CrossRef]
- Dubowitz, T.; Ghosh-Dastidar, M.; Cohen, D.A.; Beckman, R.; Steiner, E.D.; Hunter, G.P.; Flórez, K.R.; Huang, C.; Vaughan, C.A.; Sloan, J.C.; et al. Diet And Perceptions Change With Supermarket Introduction In A Food Desert, But Not Because Of Supermarket Use. Health Aff. 2015, 34, 1858–1868. [Google Scholar] [CrossRef] [PubMed]
- Zandieh, R.; Martinez, J.; Flacke, J.; Jones, P.; van Maarseveen, M. Older Adults’ Outdoor Walking: Inequalities in Neighbourhood Safety, Pedestrian Infrastructure and Aesthetics. Int. J. Environ. Res. Public Health 2016, 13, 1179. [Google Scholar] [CrossRef] [PubMed]
- Lehning, A.J.; Smith, R.J.; Dunkle, R.E. Age-Friendly Environments and Self-Rated Health: An Exploration of Detroit Elders. Res. Aging 2014, 36, 72–94. [Google Scholar] [CrossRef] [PubMed]
- Wen, M.; Hawkley, L.C.; Cacioppo, J.T. Objective and perceived neighborhood environment, individual SES and psychosocial factors, and self-rated health: An analysis of older adults in Cook County, Illinois. Soc. Sci. Med. 2006, 63, 2575–2590. [Google Scholar] [CrossRef] [PubMed]
- Munoz-Plaza, C.E.; Morland, K.B.; Pierre, J.A.; Spark, A.; Filomena, S.E.; Noyes, P. Navigating the Urban Food Environment: Challenges and Resilience of Community-dwelling Older Adults. J. Nutr. Educ. Behav. 2013, 45, 322–331. [Google Scholar] [CrossRef] [PubMed]
- Hess, D.B. Walking to the bus: Perceived versus actual walking distance to bus stops for older adults. Transportation 2011, 39, 247–266. [Google Scholar] [CrossRef]
- King, A.C.; Sallis, J.F.; Frank, L.D.; Saelens, B.E.; Cain, K.; Conway, T.L.; Chapman, J.E.; Ahn, D.K.; Kerr, J. Aging in neighborhoods differing in walkability and income: Associations with physical activity and obesity in older adults. Soc. Sci. Med. 2011, 73, 1525–1533. [Google Scholar] [CrossRef] [PubMed]
- Sallis, J.F.; Saelens, B.E.; Frank, L.D.; Conway, T.L.; Slymen, D.J.; Cain, K.L.; Chapman, J.E.; Kerr, J. Neighborhood built environment and income: Examining multiple health outcomes. Soc. Sci. Med. 2009, 68, 1285–1293. [Google Scholar] [CrossRef] [PubMed]
- Cerin, E.; Conway, T.L.; Saelens, B.E.; Frank, L.D.; Sallis, J.F. Cross-validation of the factorial structure of the Neighborhood Environment Walkability Scale (NEWS) and its abbreviated form (NEWS-A). Int. J. Behav. Nutr. Phys. Act. 2009, 6, 32. [Google Scholar] [CrossRef] [PubMed]
- Saelens, B.E.; Sallis, J.F.; Black, J.B.; Chen, D. Neighborhood-Based Differences in Physical Activity: An Environment Scale Evaluation. Am. J. Public Health 2003, 93, 1552–1558. [Google Scholar] [CrossRef]
- Adams, M.A.; Ryan, S.; Kerr, J.; Sallis, J.F.; Patrick, K.; Frank, L.D.; Norman, G.J. Validation of the Neighborhood Environment Walkability Scale (NEWS) Items Using Geographic Information Systems. J. Phys. Act. Health 2009, 6, S113–S123. [Google Scholar] [CrossRef]
- Sayers, S.P.; Jette, A.M.; Haley, S.M.; Heeren, T.C.; Guralnik, J.M.; Fielding, R.A. Validation of the Late-Life Function and Disability Instrument. J. Am. Geriatr. Soc. 2004, 52, 1554–1559. [Google Scholar] [CrossRef]
- Coffin, A.; Morrall, J. Walking Speeds of Elderly Pedestrians at Crosswalks; Transportation Research Record: Washington, DC, UA, 1995; pp. 63–67. [Google Scholar]
- R: Scaling and Centering of Matrix-Like Objects. Available online: https://stat.ethz.ch/R-manual/R-devel/library/base/html/scale.html (accessed on 12 July 2017).
- Kuhn, M. Caret (Classification and Regression Training) R Package That Contains Misc Functions for Training and Plotting Classification and Regression Models. Available online: https://cran.r-project.org/web/packages/caret/caret.pdf (accessed on 20 November 2018).
- Bates, D.; Maechler, M.; Bolker, B.; Walker, S.; Christensen, R.H.B.; Singmann, H.; Dai, B.; Grothendieck, G.; Green, P. lme4: Linear Mixed-Effects Models Using “Eigen” and S4; 2017. [Google Scholar]
- Kuznetsova, A.; Brockhoff, P.B.; Christensen, R.H.B. lmerTest: Tests in Linear Mixed Effects Models; 2017. [Google Scholar]
- Friedman, J.; Hastie, T.; Simon, N.; Tibshirani, R. glmnet: Lasso and Elastic-Net Regularized Generalized Linear Models; 2017. [Google Scholar]
- Venables, W.N.; Ripley, B.D. Modern Applied Statistics with S, 4th ed.; Springer-Verlag: New York, NY, USA, 2002. [Google Scholar]
- Ripley, B.; Venables, W. nnet: Feed-Forward Neural Networks and Multinomial Log-Linear Models; 2016. [Google Scholar]
- Hothorn, T.; Zeileis, A.; Farebrother, R.W.; Cummins, C.; Millo, G.; Mitchell, D. lmtest: Testing Linear Regression Models; 2017. [Google Scholar]
- Lüdecke, D.; Schwemmer, C. sjPlot: Data Visualization for Statistics in Social Science; 2018. [Google Scholar]
- Hlavac, M. stargazer: Beautiful LATEX, HTML and ASCII Tables from R Statistical Output; 2018; p. 11. [Google Scholar]
- Cohen, R.; Weatherford, D.L. Effects of route traveled on the distance estimates of children and adults. J. Exp. Child Psychol. 1980, 29, 403–412. [Google Scholar] [CrossRef]
- Thorndyke, P.W.; Hayes-Roth, B. Differences in spatial knowledge acquired from maps and navigation. Cognit. Psychol. 1982, 14, 560–589. [Google Scholar] [CrossRef]
- Buman, M.P.; Winter, S.J.; Baker, C.; Hekler, E.B.; Otten, J.J.; King, A.C. Neighborhood Eating and Activity Advocacy Teams (NEAAT): Engaging older adults in policy activities to improve food and physical environments. Transl. Behav. Med. 2012, 2, 249–253. [Google Scholar] [CrossRef] [PubMed]
- Winter, S.J.; Buman, M.P.; Sheats, J.L.; Hekler, E.B.; Otten, J.J.; Baker, C.; Cohen, D.; Butler, B.A.; King, A.C. Harnessing the potential of older adults to measure and modify their environments: Long-term successes of the Neighborhood Eating and Activity Advocacy Team (NEAAT) Study. Transl. Behav. Med. 2014, 4, 226–227. [Google Scholar] [CrossRef] [PubMed]
- Sheats, J.L.; Winter, S.J.; Romero, P.P.; King, A.C. FEAST (Food Environment Assessment using the Stanford Tool): Development of a mobile application to crowdsource resident interactions with the food environment. Ann. Behav. Med. 2014, 47. [Google Scholar]
- Cannuscio, C.C.; Hillier, A.; Karpyn, A.; Glanz, K. The social dynamics of healthy food shopping and store choice in an urban environment. Soc. Sci. Med. 2014, 122, 13–20. [Google Scholar] [CrossRef] [PubMed]
- Chrisinger, B. A Mixed-Method Assessment of a New Supermarket in a Food Desert: Contributions to Everyday Life and Health. J. Urban Health 2016, 93, 425–437. [Google Scholar] [CrossRef] [PubMed]
- Hillier, A.; Smith, T.E.; Whiteman, E.D.; Chrisinger, B.W. Discrete Choice Model of Food Store Trips Using National Household Food Acquisition and Purchase Survey (FoodAPS). Int. J. Environ. Res. Public Health 2017, 14, 1133. [Google Scholar] [CrossRef]


| <20 min Walk | ≥20 min Walk | Don’t Know | |
|---|---|---|---|
| Counts (%) | (n = 413) | (n = 351) | (n = 116) |
| Gender | |||
| Male | 206 (0.50) | 152 (0.43) | 27 (0.23) |
| Female | 207 (0.50) | 199 (0.57) | 89 (0.77) |
| Race | |||
| Not white | 119 (0.29) | 101 (0.29) | 42 (0.37) |
| White (not Hispanic) | 292 (0.71) | 249 (0.71) | 73 (0.63) |
| Lives independently | |||
| Yes | 361 (0.87) | 286 (0.81) | 69 (0.59) |
| No | 52 (0.13) | 65 (0.19) | 47 (0.41) |
| Has a valid driver’s license | |||
| Yes | 368 (0.89) | 310 (0.89) | 91 (0.78) |
| No | 45 (0.11) | 40 (0.11) | 25 (0.22) |
| Uses a cane or walker | |||
| Yes | 35 (0.08) | 37 (0.11) | 34 (0.29) |
| No | 377 (0.92) | 314 (0.89) | 82 (0.71) |
| Quadrant | |||
| 1. Low-Walkability/Low-Income | 62 (0.15) | 89 (0.25) | 32 (0.28) |
| 2. Low-Walkability/High-Income | 67 (0.16) | 128 (0.36) | 32 (0.28) |
| 3. High-Walkability/Low-Income | 137 (0.33) | 83 (0.24) | 36 (0.31) |
| 4. High-Walkability/High-Income | 147 (0.36) | 51 (0.15) | 16 (0.14) |
| Site | |||
| Baltimore/Washington, DC | 198 (0.48) | 172 (0.49) | 57 (0.49) |
| Seattle/King County, WA | 215 (0.52) | 179 (0.51) | 59 (0.51) |
| ≥1 vehicle available | |||
| Yes | 366 (0.89) | 310 (0.89) | 88 (0.76) |
| No | 47 (0.11) | 40 (0.11) | 28 (0.24) |
| Dog owner | |||
| Yes | 57 (0.14) | 48 (0.14) | 18 (0.16) |
| No | 356 (0.86) | 302 (0.86) | 98 (0.84) |
| Walked to supermarket in last 30 days | |||
| Yes | 227 (0.55) | 307 (0.87) | 116 (1.00) |
| No | 185 (0.45) | 44 (0.13) | 0 (0.00) |
| Mean (SD) | |||
| Age (y) | 74.74 (6.78) | 75.17 (6.5) | 78.02 (7.28) |
| BMI | 26.11 (4.31) | 26.5 (4.95) | 27.6 (5.87) |
| Household size (persons) | 1.75 (0.68) | 1.74 (0.79) | 1.47 (0.75) |
| Can walk 4 blocks (scale 1–10) | 8.84 (2.53) | 7.93 (3.22) | 6.26 (3.9) |
| Time at current address (months) | 249.57 (189.81) | 274.53 (189.84) | 209.16 (191.4) |
| NEWS Aesthetic score | 3.19 (0.63) | 3.1 (0.7) | 3 (0.73) |
| NEWS Traffic safety score | 2.76 (0.66) | 2.71 (0.7) | 2.66 (0.76) |
| NEWS Pedestrian safety score | 2.73 (0.42) | 2.6 (0.45) | 2.5 (0.51) |
| NEWS Personal safety score | 3.42 (0.56) | 3.36 (0.64) | 3.2 (0.77) |
| NEWS Walk/cycle facilities score | 2.89 (0.75) | 2.7 (0.9) | 2.53 (0.87) |
| Objective distance to supermarket (ft) | 2696 (1947) | 4719 (3019) | 4630 (2724) |
| Outcome: Actual Distance to Grocery Store (in Meters) | |||
|---|---|---|---|
| Predictors | Beta | CI | p |
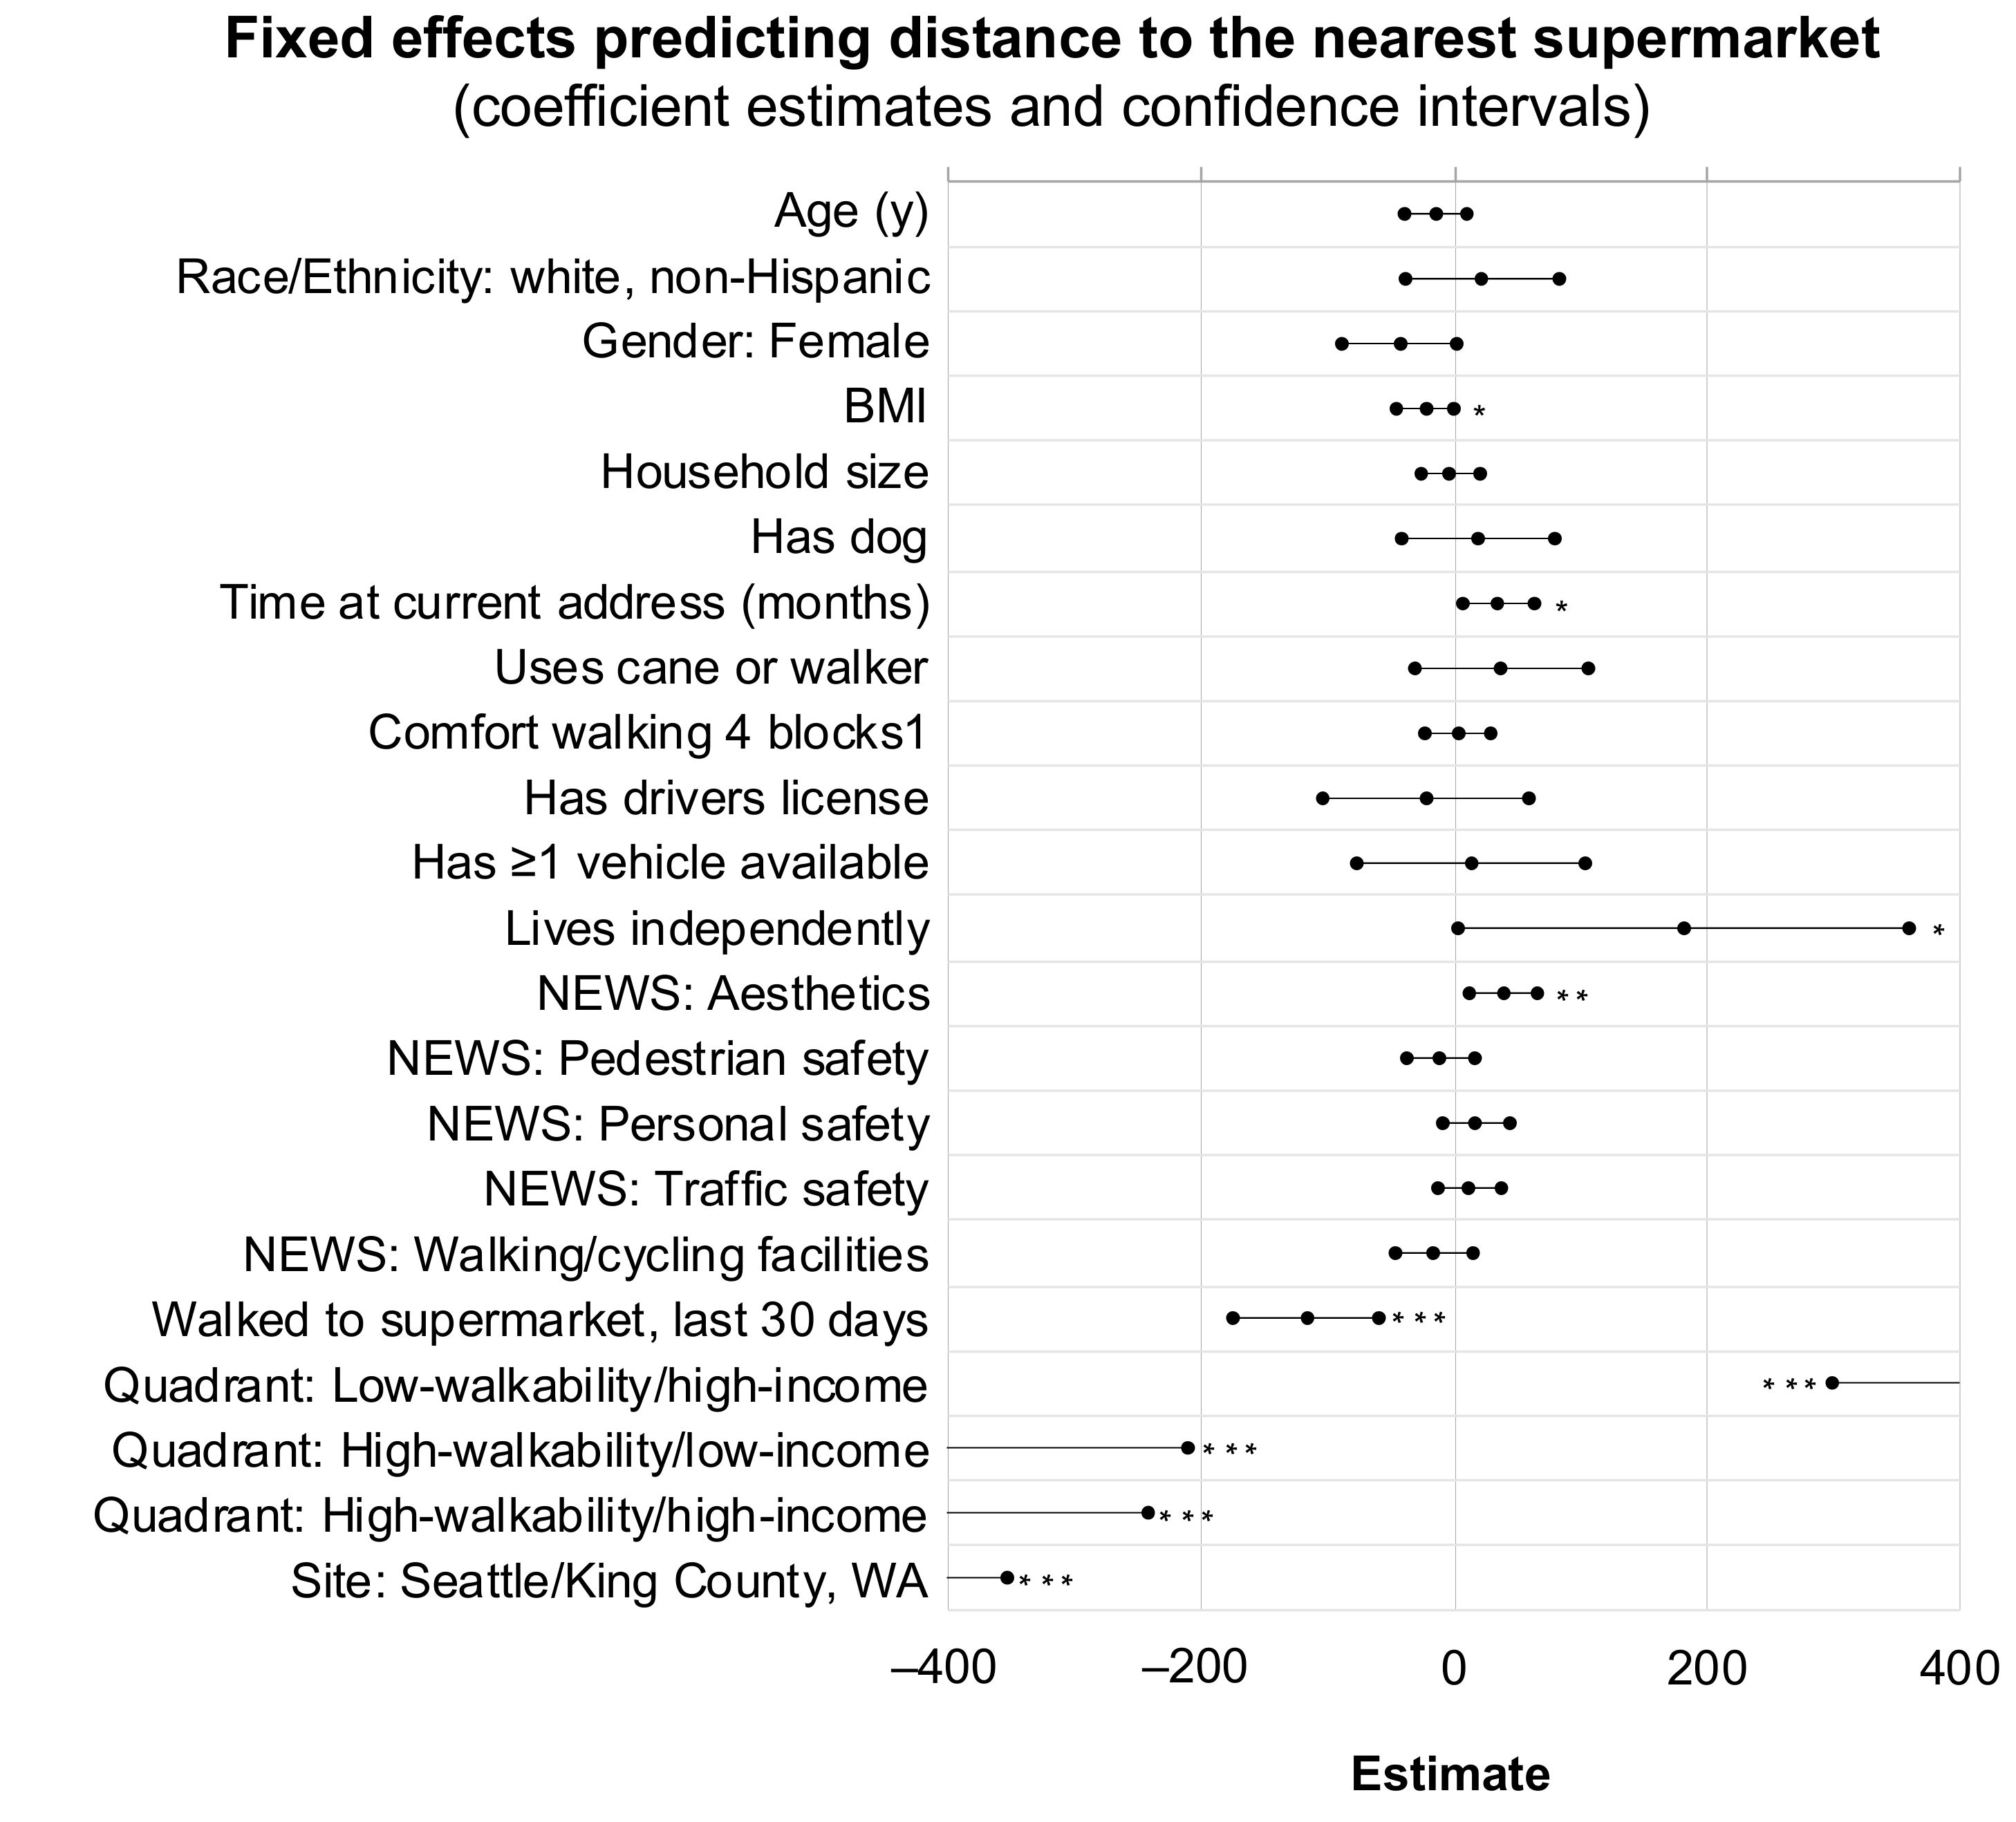
| (Intercept) | 1416.86 | 1180.01–1653.72 | <0.001 |
| Age (y) | −14.45 | −39.04–10.14 | 0.250 |
| Race/Ethnicity: white, non-Hispanic | 22.42 | −38.37–83.21 | 0.470 |
| Gender: Female | −43.29 | −88.77–2.20 | 0.063 |
| BMI | −22.89 | −45.56–−0.23 | 0.048 |
| Household size | −2.67 | −25.94–20.60 | 0.822 |
| Has dog | 19.13 | −41.45–79.72 | 0.536 |
| Time at current address (months) | 35.29 | 6.97–63.60 | 0.015 |
| Uses cane or walker | 37.68 | −30.85–106.22 | 0.282 |
| Comfort walking 4 blocks1 | 2.95 | −23.08–28.99 | 0.824 |
| Has driver’s license | −22.26 | −103.82–59.31 | 0.593 |
| Has ≥ 1 vehicle available | 13.41 | −76.92–103.74 | 0.771 |
| Lives independently | 181.49 | 3.12–359.87 | 0.046 |
| NEWS: Aesthetics | 39.02 | 12.14–65.89 | 0.005 |
| NEWS: Pedestrian Safety | −10.52 | −37.42–16.38 | 0.444 |
| NEWS: Personal Safety | 17.57 | −9.00–44.15 | 0.195 |
| NEWS: Traffic Safety | 12.29 | −12.79–37.36 | 0.337 |
| NEWS: Walking/Cycling Facilities | −15.68 | −46.40–15.05 | 0.318 |
| Walked to nearest grocery, last 30 days | −117.14 | −174.86–−59.42 | <0.001 |
| Quadrant: Low-Walk/High-Inc2 | 534.04 | 299.05–769.02 | <0.001 |
| Quadrant: High-Walk/Low-Inc2 | −409.30 | −608.16–−210.45 | <0.001 |
| Quadrant: High-Walk/High-Inc2 | −489.56 | −737.33–−241.78 | <0.001 |
| Site: Seattle/King County, WA3 | −530.46 | −707.69–−353.22 | <0.001 |
| Observations | 868 | ||
| R2/Ω02 | 0.926/0.925 | ||
| AIC | 12600.926 | ||
| Likelihood Ratio Chi-Square | p-Value | |
|---|---|---|
| Age (y) | 9.74 | 0.02 * |
| Race/Ethnicity: White, non-Hispanic | 4.01 | 0.26 |
| Gender: Female | 8.91 | 0.03 * |
| BMI | 3.33 | 0.34 |
| Household size | 1.78 | 0.62 |
| Has dog | 3.21 | 0.36 |
| Time at current address (months) | 5.09 | 0.17 |
| Uses cane or walker | 4.52 | 0.21 |
| Comfort walking 4 blocks | 3.72 | 0.29 |
| Has driver license | 3.03 | 0.39 |
| Has ≥1 vehicle available | 1.86 | 0.60 |
| Lives independently | 8.58 | 0.04 * |
| NEWS: Aesthetics | 1.21 | 0.75 |
| NEWS: Pedestrian Safety | 5.75 | 0.12 |
| NEWS: Personal Safety | 3.68 | 0.30 |
| NEWS: Traffic Safety | 2.74 | 0.43 |
| NEWS: Walking/Cycling Facilities | 3.04 | 0.39 |
| Walked to nearest grocery, last 30 days | 58.86 | <0.001 *** |
| Actual distance to nearest grocery | 216.13 | <0.001 *** |
| Quadrant | 16.86 | 0.05 |
| Site: Seattle/King County, WA | 6.87 | 0.08 |
© 2019 by the authors. Licensee MDPI, Basel, Switzerland. This article is an open access article distributed under the terms and conditions of the Creative Commons Attribution (CC BY) license (http://creativecommons.org/licenses/by/4.0/).
Share and Cite
Chrisinger, B.W.; King, A.C.; Hua, J.; Saelens, B.E.; Frank, L.D.; Conway, T.L.; Cain, K.L.; Sallis, J.F. How Well Do Seniors Estimate Distance to Food? The Accuracy of Older Adults’ Reported Proximity to Local Grocery Stores. Geriatrics 2019, 4, 11. https://doi.org/10.3390/geriatrics4010011
Chrisinger BW, King AC, Hua J, Saelens BE, Frank LD, Conway TL, Cain KL, Sallis JF. How Well Do Seniors Estimate Distance to Food? The Accuracy of Older Adults’ Reported Proximity to Local Grocery Stores. Geriatrics. 2019; 4(1):11. https://doi.org/10.3390/geriatrics4010011
Chicago/Turabian StyleChrisinger, Benjamin W., Abby C. King, Jenna Hua, Brian E. Saelens, Lawrence D. Frank, Terry L. Conway, Kelli L. Cain, and James F. Sallis. 2019. "How Well Do Seniors Estimate Distance to Food? The Accuracy of Older Adults’ Reported Proximity to Local Grocery Stores" Geriatrics 4, no. 1: 11. https://doi.org/10.3390/geriatrics4010011
APA StyleChrisinger, B. W., King, A. C., Hua, J., Saelens, B. E., Frank, L. D., Conway, T. L., Cain, K. L., & Sallis, J. F. (2019). How Well Do Seniors Estimate Distance to Food? The Accuracy of Older Adults’ Reported Proximity to Local Grocery Stores. Geriatrics, 4(1), 11. https://doi.org/10.3390/geriatrics4010011


