
Aging-Related Changes in Bimanual Coordination as a Screening Tool for Healthy Aging


Abstract
1. Introduction
2. Materials and Methods
2.1. Materials
2.2. Ethics Statement
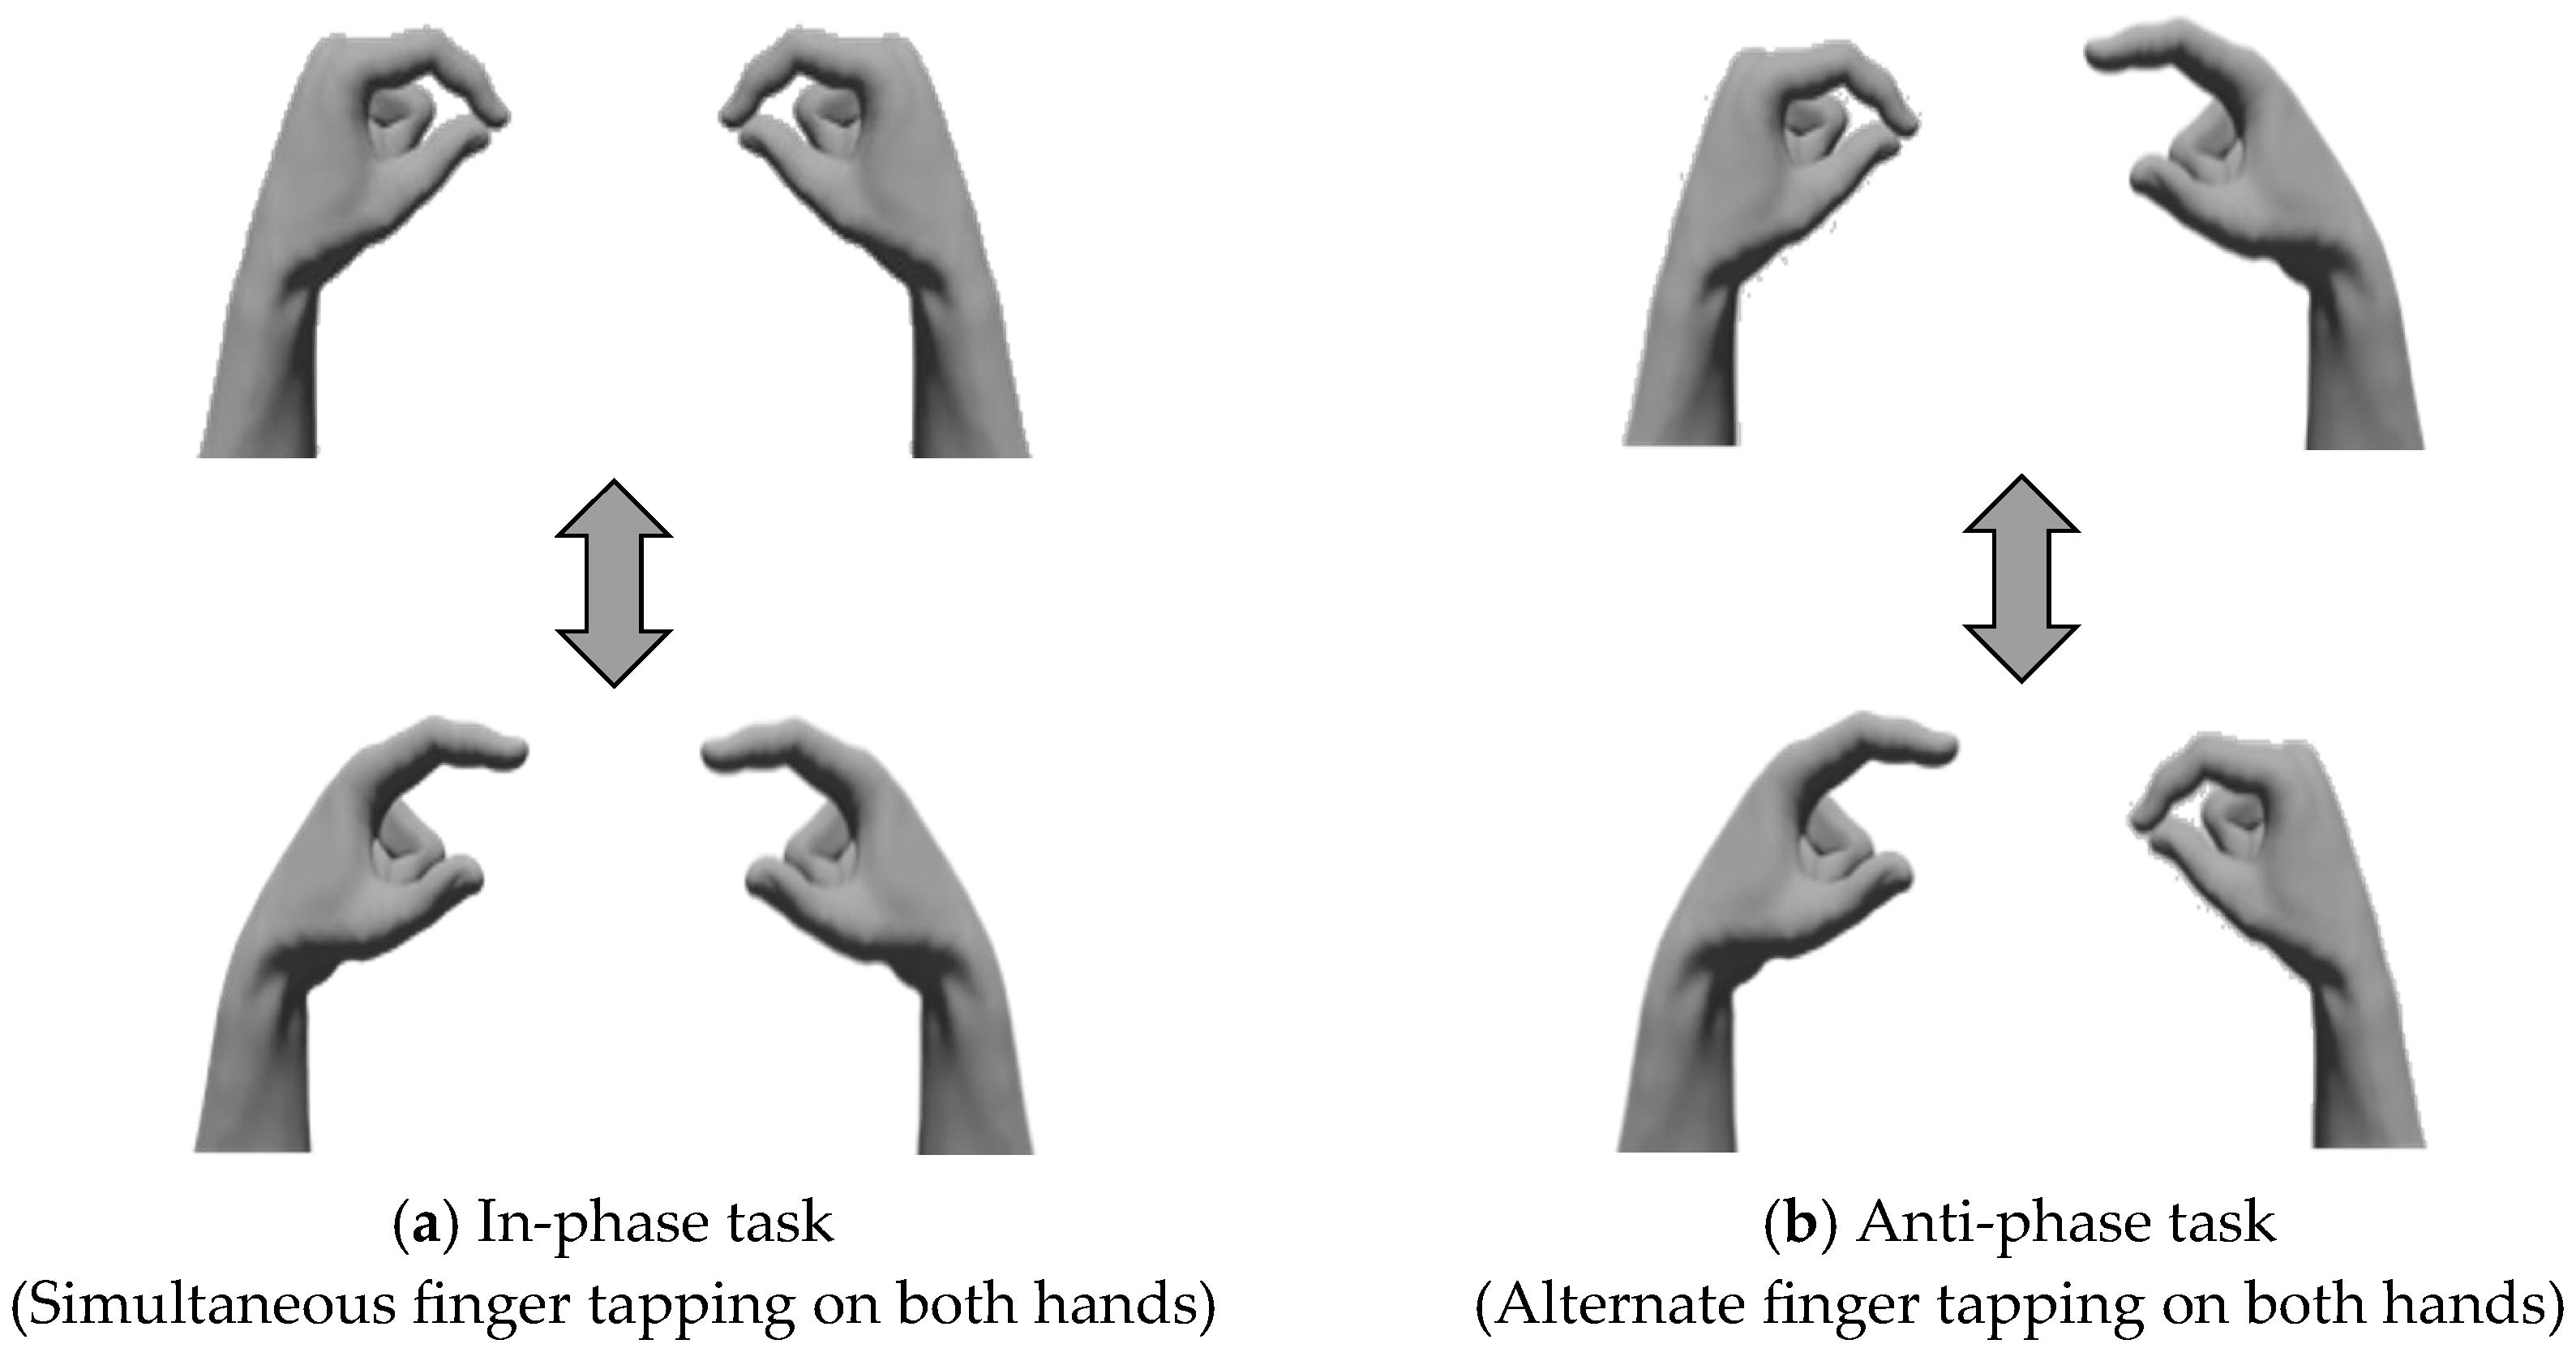
2.3. Methods
2.4. Statistical Analysis
3. Results
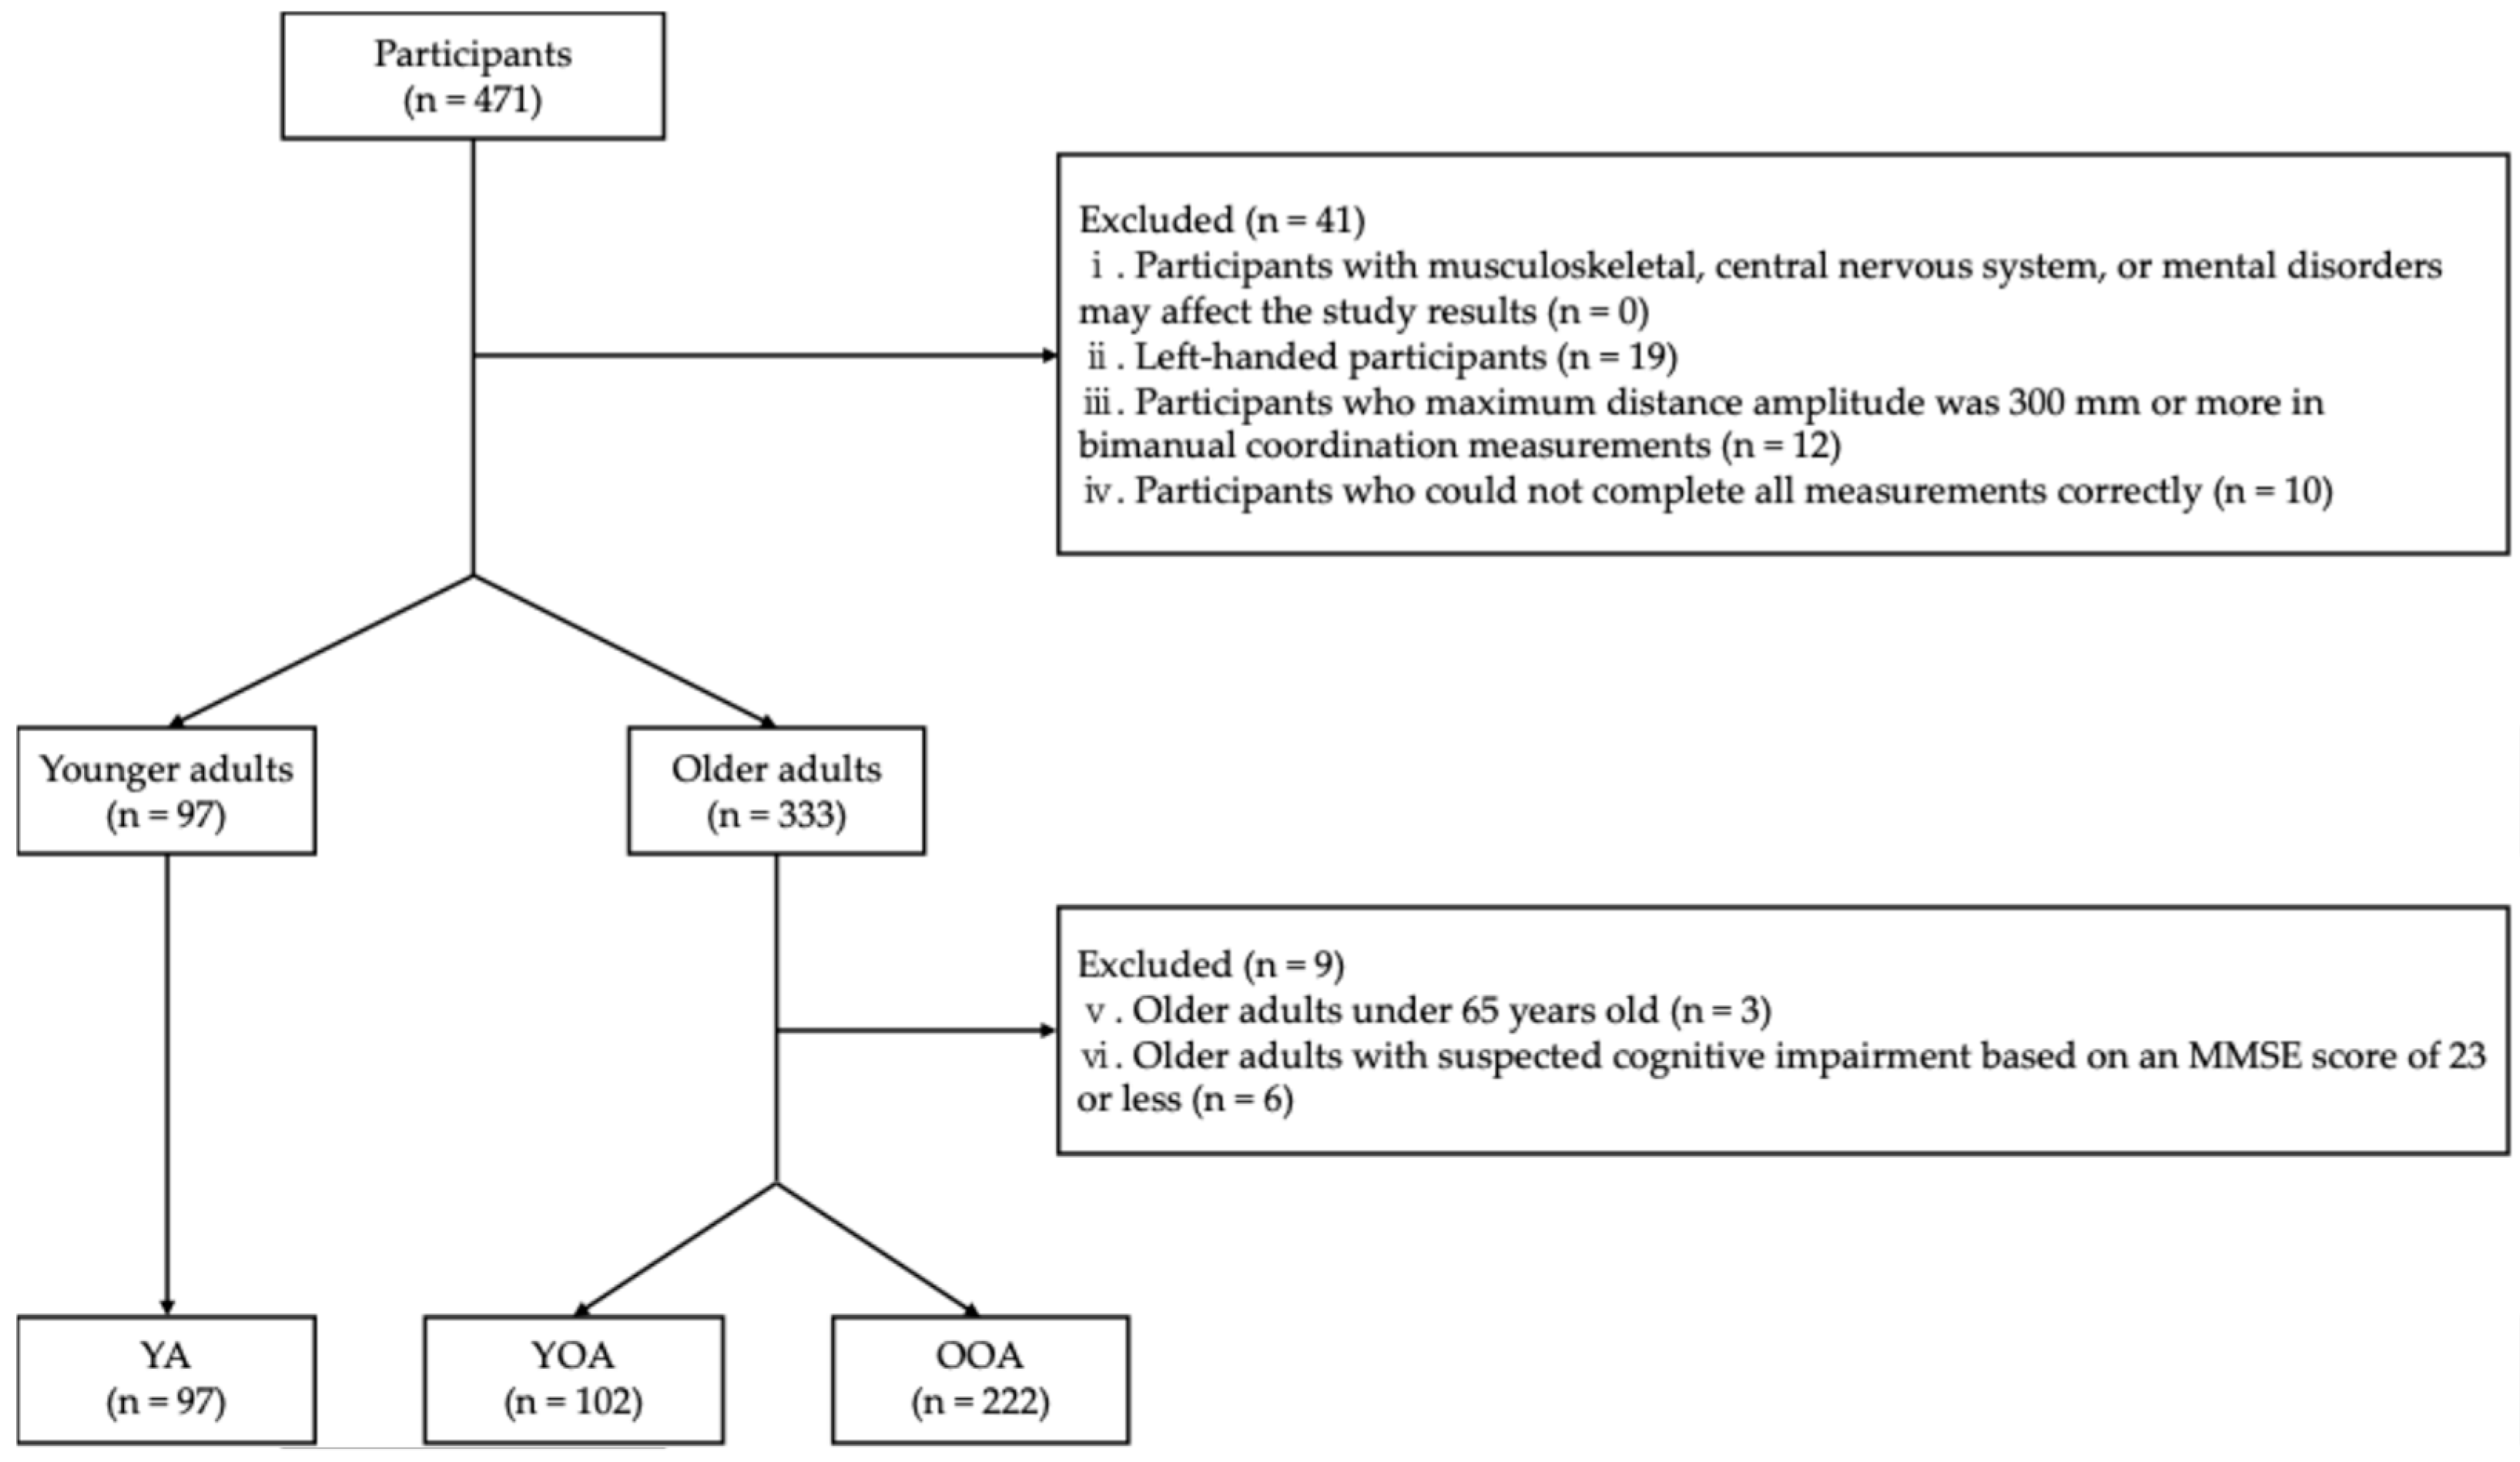
3.1. Basic Information of Participants
3.2. Comparison of the Distance Parameters
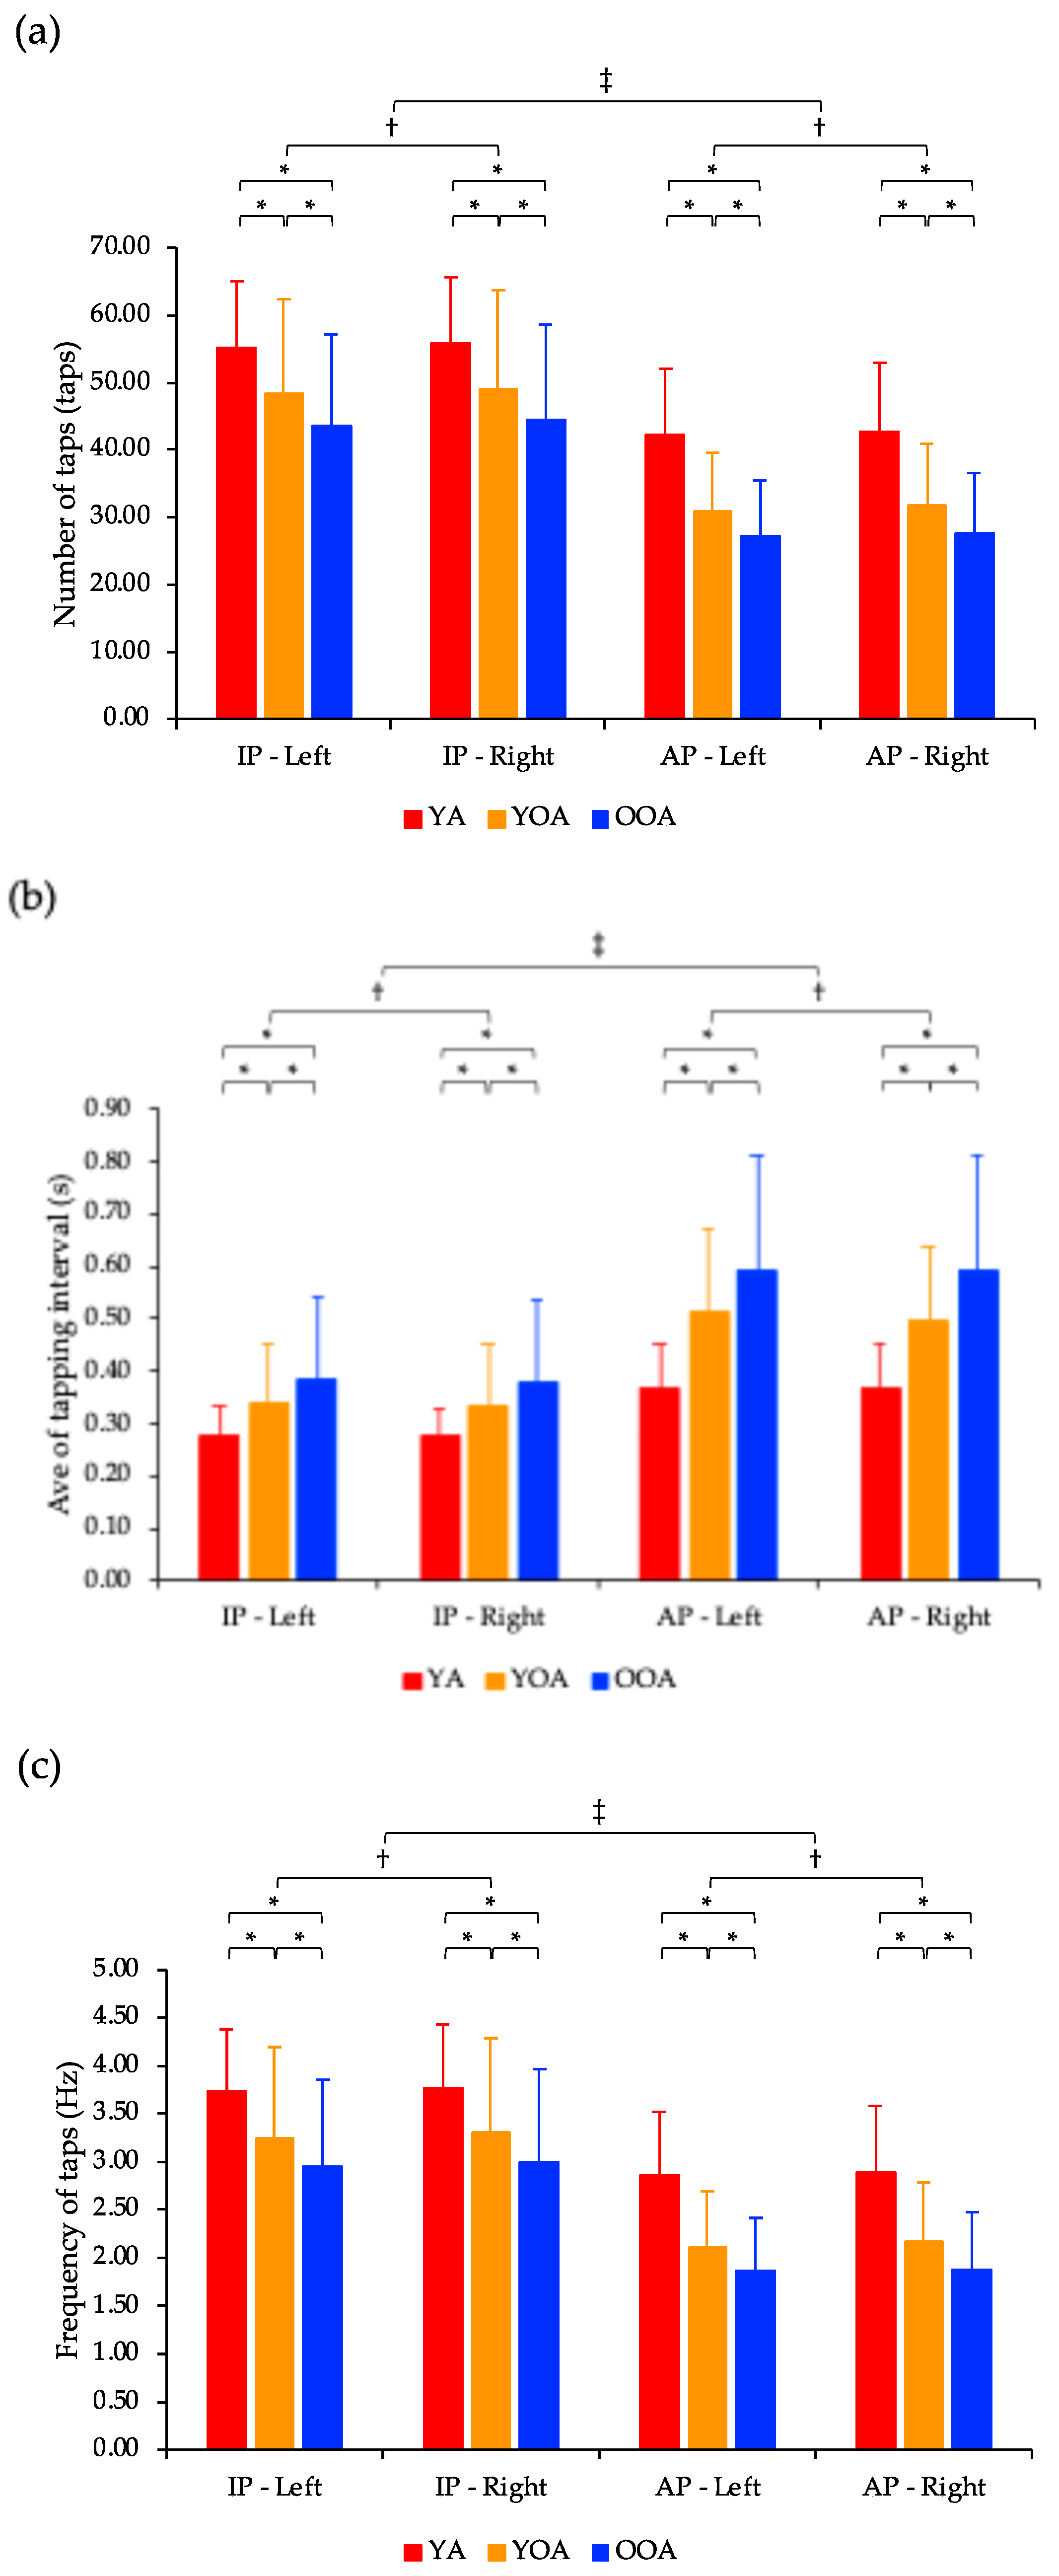
3.3. Comparison of the Tap Interval Parameters
3.4. Comparison of the Phase Difference Parameters
3.5. Correlation Analysis Between the Bimanual Coordination Performance and Age
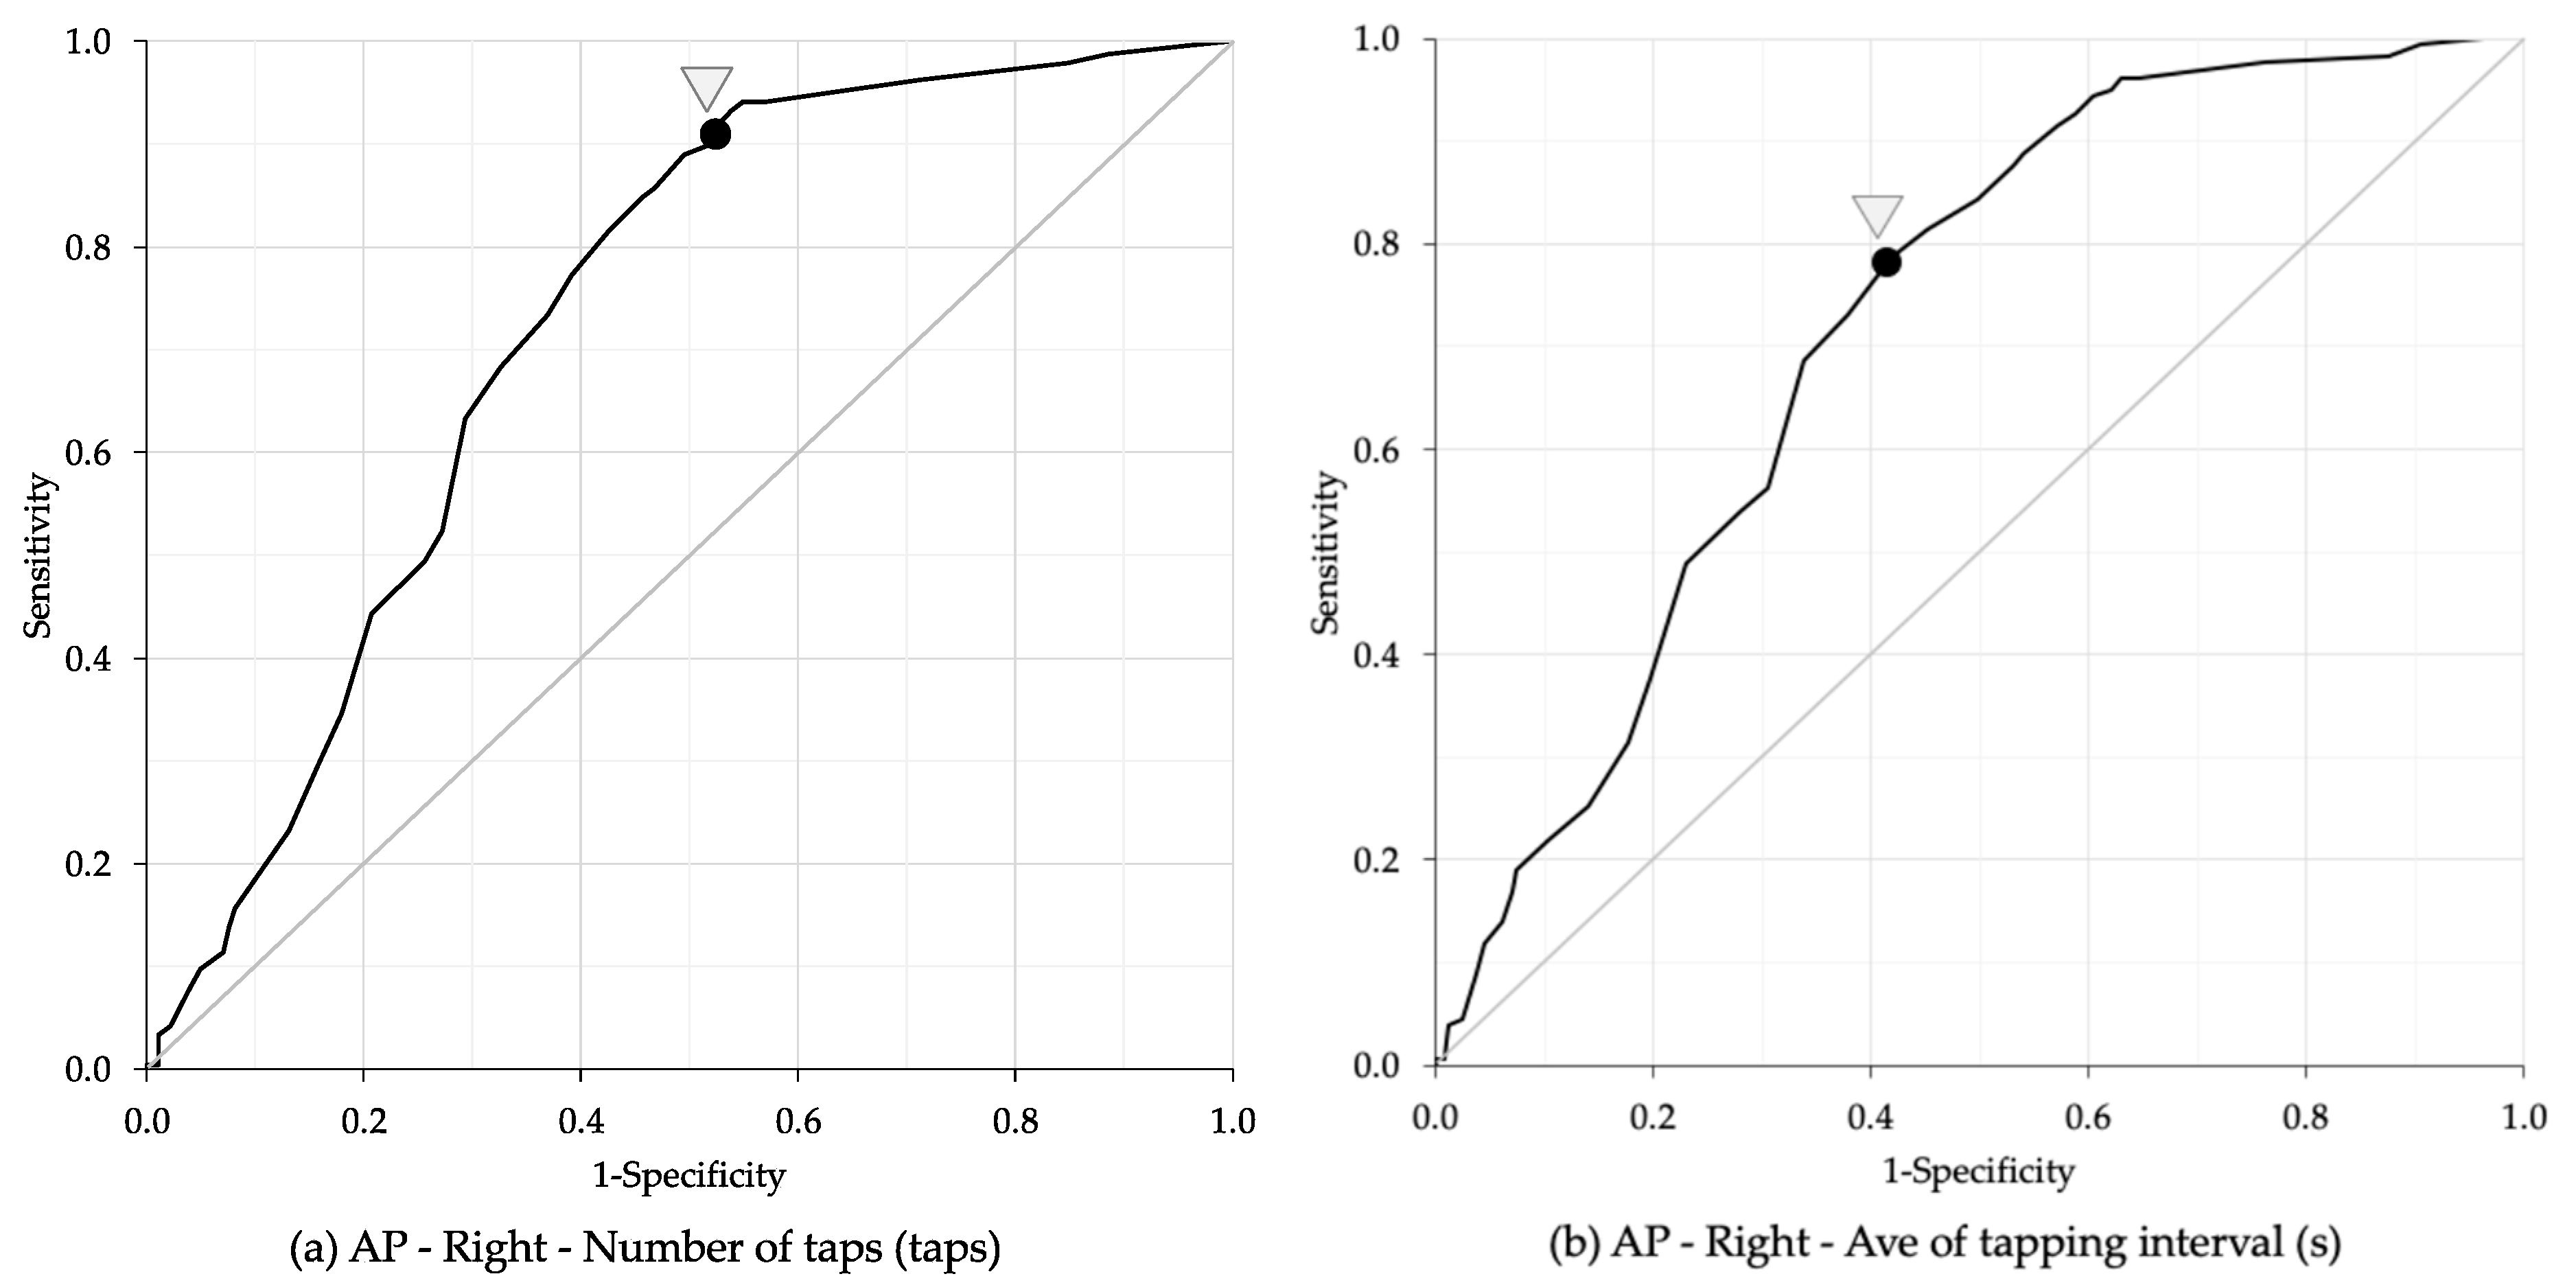
3.6. Age Cut-Off Points for Bimanual Coordination Performance
4. Discussion
4.1. Comparison of Young Adults, Young-Old Adults, and Old-Old Adults
4.2. Comparison of the In-Phase and the Anti-Phase Tasks
4.3. Comparison of the Non-Dominant Hand (Left Hand) and Dominant Hand (Right Hand)
4.4. Limitations
5. Conclusions
Author Contributions
Funding
Institutional Review Board Statement
Informed Consent Statement
Data Availability Statement
Acknowledgments
Conflicts of Interest
References
- United Nations. World Social Report 2023: Leaving No One Behind in an Ageing World; United Nations: New York, NY, USA, 2023; pp. 17–75. [Google Scholar]
- Miller, E.A.; Rosenheck, R.A.; Schneider, L.S. Caregiver burden, health utilities, and institutional service costs among community-dwelling patients with Alzheimer disease. Alzheimer Dis. Assoc. Disord. 2010, 24, 380–389. [Google Scholar] [CrossRef] [PubMed]
- Cawthon, P.M.; Fox, K.M.; Gandra, S.R.; Delmonico, M.J.; Chiou, C.F.; Anthony, M.S.; Sewall, A.; Goodpaster, B.; Satterfield, S.; Cummings, S.R.; et al. Do muscle mass, muscle density, strength, and physical function similarly influence risk of hospitalization in older adults? J. Am. Geriatr. Soc. 2009, 57, 1411–1419. [Google Scholar] [CrossRef] [PubMed]
- World Health Organization. Decade of Healthy Ageing: Baseline Report; World Health Organization: Geneva, Switzerland, 2020; pp. 1–27. [Google Scholar]
- Eckstrom, E.; Neukam, S.; Kalin, L.; Wright, J. Physical Activity and Healthy Aging. Clin. Geriatr. Med. 2020, 36, 671–683. [Google Scholar] [CrossRef]
- Kilbreath, S.L.; Heard, R.C. Frequency of hand use in healthy older persons. Aust. J. Physiother. 2005, 51, 119–122. [Google Scholar] [CrossRef]
- Incel, N.A.; Sezgin, M.; As, I.; Cimen, O.B.; Sahin, G. The geriatric hand: Correlation of hand-muscle function and activity restriction in elderly. Int. J. Rehabil. Res. 2009, 32, 213–218. [Google Scholar] [CrossRef]
- Lin, C.H.; Chou, L.W.; Wei, S.H.; Lieu, F.K.; Chiang, S.L.; Sung, W.H. Influence of aging on bimanual coordination control. Exp. Gerontol. 2014, 53, 40–47. [Google Scholar] [CrossRef]
- Krehbiel, L.M.; Kang, N.; Cauraugh, J.H. Age-related differences in bimanual movements: A systematic review and meta-analysis. Exp. Gerontol. 2017, 98, 199–206. [Google Scholar] [CrossRef]
- Kang, N.; Ko, D.K.; Cauraugh, J.H. Bimanual motor impairments in older adults: An updated systematic review and meta-analysis. EXCLI J. 2022, 21, 1068–1083. [Google Scholar] [CrossRef]
- Lee, T.D.; Wishart, L.R.; Murdoch, J.E. Aging, Attention, and Bimanual Coordination. Can. J. Aging/Rev. Can. Vieil. 2002, 21, 549–557. [Google Scholar] [CrossRef]
- Rudisch, J.; Müller, K.; Kutz, D.F.; Brich, L.; Sleimen-Malkoun, R.; Voelcker-Rehage, C. How Age, Cognitive Function and Gender Affect Bimanual Force Control. Front. Physiol. 2020, 11, 245. [Google Scholar] [CrossRef]
- Chung, E.; Lee, S.H.; Lee, H.J.; Kim, Y.H. Comparative study of young-old and old-old people using functional evaluation, gait characteristics, and cardiopulmonary metabolic energy consumption. BMC Geriatr. 2023, 23, 400. [Google Scholar] [CrossRef] [PubMed]
- Hayashida, I.; Tanimoto, Y.; Takahashi, Y.; Kusabiraki, T.; Tamaki, J. Correlation between muscle strength and muscle mass, and their association with walking speed, in community-dwelling elderly Japanese individuals. PLoS ONE 2014, 9, e111810. [Google Scholar] [CrossRef] [PubMed]
- Kim, J.; Cha, E. Predictors of Cognitive Function in Community-Dwelling Older Adults by Age Group: Based on the 2017 National Survey of Older Korean Adults. Int. J. Environ. Res. Public Health 2021, 18, 9600. [Google Scholar] [CrossRef] [PubMed]
- Suzumura, S.; Osawa, A.; Kanada, Y.; Keisuke, M.; Takano, E.; Sugioka, J.; Natsumi, M.; Nagahama, T.; Shiramoto, K.; Kuno, K.; et al. Finger tapping test for assessing the risk of mild cognitive impairment. Hong Kong J. Occup. Ther. 2022, 35, 137–145. [Google Scholar] [CrossRef]
- Enokizono, T.; Ohto, T.; Tanaka, M.; Maruo, K.; Sano, Y.; Kandori, A.; Takada, H. Quantitative assessment of fine motor skills in children using magnetic sensors. Brain Dev. 2020, 42, 421–430. [Google Scholar] [CrossRef]
- Blais, M.; Martin, E.; Albaret, J.M.; Tallet, J. Preservation of perceptual integration improves temporal stability of bimanual coordination in the elderly: An evidence of age-related brain plasticity. Behav. Brain Res. 2014, 275, 34–42. [Google Scholar] [CrossRef]
- Tanaka, M.; Tsubouchi, M.; Kayashita, J.; Mizukami, K. Factors associated with oral frailty among community-dwelling older people—A comparison between those <75 and ≥75 years old. Nihon Ronen Igakkai Zasshi 2024, 61, 68–79. [Google Scholar] [CrossRef]
- Sugioka, J.; Suzumura, S.; Kuno, K.; Kizuka, S.; Sakurai, H.; Kanada, Y.; Mizuguchi, T.; Kondo, I. Relationship between finger movement characteristics and brain voxel-based morphometry. PLoS ONE 2022, 17, e0269351. [Google Scholar] [CrossRef]
- Sano, Y.; Kandori, A.; Shima, K.; Tamura, Y.; Takagi, H.; Tsuji, T.; Noda, M.; Higashikawa, F.; Yokoe, M.; Sakoda, S. Reliability of Finger Tapping Test Used in Diagnosis of Movement Disorders. In Proceedings of the 2011 5th International Conference on Bioinformatics and Biomedical Engineering, Wuhan, China, 10–12 May 2011. [Google Scholar]
- Suzumura, S.; Kanada, Y.; Osawa, A.; Sugioka, J.; Maeda, N.; Nagahama, T.; Shiramoto, K.; Kuno, K.; Kizuka, S.; Sano, Y.; et al. Assessment of finger motor function that reflects the severity of cognitive function. Fujita Med. J. 2021, 7, 122–129. [Google Scholar] [CrossRef]
- Akobeng, A.K. Understanding diagnostic tests 3: Receiver operating characteristic curves. Acta Paediatr. 2007, 96, 644–667. [Google Scholar] [CrossRef]
- Hu, X.; Newell, K.M. Aging, visual information, and adaptation to task asymmetry in bimanual force coordination. J. Appl. Physiol. 2011, 111, 1671–1680. [Google Scholar] [CrossRef] [PubMed]
- Gerloff, C.; Andres, F.G. Bimanual coordination and interhemispheric interaction. Acta Psychol. 2002, 110, 161–186. [Google Scholar] [CrossRef] [PubMed]
- Fling, B.W.; Seidler, R.D. Fundamental differences in callosal structure, neurophysiologic function, and bimanual control in young and older adults. Cereb. Cortex 2012, 22, 2643–2652. [Google Scholar] [CrossRef] [PubMed]
- Fujiyama, H.; Van Soom, J.; Rens, G.; Gooijers, J.; Leunissen, I.; Levin, O.; Swinnen, S.P. Age-Related Changes in Frontal Network Structural and Functional Connectivity in Relation to Bimanual Movement Control. J. Neurosci. 2016, 36, 1808–1822. [Google Scholar] [CrossRef]
- Li, S.C.; Lindenberger, U.; Sikström, S. Aging cognition: From neuromodulation to representation. Trends Cogn. Sci. 2001, 5, 479–486. [Google Scholar] [CrossRef]
- Verdú, E.; Ceballos, D.; Vilches, J.J.; Navarro, X. Influence of aging on peripheral nerve function and regeneration. J. Peripher. Nerv. Syst. 2000, 5, 191–208. [Google Scholar] [CrossRef]
- Banerjee, A.; Jirsa, V.K. How do neural connectivity and time delays influence bimanual coordination? Biol. Cybern. 2007, 96, 265–278. [Google Scholar] [CrossRef]
- Wilson, T.W.; Kurz, M.J.; Arpin, D.J. Functional specialization within the supplementary motor area: A fNIRS study of bimanual coordination. Neuroimage 2014, 85, 445–450. [Google Scholar] [CrossRef]
- Green, P.E.; Ridding, M.C.; Hill, K.D.; Semmler, J.G.; Drummond, P.D.; Vallence, A.M. Supplementary motor area-primary motor cortex facilitation in younger but not older adults. Neurobiol. Aging 2018, 64, 85–91. [Google Scholar] [CrossRef]
- Cansino, S.; Hernández-Ramos, E.; Estrada-Manilla, C.; Torres-Trejo, F.; Martínez-Galindo, J.G.; Ayala-Hernández, M.; Gómez-Fernández, T.; Osorio, D.; Cedillo-Tinoco, M.; Garcés-Flores, L.; et al. Decline in verbal and visuospatial working memory across adult lifespan. Age 2013, 35, 2283–2302. [Google Scholar] [CrossRef]
- Ingemanson, M.L.; Rowe, J.B.; Chan, V.; Wolbrecht, E.T.; Cramer, S.C.; Reinkensmeyer, D.J. Use of a robotic device to measure age-related decline in finger proprioception. Exp. Brain Res. 2016, 234, 83–93. [Google Scholar] [CrossRef] [PubMed]
- Mickevičienė, D.; Skurvydas, A.; Karanauskienė, D. Is intraindividual variability different between unimanual and bimanual speed-accuracy movements? Percept. Mot. Skills 2015, 120, 125–138. [Google Scholar] [CrossRef] [PubMed]
- Swinnen, S.P. Intermanual coordination: From behavioural principles to neural-network interactions. Nat. Rev. Neurosci. 2002, 3, 348–359. [Google Scholar] [CrossRef] [PubMed]
- Johansen-Berg, H.; Della-Maggiore, V.; Behrens, T.E.; Smith, S.M.; Paus, T. Integrity of white matter in the corpus callosum correlates with bimanual co-ordination skills. Neuroimage 2007, 36, 16–21. [Google Scholar] [CrossRef]
- Fling, B.W.; Walsh, C.M.; Bangert, A.S.; Reuter-Lorenz, P.A.; Welsh, R.C.; Seidler, R.D. Differential callosal contributions to bimanual control in young and older adults. J. Cogn. Neurosci. 2011, 23, 2171–2185. [Google Scholar] [CrossRef]
- Kiyama, S.; Kunimi, M.; Iidaka, T.; Nakai, T. Distant functional connectivity for bimanual finger coordination declines with aging: An fMRI and SEM exploration. Front. Hum. Neurosci. 2014, 8, 251. [Google Scholar] [CrossRef]
- Nicolay, C.W.; Walker, A.L. Grip strength and endurance: Influences of anthropometric variation, hand dominance, and gender. Int. J. Ind. Ergon. 2005, 35, 605–618. [Google Scholar] [CrossRef]
- Józsa, L.; Demel, Z.; Vándor, E.; Réffy, A.; Szilágyi, I. Spezifische Faserzusammensetzung der menschlichen Hand- und Armmuskeln [Specific fibre compositon of human hand and arm muscles]. Handchirurgie 1978, 10, 153–157. [Google Scholar]
- Bütefisch, C.M.; Khurana, V.; Kopylev, L.; Cohen, L.G. Enhancing encoding of a motor memory in the primary motor cortex by cortical stimulation. J. Neurophysiol. 2004, 91, 2110–2116. [Google Scholar] [CrossRef]
- Hodges, L.; Adams, J. Grip Strength and Dexterity: A Study of Variance between Right- and Left-Handed Healthy Individuals. Br. J. Hand Ther. 2007, 12, 15–21. [Google Scholar] [CrossRef]
- Weller, M.P.; Latimer-Sayer, D.T. Increasing right hand dominance with age on a motor skill task. Psychol. Med. 1985, 15, 867–872. [Google Scholar] [CrossRef] [PubMed]
- Zhou, G.; Chen, Y.; Wang, X.; Wei, H.; Huang, Q.; Li, L. The correlations between kinematic profiles and cerebral hemodynamics suggest changes of motor coordination in single and bilateral finger movement. Front. Hum. Neurosci. 2022, 16, 957364. [Google Scholar] [CrossRef] [PubMed]
- Li, S.; Danion, F.; Latash, M.L.; Li, Z.; Zatsiorsky, V.M. Finger Coordination and Bilateral Deficit during Two-Hand Force Production Tasks Performed by Right-Handed Subjects. J. Appl. Biomech. 2000, 16, 379–391. [Google Scholar] [CrossRef]
- Tomita, Y.; Tanaka, S.; Takahashi, S.; Takeuchi, N. Detecting cognitive decline in community-dwelling older adults using simple cognitive and motor performance tests. Geriatr. Gerontol. Int. 2020, 20, 212–217. [Google Scholar] [CrossRef] [PubMed]


| Parameter | Description | |
|---|---|---|
| Distance | Total travel distance (mm) | The sum of the distances moved by the thumb and index finger. The overall amount of movement. |
| Ave of local max distance (mm) | Average amplitude of the distance waveform. | |
| SD of local max distance (mm) | Variation in the amplitude of the distance waveform. | |
| Slope of approximate line of local max points (mm/s) | The slope is a linear regression of the relationship between the maximum point of each tap and time. As the tap amplitude decreases due to fatigue, the slope increases in a negative direction. When there is no effect of fatigue, the slope is 0. | |
| Tap interval | Number of taps (taps) | Number of taps during the measurement time. |
| Ave of tapping interval (s) | Average in time difference between two consecutive taps. | |
| Frequency of taps (Hz) | Inverse to the mean of the tap interval. | |
| SD of inter-tapping interval (s) | Variations in time difference between two consecutive taps. | |
| Phase difference | SD of phase difference (degree) | Assuming the interval between one tap is 360°, the time lag between the left and right hands is expressed as an angle. This parameter is the variation of its value. |
| Task | Hand | YA (n = 97) | YOA (n = 102) | OOA (n = 222) | IE | IE | IE | IE | ME | ME | ME | Post-Hoc Test | |||
|---|---|---|---|---|---|---|---|---|---|---|---|---|---|---|---|
| Hand × Group | Task × Group | Hand × Task | Hand × Group × Task | Hand | Task | Group | |||||||||
| F | F | F | F | F | F | F | Hand | Task | Group | ||||||
| Total traveling distance (mm) | IP | L | 4323.67 | 4498.38 | 4178.93 | 3.31 * | 5.36 ** | 0.22 | 0.09 | 0.90 | 127.97 ** | 2.78 | OOA: L < R a | YA, YOA, OOA: AP < IP a | AP: OOA < YOA, YA a |
| (1400.02) | (1581.46) | (1591.60) | |||||||||||||
| R | 4242.82 | 4568.94 | 4332.58 | ||||||||||||
| (1210.37) | (1510.33) | (1475.50) | |||||||||||||
| AP | L | 4001.68 | 3845.86 | 3471.61 | |||||||||||
| (1297.70) | (1226.17) | (1165.46) | |||||||||||||
| R | 3883.48 | 3923.39 | 3595.16 | ||||||||||||
| (1191.90) | (1292.31) | (1221.34) | |||||||||||||
| Ave of local max distance (mm) | IP | L | 41.07 | 46.81 | 48.11 | 1.71 | 10.10 ** | 1.25 | 0.82 | 0.32 | 354.23 ** | 24.23 ** | YA, YOA, OOA: IP < AP a | IP, AP: YA < YOA, OOA a | |
| (12.34) | (16.04) | (17.03) | |||||||||||||
| R | 40.25 | 47.01 | 48.78 | ||||||||||||
| (10.65) | (14.23) | (16.07) | |||||||||||||
| AP | L | 49.50 | 60.55 | 62.22 | |||||||||||
| (13.93) | (15.60) | (17.25) | |||||||||||||
| R | 47.39 | 59.90 | 63.15 | ||||||||||||
| (12.35) | (14.98) | (16.90) | |||||||||||||
| SD of local max distance (mm) | IP | L | 6.95 | 6.71 | 6.63 | 5.18 ** | 8.50 ** | 2.96 | 1.13 | 98.92 ** | 44.38 ** | 3.91 * | YA, YOA, OOA: R < L a | YOA, OOA: IP < AP a | R: YA < YOA, OOA a AP: YA < OOA a |
| (2.57) | (2.27) | (2.23) | |||||||||||||
| R | 5.26 | 5.55 | 5.70 | ||||||||||||
| (1.62) | (2.08) | (2.03) | |||||||||||||
| AP | L | 7.06 | 7.36 | 7.90 | |||||||||||
| (2.70) | (3.17) | (3.32) | |||||||||||||
| R | 5.45 | 6.87 | 7.09 | ||||||||||||
| (1.72) | (2.81) | (3.24) | |||||||||||||
| Slope of approximate line of local max points (mm/s) | IP | L | −0.14 | −0.14 | −0.09 | 1.23 | 0.45 | 4.03 * | 1.70 | 10.56 ** | 6.82 ** | 0.63 | IP: L < R a | R: AP < IP a | |
| (0.59) | (0.66) | (0.67) | |||||||||||||
| R | −0.08 | 0.11 | 0.03 | ||||||||||||
| (0.44) | (0.56) | (0.65) | |||||||||||||
| AP | L | −0.21 | −0.15 | −0.15 | |||||||||||
| (0.60) | (0.80) | (0.77) | |||||||||||||
| R | −0.11 | −0.10 | −0.17 | ||||||||||||
| (0.49) | (0.67) | (0.72) | |||||||||||||
| Number of taps (taps) | IP | L | 55.25 | 48.29 | 43.53 | 0.22 | 5.55 ** | 0.06 | 1.56 | 42.98 ** | 906.45 ** | 58.51 ** | L < R b | YA, YOA, OOA: AP < IP a | IP, AP: OOA < YOA < YA a |
| (9.66) | (14.04) | (13.52) | |||||||||||||
| R | 55.74 | 48.95 | 44.42 | ||||||||||||
| (9.85) | (14.70) | (14.34) | |||||||||||||
| AP | L | 42.15 | 30.97 | 27.14 | |||||||||||
| (9.86) | (8.75) | (8.40) | |||||||||||||
| R | 42.78 | 31.77 | 27.64 | ||||||||||||
| (10.27) | (9.19) | (8.83) | |||||||||||||
| Ave of tapping interval (s) | IP | L | 0.28 | 0.34 | 0.38 | 1.48 | 20.41 ** | 2.92 | 2.40 | 15.75 ** | 370.25 ** | 49.93 ** | R < L b | YA, YOA, OOA: IP < AP a | IP, AP: YA < YOA < OOA a |
| (0.05) | (0.11) | (0.16) | |||||||||||||
| R | 0.27 | 0.34 | 0.38 | ||||||||||||
| (0.05) | (0.12) | (0.16) | |||||||||||||
| AP | L | 0.37 | 0.51 | 0.59 | |||||||||||
| (0.09) | (0.16) | (0.22) | |||||||||||||
| R | 0.37 | 0.50 | 0.59 | ||||||||||||
| (0.09) | (0.14) | (0.22) | |||||||||||||
| Frequency of taps (Hz) | IP | L | 3.73 | 3.25 | 2.95 | 0.49 | 5.08 ** | 0.67 | 1.34 | 39.06 ** | 896.61 ** | 57.89 ** | L < R b | YA, YOA, OOA: AP < IP a | IP, AP: OOA < YOA < YA a |
| (0.65) | (0.94) | (0.90) | |||||||||||||
| R | 3.76 | 3.30 | 3.00 | ||||||||||||
| (0.66) | (0.98) | (0.96) | |||||||||||||
| AP | L | 2.86 | 2.11 | 1.86 | |||||||||||
| (0.66) | (0.58) | (0.56) | |||||||||||||
| R | 2.89 | 2.16 | 1.88 | ||||||||||||
| (0.69) | (0.62) | (0.59) | |||||||||||||
| SD of inter-tapping interval (s) | IP | L | 0.03 | 0.04 | 0.04 | 2.27 | 17.72 ** | 8.50 ** | 1.33 | 58.23 ** | 116.38 ** | 40.12 ** | IP, AP: R < L a | YOA, OOA: IP < AP a L, R: IP < AP a | IP: YA < YOA, OOA a AP: YA < YOA < OOA a |
| (0.02) | (0.03) | (0.03) | |||||||||||||
| R | 0.02 | 0.03 | 0.04 | ||||||||||||
| (0.01) | (0.02) | (0.03) | |||||||||||||
| AP | L | 0.04 | 0.08 | 0.10 | |||||||||||
| (0.02) | (0.06) | (0.07) | |||||||||||||
| R | 0.03 | 0.06 | 0.08 | ||||||||||||
| (0.02) | (0.04) | (0.07) | |||||||||||||
| Task | YA (n = 97) | YOA (n = 102) | OOA (n = 222) | IE | ME | ME | Post-Hoc Test | ||
|---|---|---|---|---|---|---|---|---|---|
| Task × Group | Task | Group | |||||||
| F | F | F | Task | Group | |||||
| SD of phase difference (degree) | IP | 29.60 | 27.27 | 29.03 | 14.57 ** | 14.18 ** | 7.97 ** | YOA, OOA: IP < AP a | AP: YA < YOA < OOA a |
| (14.17) | (17.77) | (22.73) | |||||||
| AP | 25.88 | 33.21 | 40.57 | ||||||
| (12.01) | (16.13) | (22.12) | |||||||
| Task | Total Traveling Distance (mm) | Ave of Local Max Distance (mm) | SD of Local MaxDistance (mm) | Slope of Approximate Line of Local Max Points (mm/s) | Number of Taps(Taps) | Ave of Tapping Interval (s) | Frequency of Taps (Hz) | SD of Inter-Tapping Interval (s) | SD of Phase Difference (Degree) | |||||||||
|---|---|---|---|---|---|---|---|---|---|---|---|---|---|---|---|---|---|---|
| L | R | L | R | L | R | L | R | L | R | L | R | L | R | L | R | |||
| Coefficient | IP | −0.04 | 0.03 | 0.17 ** | 0.23 ** | −0.05 | 0.09 | 0.03 | 0.09 | −0.34 ** | −0.32 ** | 0.31 ** | 0.30 ** | −0.34 ** | −0.32 ** | 0.22 ** | 0.25 ** | −0.01 |
| AP | −0.16 ** | −0.08 | 0.30 ** | 0.38 ** | 0.12 * | 0.22 ** | 0.03 | −0.03 | −0.56 ** | −0.54 ** | 0.44 ** | 0.43 ** | −0.55 ** | −0.53 ** | 0.35 ** | 0.30 ** | 0.30 ** | |
| Task | Hand | AUC | p-Value | Cut-Off Value | 95% CI | Sn | Sp | YI | |||
|---|---|---|---|---|---|---|---|---|---|---|---|
| Value | SD | (Years) | Lower | Upper | (%) | (%) | |||||
| Number of taps (taps) | IP | L | 0.68 | 0.026 | <0.01 | 72.5 | 0.63 | 0.74 | 77.5 | 54.8 | 0.32 |
| R | 0.68 | 0.026 | <0.01 | 72.5 | 0.63 | 0.73 | 77.0 | 54.8 | 0.32 | ||
| AP | L | 0.73 | 0.025 | <0.01 | 65.5 | 0.68 | 0.78 | 93.8 | 44.8 | 0.39 | |
| R | 0.73 * | 0.026 | <0.01 | 68.5 | 0.68 | 0.78 | 89.0 | 50.5 | 0.40 | ||
| Ave oftapping interval (s) | IP | L | 0.67 | 0.026 | <0.01 | 72.5 | 0.62 | 0.72 | 81.3 | 51.5 | 0.33 |
| R | 0.68 | 0.026 | <0.01 | 72.5 | 0.63 | 0.73 | 81.4 | 51.7 | 0.33 | ||
| AP | L | 0.72 | 0.025 | <0.01 | 73.5 | 0.67 | 0.77 | 78.4 | 57.6 | 0.36 | |
| R | 0.72 * | 0.025 | <0.01 | 73.5 | 0.67 | 0.77 | 78.7 | 58.0 | 0.37 | ||
| Frequency oftaps (Hz) | IP | L | 0.68 | 0.026 | <0.01 | 72.5 | 0.63 | 0.73 | 77.3 | 54.3 | 0.32 |
| R | 0.68 | 0.026 | <0.01 | 72.5 | 0.63 | 0.73 | 77.2 | 54.8 | 0.32 | ||
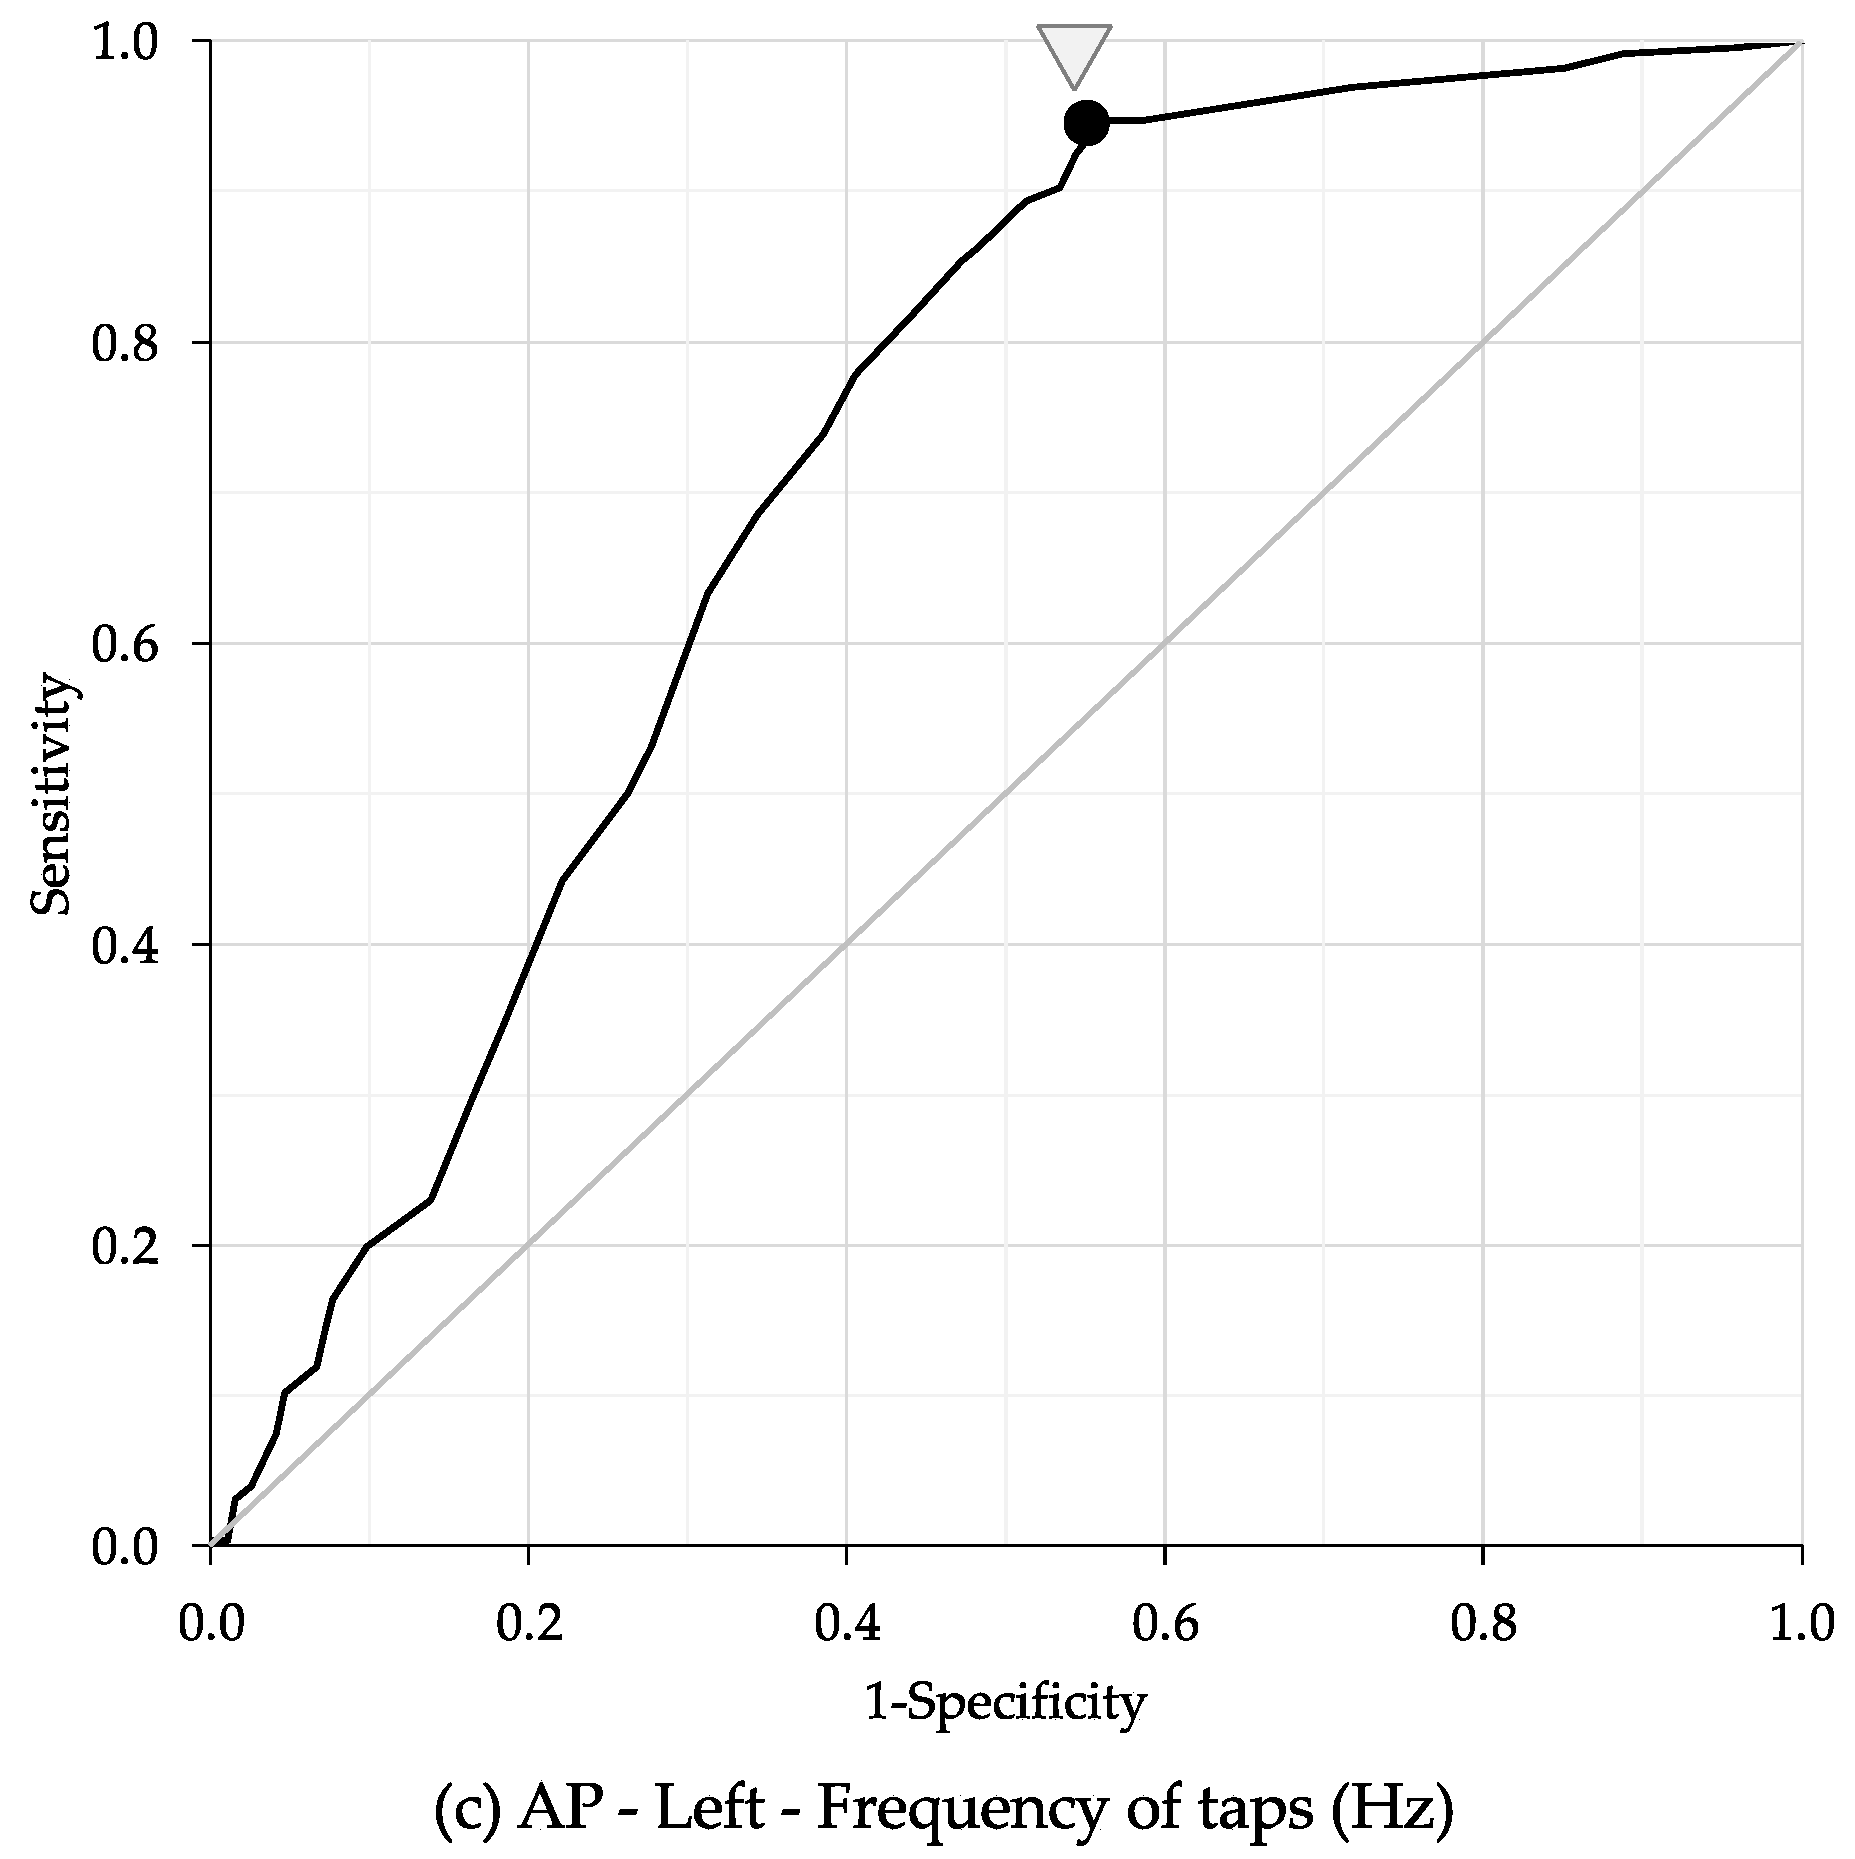
| AP | L | 0.72 * | 0.026 | <0.01 | 65.5 | 0.67 | 0.77 | 93.8 | 44.6 | 0.38 | |
| R | 0.71 | 0.026 | <0.01 | 70.5 | 0.66 | 0.77 | 84.8 | 52.9 | 0.38 | ||
Disclaimer/Publisher’s Note: The statements, opinions and data contained in all publications are solely those of the individual author(s) and contributor(s) and not of MDPI and/or the editor(s). MDPI and/or the editor(s) disclaim responsibility for any injury to people or property resulting from any ideas, methods, instructions or products referred to in the content. |
© 2025 by the authors. Licensee MDPI, Basel, Switzerland. This article is an open access article distributed under the terms and conditions of the Creative Commons Attribution (CC BY) license (https://creativecommons.org/licenses/by/4.0/).
Share and Cite
Shizuka, Y.; Murata, S.; Goda, A.; Sawai, S.; Fujikawa, S.; Yamamoto, R.; Maru, T.; Nakagawa, K.; Nakano, H. Aging-Related Changes in Bimanual Coordination as a Screening Tool for Healthy Aging. Geriatrics 2025, 10, 45. https://doi.org/10.3390/geriatrics10020045
Shizuka Y, Murata S, Goda A, Sawai S, Fujikawa S, Yamamoto R, Maru T, Nakagawa K, Nakano H. Aging-Related Changes in Bimanual Coordination as a Screening Tool for Healthy Aging. Geriatrics. 2025; 10(2):45. https://doi.org/10.3390/geriatrics10020045
Chicago/Turabian StyleShizuka, Yusuke, Shin Murata, Akio Goda, Shun Sawai, Shoya Fujikawa, Ryosuke Yamamoto, Takayuki Maru, Kotaro Nakagawa, and Hideki Nakano. 2025. "Aging-Related Changes in Bimanual Coordination as a Screening Tool for Healthy Aging" Geriatrics 10, no. 2: 45. https://doi.org/10.3390/geriatrics10020045
APA StyleShizuka, Y., Murata, S., Goda, A., Sawai, S., Fujikawa, S., Yamamoto, R., Maru, T., Nakagawa, K., & Nakano, H. (2025). Aging-Related Changes in Bimanual Coordination as a Screening Tool for Healthy Aging. Geriatrics, 10(2), 45. https://doi.org/10.3390/geriatrics10020045