Article

RNA Sequencing Revealed a Weak Response of Gingival Fibroblasts Exposed to Hyaluronic Acid

by
Layla Panahipour
1,
Atefe Imani
1,
Natália dos Santos Sanches
1,2,
Hannes Kühtreiber
3,
Michael Mildner
3 and
Reinhard Gruber
1,4,5,*
1
Department of Oral Biology, University Clinic of Dentistry, Medical University of Vienna, Sensengasse 2a, 1090 Vienna, Austria
2
Department of Diagnosis and Surgery, Araçatuba Dental School of Sao Paulo, Sao Paulo 16015-050, Brazil
3
Department of Dermatology, Medical University of Vienna, 1090 Vienna, Austria
4
Department of Periodontology, School of Dental Medicine, University of Bern, 3010 Bern, Switzerland
5
Austrian Cluster for Tissue Regeneration, 1200 Vienna, Austria
*
Author to whom correspondence should be addressed.
Bioengineering 2024, 11(12), 1307; https://doi.org/10.3390/bioengineering11121307
Submission received: 12 November 2024 / Revised: 11 December 2024 / Accepted: 16 December 2024 / Published: 23 December 2024
(This article belongs to the Section Regenerative Engineering)

Abstract

Hyaluronic acid was proposed to support soft tissue recession surgery and guided tissue regeneration. The molecular mechanisms through which hyaluronic acid modulates the response of connective tissue cells remain elusive. To elucidate the impact of hyaluronic acid on the connective tissue cells, we used bulk RNA sequencing to determine the changes in the genetic signature of gingival fibroblasts exposed to 1.6% cross-linked hyaluronic acid and 0.2% natural hyaluronic acid. Transcriptome-wide changes were modest. Even when implementing a minimum of 1.5 log2 fold-change and a significance threshold of 1.0 −log10, only a dozenth of genes were differentially expressed. Upregulated genes were PLK3, SLC16A6, IL6, HBEGF, DGKE, DUSP4, PTGS2, FOXC2, ATAD2B, NFATC2, and downregulated genes were MMP24 and PLXNA2. RT-PCR analysis supported the impact of hyaluronic acid on increasing the expression of a selected gene panel. The findings from bulk RNA sequencing suggest that gingival fibroblasts experience weak changes in their transcriptome when exposed to hyaluronic acid.

1. Introduction

Hyaluronic acid (HAc) is a non-sulfated glycosaminoglycan composed of repeating β(1–4)-glucuronic acid and β(1ߝ3)-N-acetyl glucosamine heterodimers. HAc is a major component of the extracellular matrix predominantly produced by cells of the mesenchymal lineage, represented by synoviocytes and chondrocytes in a joint, with its main function in the synovial fluid integrating viscoelasticity and hygroscopic properties, and bolstering cartilage to become a shock absorber [1,2]. Hyaluronic acid is further present in the skin [3], eyes [4,5], and, as highlighted in this study, the soft tissue of the oral cavity [6]. Three different synthases, the isozymes HAS1, HAS2, and HAS3, all of which are membrane-spanning, are capable of producing and releasing the polymer into the extracellular matrix, are expressed in periodontal fibroblasts [7]. The synthases in interplay with endocytic hyaluronidases [8] are required for the permanent turnover of HAc.
The accessibility of HAc is not restricted to its viscoelasticity and hygroscopic properties as HAc can bind to cell surface receptors [9]: (i) the transmembrane glycoprotein CD44 [10,11], (ii) the receptor for hyaluronate-mediated motility (RHAMM) [12], and (iii) ICAM-1 [13]. However, CD44 does not exclusively bind HAc as it interacts with other ligands such as osteopontin, collagens, and matrix metalloproteinases. CD44 also mediates the uptake and degradation of hyaluronan [14]. Moreover, RNAseq screening has identified the hyaluronic acid–GPRC5C (G protein-coupled receptor class C group 5 member C) signaling axis controlling hematogenic stem cell niches [15]. In general, however, knowledge of how hyaluronic acid affects cell signaling is scare and the respective changes in the genetic signature are still emerging—also in dentistry.
The oral soft tissue has a delicate structural and immunological function that goes beyond the protection of the tooth-bearing periodontium against the microbial burden of the oral cavity and the damage caused by mastication [16,17]. The oral mucosa and the periodontal soft tissue basically consist of a fibroblast-rich connective tissue shielded towards the oral cavity by the epithelium [16]. Consistent with other barriers, such as the skin, periodontal fibroblasts produce major proteoglycans [7,18] and express CD44 in vivo [19] and in vitro [20,21,22,23,24]. Apart from the endogenously produced HAc by the gingival fibroblasts [7], clinically, hyaluronic acid became recognized for its adjunctive use in dentistry [25]. It is particular cross-linked HAc combined with natural HAc that has been studied in preclinical models [26,27,28] and tested for its clinical use in dentistry, e.g., in intrabony periodontal defects [29], to preserve the buccal tissue volume [30] and in alveolar ridge preservation [31]. Moreover, HAc was studied as an adjunctive in the treatment of gingival recessions [32] in periodontal surgery of infrabony defects [33] upon topical application to support wound healing after a palatal graft harvesting [34], and to overcome interdental papillary deficiencies [35]. Together, these clinical observations provide the scientific fundament for our in vitro study aiming to uncover the underlying molecular mechanism, thus answering the fundamental question on how hyaluronic acid affects the response of oral cells, particularly gingival fibroblasts.
Previous in vitro research was based on precoating tissue culture plates with diluted HAc containing cross-linked HAc prior to cell seeding—presumably allowing the cells to float on the viscous HAc matrix. This coating caused a decreasing osteogenic differentiation of periodontal ligament fibroblasts [36], murine mesenchymal stromal ST2 cells, and osteogenic MC3T3-E1 cells [37]. In a similar setting, cross-linked HAc and native HAc led to an increased expression of cytokines in oral fibroblasts [38]. Functional studies were also performed with respect to biofilm quantity, and the expression of IL8 and HAc receptors was reported [24]. Precoating may impact gene expression, e.g., dermal fibroblasts develop an inflammatory phenotype when they grow in relaxed collagen gels or on modified collagen sponges, compared to tissue culture plates [39,40]. Here, we propose a traditional approach that first seeds the fibroblasts onto regular tissue culture plates and, once attached, exposes the cells to cross-linked HAc and native HAc, followed by bulk RNAseq screening. We have implemented RNAseq screening to uncover the transcriptomic signature change of the fibroblasts upon exposure to HAc based on deep-sequencing technologies [41], similar to what we used to study the cell response to platelet-rich fibrin [42]. RNAseq unfolds the extent and complexity of transcriptomes, which allows the functional interpretation of the signature change.
The aim of the present research is, therefore, to take advantage of RNAseq technology to identify strongly regulated genes in gingival fibroblasts being exposed to a diluted preparation of commercially available HAc, inspired by the clinical scenario of HAc application to support periodontal regeneration.

2. Materials and Methods

2.1. Gingival Fibroblasts and Macrophages

Explant cultures of gingiva from three healthy individuals who provided informed consent were used to isolate gingival fibroblasts from extracted wisdom teeth. Approval from the Ethical Committee of the Medical University of Vienna (EK #631/2007) is available. The fibroblasts were isolated and expanded in DMEM supplemented with 10% fetal calf serum (FCS) and 1% antibiotics (Invitrogen Corporation, Carlsbad, CA, USA). A pool of three cell donors, all at low passage, were seeded at 30,000 cells/cm2 into 24-well plates and exposed to diluted hyaDENT BG (Regedent AG; Zurich, Switzerland), a medical device, termed HAc, throughout the manuscript. It consists of 16.0 mg/mL of cross-linked hyaluronic acid and 2.0 mg/mL of hyaluronic acid with sodium chloride. Cross-linking was performed with butanediol diglycidyl ether of 1000 kDa-HAc monomers [24,37,38]. The gingival fibroblasts were exposed to a 4.5-fold diluted hyaDENT BG, resulting in a final concentration of a total of 4 mg/mL cross-linked and native HAc for 6 h in serum-free DMEM followed by the isolation of total RNA. This preparation is termed HAc throughout the manuscript.
To generate macrophages, bone marrow cells from BALB/c mice (Animal Research Laboratories, Himberg, Austria) were seeded at 1 × 10⁶ cells/cm2 into 24-well plates (VWR International, Radnor, PA, USA) and expanded for 5 days in growth medium containing 20 ng/mL mouse macrophage colony-stimulating factor (M-CSF; ProSpec-Tany TechnoGene, Rehovot, Israel). Both cell types were exposed to HAc for 6 h in serum-free DMEM, followed by total RNA isolation. For gingival fibroblasts, human IL1β and TNFα (ProSpec-Tany TechnoGene Ltd., Rehovot, Israel), both at 10 ng/mL and for murine macrophages, LPS from Escherichia coli 0111:B41 (Sigma–Aldrich, St. Louis, MO, USA) at 100 ng/mL was used as a positive control to boost the expression of inflammatory genes.

2.2. Total RNA Isolation, Sequencing, and Data Analysis

Total RNA was isolated with the GeneMATRIX Universal RNA purification kit with DNAse digestion (EURX, Gdańsk, Poland). Sequencing libraries from total RNA were prepared for the fibroblasts at the Core Facility Genomics, Medical University of Vienna, using the QuantSeq 3′ FWD protocol version 2 with unique dual indices (Lexogen GmbH, Vienna, Austria). Fifteen PCR cycles were used for library prep, as determined by qPCR according to the library prep manual. Libraries were QC-checked on a Bioanalyzer 2100 (Agilent Technologies, Santa Clara, CA, USA) using a high-sensitivity DNA Kit for correct insert size and quantified using Qubit dsDNA HS Assay (Invitrogen, Waltham, MA, USA). Pooled libraries were sequenced on a P2 flowcell on a NextSeq2000 instrument (Illumina, San Diego, CA, USA) in 1 × 75 bp single-end sequencing mode. On average, 7 million reads per sample were generated. Reads in fastq format were generated using the Illumina bcl2fastq command line tool (v2.19.1.403) and the Lexogen idemux tool for optimal demultiplexing of long unique dual indices. Reads were trimmed and filtered using cutadapt version 2.8 to trim polyA tails, remove reads with N’s, and trim bases with a quality of less than 30 from the 3′ ends of the reads [43]. On average, 5 million reads were left after this procedure. Trimmed reads in fastq format were aligned to the human reference genome version GRCh38 with Gencode 29 annotations using STAR aligner [44] version 2.6.1a in 2-pass mode. STAR counted raw reads per gene. Differential gene expression was calculated using DESeq2 [45] version 1.22.2.

2.3. Reverse Transcription Quantitative Real-Time PCR (RT-qPCR)

Total RNA was transcribed into cDNA (LabQ technology, Labconsulting, Vienna, Austria). Amplification was performed on a CFX Connect™ Real-Time PCR Detection System (Bio-Rad Laboratories, Hercules, CA, USA). The selection of target genes was based on RNAseq, and the primers are listed in Table 1 and Table 2. The quantification of individual mRNA levels was normalized to the expression of GAPDH using the ∆∆Ct method. Relative mRNA expression levels are normalized to the unstimulated control.

2.4. Volcano Plot, Heat Map, and Gene Set Enrichment Analysis

PCAGO was applied as a web-based service for principal component analysis (PCA) with a variance cut-off at 500 genes. Zero read counts were removed [46]. For volcano plot generation, we used VolcaNoseR, a web-based tool [47]. The up-and-down-regulated genes were used for further analysis under the premise of a minimum log2 1.5-fold change and a minus log10 significance level of 1.0 [47]. Heat map analysis was performed with R from genes that were significantly changed, considering an adjusted p-value < 0.05 (www.R-project.org) (accessed on 20 September 2024). The g:Profiler was used as a functional enrichment analysis tool that integrates many databases, including Gene Ontology [48]. The sequence-based data are presented in the Supplement Files.
Table 1. Human primer list.
ATAD2B-F: ATTCATGCGCTAAAGGAAATGGTATAD2B-R: AGGAGGGCCATAAAACAAACAG [49]
CXCL1-F: TCCTGCATCCCCCATAGTTACXCL1-R: CTTCAGGAACAGCCACCAGT [50]
CXCL10-F TGCCATTCTGATTTGCTGCCCXCL10-R: TGCAGGTACAGCGTACAGTT [51]
CXCL2-F: CCCATGGTTAAGAAAATCATCGCXCL2-R: CTTCAGGAACAGCCACCAAT [52]
DGKE-F: GACGGGCACCTGATCTTGTG DGKE-R: CTGGAGGCTACACCAGAAGG [53]
DUSP4-F: GGGGTCCTGTGGAGATCCTT DUSP4-R: GGCAGTCCGAGGAGACATTC [54]
FOXC2-F: CCTCCTGGTATCTCAACCACA FOXC2-R: GAGGGTCGAGTTCTCAATCCC [55]
GAPDH-F: AGCCACATCGCTCAGACACGAPDH-R: GCCCAATACGACCAAATCC [56]
HBEGF-F: ATCGTGGGGCTTCTCATGTTT HBEGF-R: TTAGTCATGCCCAACTTCACTTT [57]
IL8/CXCL8-F: AACTTCTCCACAACCCTCTGIL8/CXCL8-R: TTGGCAGCCTTCCTGATTTC [58]
PLK3-F: TTTTCGCACCACTTTGAGGAC PLK3-R: GAGGCCAGAAAGGATCTGCC [59]
PTGS2-F: CCTGTGCCTGATGATTGC PTGS2-R: CTGATGCGTGAAGTGCTG [60]
SLC16A6-F: CGCTGTGTTTGCTTTCGCACCA SLC16A6-R: TTTTCGGTGACGCTGGTCCTCT [61]
Table 2. Mouse primer list.
IL1-F: TTGGTTAAATGACCTGCAACA IL1-R: GAGCGCTCACGAACAGTTG [62]
IL6-F: GCTACCAAACTGGATATAATCAGGA IL6-R: CCAGGTAGCTATGG-TACTCCAGAA [63]
GAPDH-F: AACTTTGGCATTGTGGAAGG GAPDH-R: GGATGCAGGGATGATGTTCT [64]

3. Results

3.1. Principal Component Analysis and Heat Map of Gene Expression Changes by HAc

To investigate the degree to which HAc alters the transcriptional signature of human gingival fibroblasts, we conducted bulk RNA sequencing of gingival fibroblasts exposed to 4 mg/mL HAc for 6 h. The list of regulated genes is presented in the Supplement File S1. The high sensitivity of this particular preparation of gingival fibroblasts to potential agonists is supported by a sister experiment where lysates of platelet-rich fibrin caused a robust change in gene expression, including increased levels of chemokines and IL6 [42]. PCA analysis was based on the 500 most relevant genes, with PC1 and PC2 explaining 64% and 25% of the changes, respectively (Supplement File S2). The PCA was based on the raw counts of differentially expressed genes. In contrast to the sharp response to PRF [42], exposure of the fibroblasts to HAc only caused a moderate separation within the two dimensions in the PCA, thus no obvious clustering (Figure 1).

3.2. Volcano Blot of Gene Expression Changes by HAc

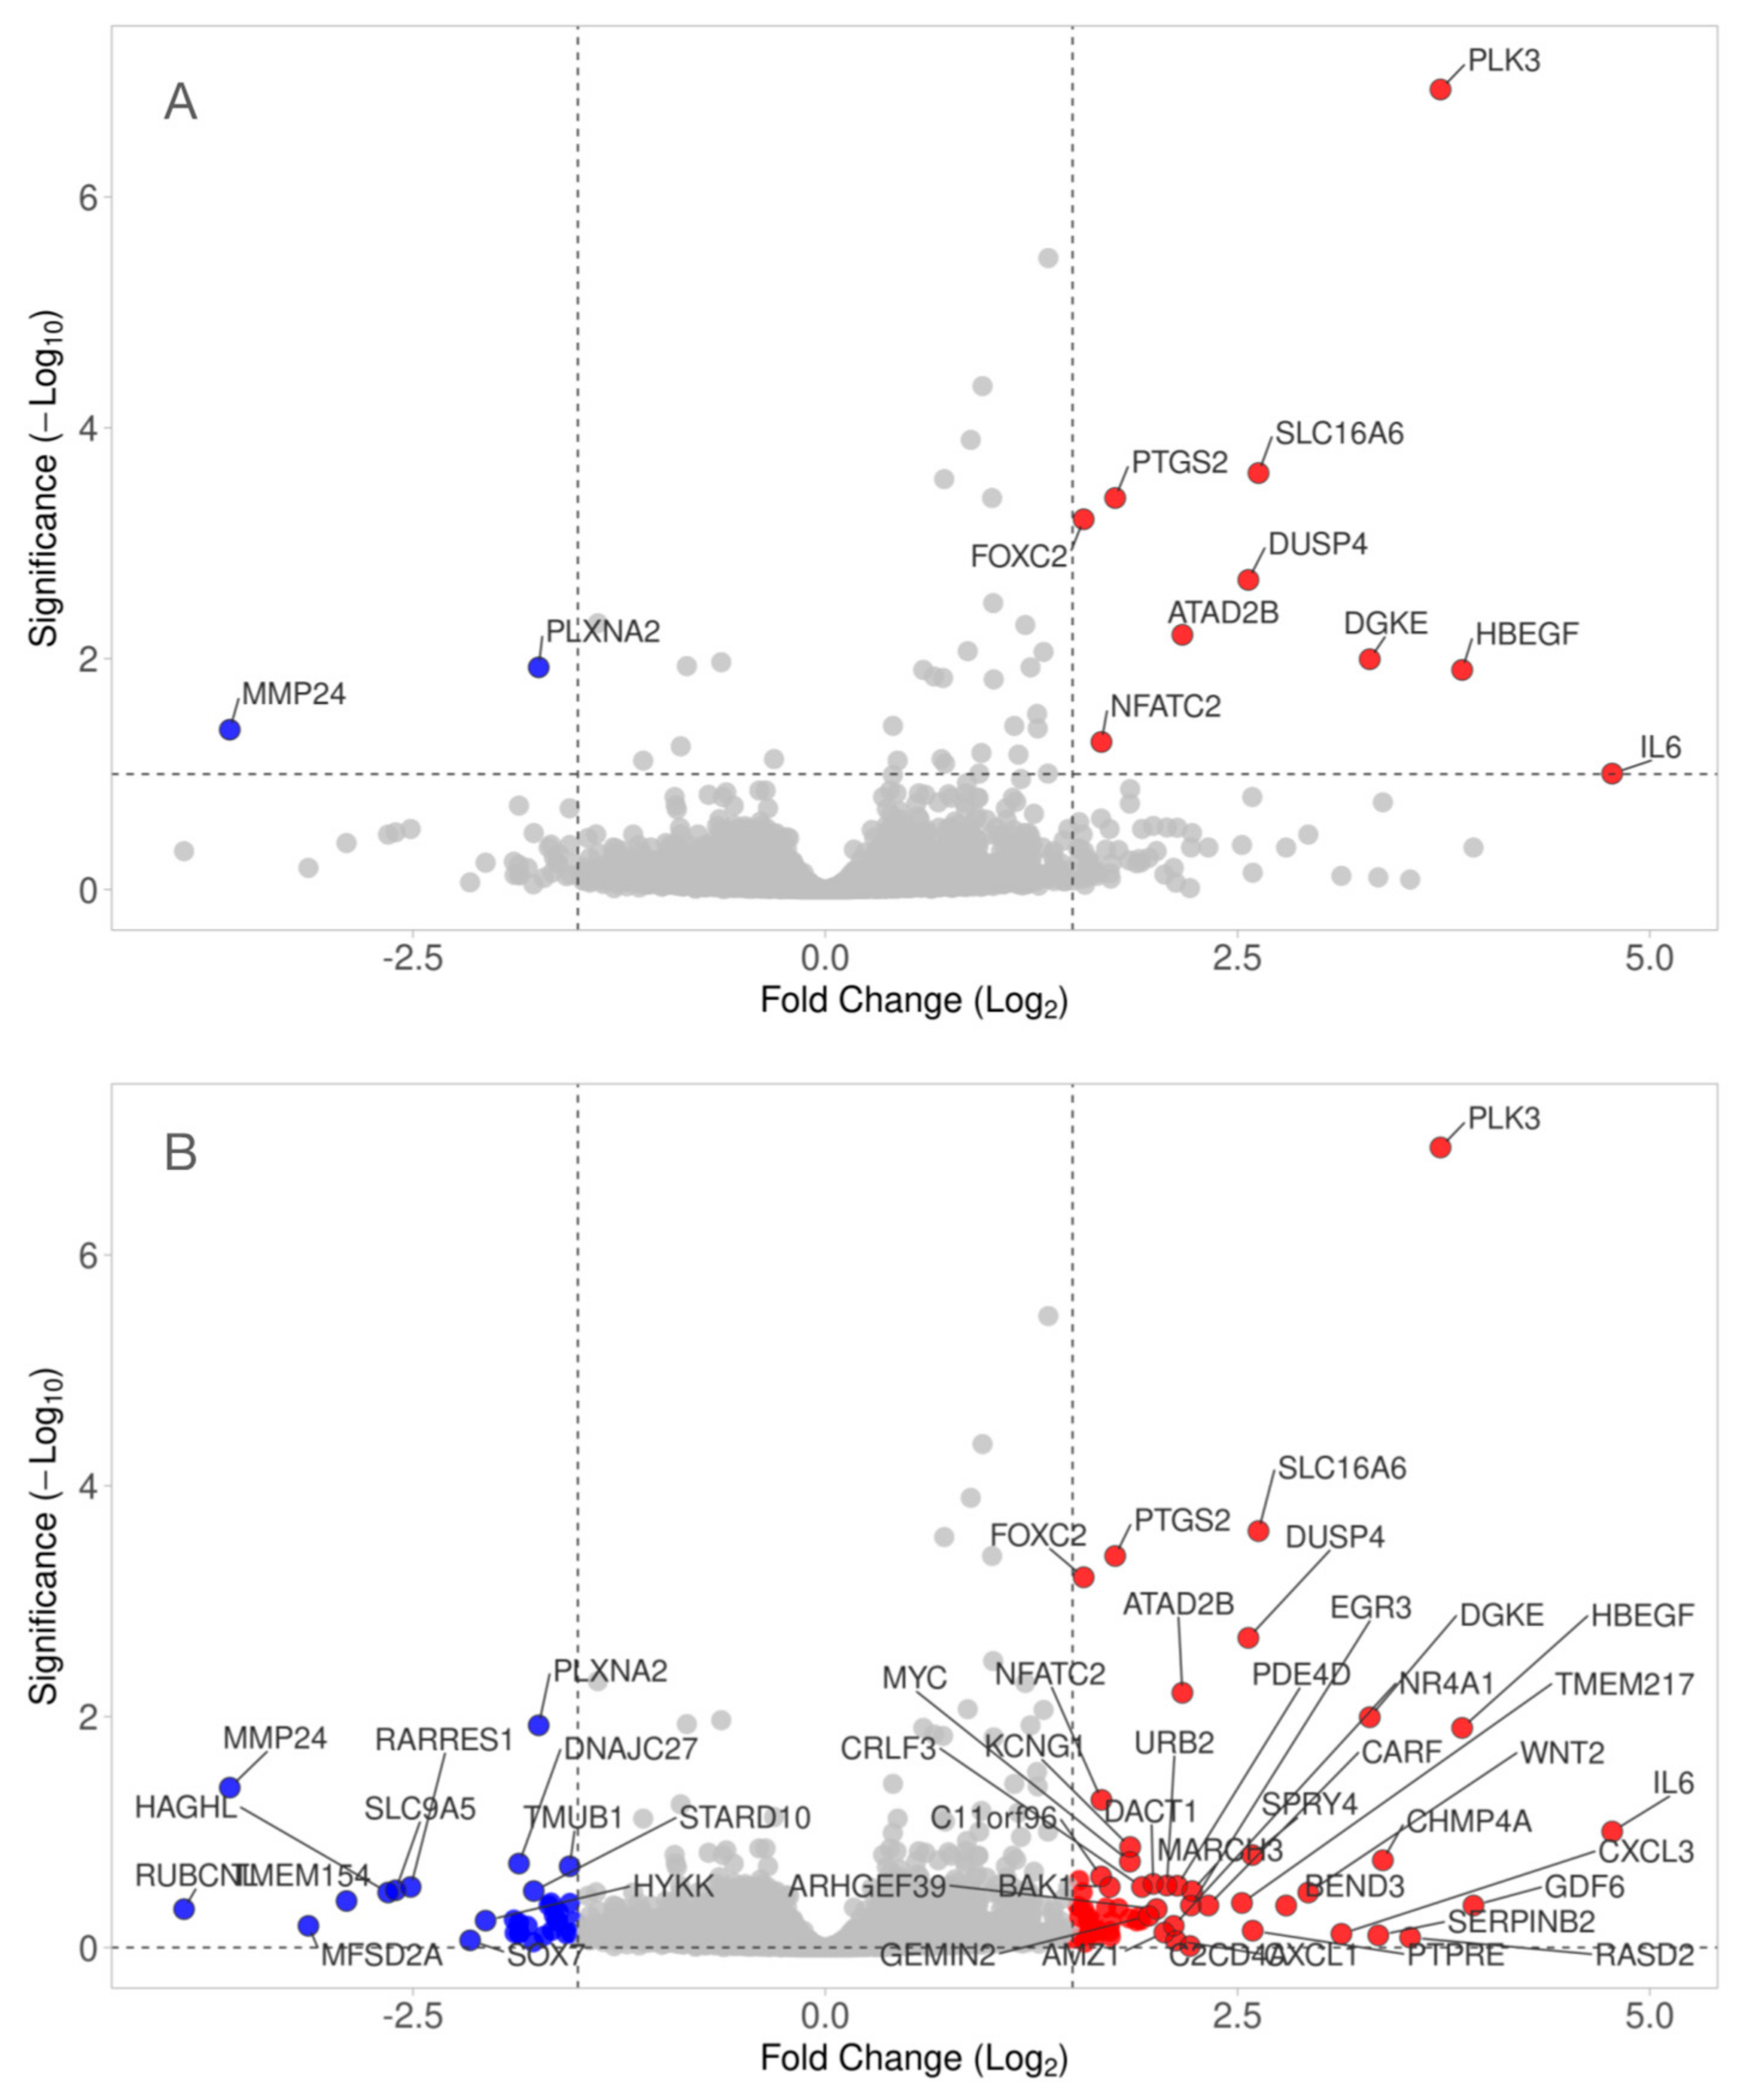
Next, we created a Volcano plot to identify changes in our data set (Supplement Files S3). Our volcano plot combines a threshold of statistical significance of 1.0 −Log10 (p = 0.1) with the 1.5 Log2 magnitude of the change (4-fold) to display. Based on this moderate threshold, and even though the same cells remarkably responded to PRF [42], only PLK3, SLC16A6, IL6, HBEGF, DGKE, DUSP4, PTGS2, FOXC2, ATAD2B, NFATC2 (upregulated), and MMP24 and PLXNA2 (downregulated) reached the undiscriminating level of significance together with an at least 4-fold upregulation when compared to unstimulated fibroblasts (Figure 2A). However, 98 genes appear when the significance threshold is eliminated (Figure 2B) and 22 genes are regulated based on an adjusted p-value of p = 0.05 only (Supplement File S1).

3.3. RT-PCR Gene Expression Changes by HAc

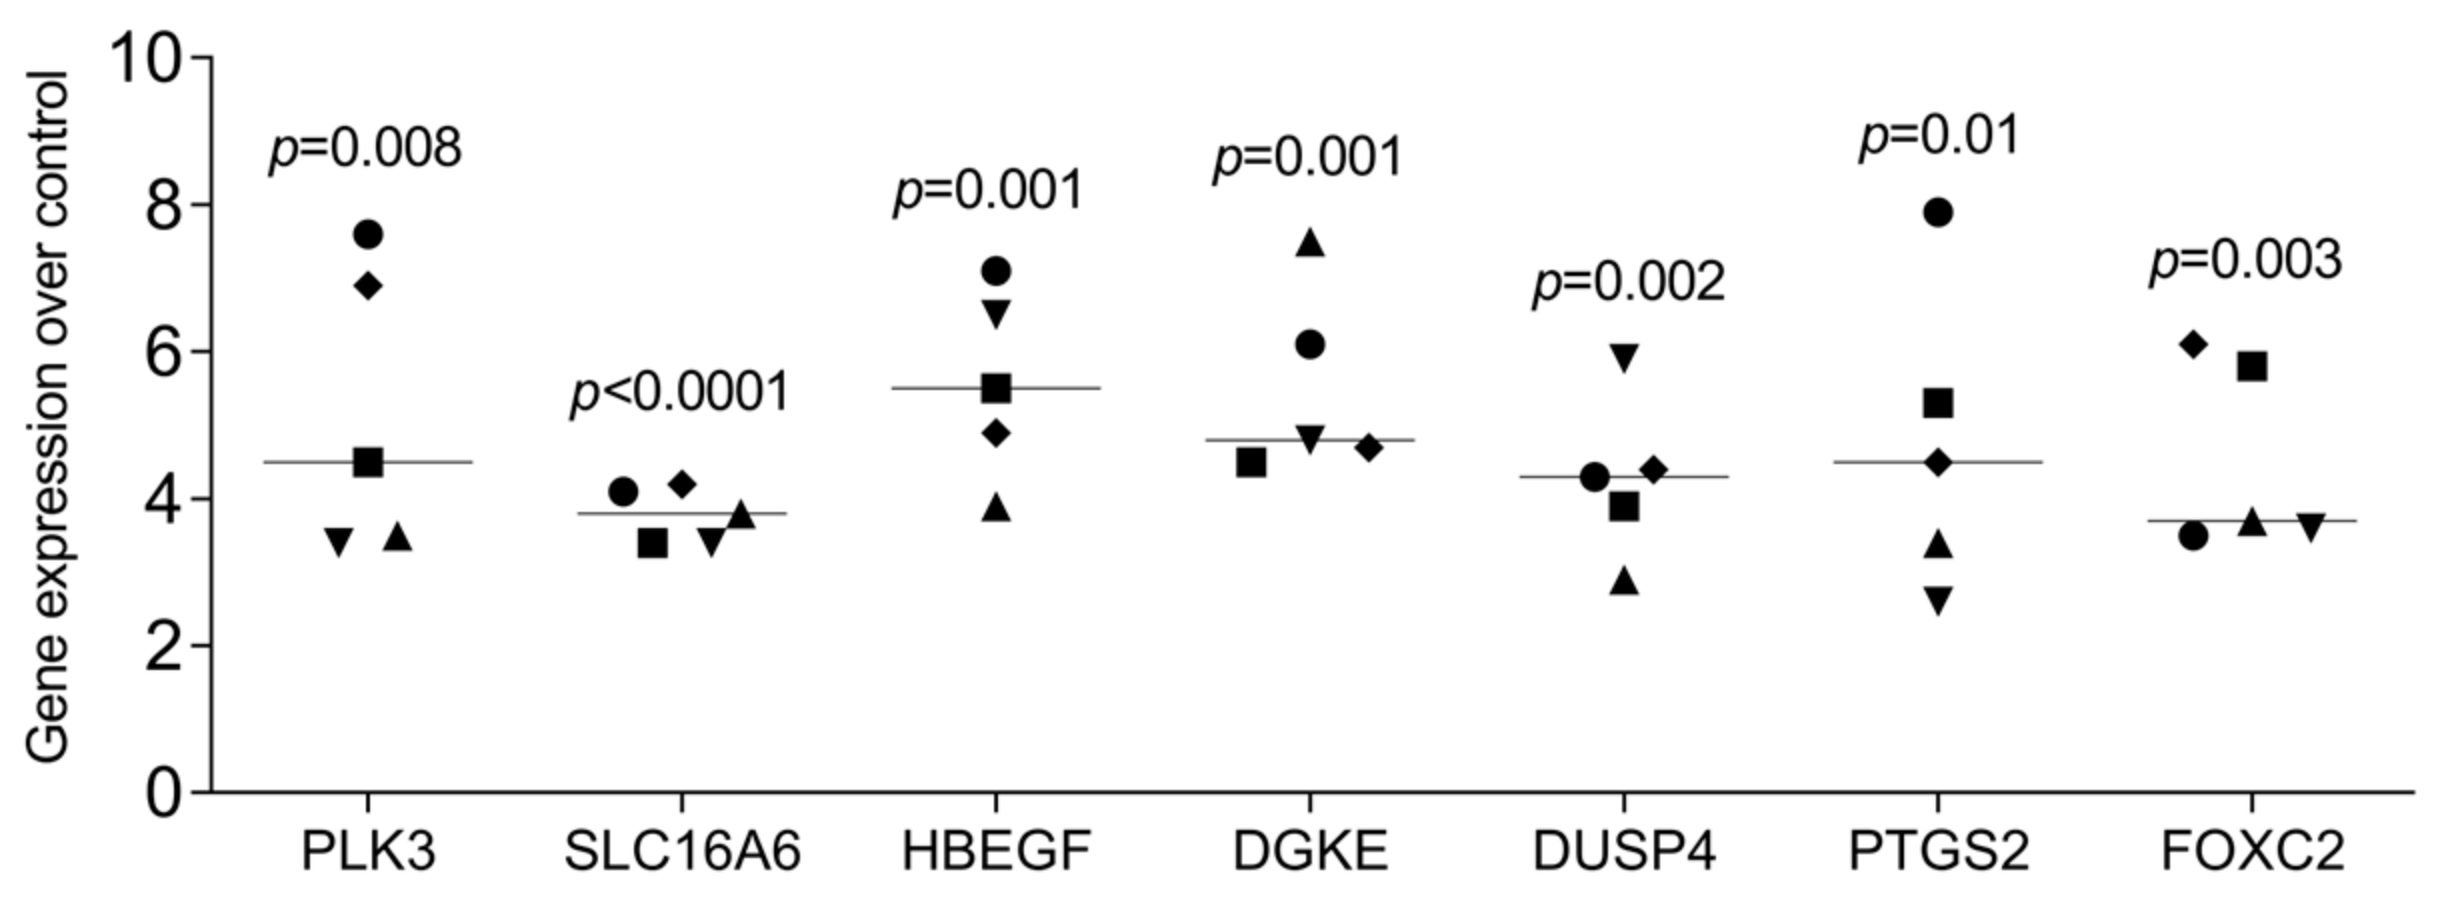
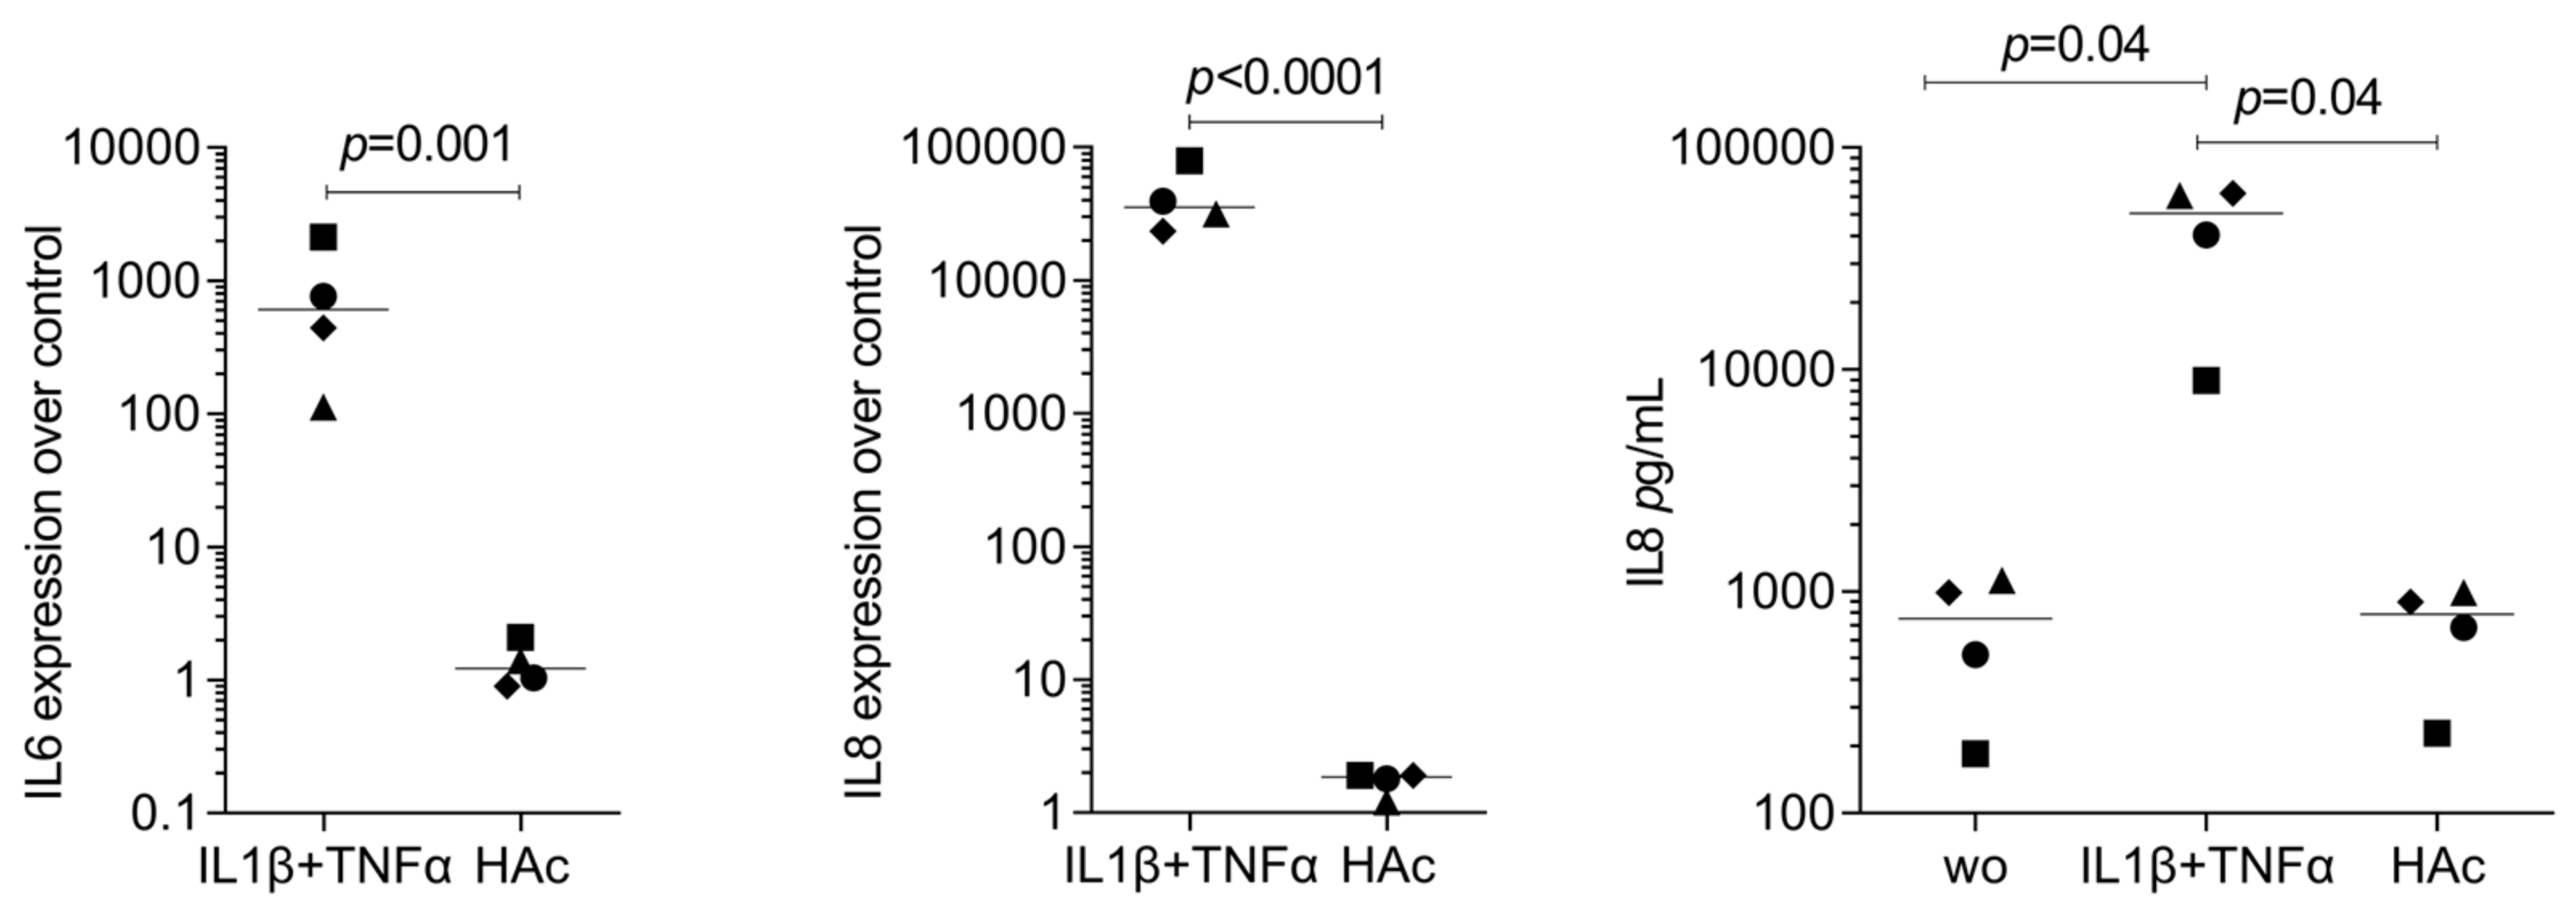
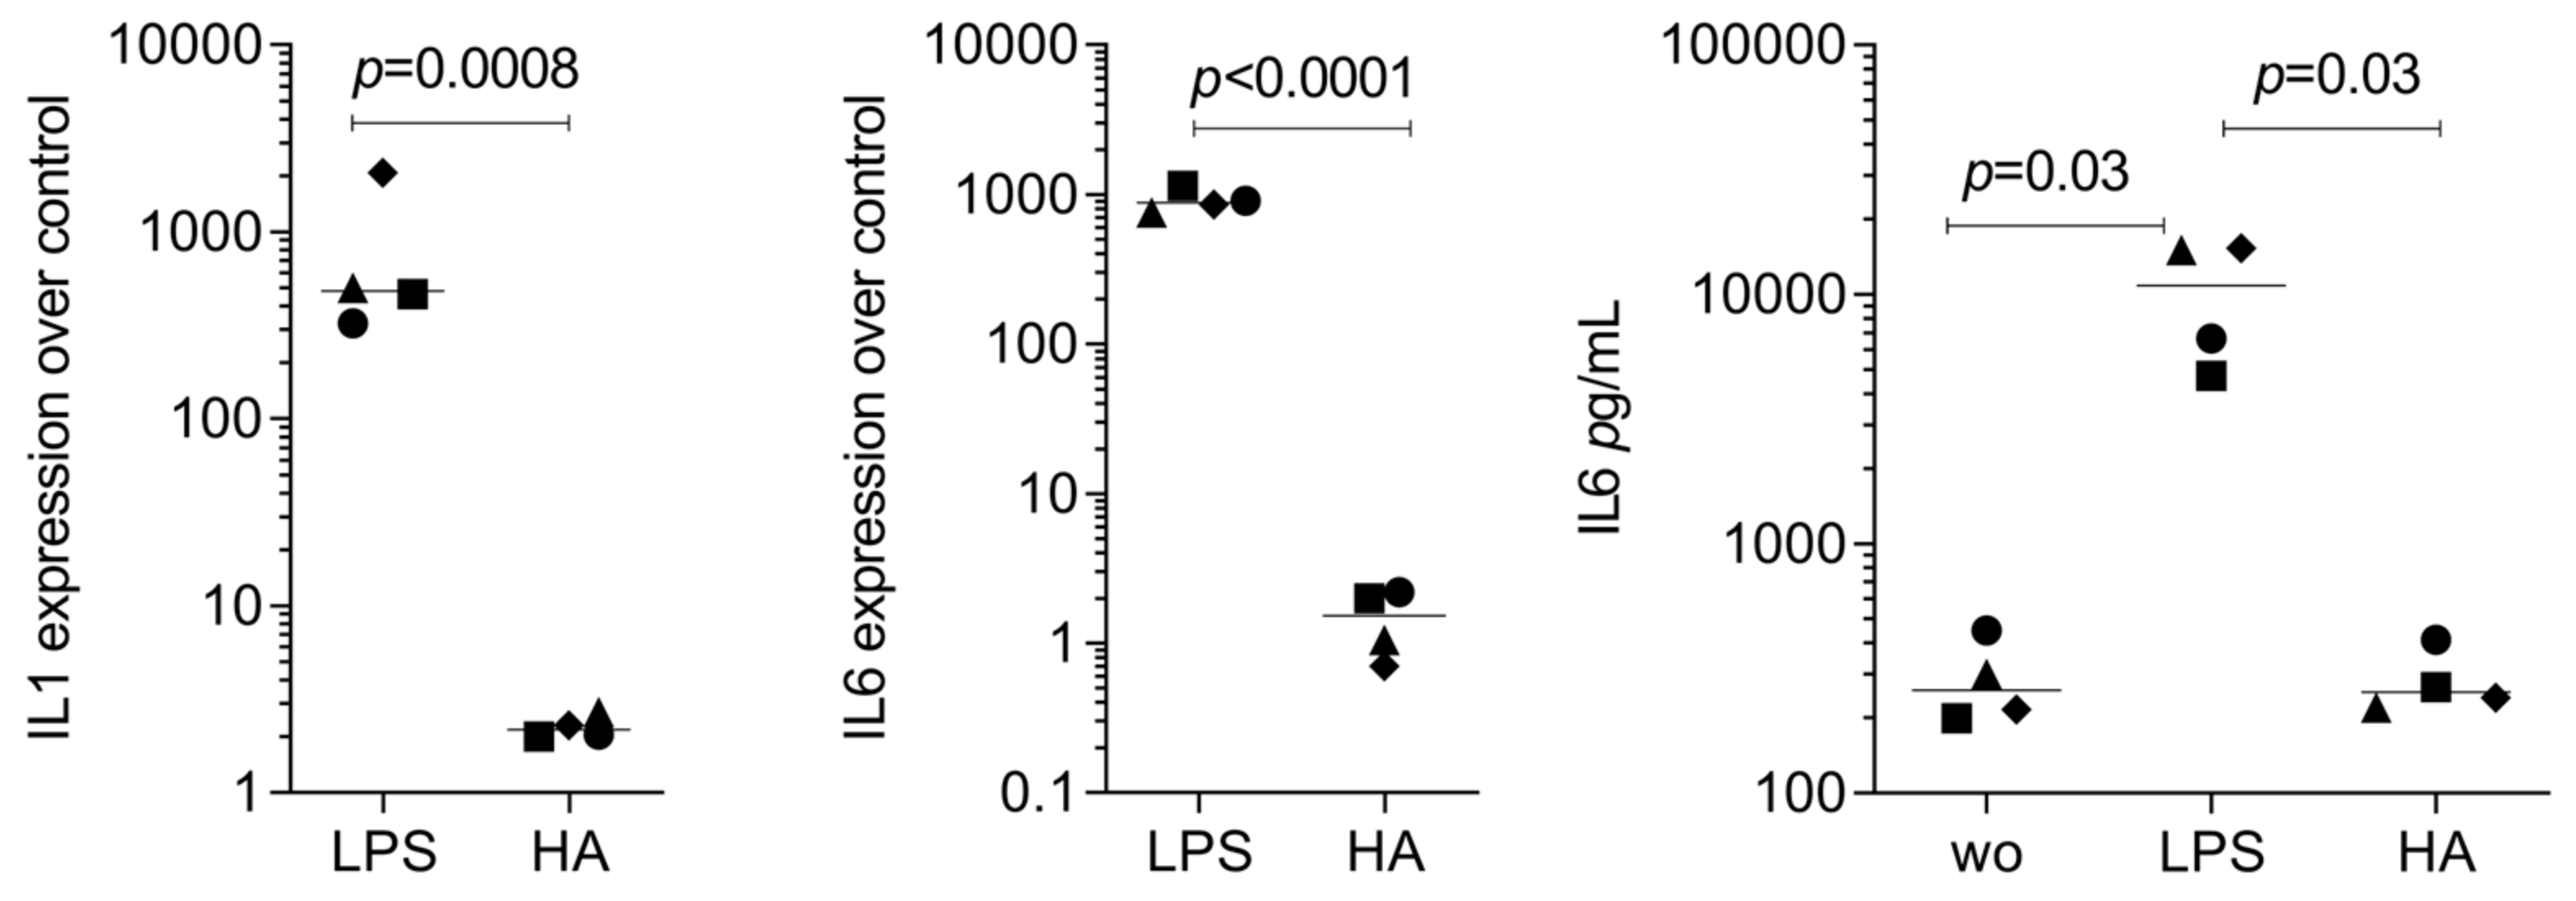
As a second approach, we confirmed by RT-PCR whether gingival fibroblast transcriptomes evolved with HAc exposure. Compared with untreated cells, HAc exposure causes the expected increase of a gene panel we have selected based on the Volcano plot, e.g., PLK3, SLC16A6, HBEGF, DGKE, DUSP4, PTGS2, and FOXC2 (Figure 3). Considering that PTGS2 is linked to inflammation and IL6 is an indicator cytokine, we could further show that HAc moderately enhanced the expression of inflammatory IL6 and CXCL8/IL8, but by far not reaching the high levels when gingiva fibroblasts are exposed to IL1β and TNFα (Figure 4). In addition, we have tested the impact of HAc on a potential inflammatory response in murine primary macrophages. There were no significant changes in IL1 and IL6 expression, in contrast to LPS exposure (Figure 5). Thus, HAc marginally increased inflammatory cytokines and chemokines but considerably less than with IL1β, TNFα, or PRF lysates in gingival fibroblasts [42]. HAc had no significant impact on the expression of CXCL1, CXCL2, and CXCL10 or in reducing the inflammatory response caused by IL1β, TNFα, and LPS in gingival fibroblasts and murine macrophages, respectively (Supplementary File S3).

3.4. Heat Map of Gene Expression Changes by HAc

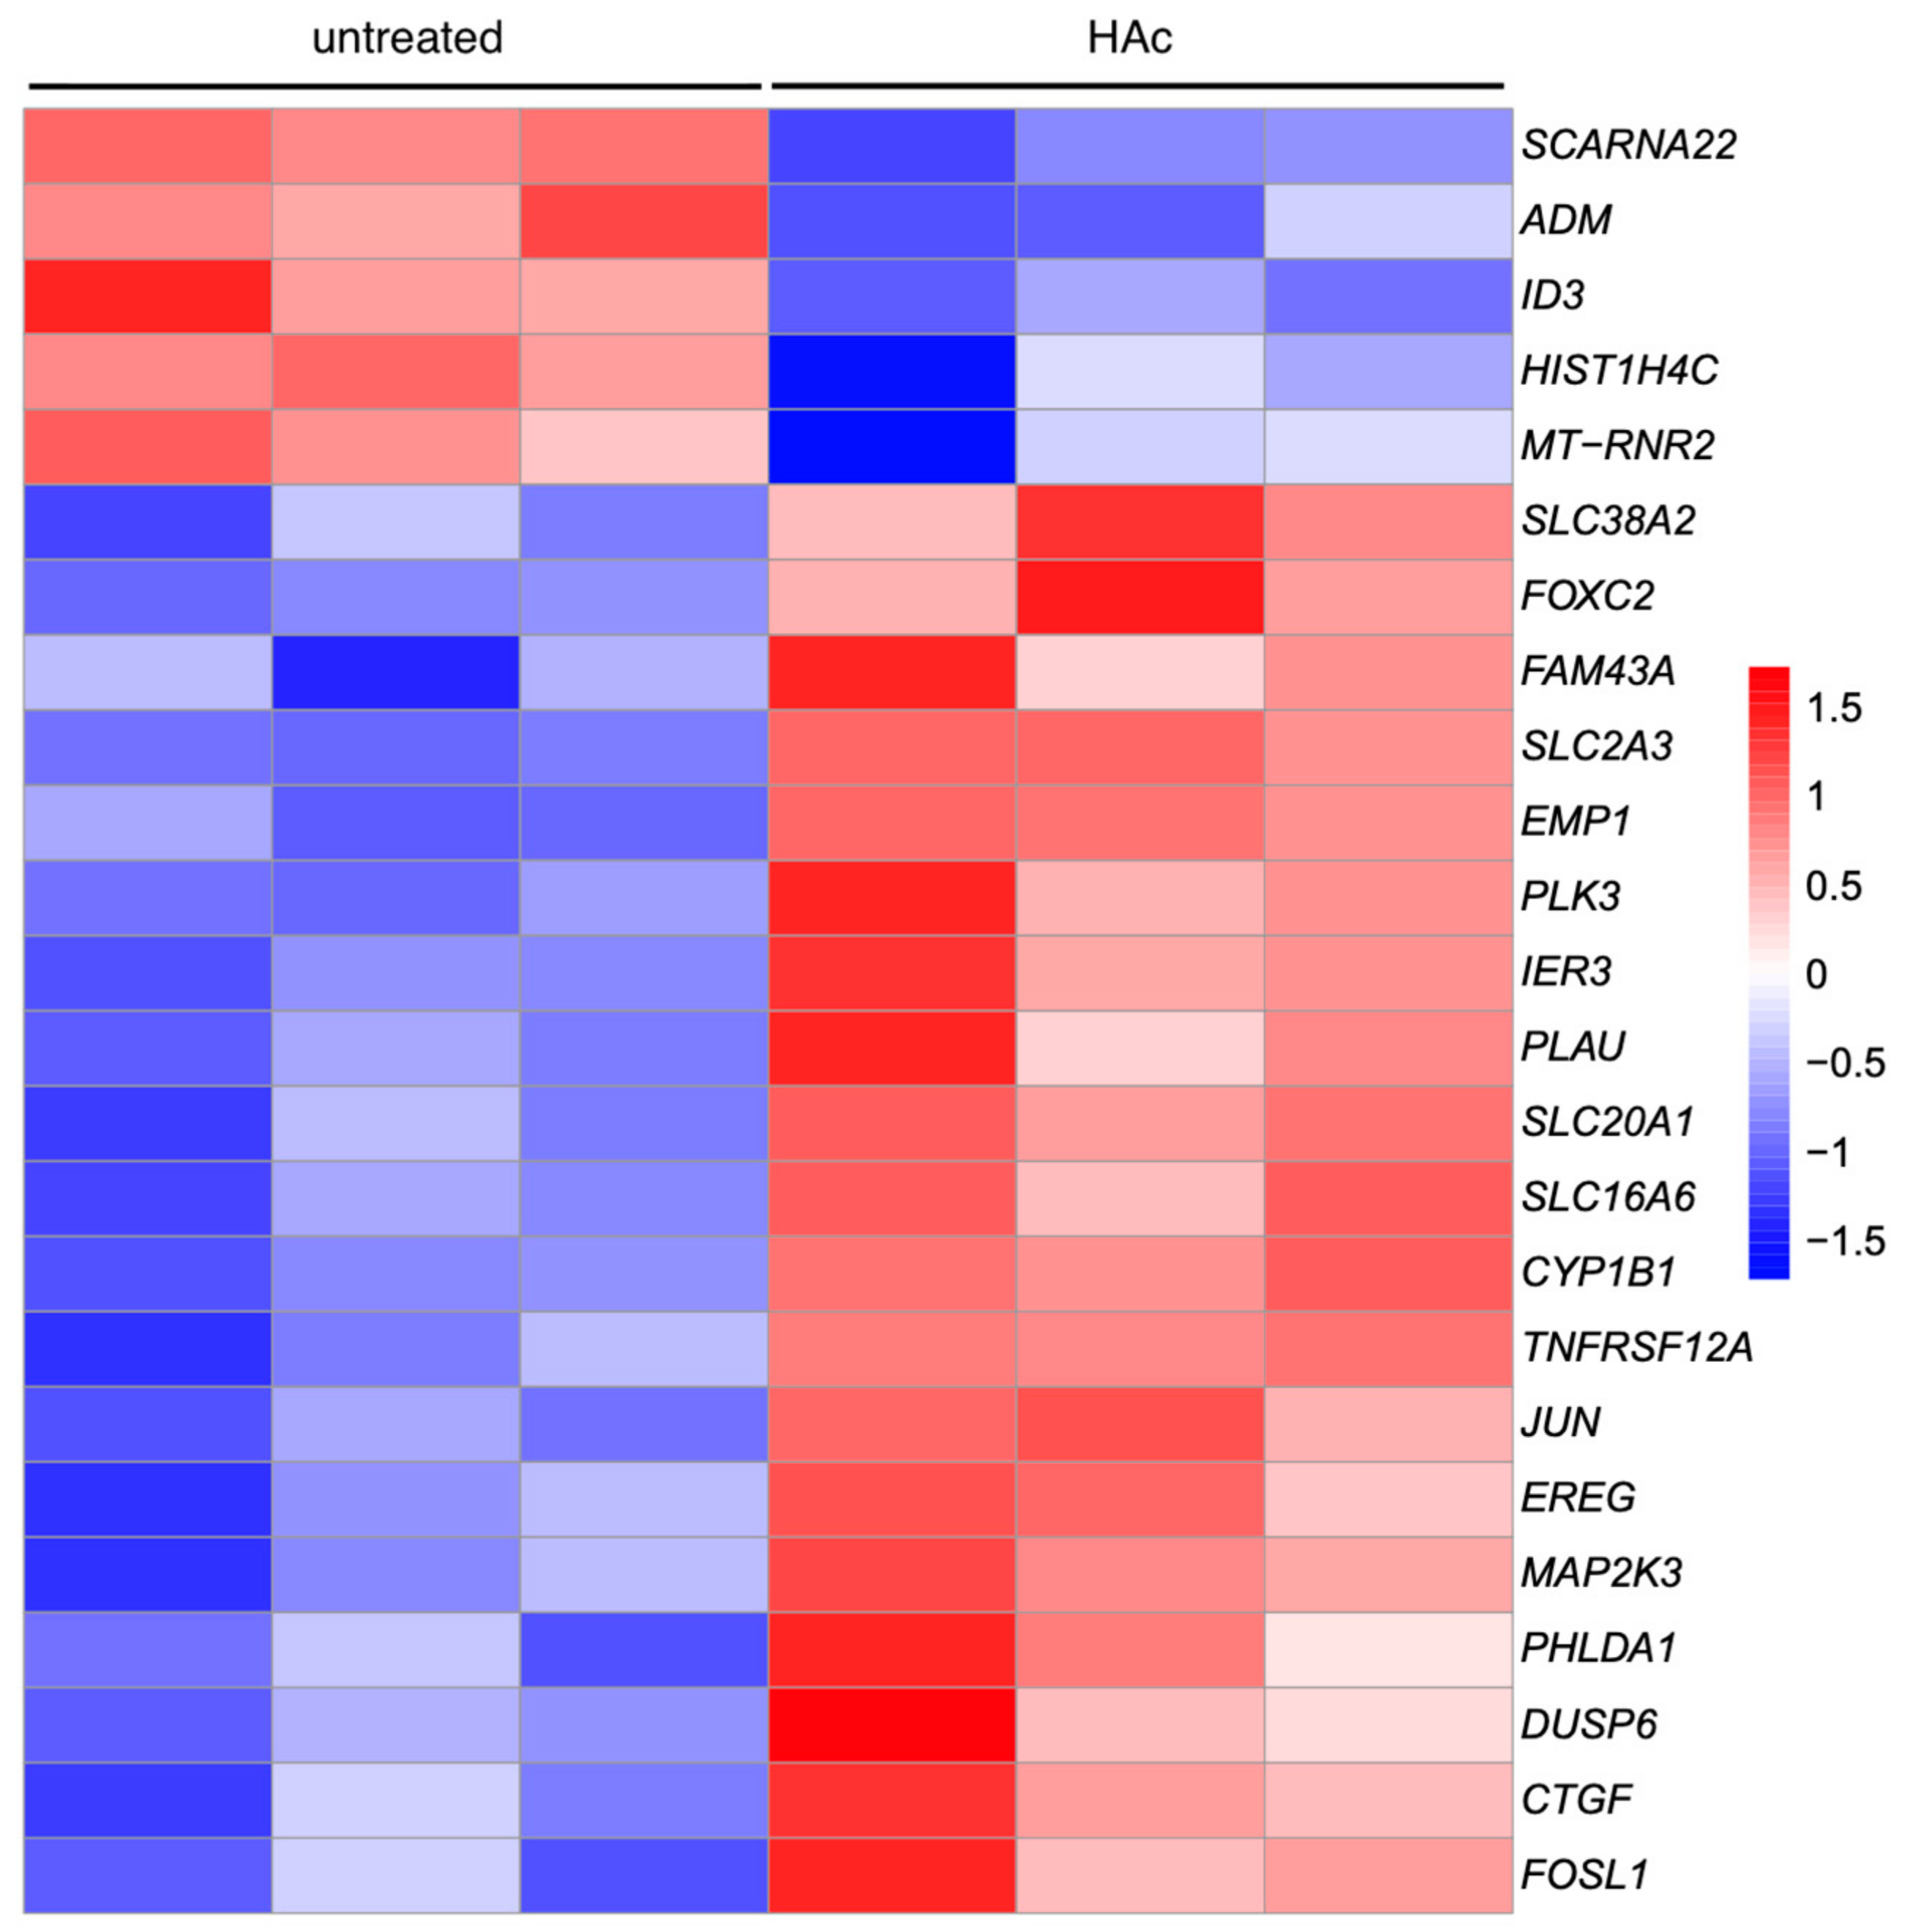
To be less stringent than the Volcano plot, we performed a heatmap analysis based on the significantly regulated genes with an adjusted p-value of p < 0.05 (Supplement File S4). Based on this criterion, we identified 19 and 5 as significantly up- and down-regulated genes, respectively (Figure 6). However, as expected from the Volcano plot, the overall intensity of the 24 gene expression changes was low with a 1.04 (min 0.35, max 3.73) and −0.63 (min −1.01, max −0.56) log2 fold-change. Moreover, the most strongly regulated genes that also appeared in the Volcano analysis were PLK3 (3.7 log2-fold), SLC16A6 (2.6 log2-fold), and FOXC2 (1.6 log2-fold), while other genes identified in the Volcano analysis—HBEGF, DGKE, DUSP4, PTGS2 and ATAD2B, and downregulated PLXNA2—failed to appear in the heat map. Thus, the heat map preferentially depicts genes with a homogenous distribution within the data set rather than reflecting a substantial signature change of gingival fibroblasts exposed to HAc.

3.5. STRING Cluster Analysis of Differentially Expressed Genes by HAc

We next investigate the clustering of the 24 genes with an adjusted p-value of p < 0.05 based on a STRING analysis (Supplement Files S5). We identified 16 genes distributed in three clusters, (red) ADM, CCN2, DUSP6, FOSL1, H4C6, IER3, JUN, MAP2K3, PHLDA1, PLAU, PLK3, TNFRSF12A, with eight genes linked to apoptosis in g:Profiler, (green) SLC2A3, SLC38A2, and (blue) CYP1B1, FOXC2 (Figure 7).

3.6. g:Profiler Analysis of Gene Expression Changes by HAc

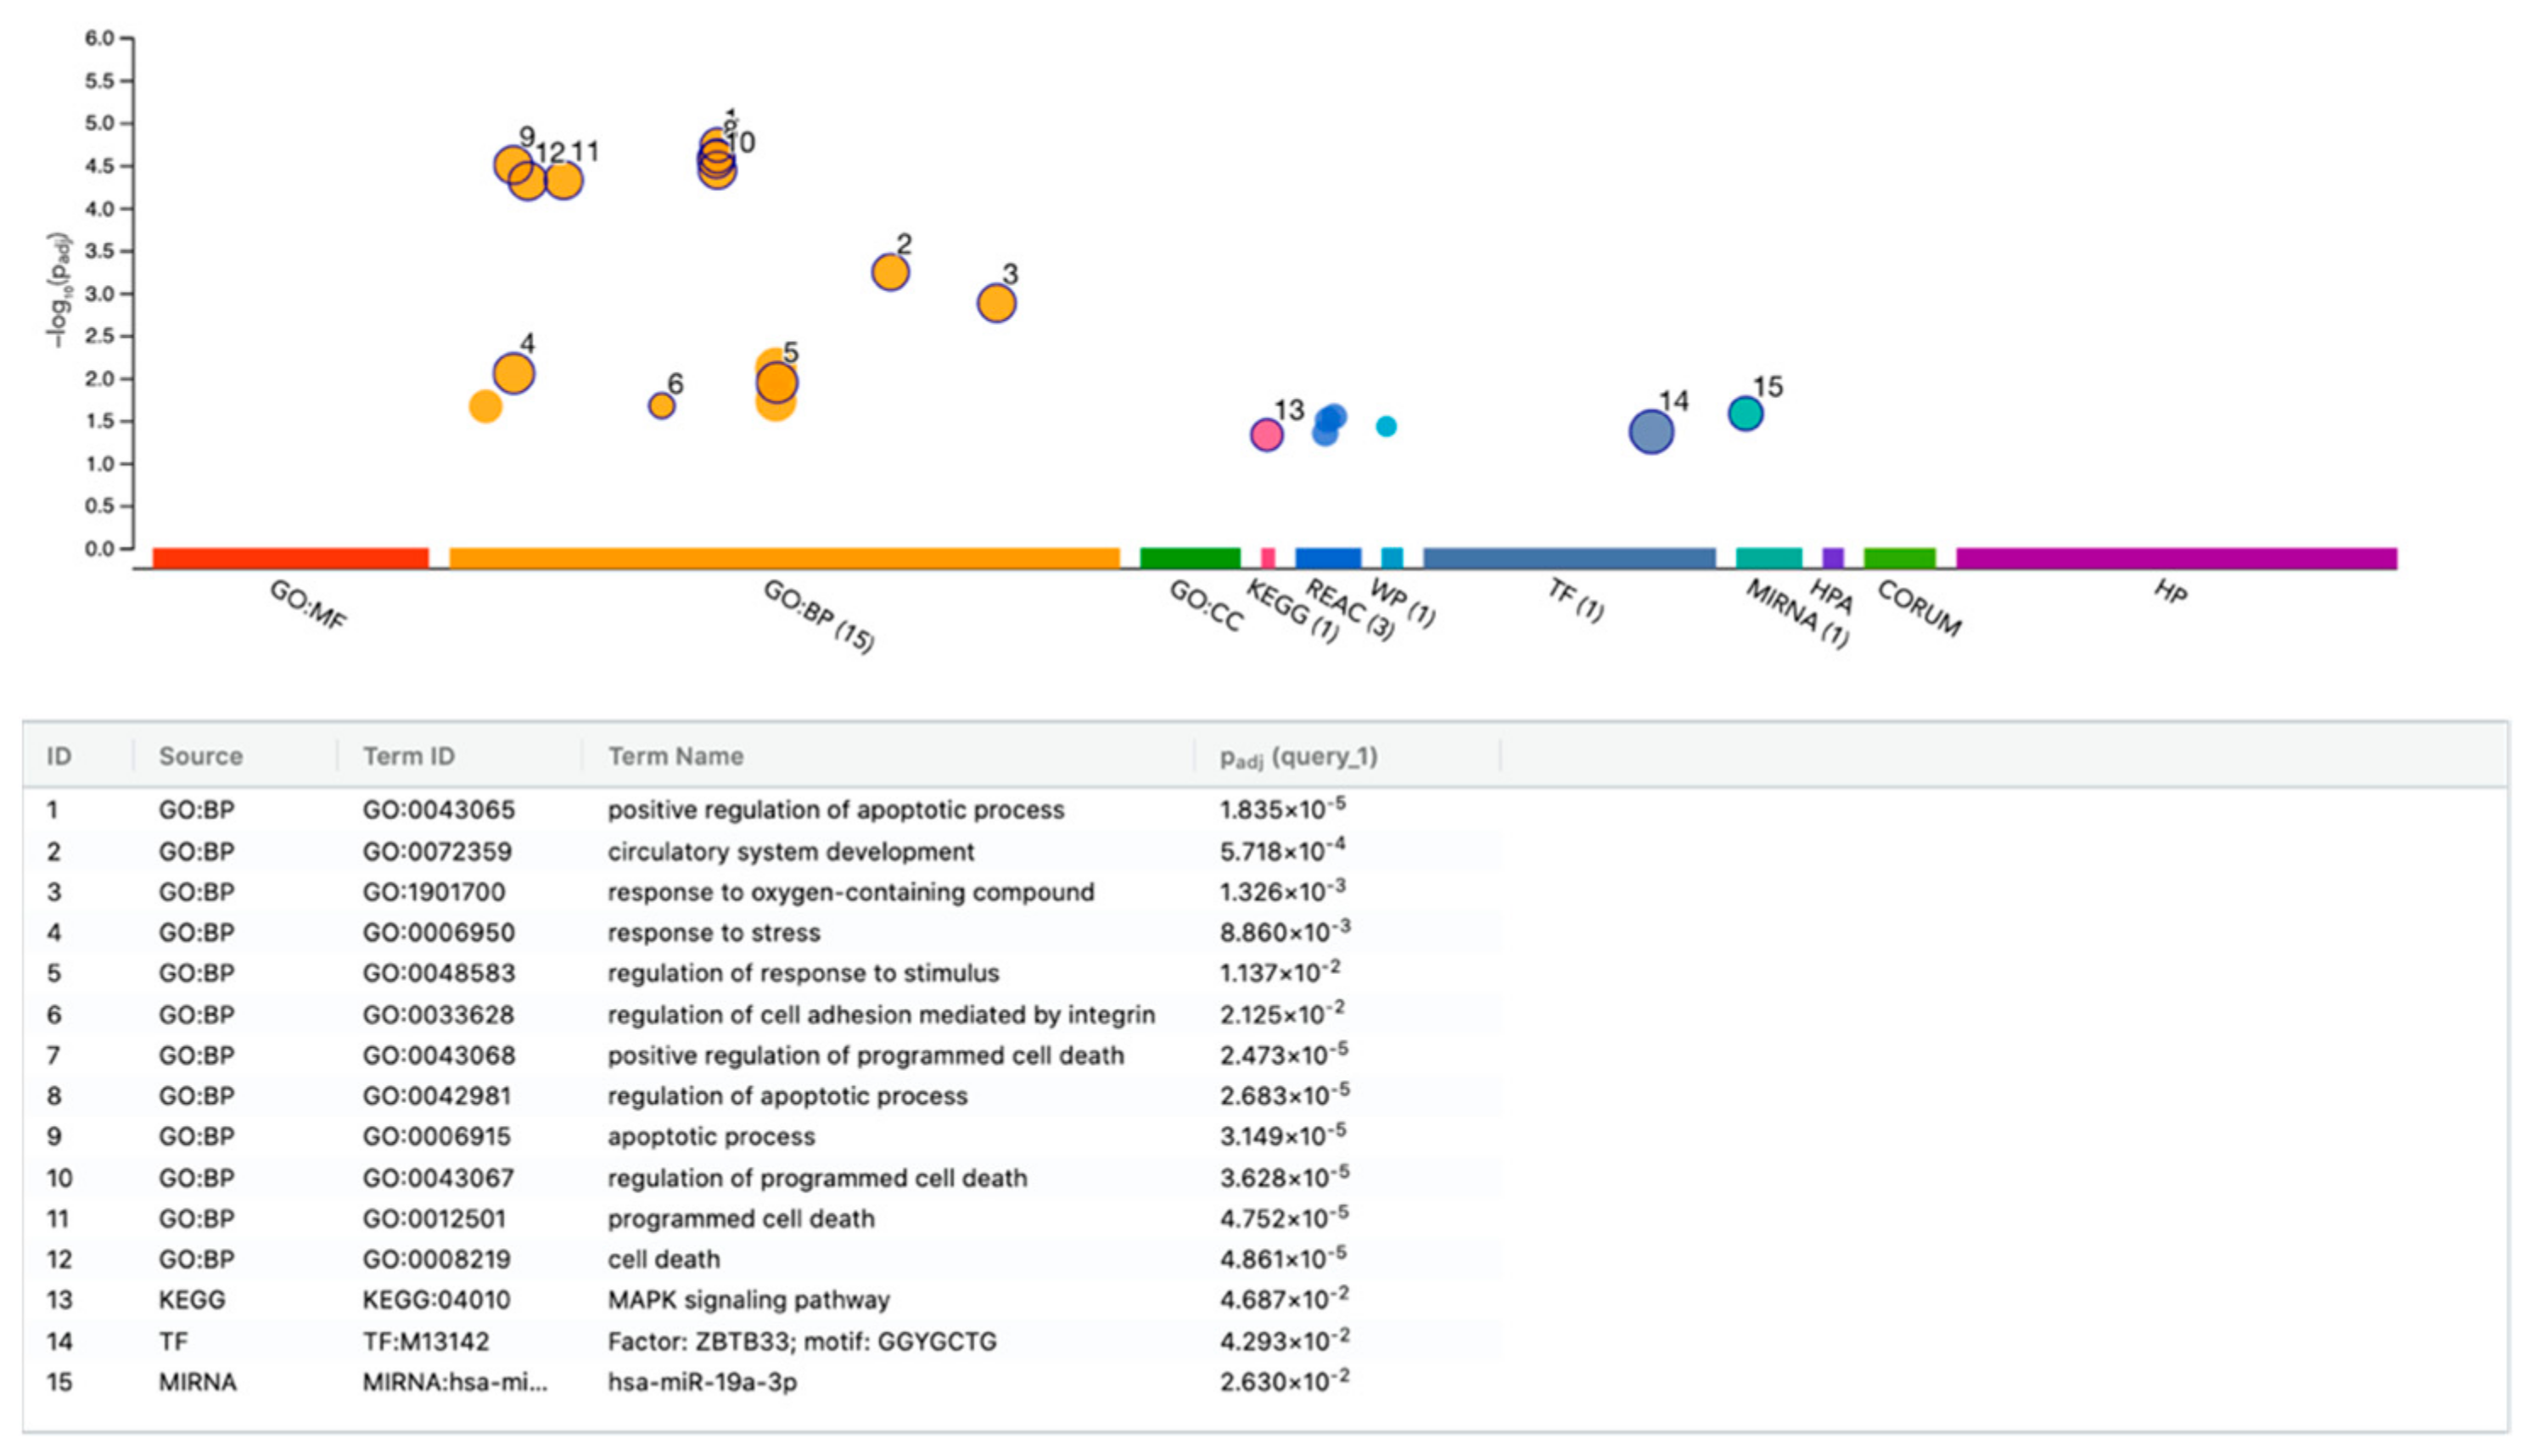
Finally, we performed a functional enrichment analysis of the 24 genes with an adjusted p-value of p < 0.05 in gingival fibroblasts exposed to HAc (Figure 8, Supplement Files S6). The g:Profiler analysis revealed significant enrichment of genes that are linked mainly to apoptosis, including CYP1B1, IER3, PLK3, DUSP6, ID3, PHLDA1, JUN, TNFRSF12A, FOXC2, ADM, FOSL1, EMP1—as well as transcription factor ZBTB33 [65] and miRNA miR-19a-3p [66]. These data should be viewed under the premise that g:Profiler does not consider the low magnitude of gene expression changes.

4. Discussion

Hyaluronic acid has become a widely used adjunctive device in dentistry [25], including the treatment of gingival recessions [32] with cross-linked HAc culminating in a series of preclinical studies [26,27,28] and clinical research [29,30,31,32,33,34,35]. This accumulating evidence has prompted basic research to understand the local response to HAc activity at a cellular level. We have acknowledged this demand to know more about how cells of the connective tissue, represented by gingival fibroblasts, respond to a clinically established device consisting of cross-linked and non-cross-linked hyaluronic acid. Our bioassay was based on a standard experimental setting where the gingival fibroblasts grown on the surface of a tissue culture plate, similar to what was recently reported in dermatology [67], were exposed to a commercially available but diluted HAc preparation. We have chosen RNAseq to uncover the differentially expressed genes and, thus, the impact of HAc on the transcriptome. Our main finding was that the overall response of gingival fibroblasts to HAc could be restricted to 12 genes with a > 4-fold change and adjusted p < 0.1, and 21 genes when exclusively limiting to adjusted p < 0.05. In essence, we report the transcriptome changes of gingival fibroblasts when exposed to a clinically approved available preparation of HAc.
Building on the findings of others, we now integrate our results to provide a more comprehensive perspective. We acknowledge work where the exact source of HAc, and even the same concentration of HAc, provoked a significant expression of inflammatory cytokines IL1β and TNFα in oral fibroblasts [67]. However, in their setting, cells were seeded onto HAc-precoated plates. In a similar setting, no changes in IL1β expression were observed with periodontal ligament fibroblasts [36], similar to what we have observed, as neither the cytokines nor chemokines reached an expression level that exceeds a relevant threshold. Consistently, HAc fragments are not inducers of inflammatory cytokine expression in synovial fibroblasts, chondrocytes, or peripheral blood mononucleated cells [68]. Thus, in our setting, where gingival fibroblasts were grown on culture dishes prior to HAc exposure, no major inflammatory response was observed, and there were no changes in the expression of MMPs [38,67]. Perhaps the culture conditions—seeding cells on HAc-coated plates—versus seeding cells and then exposing them to HAc caused a different response [39,40]. We, therefore, have to be careful when comparing studies that follow a similar but not the same experimental strategy. It would be worth evaluating the impact of the culture conditions on the cell response to HAc in a future study by RNAseq.
Our RNAseq approach has identified a series of genes that are differentially expressed in gingival fibroblasts exposed to HAc—however, the interpretation of these observations is complex. First, the expression changes caused by HAc are relatively low, with only 12 genes reaching the threshold 1.5 log2 change and p < 0.1 compared to the >7.0 log2 change of numerous inflammatory genes in the same setting with PRF lysates [42]. Our RT-PCR analysis confirmed the reproducibility of the gene panel identified in the Volcano plot. Thus, there is a restricted selection of genes for setting up a bioassay that reflects the HAc response to gingival fibroblasts and perhaps other mesenchymal cells. Even though gene ontology identified a possible role of apoptosis to be caused by HAc, neither we nor others could identify a possible role of HAc in fibroblast viability [38]. We can only speculate about HAc’s possible impact on the regulated genes’ function. It is also futile to speculate about the clinical meaning of the in vitro findings, particularly because the changes in the transcriptome are moderate to low. There is consequently no obvious gene enrichment that would point toward a biological response. Perhaps the most reliable interpretation is a reversed view—namely that HAc is not a major driver of catabolic events potentially caused by fibroblasts, as we experience them in periodontitis [69] and periimplantitis [70,71]. Clear insights will require a similar single-cell transcriptomic profiling of oral tissues from patients upon HAc application.
At the moment, we can interpret single genes regulated by HAc with respect to their function. Of potential interest are, perhaps, PLK3 acidophilic kinases, a family of five members in mammals with a central role in cell cycle and related events [72], and SLC16a6 involved in ketone body excretion [73,74]. FOXC2 null mice show axial skeletal anomalies caused by impaired hypertrophic chondrocyte remodeling [75]. HB-EGF triggers mesenchymal cell proliferation and differentiation and needs to be tightly controlled to maintain bone and articular cartilage integrity [76]. DGKE protects against renal ischemia/reperfusion injury in mice [53], and its loss causes cell stress [77,78]. DUSP4 and DUSP6 are linked to MAPK signaling in cancers [79], and in our analysis, DUS4 and DUSP6 both appear on the Volcano and heat map, respectively. ATAD2B belongs to the bromodomain proteins and functions as epigenetic readers that recognize acetylated histone tails [80]. PLXNA2 mediates axon guidance in neural development but is also related to osteogenic factor BMP2 [81]. PTGS2 is a key enzyme for prostaglandin E2 synthesis, and it not only drives inflammation but is also relevant to bone homeostasis and regeneration [82,83]. Even though most of the genes can be linked to inflammation and bone biology, the changes in the genetic signatures of gingival fibroblasts only provide one piece of a puzzle to understand the clinical impact of our HAc preparation at a cellular level.
Our study has further limitations; for instance, the in vitro bioassays do not reflect the in vivo clinical situation where the concentration of supplementary HAc is approximately five times higher than we have used in vitro. Even though the dilution now allows pipetting the HAc, it cannot be ruled out that the observed effects are secondary to the high concentration of HAc. A primary effect of HAc needs low concentrations, considering the possible CD44 receptor signaling by the fibroblasts. Future research should, therefore, consider a dose-response of major target genes—for instance, PLK3, SLC16A6, HBEGF, DGKE, DUSP4, PTGS2, and FOXC2—working with even higher dilutions of HAc but still keeping enough HAc in the system to potentially activate CD44 signaling. Indirect support for the activation of CD44 signaling by HAc in oral fibroblasts comes from the activation of ERK and PI3K/AKT-dependent pathways [38]. Future research could follow a siRNA approach to lower CD44 signaling [67,84] or implement mesenchymal cells from knockout mice [84] to understand if CD44 mediates the expression changes we have identified by RNAseq. This is not self-evident, as there is also RHAMM [85]. Future research should further consider the impact of cross-linking HAc with butanediol diglycidyl ether on the cell response, as the ratio is 8:1 of cross-linked versus natural HAc in our clinically used preparation. Care should be taken to generalize the findings towards HAc effects; we have exclusively used a commercial preparation with a HAc of around 1,000 kDa, mainly cross-linked, that is used as a space filler, while HAc of 20–200 kDa takes part in biological processes such as embryonic development and wound healing [86,87]. Another option for screening is to study other cell types, such as macrophages; for instance, however, murine RAW 264.7 cells showed no inflammatory response when exposed to highly purified pharmacological-grade hyaluronan of different molecular weights [88]; we also observed no inflammatory response with HAc. Thus, HAc is not an obvious driver of cytokine or chemokine expression in a setting that is highly sensitive to expression changes.

5. Conclusions

We conclude that gingival fibroblasts show a modest response when exposed to HAc, considering that only a few genes display considerable expression changes. Based on this expression pattern, we identified a panel of genes that may serve as a bioassay for further studies on the HAc response of fibroblasts and other mesenchymal cells. In general, the moderate changes in the genetic signature of gingival fibroblasts point toward a rather neutral cell response to HAc in vitro. Considering that fibroblasts produce HAc, the findings of a weak response to HAc are not particularly surprising. Further research should refine our knowledge of how fibroblasts—but also epithelial and other oral cells—respond to HAc and reveal the impact of molecular weight on cross-linking even further, also asking for the underlying signaling pathways.

Supplementary Materials

The following supporting information can be downloaded at https://www.mdpi.com/article/10.3390/bioengineering11121307/s1, File S1: Gene regulation lists; File S2: PCA analysis, File S3: RT-PCR; File S4: Heat map; File S5: STRING analysis; File S6: g:Profiler analysis.

Author Contributions

Conceptualization, L.P. and R.G.; data curation, L.P.; formal analysis, L.P., H.K., M.M. and R.G.; methodology, L.P., A.I. and N.d.S.S.; project administration, L.P.; supervision, L.P. and R.G.; visualization, L.P. and R.G.; writing—original draft preparation, L.P. and R.G.; writing—review and editing, L.P., A.I., N.d.S.S., H.K., M.M. and R.G. All authors have read and agreed to the published version of the manuscript.

Funding

The University Clinic of Dentistry has supported this study.

Institutional Review Board Statement

The Ethics Committee of the Medical University of Vienna (EK #631/2007) approved the isolation of gingival fibroblasts from extracted teeth.

Informed Consent Statement

Informed and written consent was obtained from all subjects involved in the study.

Data Availability Statement

All data are available on demand.

Acknowledgments

We thank the Core Facility Genomics of the Medical University of Vienna for performing the RNAseq. HyaDENT BG was kindly provided by REGEDENT GmbH, Dettelbach.

Conflicts of Interest

The authors declare no conflict of interest.

References

  1. Fundaro, S.P.; Salti, G.; Malgapo, D.M.H.; Innocenti, S. The Rheology and Physicochemical Characteristics of Hyaluronic Acid Fillers: Their Clinical Implications. Int. J. Mol. Sci. 2022, 23, 10518. [Google Scholar] [CrossRef] [PubMed]
  2. Tamer, T.M. Hyaluronan and synovial joint: Function, distribution and healing. Interdiscip. Toxicol. 2013, 6, 111–125. [Google Scholar] [CrossRef] [PubMed]
  3. Papakonstantinou, E.; Roth, M.; Karakiulakis, G. Hyaluronic acid: A key molecule in skin aging. Dermato-Endocrinology 2012, 4, 253–258. [Google Scholar] [CrossRef] [PubMed]
  4. Fagerholm, P.; Fitzsimmons, T.; Harfstrand, A.; Schenholm, M. Reactive formation of hyaluronic acid after small and large lens injury. Acta Ophthalmol. 1992, 70, 58–64. [Google Scholar] [CrossRef]
  5. Hynnekleiv, L.; Magno, M.; Vernhardsdottir, R.R.; Moschowits, E.; Tonseth, K.A.; Dartt, D.A.; Vehof, J.; Utheim, T.P. Hyaluronic acid in the treatment of dry eye disease. Acta Ophthalmol. 2022, 100, 844–860. [Google Scholar] [CrossRef]
  6. Tammi, R.; Tammi, M.; Hakkinen, L.; Larjava, H. Histochemical localization of hyaluronate in human oral epithelium using a specific hyaluronate-binding probe. Arch. Oral Biol. 1990, 35, 219–224. [Google Scholar] [CrossRef]
  7. Ijuin, C.; Ohno, S.; Tanimoto, K.; Honda, K.; Tanne, K. Regulation of hyaluronan synthase gene expression in human periodontal ligament cells by tumour necrosis factor-alpha, interleukin-1beta and interferon-gamma. Arch. Oral Biol. 2001, 46, 767–772. [Google Scholar] [CrossRef]
  8. Stern, R.; Jedrzejas, M.J. Hyaluronidases: Their genomics, structures, and mechanisms of action. Chem. Rev. 2006, 106, 818–839. [Google Scholar] [CrossRef]
  9. Entwistle, J.; Hall, C.L.; Turley, E.A. HA receptors: Regulators of signalling to the cytoskeleton. J. Cell Biochem. 1996, 61, 569–577. [Google Scholar] [CrossRef]
  10. Peach, R.J.; Hollenbaugh, D.; Stamenkovic, I.; Aruffo, A. Identification of hyaluronic acid binding sites in the extracellular domain of CD44. J. Cell Biol. 1993, 122, 257–264. [Google Scholar] [CrossRef]
  11. Aruffo, A.; Stamenkovic, I.; Melnick, M.; Underhill, C.B.; Seed, B. CD44 is the principal cell surface receptor for hyaluronate. Cell 1990, 61, 1303–1313. [Google Scholar] [CrossRef] [PubMed]
  12. Yang, B.; Yang, B.L.; Savani, R.C.; Turley, E.A. Identification of a common hyaluronan binding motif in the hyaluronan binding proteins RHAMM, CD44 and link protein. EMBO J. 1994, 13, 286–296. [Google Scholar] [CrossRef]
  13. McCourt, P.A.; Gustafson, S. On the adsorption of hyaluronan and ICAM-1 to modified hydrophobic resins. Int. J. Biochem. Cell Biol. 1997, 29, 1179–1189. [Google Scholar] [CrossRef] [PubMed]
  14. Knudson, W.; Chow, G.; Knudson, C.B. CD44-mediated uptake and degradation of hyaluronan. Matrix Biol. 2002, 21, 15–23. [Google Scholar] [CrossRef]
  15. Zhang, Y.W.; Mess, J.; Aizarani, N.; Mishra, P.; Johnson, C.; Romero-Mulero, M.C.; Rettkowski, J.; Schonberger, K.; Obier, N.; Jacklein, K.; et al. Hyaluronic acid-GPRC5C signalling promotes dormancy in haematopoietic stem cells. Nat. Cell Biol. 2022, 24, 1038–1048. [Google Scholar] [CrossRef]
  16. Moutsopoulos, N.M.; Moutsopoulos, H.M. The oral mucosa: A barrier site participating in tissue-specific and systemic immunity. Oral Dis. 2018, 24, 22–25. [Google Scholar] [CrossRef]
  17. Dutzan, N.; Abusleme, L.; Bridgeman, H.; Greenwell-Wild, T.; Zangerle-Murray, T.; Fife, M.E.; Bouladoux, N.; Linley, H.; Brenchley, L.; Wemyss, K.; et al. On-going Mechanical Damage from Mastication Drives Homeostatic Th17 Cell Responses at the Oral Barrier. Immunity 2017, 46, 133–147. [Google Scholar] [CrossRef]
  18. Larjava, H.; Hakkinen, L.; Rahemtulla, F. A biochemical analysis of human periodontal tissue proteoglycans. Biochem. J. 1992, 284 Pt 1, 267–274. [Google Scholar] [CrossRef]
  19. Arumuganainar, D.; Krishna Naik, V.; Ramadoss, R.; Balasundaram, A.; Victor, D.J. Evaluation of CD44 antigen in type 2 diabetic patients with periodontitis: An immunohistochemical study. Dent. Med. Probl. 2024, 61, 225–231. [Google Scholar] [CrossRef]
  20. Jin, S.H.; Lee, J.E.; Yun, J.H.; Kim, I.; Ko, Y.; Park, J.B. Isolation and characterization of human mesenchymal stem cells from gingival connective tissue. J. Periodontal Res. 2015, 50, 461–467. [Google Scholar] [CrossRef]
  21. Lin, N.H.; Menicanin, D.; Mrozik, K.; Gronthos, S.; Bartold, P.M. Putative stem cells in regenerating human periodontium. J. Periodontal Res. 2008, 43, 514–523. [Google Scholar] [CrossRef] [PubMed]
  22. Trubiani, O.; Di Primio, R.; Traini, T.; Pizzicannella, J.; Scarano, A.; Piattelli, A.; Caputi, S. Morphological and cytofluorimetric analysis of adult mesenchymal stem cells expanded ex vivo from periodontal ligament. Int. J. Immunopathol. Pharmacol. 2005, 18, 213–221. [Google Scholar] [CrossRef] [PubMed]
  23. Takahashi, K.; Takigawa, M.; Takashiba, S.; Nagai, A.; Miyamoto, M.; Kurihara, H.; Murayama, Y. Role of cytokine in the induction of adhesion molecules on cultured human gingival fibroblasts. J. Periodontol. 1994, 65, 230–235. [Google Scholar] [CrossRef]
  24. Zhu, X.; von Werdt, L.; Zappala, G.; Sculean, A.; Eick, S.; Stahli, A. In vitro activity of hyaluronic acid and human serum on periodontal biofilm and periodontal ligament fibroblasts. Clin. Oral Investig. 2023, 27, 5021–5029. [Google Scholar] [CrossRef]
  25. Casale, M.; Moffa, A.; Vella, P.; Sabatino, L.; Capuano, F.; Salvinelli, B.; Lopez, M.A.; Carinci, F.; Salvinelli, F. Hyaluronic acid: Perspectives in dentistry. A systematic review. Int. J. Immunopathol. Pharmacol. 2016, 29, 572–582. [Google Scholar] [CrossRef]
  26. Shirakata, Y.; Imafuji, T.; Nakamura, T.; Shinohara, Y.; Iwata, M.; Setoguchi, F.; Noguchi, K.; Sculean, A. Cross-linked hyaluronic acid gel with or without a collagen matrix in the treatment of class III furcation defects: A histologic and histomorphometric study in dogs. J. Clin. Periodontol. 2022, 49, 1079–1089. [Google Scholar] [CrossRef]
  27. Shirakata, Y.; Nakamura, T.; Kawakami, Y.; Imafuji, T.; Shinohara, Y.; Noguchi, K.; Sculean, A. Healing of buccal gingival recessions following treatment with coronally advanced flap alone or combined with a cross-linked hyaluronic acid gel. An experimental study in dogs. J. Clin. Periodontol. 2021, 48, 570–580. [Google Scholar] [CrossRef]
  28. Eliezer, M.; Sculean, A.; Miron, R.J.; Nemcovsky, C.; Weinberg, E.; Weinreb, M.; Zoabi, H.; Bosshardt, D.D.; Fujioka-Kobayashi, M.; Moses, O. Hyaluronic acid slows down collagen membrane degradation in uncontrolled diabetic rats. J. Periodontal Res. 2019, 54, 644–652. [Google Scholar] [CrossRef]
  29. Vela, O.C.; Boariu, M.; Rusu, D.; Iorio-Siciliano, V.; Sculean, A.; Stratul, S.I. Clinical and Radiographic Evaluation of Intrabony Periodontal Defects Treated with Hyaluronic Acid or Enamel Matrix Proteins: A 6-Month Prospective Study. Oral Health Prev. Dent. 2024, 22, 257–270. [Google Scholar] [CrossRef]
  30. Bilhan, H.; Friedmann, A. The “Tunneled Sandwich” Technique for Preserving the Buccal Tissue Volume After Immediate Implantation: A Retrospective Report of 10 Cases. Int. J. Periodontics Restor. Dent. 2023, 43, s53–s64. [Google Scholar] [CrossRef]
  31. Husseini, B.; Friedmann, A.; Wak, R.; Ghosn, N.; Khoury, G.; El Ghoul, T.; Abboud, C.K.; Younes, R. Clinical and radiographic assessment of cross-linked hyaluronic acid addition in demineralized bovine bone based alveolar ridge preservation: A human randomized split-mouth pilot study. J. Stomatol. Oral Maxillofac. Surg. 2023, 124, 101426. [Google Scholar] [CrossRef] [PubMed]
  32. Kalimeri, E.; Roccuzzo, A.; Stahli, A.; Oikonomou, I.; Berchtold, A.; Sculean, A.; Kloukos, D. Adjunctive use of hyaluronic acid in the treatment of gingival recessions: A systematic review and meta-analysis. Clin. Oral Investig. 2024, 28, 329. [Google Scholar] [CrossRef] [PubMed]
  33. Onisor, F.; Bran, S.; Mester, A.; Voina-Tonea, A. Efficiency of Hyaluronic Acid in Infrabony Defects: A Systematic Review of Human Clinical Trials. Medicina 2022, 58, 580. [Google Scholar] [CrossRef] [PubMed]
  34. Joshi, V.M.; Kandaswamy, E.; Germain, J.S.; Schiavo, J.H.; Fm, H.S. Effect of hyaluronic acid on palatal wound healing: A systematic review. Clin. Oral Investig. 2024, 28, 565. [Google Scholar] [CrossRef]
  35. Makdisi, J.; Akbari, S.; Zayeri, F.; AslRoosta, H.; Yaghobee, S. Application of Hyaluronic Acid for Treatment of Interdental Papillary Deficiency: A Systematic Review and Meta-Analysis. Front. Dent. 2023, 20, 19. [Google Scholar] [CrossRef]
  36. Fujioka-Kobayashi, M.; Muller, H.D.; Mueller, A.; Lussi, A.; Sculean, A.; Schmidlin, P.R.; Miron, R.J. In vitro effects of hyaluronic acid on human periodontal ligament cells. BMC Oral Health 2017, 17, 44. [Google Scholar] [CrossRef]
  37. Asparuhova, M.B.; Chappuis, V.; Stahli, A.; Buser, D.; Sculean, A. Role of hyaluronan in regulating self-renewal and osteogenic differentiation of mesenchymal stromal cells and pre-osteoblasts. Clin. Oral Investig. 2020, 24, 3923–3937. [Google Scholar] [CrossRef]
  38. Asparuhova, M.B.; Kiryak, D.; Eliezer, M.; Mihov, D.; Sculean, A. Activity of two hyaluronan preparations on primary human oral fibroblasts. J. Periodontal Res. 2019, 54, 33–45. [Google Scholar] [CrossRef]
  39. Kessler-Becker, D.; Krieg, T.; Eckes, B. Expression of pro-inflammatory markers by human dermal fibroblasts in a three-dimensional culture model is mediated by an autocrine interleukin-1 loop. Biochem. J. 2004, 379, 351–358. [Google Scholar] [CrossRef]
  40. Froget, S.; Barthelemy, E.; Guillot, F.; Soler, C.; Coudert, M.C.; Benbunan, M.; Dosquet, C. Wound healing mediator production by human dermal fibroblasts grown within a collagen-GAG matrix for skin repair in humans. Eur. Cytokine Netw. 2003, 14, 60–64. [Google Scholar]
  41. Wang, Z.; Gerstein, M.; Snyder, M. RNA-Seq: A revolutionary tool for transcriptomics. Nat. Rev. Genet. 2009, 10, 57–63. [Google Scholar] [CrossRef] [PubMed]
  42. Imani, A.; Panahipour, L.; Kuhtreiber, H.; Mildner, M.; Gruber, R. RNAseq of Gingival Fibroblasts Exposed to PRF Membrane Lysates and PRF Serum. Cells 2024, 13, 1308. [Google Scholar] [CrossRef] [PubMed]
  43. Martin, M. Cutadapt removes adapter sequences from high-throughput sequencing reads. EMBnet. J. 2011, 17, 10–12. [Google Scholar] [CrossRef]
  44. Dobin, A.; Davis, C.A.; Schlesinger, F.; Drenkow, J.; Zaleski, C.; Jha, S.; Batut, P.; Chaisson, M.; Gingeras, T.R. STAR: Ultrafast universal RNA-seq aligner. Bioinformatics 2013, 29, 15–21. [Google Scholar] [CrossRef]
  45. Love, M.I.; Huber, W.; Anders, S. Moderated estimation of fold change and dispersion for RNA-seq data with DESeq2. Genome Biol. 2014, 15, 550. [Google Scholar] [CrossRef]
  46. Gerst, R.; Hölzer, M. PCAGO: An interactive tool to analyze RNA-Seq data with principal component analysis. bioRxiv 2019, 1–4. [Google Scholar] [CrossRef]
  47. Goedhart, J.; Luijsterburg, M.S. VolcaNoseR is a web app for creating, exploring, labeling and sharing volcano plots. Sci. Rep. 2020, 10, 20560. [Google Scholar] [CrossRef]
  48. Kolberg, L.; Raudvere, U.; Kuzmin, I.; Adler, P.; Vilo, J.; Peterson, H. g:Profiler-interoperable web service for functional enrichment analysis and gene identifier mapping (2023 update). Nucleic Acids Res. 2023, 51, W207–W212. [Google Scholar] [CrossRef]
  49. Dudakovic, A.; Camilleri, E.T.; Xu, F.; Riester, S.M.; McGee-Lawrence, M.E.; Bradley, E.W.; Paradise, C.R.; Lewallen, E.A.; Thaler, R.; Deyle, D.R.; et al. Epigenetic Control of Skeletal Development by the Histone Methyltransferase Ezh2. J. Biol. Chem. 2015, 290, 27604–27617. [Google Scholar] [CrossRef]
  50. Luo, Q.; Liu, Y.; Shi, K.; Shen, X.; Yang, Y.; Liang, X.; Lu, L.; Qiao, W.; Chen, A.; Hong, D.; et al. An autonomous activation of interleukin-17 receptor signaling sustains inflammation and promotes disease progression. Immunity 2023, 56, 2006–2020.e2006. [Google Scholar] [CrossRef]
  51. Kong, W.; Zhao, G.; Chen, H.; Wang, W.; Shang, X.; Sun, Q.; Guo, F.; Ma, X. Analysis of therapeutic targets and prognostic biomarkers of CXC chemokines in cervical cancer microenvironment. Cancer Cell Int. 2021, 21, 399. [Google Scholar] [CrossRef]
  52. Wiley, C.D.; Velarde, M.C.; Lecot, P.; Liu, S.; Sarnoski, E.A.; Freund, A.; Shirakawa, K.; Lim, H.W.; Davis, S.S.; Ramanathan, A.; et al. Mitochondrial Dysfunction Induces Senescence with a Distinct Secretory Phenotype. Cell Metab. 2016, 23, 303–314. [Google Scholar] [CrossRef]
  53. Wang, Z.; Zhou, Z.; Zhang, Y.; Zuo, F.; Du, J.; Wang, M.; Hu, M.; Sun, Y.; Wang, X.; Liu, M.; et al. Diacylglycerol kinase epsilon protects against renal ischemia/reperfusion injury in mice through Kruppel-like factor 15/klotho pathway. Ren. Fail. 2022, 44, 902–913. [Google Scholar] [CrossRef] [PubMed]
  54. Kosinsky, R.L.; Gonzalez, M.M.; Saul, D.; Barros, L.L.; Sagstetter, M.R.; Fedyshyn, Y.; Nair, A.; Sun, Z.; Hamdan, F.H.; Gibbons, H.R.; et al. The FOXP3(+) Pro-Inflammatory T Cell: A Potential Therapeutic Target in Crohn’s Disease. Gastroenterology 2024, 166, 631–644. [Google Scholar] [CrossRef] [PubMed]
  55. Lu, M.; Li, J.; Luo, Z.; Zhang, S.; Xue, S.; Wang, K.; Shi, Y.; Zhang, C.; Chen, H.; Li, Z. Roles of dopamine receptors and their antagonist thioridazine in hepatoma metastasis. Onco Targets Ther. 2015, 8, 1543–1552. [Google Scholar] [CrossRef] [PubMed]
  56. Arenas-Hernandez, M.; Vega-Sanchez, R. Housekeeping gene expression stability in reproductive tissues after mitogen stimulation. BMC Res. Notes 2013, 6, 285. [Google Scholar] [CrossRef]
  57. Hu, C.; Wang, S.; Wang, J.; Ruan, X.; Wu, L.; Zhang, Z.; Wang, X.; Zhang, J.; Liu, Y.; Li, Y.; et al. B7-H3 enhances colorectal cancer progression by regulating HB-EGF via HIF-1alpha. J. Gastrointest. Oncol. 2024, 15, 1035–1049. [Google Scholar] [CrossRef]
  58. Mao, P.; Wu, S.; Li, J.; Fu, W.; He, W.; Liu, X.; Slutsky, A.S.; Zhang, H.; Li, Y. Human alveolar epithelial type II cells in primary culture. Physiol. Rep. 2015, 3, e12288. [Google Scholar] [CrossRef]
  59. Li, C.; Park, S.; Zhang, X.; Dai, W.; Xu, D. Mutual regulation between Polo-like kinase 3 and SIAH2 E3 ubiquitin ligase defines a regulatory network that fine-tunes the cellular response to hypoxia and nickel. J. Biol. Chem. 2017, 292, 11431–11444. [Google Scholar] [CrossRef]
  60. Lan, J.; Deng, Z.; Wang, Q.; Li, D.; Fan, K.; Chang, J.; Ma, Y. Neuropeptide substance P attenuates colitis by suppressing inflammation and ferroptosis via the cGAS-STING signaling pathway. Int. J. Biol. Sci. 2024, 20, 2507–2531. [Google Scholar] [CrossRef]
  61. Thiecke, M.J.; Wutz, G.; Muhar, M.; Tang, W.; Bevan, S.; Malysheva, V.; Stocsits, R.; Neumann, T.; Zuber, J.; Fraser, P.; et al. Cohesin-Dependent and -Independent Mechanisms Mediate Chromosomal Contacts between Promoters and Enhancers. Cell Rep. 2020, 32, 107929. [Google Scholar] [CrossRef] [PubMed]
  62. Ang, Z.; Er, J.Z.; Tan, N.S.; Lu, J.; Liou, Y.C.; Grosse, J.; Ding, J.L. Human and mouse monocytes display distinct signalling and cytokine profiles upon stimulation with FFAR2/FFAR3 short-chain fatty acid receptor agonists. Sci. Rep. 2016, 6, 34145. [Google Scholar] [CrossRef] [PubMed]
  63. Kozlowska, A.K.; Florczak, A.; Smialek, M.; Dondajewska, E.; Mackiewicz, A.; Kortylewski, M.; Dams-Kozlowska, H. Functionalized bioengineered spider silk spheres improve nuclease resistance and activity of oligonucleotide therapeutics providing a strategy for cancer treatment. Acta Biomater. 2017, 59, 221–233. [Google Scholar] [CrossRef]
  64. Amirrasouli, M.M.; Shamsara, M. Comparing the in vivo and in vitro effects of hypoxia (3% O2) on directly derived cells from murine cardiac explants versus murine cardiosphere derived cells. J. Stem Cells Regen. Med. 2017, 13, 35–44. [Google Scholar] [CrossRef]
  65. Blattler, A.; Yao, L.; Wang, Y.; Ye, Z.; Jin, V.X.; Farnham, P.J. ZBTB33 binds unmethylated regions of the genome associated with actively expressed genes. Epigenetics Chromatin 2013, 6, 13. [Google Scholar] [CrossRef]
  66. Feng, S.; Zhu, X.; Fan, B.; Xie, D.; Li, T.; Zhang, X. miR-19a-3p targets PMEPA1 and induces prostate cancer cell proliferation, migration and invasion. Mol. Med. Rep. 2016, 13, 4030–4038. [Google Scholar] [CrossRef]
  67. David-Raoudi, M.; Tranchepain, F.; Deschrevel, B.; Vincent, J.C.; Bogdanowicz, P.; Boumediene, K.; Pujol, J.P. Differential effects of hyaluronan and its fragments on fibroblasts: Relation to wound healing. Wound Repair. Regen. 2008, 16, 274–287. [Google Scholar] [CrossRef]
  68. Olsson, M.; Bremer, L.; Aulin, C.; Harris, H.E. Fragmented hyaluronan has no alarmin function assessed in arthritis synovial fibroblast and chondrocyte cultures. Innate Immun. 2018, 24, 131–141. [Google Scholar] [CrossRef]
  69. Williams, D.W.; Greenwell-Wild, T.; Brenchley, L.; Dutzan, N.; Overmiller, A.; Sawaya, A.P.; Webb, S.; Martin, D.; Genomics, N.N.; Computational Biology, C.; et al. Human oral mucosa cell atlas reveals a stromal-neutrophil axis regulating tissue immunity. Cell 2021, 184, 4090–4104.e4015. [Google Scholar] [CrossRef]
  70. Li, J.; Ye, L.J.; Dai, Y.W.; Wang, H.W.; Gao, J.; Shen, Y.H.; Wang, F.; Dai, Q.G.; Wu, Y.Q. Single-cell analysis reveals a unique microenvironment in peri-implantitis. J. Clin. Periodontol. 2024, 51, 1665–1676. [Google Scholar] [CrossRef]
  71. Mo, J.J.; Lai, Y.R.; Huang, Q.R.; Li, Y.R.; Zhang, Y.J.; Chen, R.Y.; Qian, S.J. Single-cell sequencing identifies inflammation-promoting fibroblast-neutrophil interaction in peri-implantitis. J. Clin. Periodontol. 2024, 51, 196–208. [Google Scholar] [CrossRef] [PubMed]
  72. Cozza, G.; Salvi, M. The Acidophilic Kinases PLK2 and PLK3: Structure, Substrate Targeting and Inhibition. Curr. Protein Pept. Sci. 2018, 19, 728–745. [Google Scholar] [CrossRef] [PubMed]
  73. Uebanso, T.; Fukui, M.; Naito, C.; Shimohata, T.; Mawatari, K.; Takahashi, A. SLC16a6, mTORC1, and Autophagy Regulate Ketone Body Excretion in the Intestinal Cells. Biology 2023, 12, 1467. [Google Scholar] [CrossRef]
  74. Felmlee, M.A.; Jones, R.S.; Rodriguez-Cruz, V.; Follman, K.E.; Morris, M.E. Monocarboxylate Transporters (SLC16): Function, Regulation, and Role in Health and Disease. Pharmacol. Rev. 2020, 72, 466–485. [Google Scholar] [CrossRef]
  75. Almubarak, A.; Zhang, Q.; Zhang, C.H.; Abdelwahab, N.; Kume, T.; Lassar, A.B.; Berry, F.B. FOXC1 and FOXC2 regulate growth plate chondrocyte maturation towards hypertrophy in the embryonic mouse limb skeleton. Development 2024, 151, dev202798. [Google Scholar] [CrossRef]
  76. Li, P.; Deng, Q.; Liu, J.; Yan, J.; Wei, Z.; Zhang, Z.; Liu, H.; Li, B. Roles for HB-EGF in Mesenchymal Stromal Cell Proliferation and Differentiation During Skeletal Growth. J. Bone Miner. Res. 2019, 34, 295–309. [Google Scholar] [CrossRef]
  77. Zhu, J.; Chaki, M.; Lu, D.; Ren, C.; Wang, S.S.; Rauhauser, A.; Li, B.; Zimmerman, S.; Jun, B.; Du, Y.; et al. Loss of diacylglycerol kinase epsilon in mice causes endothelial distress and impairs glomerular Cox-2 and PGE2 production. Am. J. Physiol. Renal Physiol. 2016, 310, F895–F908. [Google Scholar] [CrossRef]
  78. Liu, D.; Ding, Q.; Dai, D.F.; Padhy, B.; Nayak, M.K.; Li, C.; Purvis, M.; Jin, H.; Shu, C.; Chauhan, A.K.; et al. Loss of diacylglycerol kinase epsilon causes thrombotic microangiopathy by impairing endothelial VEGFA signaling. JCI Insight 2021, 6, e146959. [Google Scholar] [CrossRef]
  79. Ito, T.; Young, M.J.; Li, R.; Jain, S.; Wernitznig, A.; Krill-Burger, J.M.; Lemke, C.T.; Monducci, D.; Rodriguez, D.J.; Chang, L.; et al. Paralog knockout profiling identifies DUSP4 and DUSP6 as a digenic dependence in MAPK pathway-driven cancers. Nat. Genet. 2021, 53, 1664–1672. [Google Scholar] [CrossRef]
  80. Lloyd, J.T.; Glass, K.C. Biological function and histone recognition of family IV bromodomain-containing proteins. J. Cell Physiol. 2018, 233, 1877–1886. [Google Scholar] [CrossRef]
  81. Oh, J.E.; Kim, H.J.; Kim, W.S.; Lee, Z.H.; Ryoo, H.M.; Hwang, S.J.; Lee, Y.; Kim, H.H. PlexinA2 mediates osteoblast differentiation via regulation of Runx2. J. Bone Miner. Res. 2012, 27, 552–562. [Google Scholar] [CrossRef] [PubMed]
  82. Robertson, G.; Xie, C.; Chen, D.; Awad, H.; Schwarz, E.M.; O’Keefe, R.J.; Guldberg, R.E.; Zhang, X. Alteration of femoral bone morphology and density in COX-2−/− mice. Bone 2006, 39, 767–772. [Google Scholar] [CrossRef] [PubMed]
  83. Simon, A.M.; Manigrasso, M.B.; O’Connor, J.P. Cyclo-oxygenase 2 function is essential for bone fracture healing. J. Bone Miner. Res. 2002, 17, 963–976. [Google Scholar] [CrossRef] [PubMed]
  84. Luo, N.; Knudson, W.; Askew, E.B.; Veluci, R.; Knudson, C.B. CD44 and hyaluronan promote the bone morphogenetic protein 7 signaling response in murine chondrocytes. Arthritis Rheumatol. 2014, 66, 1547–1558. [Google Scholar] [CrossRef]
  85. Nedvetzki, S.; Gonen, E.; Assayag, N.; Reich, R.; Williams, R.O.; Thurmond, R.L.; Huang, J.F.; Neudecker, B.A.; Wang, F.S.; Turley, E.A.; et al. RHAMM, a receptor for hyaluronan-mediated motility, compensates for CD44 in inflamed CD44-knockout mice: A different interpretation of redundancy. Proc. Natl. Acad. Sci. USA 2004, 101, 18081–18086. [Google Scholar] [CrossRef]
  86. Snetkov, P.; Zakharova, K.; Morozkina, S.; Olekhnovich, R.; Uspenskaya, M. Hyaluronic Acid: The Influence of Molecular Weight on Structural, Physical, Physico-Chemical, and Degradable Properties of Biopolymer. Polymers 2020, 12, 1800. [Google Scholar] [CrossRef]
  87. Stern, R.; Asari, A.A.; Sugahara, K.N. Hyaluronan fragments: An information-rich system. Eur. J. Cell Biol. 2006, 85, 699–715. [Google Scholar] [CrossRef]
  88. Krejcova, D.; Pekarova, M.; Safrankova, B.; Kubala, L. The effect of different molecular weight hyaluronan on macrophage physiology. Neuro Endocrinol. Lett. 2009, 30 (Suppl. S1), 106–111. [Google Scholar]
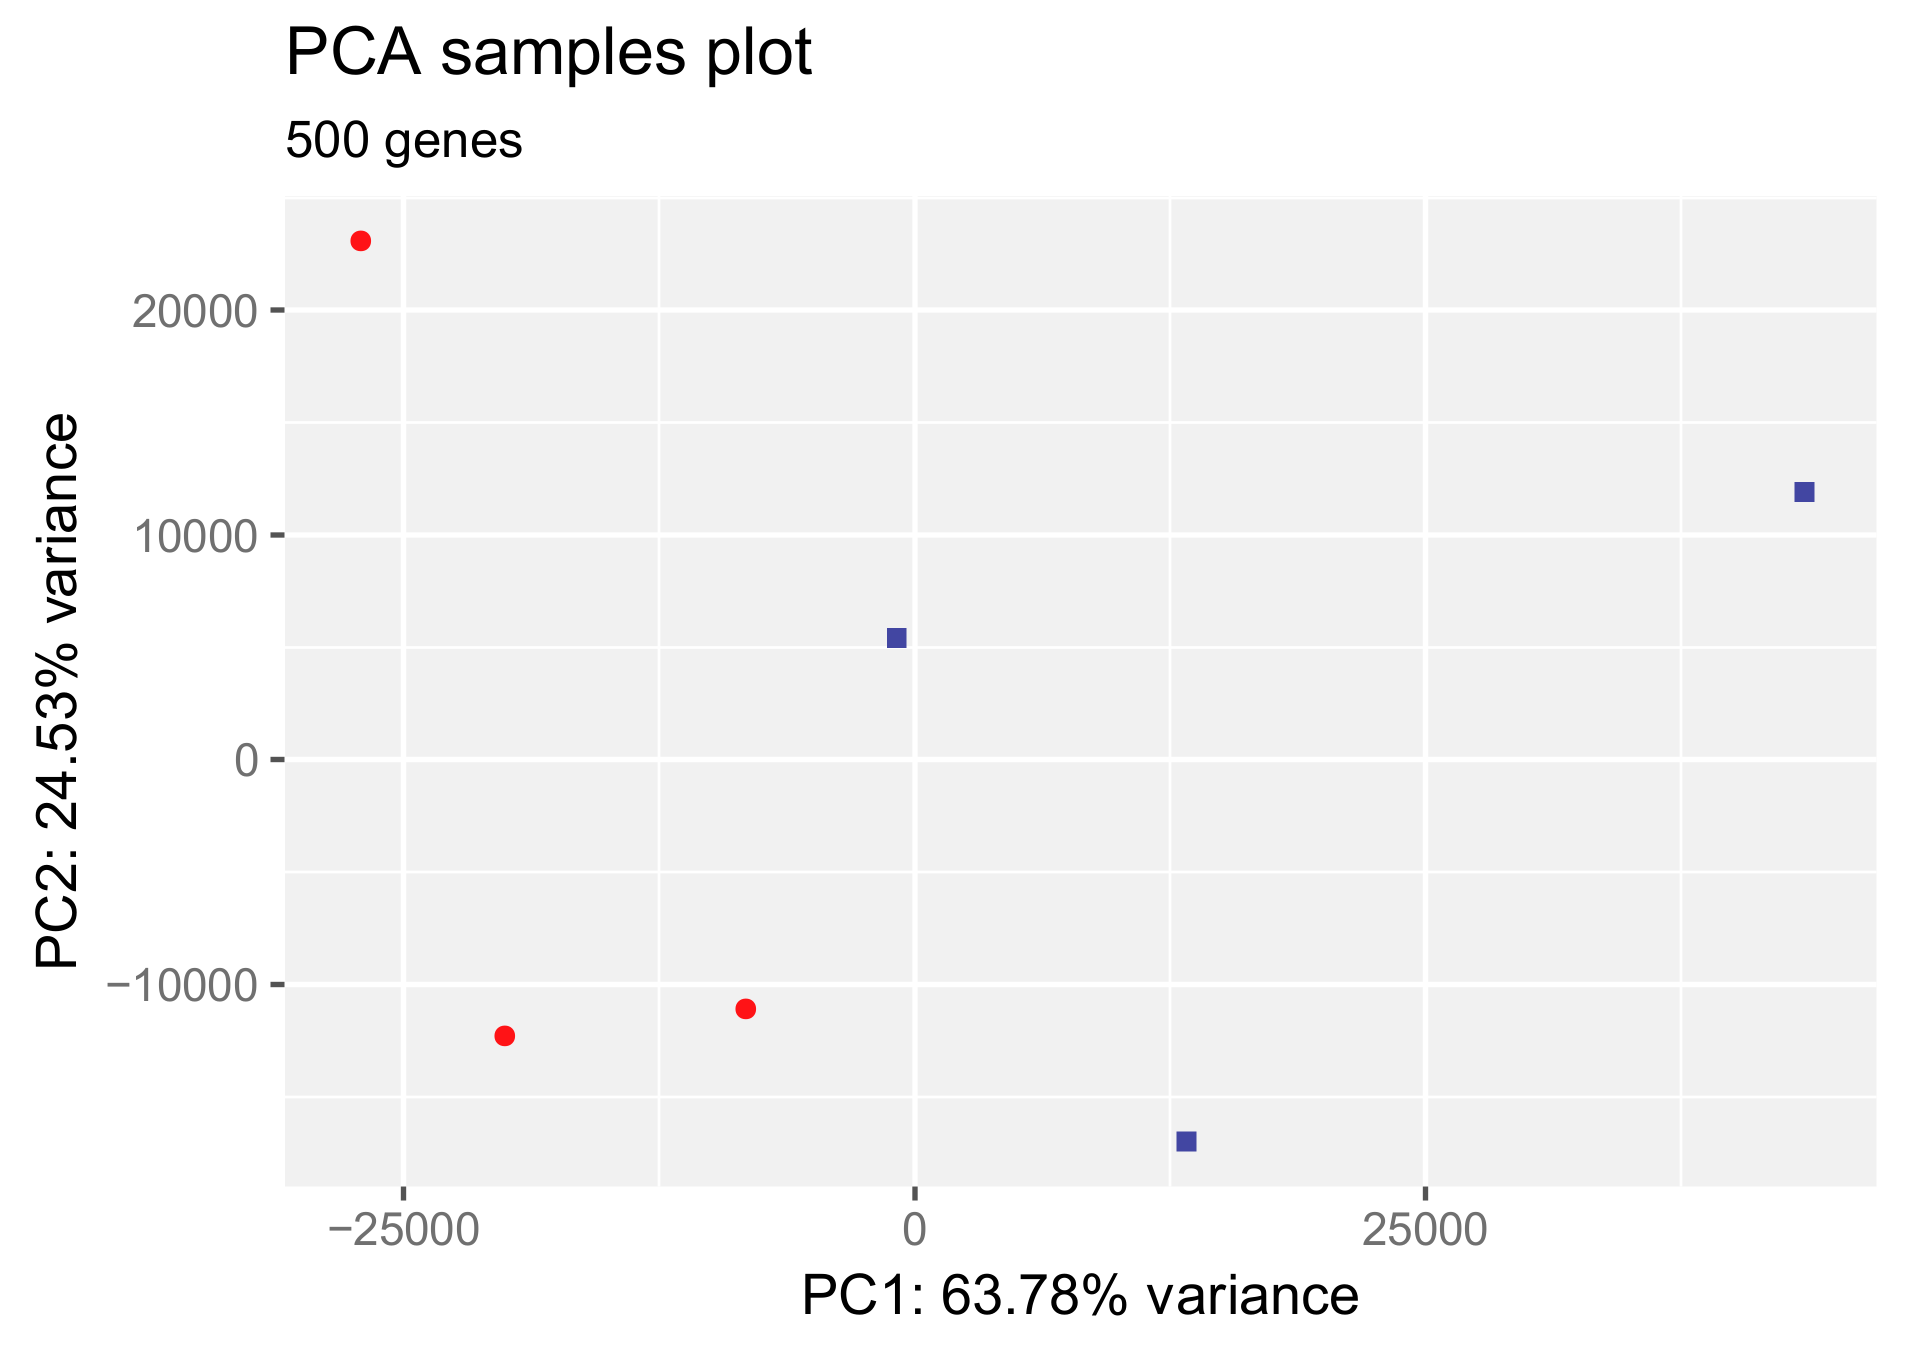
Figure 1. Principal component analysis for differentially expressed genes in gingival fibroblasts treated with HAc. The plot shows the projection of the top 500 genes onto the two-dimensional space spanned by the first and second principal components (PC1, PC2). The expression levels used as input are raw gene counts. Red is control, blue is HAc.
Bioengineering 11 01307 g001
Figure 2. Volcano plot analysis of differentially expressed genes in gingival fibroblasts treated with HAc. Volcano plot analysis identified upregulated (red) and downregulated (blue) genes in gingival fibroblasts treated with HAc. The annotated dots are data points with the largest (Manhattan) distance from the origin and are above the thresholds indicated by the dashed line. (A) The threshold was set to at least a 4.0-fold change and a significance level of p = 0.1. (B) Volcano plot of the top 50 genes with no statistical threshold.
Bioengineering 11 01307 g002
Figure 3. RT-PCR analysis of differentially expressed genes in gingival fibroblasts treated with HAc. Gingival fibroblasts were seeded onto a tissue culture-treated surface and, the following day, exposed to 3.6 mg/mL of HAc cross-linked and 0.4 mg/mL of HAc with sodium chloride for 6 h in serum-free DMEM followed by RT-PCR analysis. Gene expression changes were calculated by the ΔΔCT method, and findings are expressed as the x-fold increase compared to unstimulated cells, which have an expression level of 1. Statistics are based on a ratio-paired t-test, and data points represent independent experiments.
Bioengineering 11 01307 g003
Figure 4. RT-PCR and ELISA analysis of inflammatory genes in gingival fibroblasts treated with HAc. Gingival fibroblasts were seeded onto a tissue culture-treated surface and, the following day, exposed to 3.6 mg/mL of HAc cross-linked and 0.4 mg/mL of HAc or IL1β and TNFα at 10 ng/mL for 6 h in serum-free DMEM followed by RT-PCR analysis. Gene expression changes were calculated by the ΔΔCT method, and findings are expressed as an x-fold increase compared to unstimulated cells, which have an expression level of 1. Statistics are based on a ratio-paired t-test. Data points represent independent experiments.
Bioengineering 11 01307 g004
Figure 5. RT-PCR and ELISA analysis of inflammatory genes in primary murine macrophages treated with HAc. Murine bone marrow-derived macrophages were exposed to 3.6 mg/mL of cross-linked HAc and 0.4 mg/mL of HAc or LPS from E. coli at 100 ng/mL for 6 h in serum-free DMEM followed by RT-PCR analysis. Gene expression changes were calculated by the ΔΔCT method, and findings are expressed as an x-fold increase compared to unstimulated cells, which have an expression level of 1. Statistics is based on a ratio-paired t-test. Data points represent four independent experiments.
Bioengineering 11 01307 g005
Figure 6. Heat map of differentially expressed genes in gingival fibroblasts treated with HAc. The heat map is used to visualize the differentially expressed genes in untreated fibroblasts versus the fibroblasts exposed to HAc. The data set used was the differentially expressed genes with an adjusted p-value of p < 0.05. This heatmap integrates the data from the three different fibroblast preparations. Turning from red to blue represents downregulated genes, and from blue to red represents upregulated genes. The color intensity reflects the expression levels of the raw data.
Bioengineering 11 01307 g006
Figure 7. STRING analysis of expression changes by HAc. Protein–protein association network and functional enrichment analyses of the 24 genes with a differential expression in gingival fibroblasts exposed to HAc. We identified three clusters of genes.
Bioengineering 11 01307 g007
Figure 8. g:Profiler analysis of differentially expressed genes in gingival fibroblasts treated with HAc. Enrichment analysis was performed using the g:Profiler online tool based on the selected 24 genes. Selected top significant pathways were highlighted and labeled numerically. Using the Benjamini–Hochberg method, the p-value was adjusted (Padj) for multiple tests.
Bioengineering 11 01307 g008
Disclaimer/Publisher’s Note: The statements, opinions and data contained in all publications are solely those of the individual author(s) and contributor(s) and not of MDPI and/or the editor(s). MDPI and/or the editor(s) disclaim responsibility for any injury to people or property resulting from any ideas, methods, instructions or products referred to in the content.