
A Comprehensive Investigation on Catalytic Behavior of Anaerobic Jar Gassing Systems and Design of an Enhanced Cultivation System


Abstract
:1. Introduction
2. Cultivation of Anaerobes
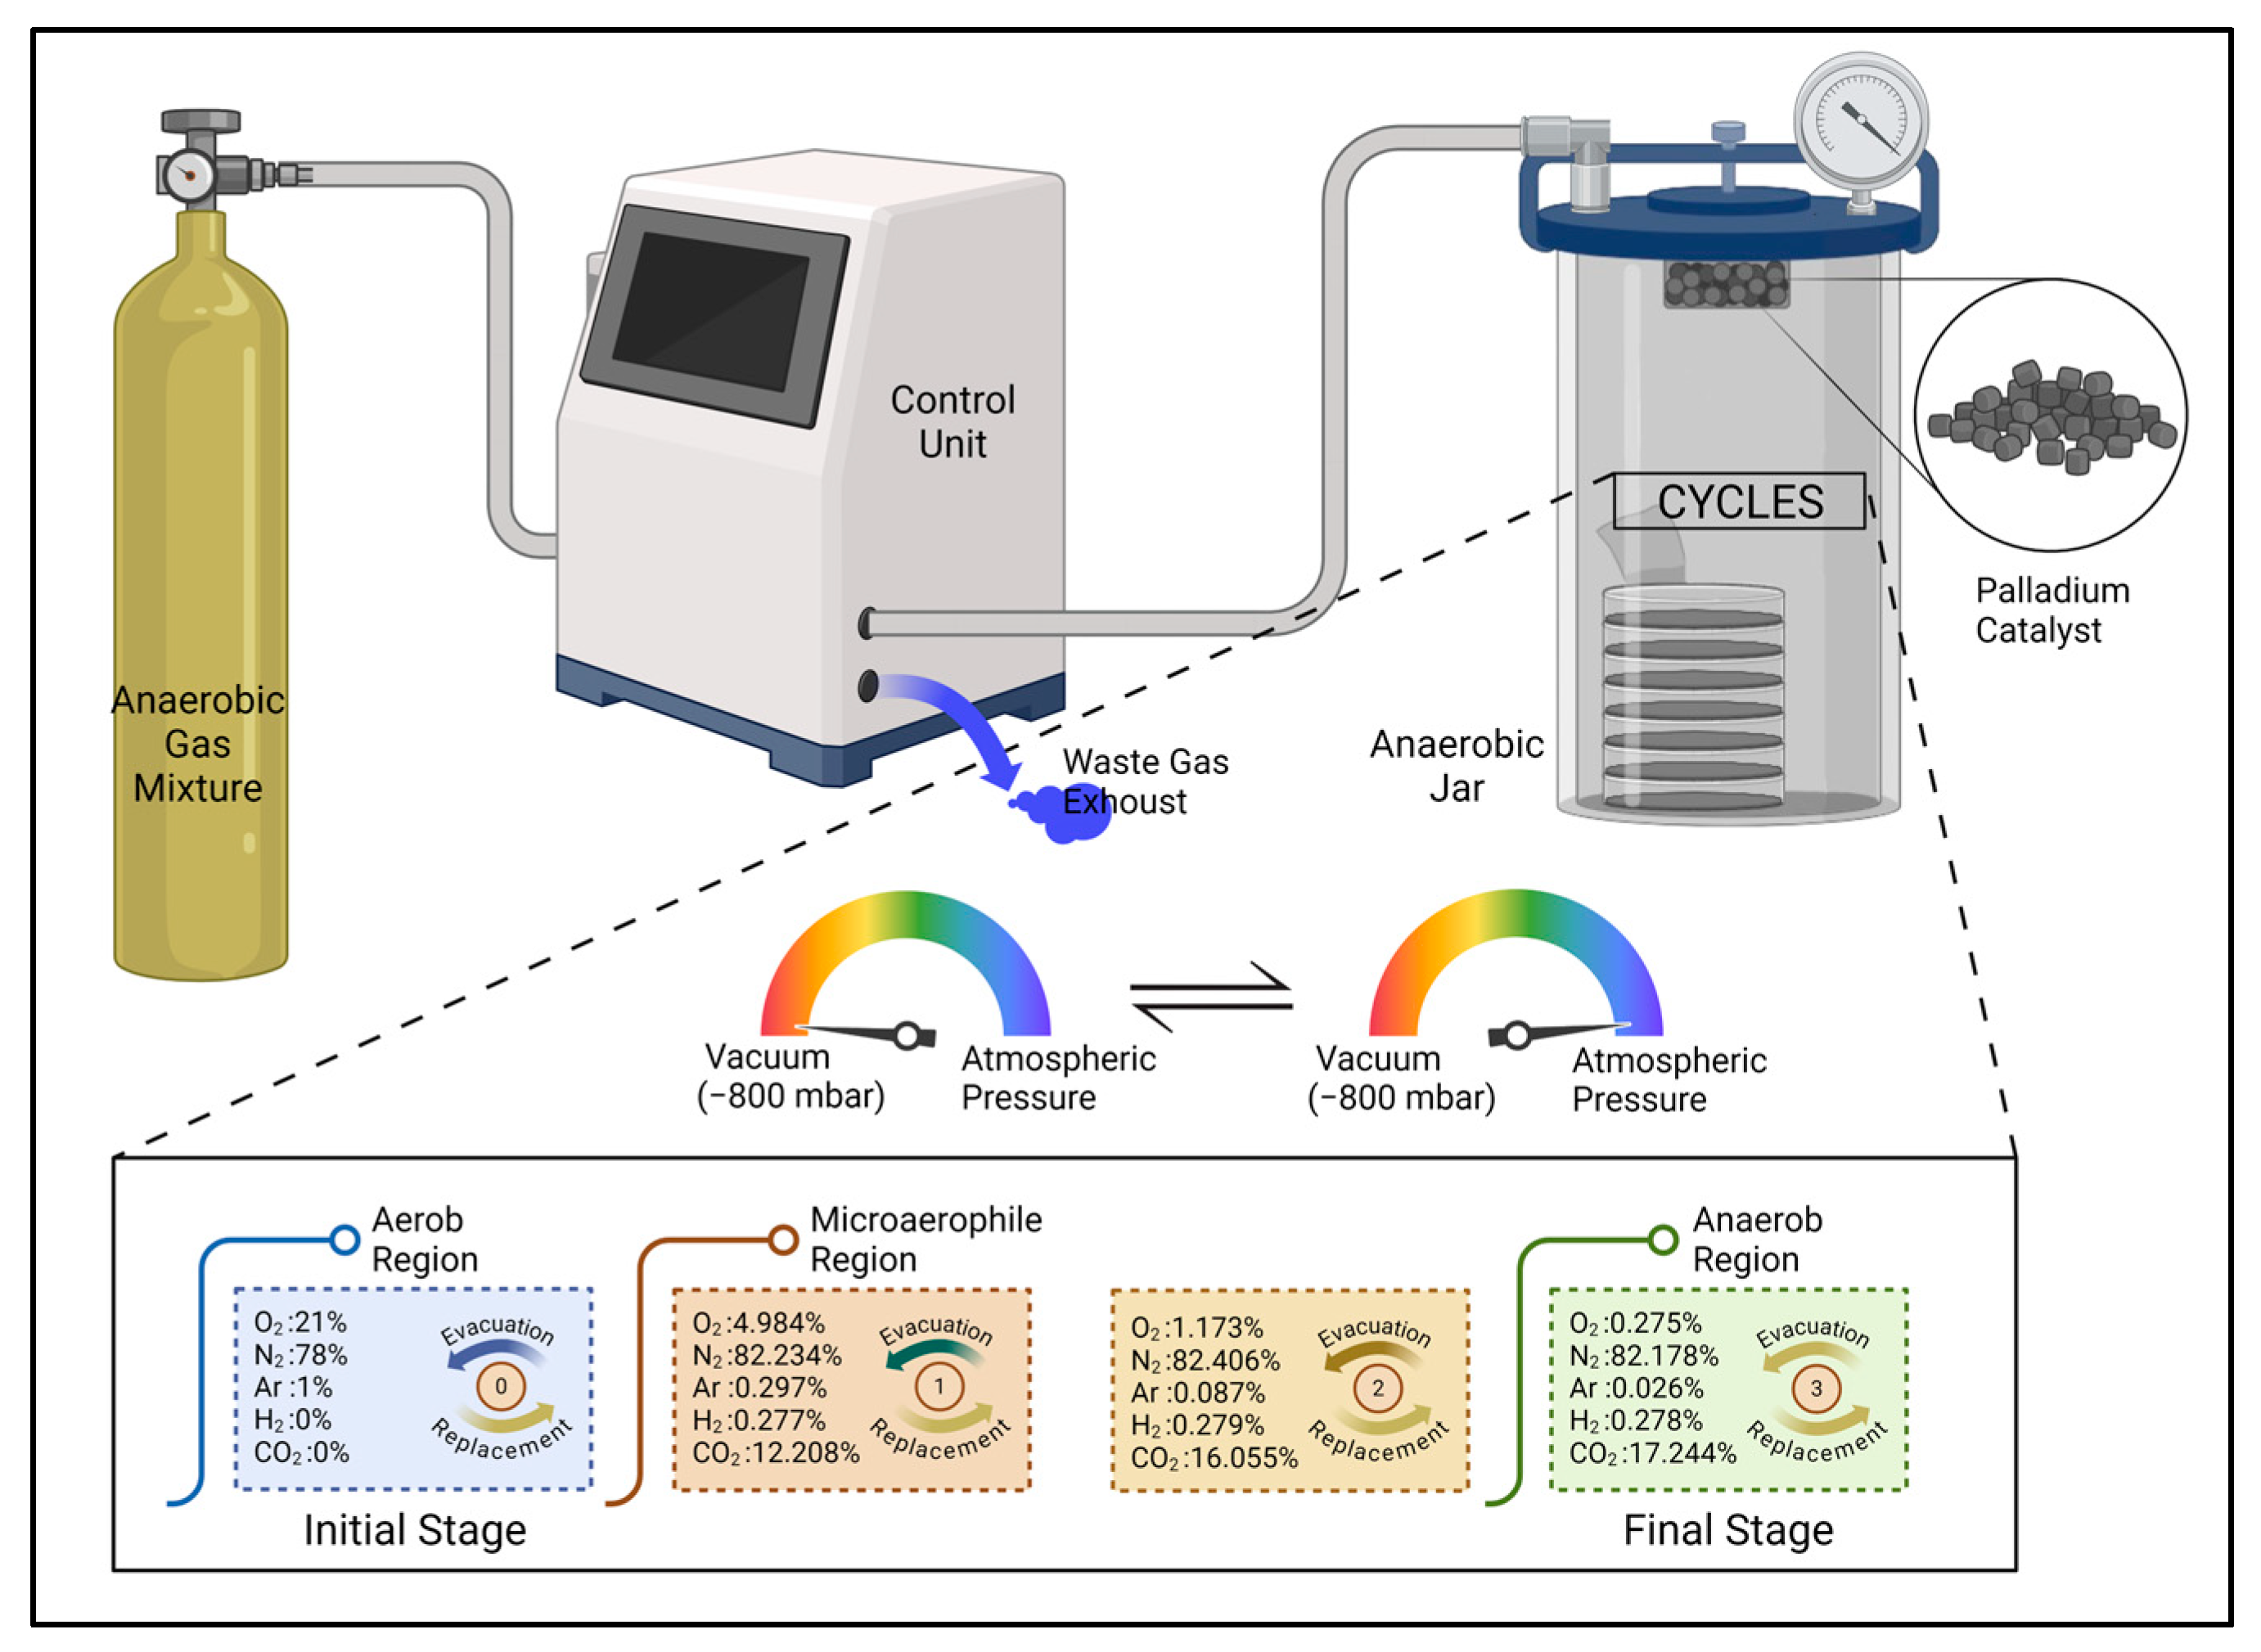
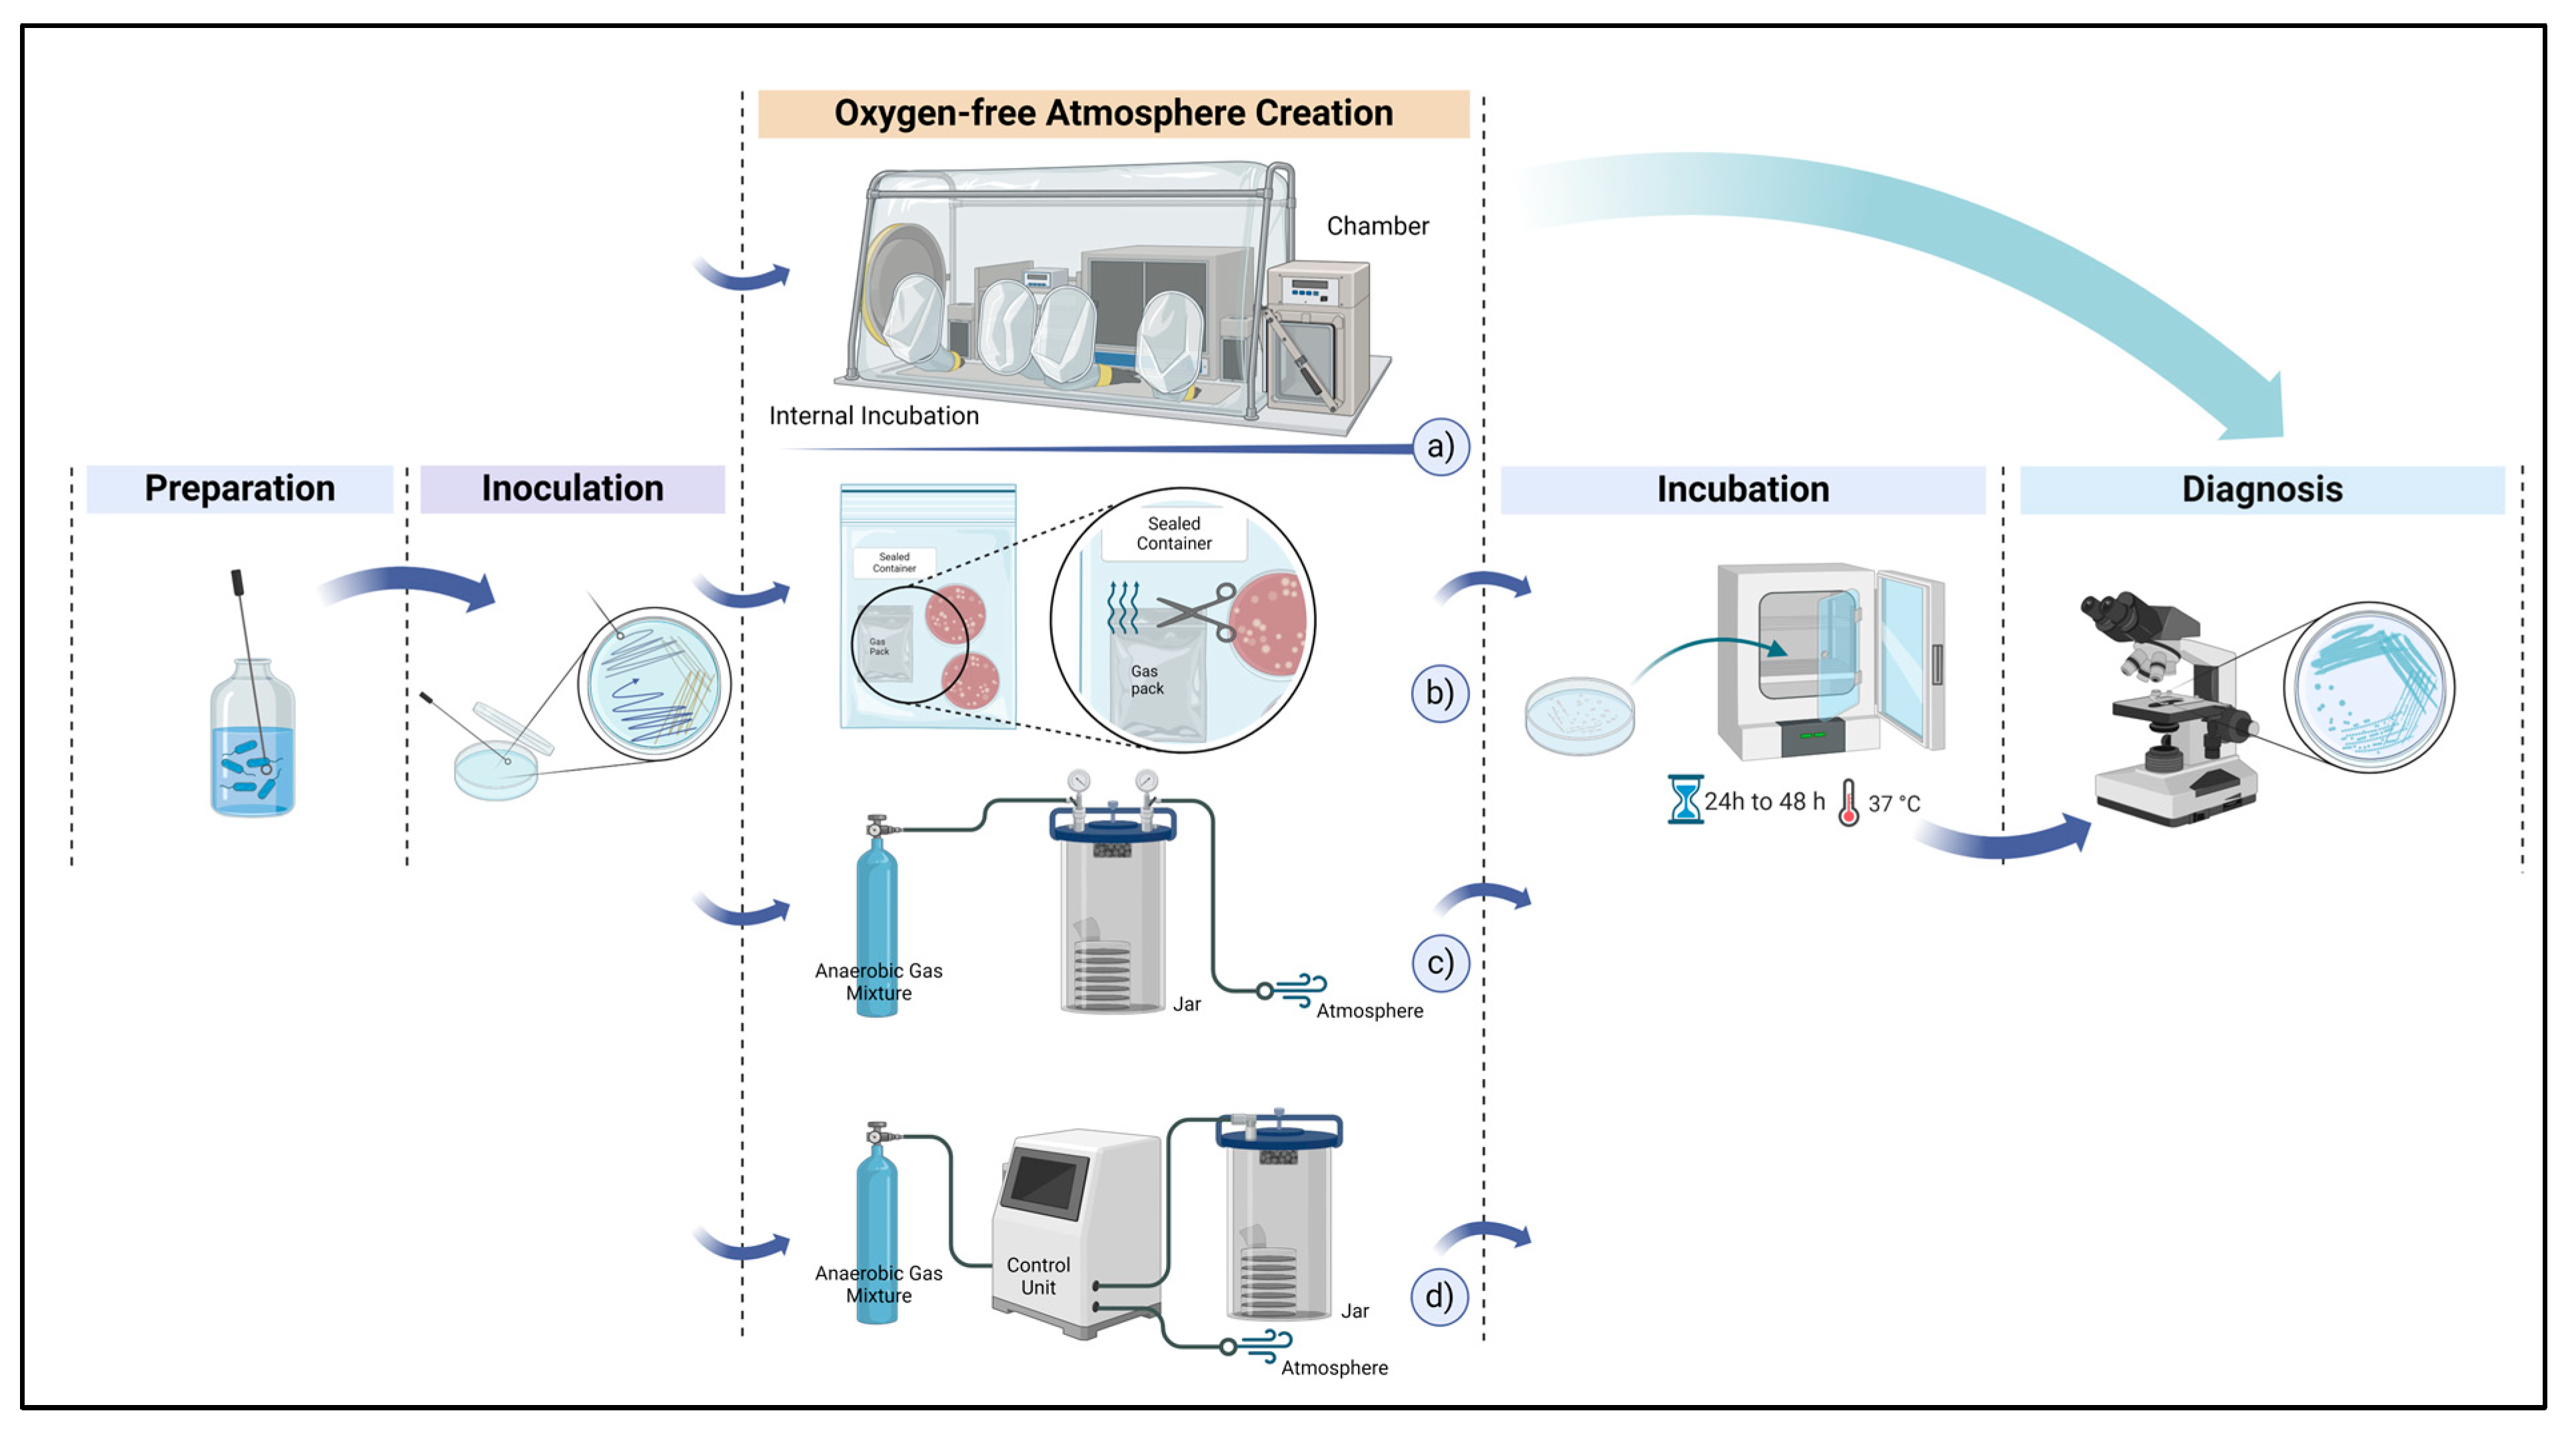
McIntosh and Fildes (Evacuation–Replacement) Method
3. Materials and Methods
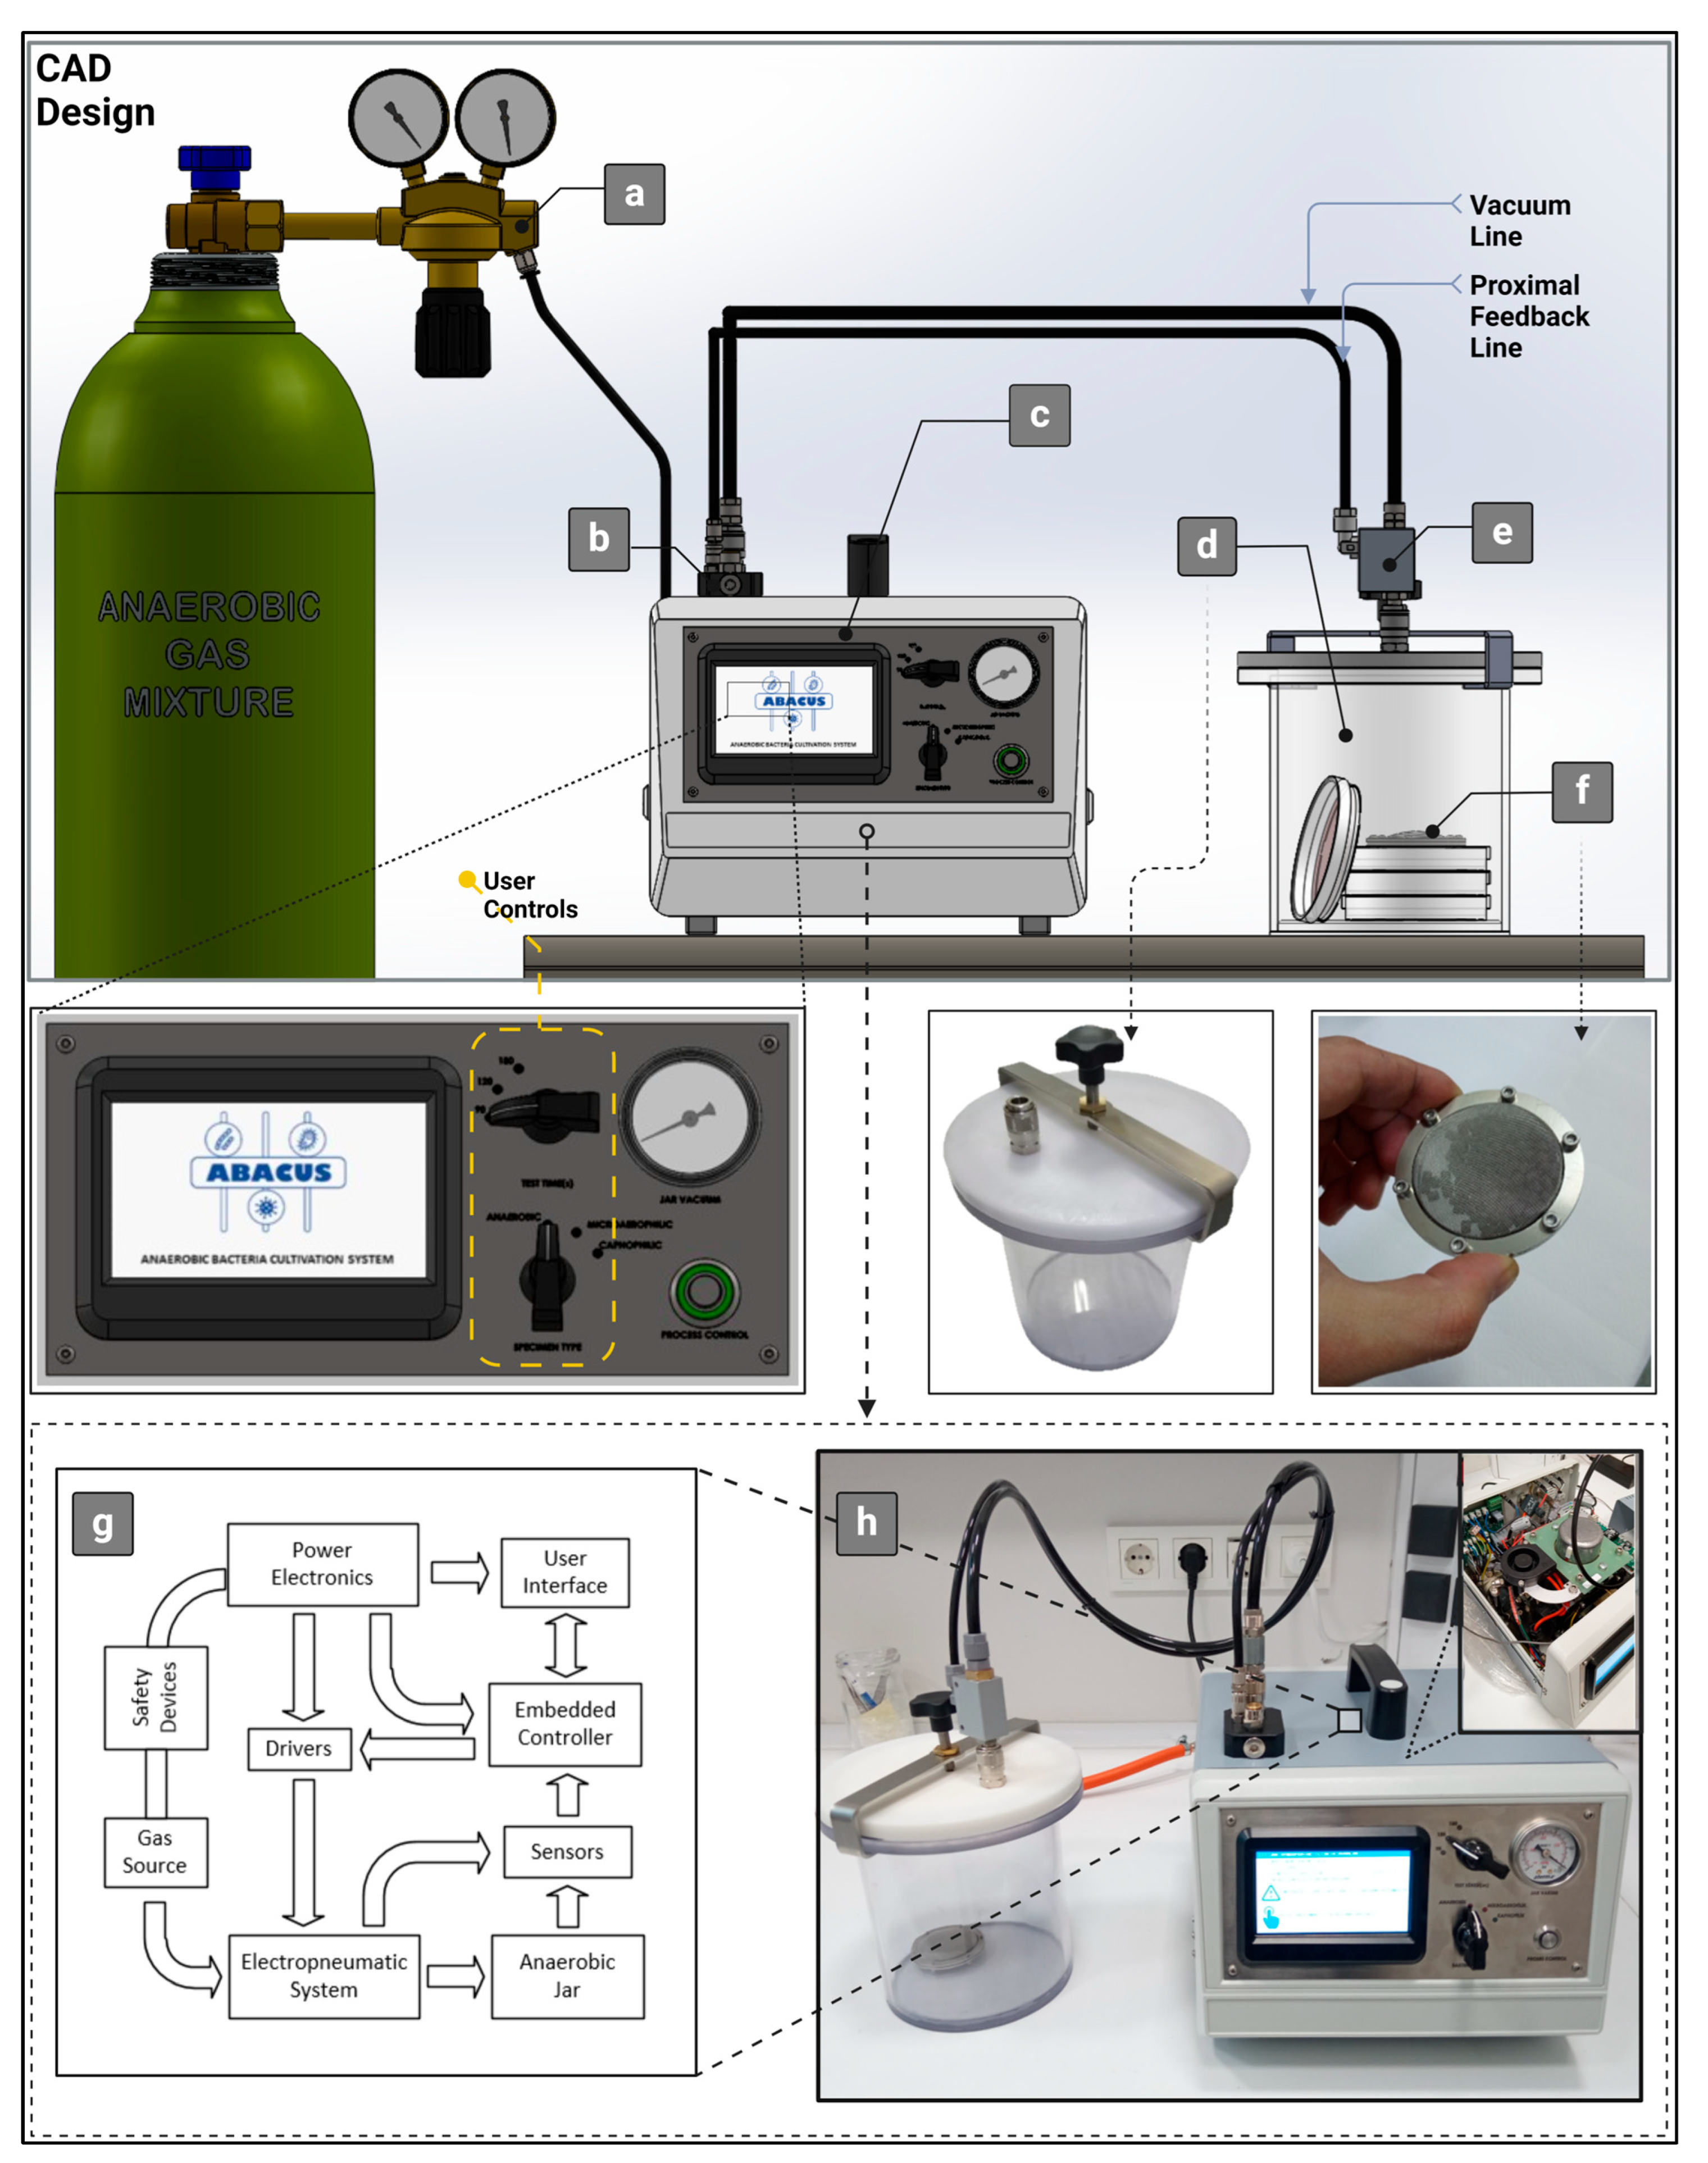
3.1. Automatic Jar Gassing System Design and Fabrication
3.1.1. Hardware and Software Design
3.1.2. Clinical Validation of Basic System Features
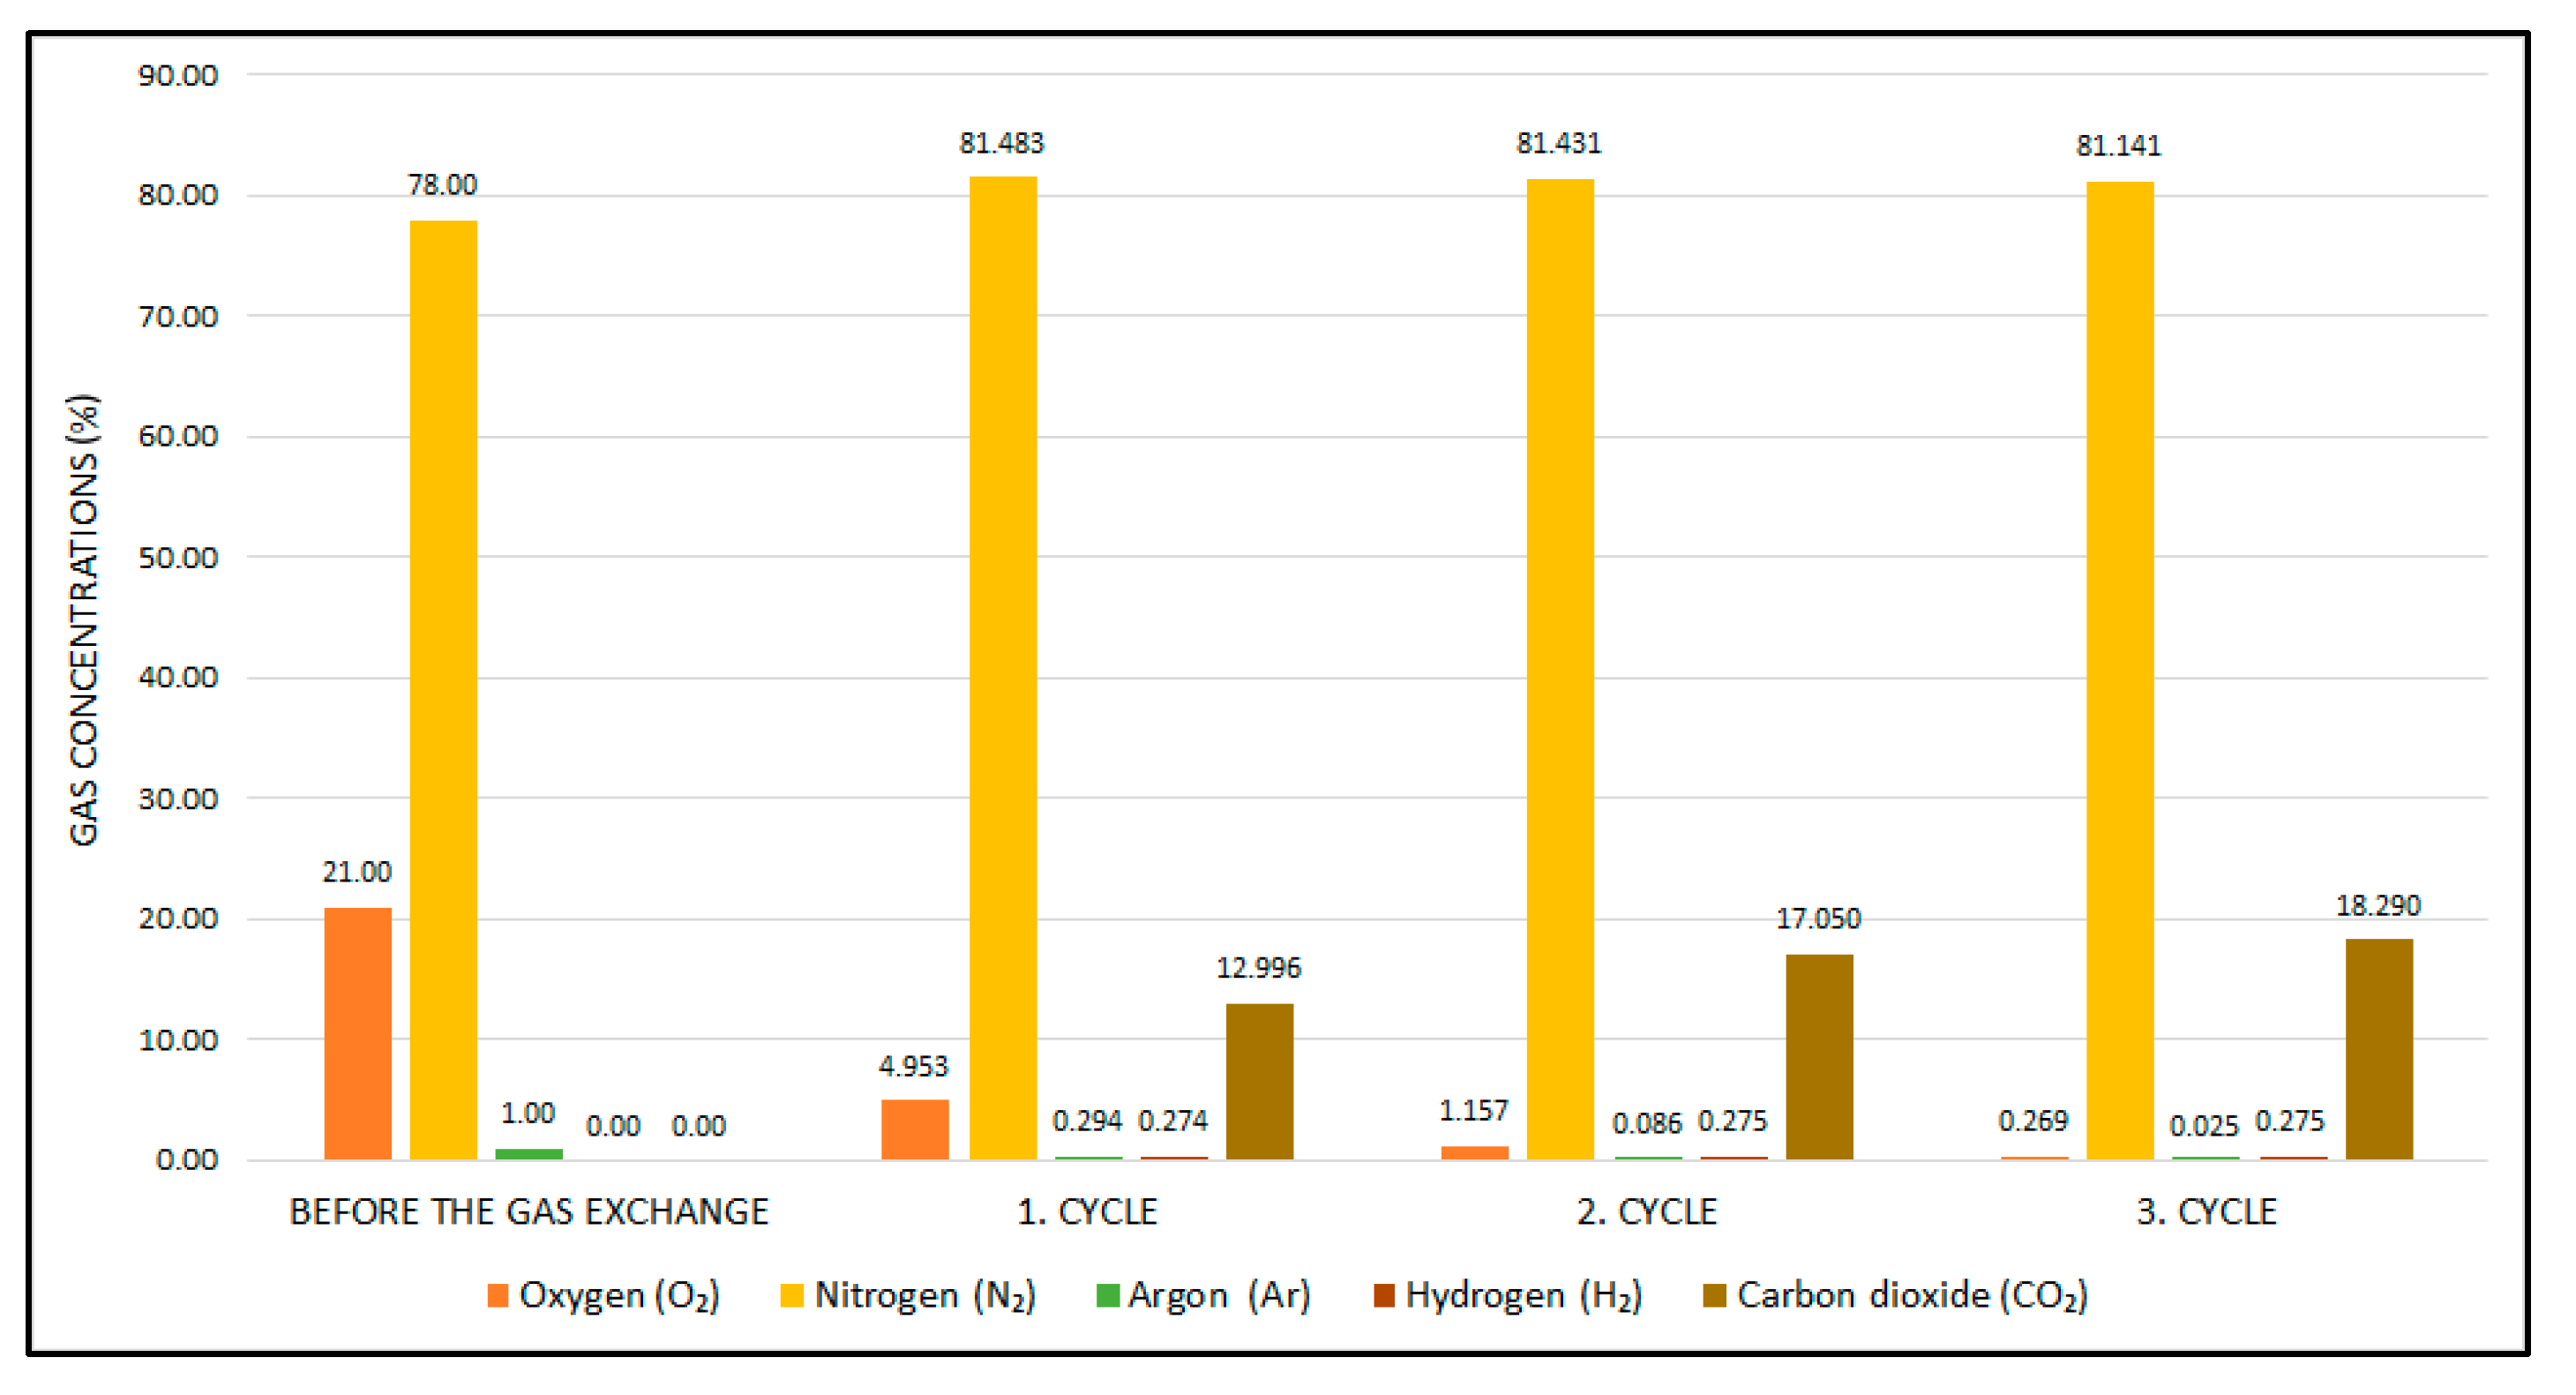
3.1.3. Gas Exchange Model of the Anaerobic Jar Atmosphere
3.2. Microkinetic Modeling of Pd/Al2O3 Catalyst
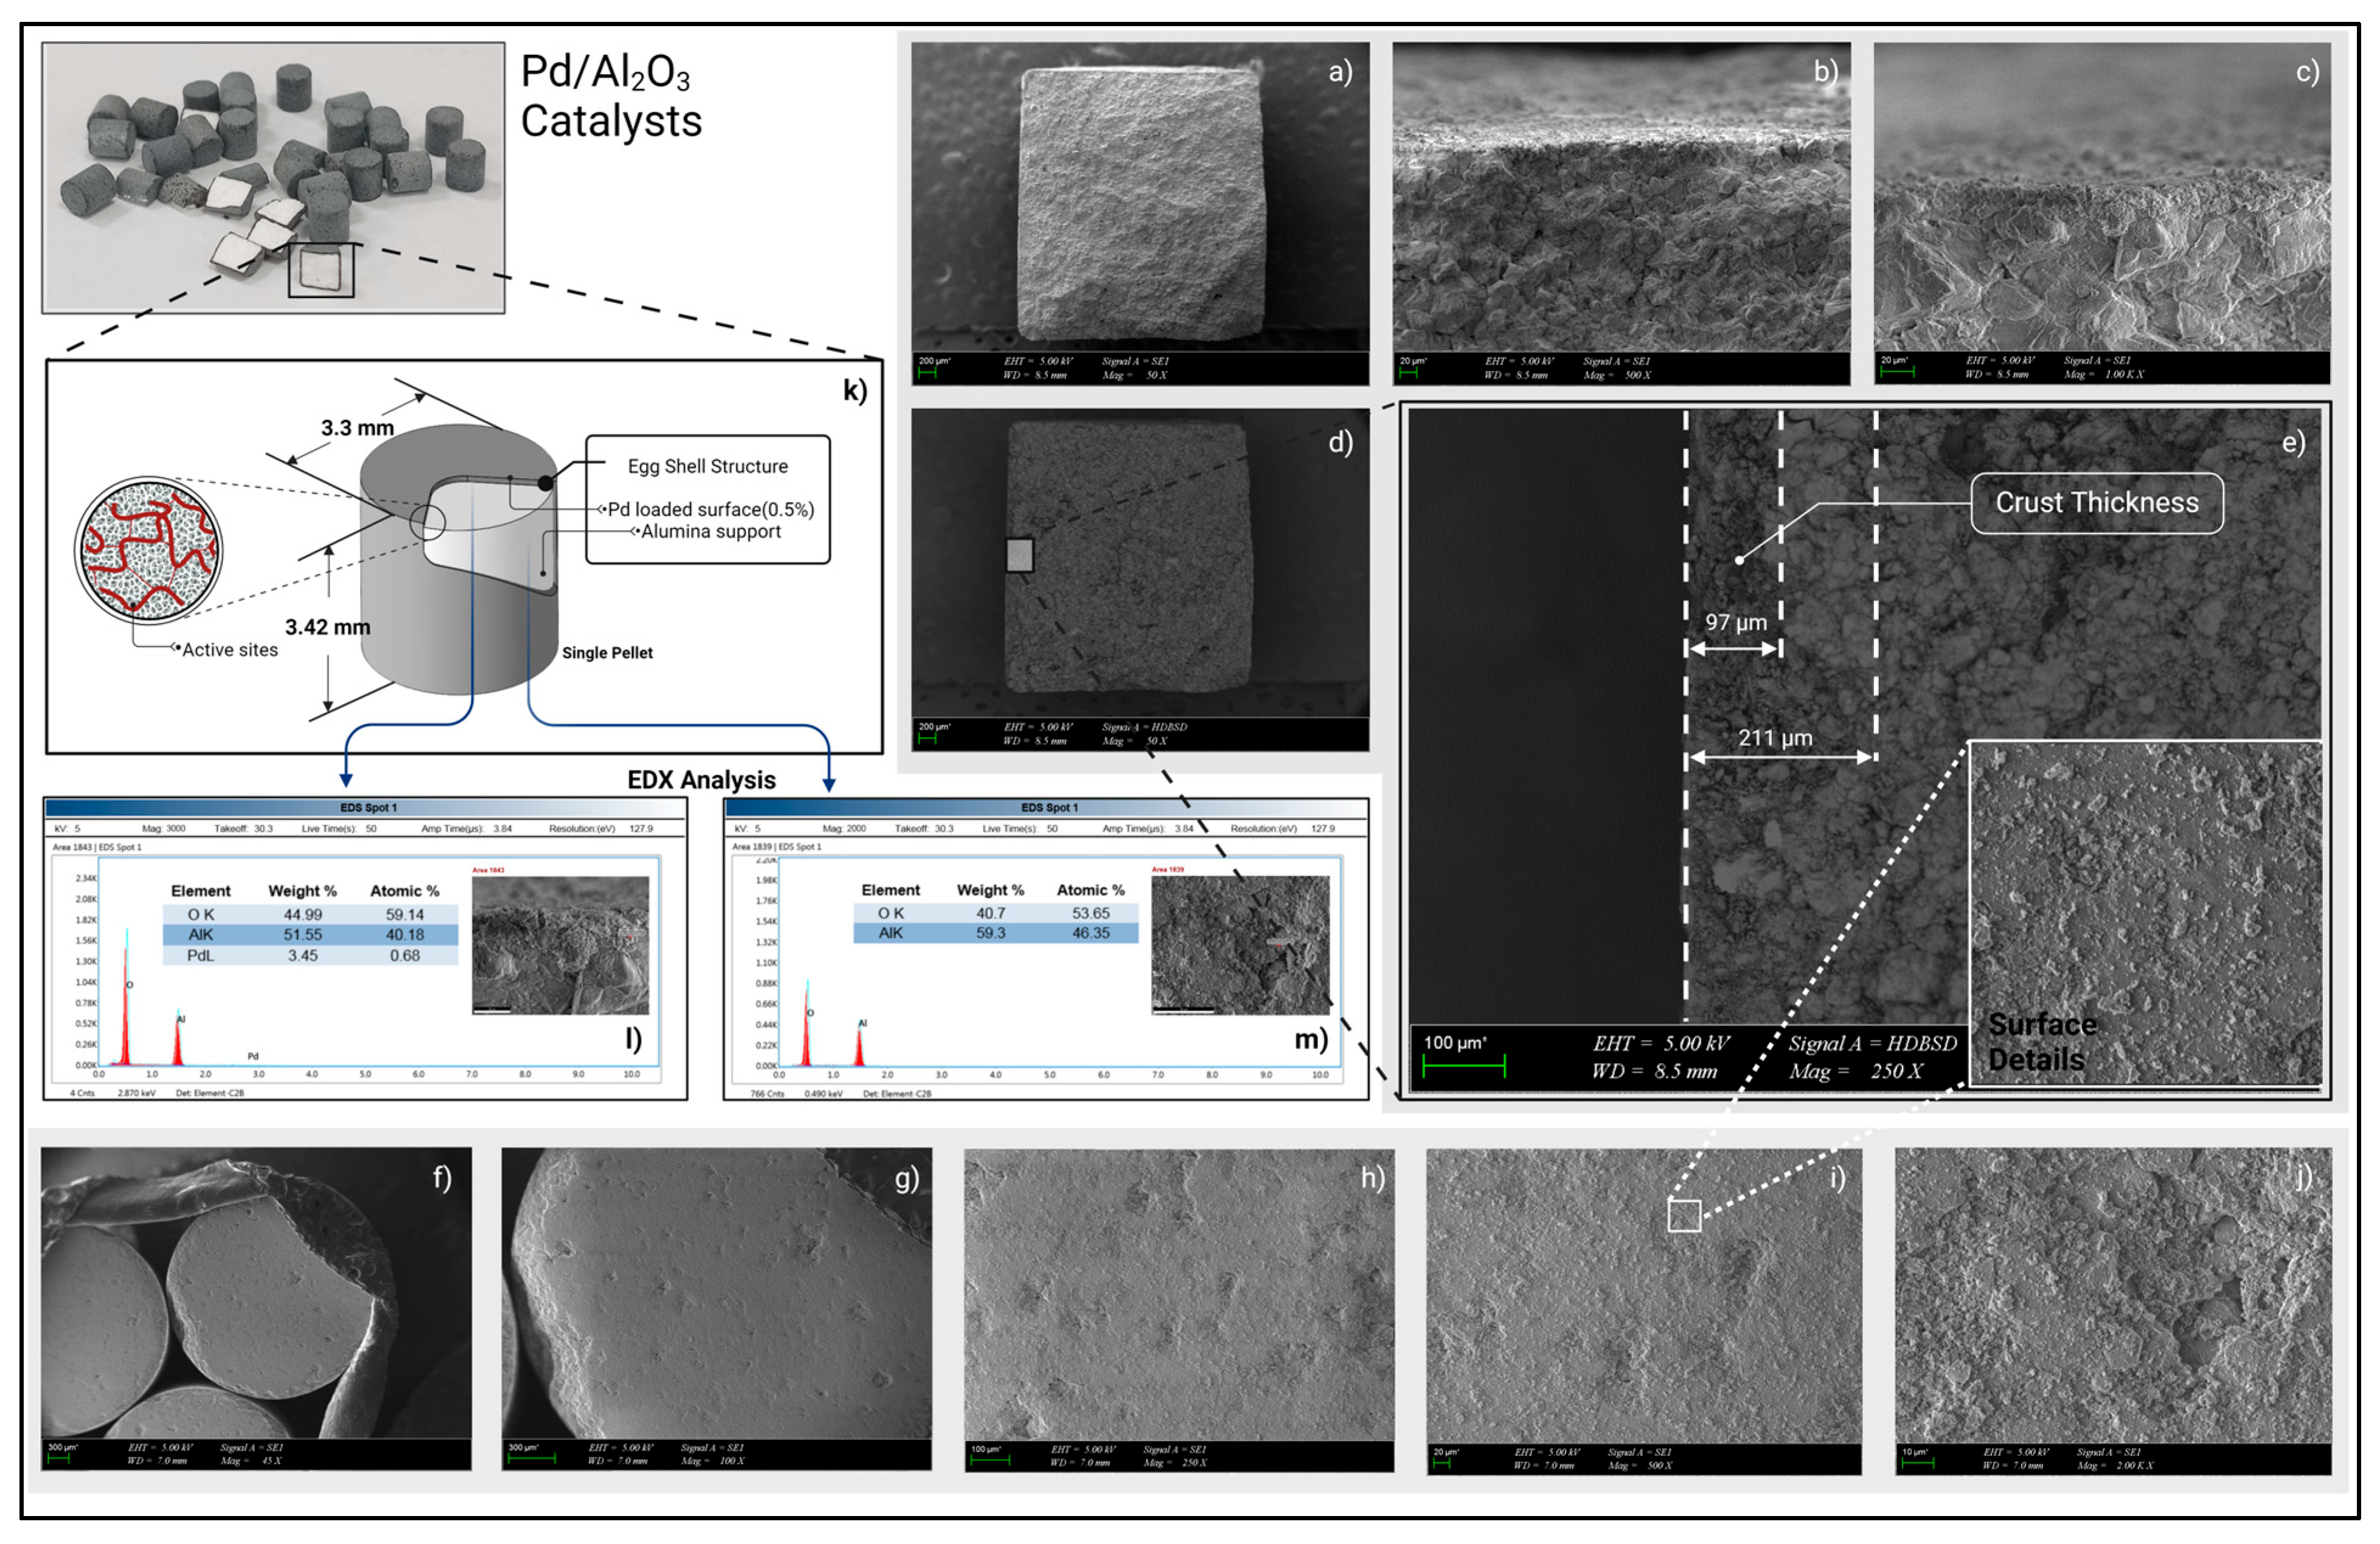
3.2.1. Characterization of Palladium Catalyst
Scanning Electron Microscopy (SEM) Analysis
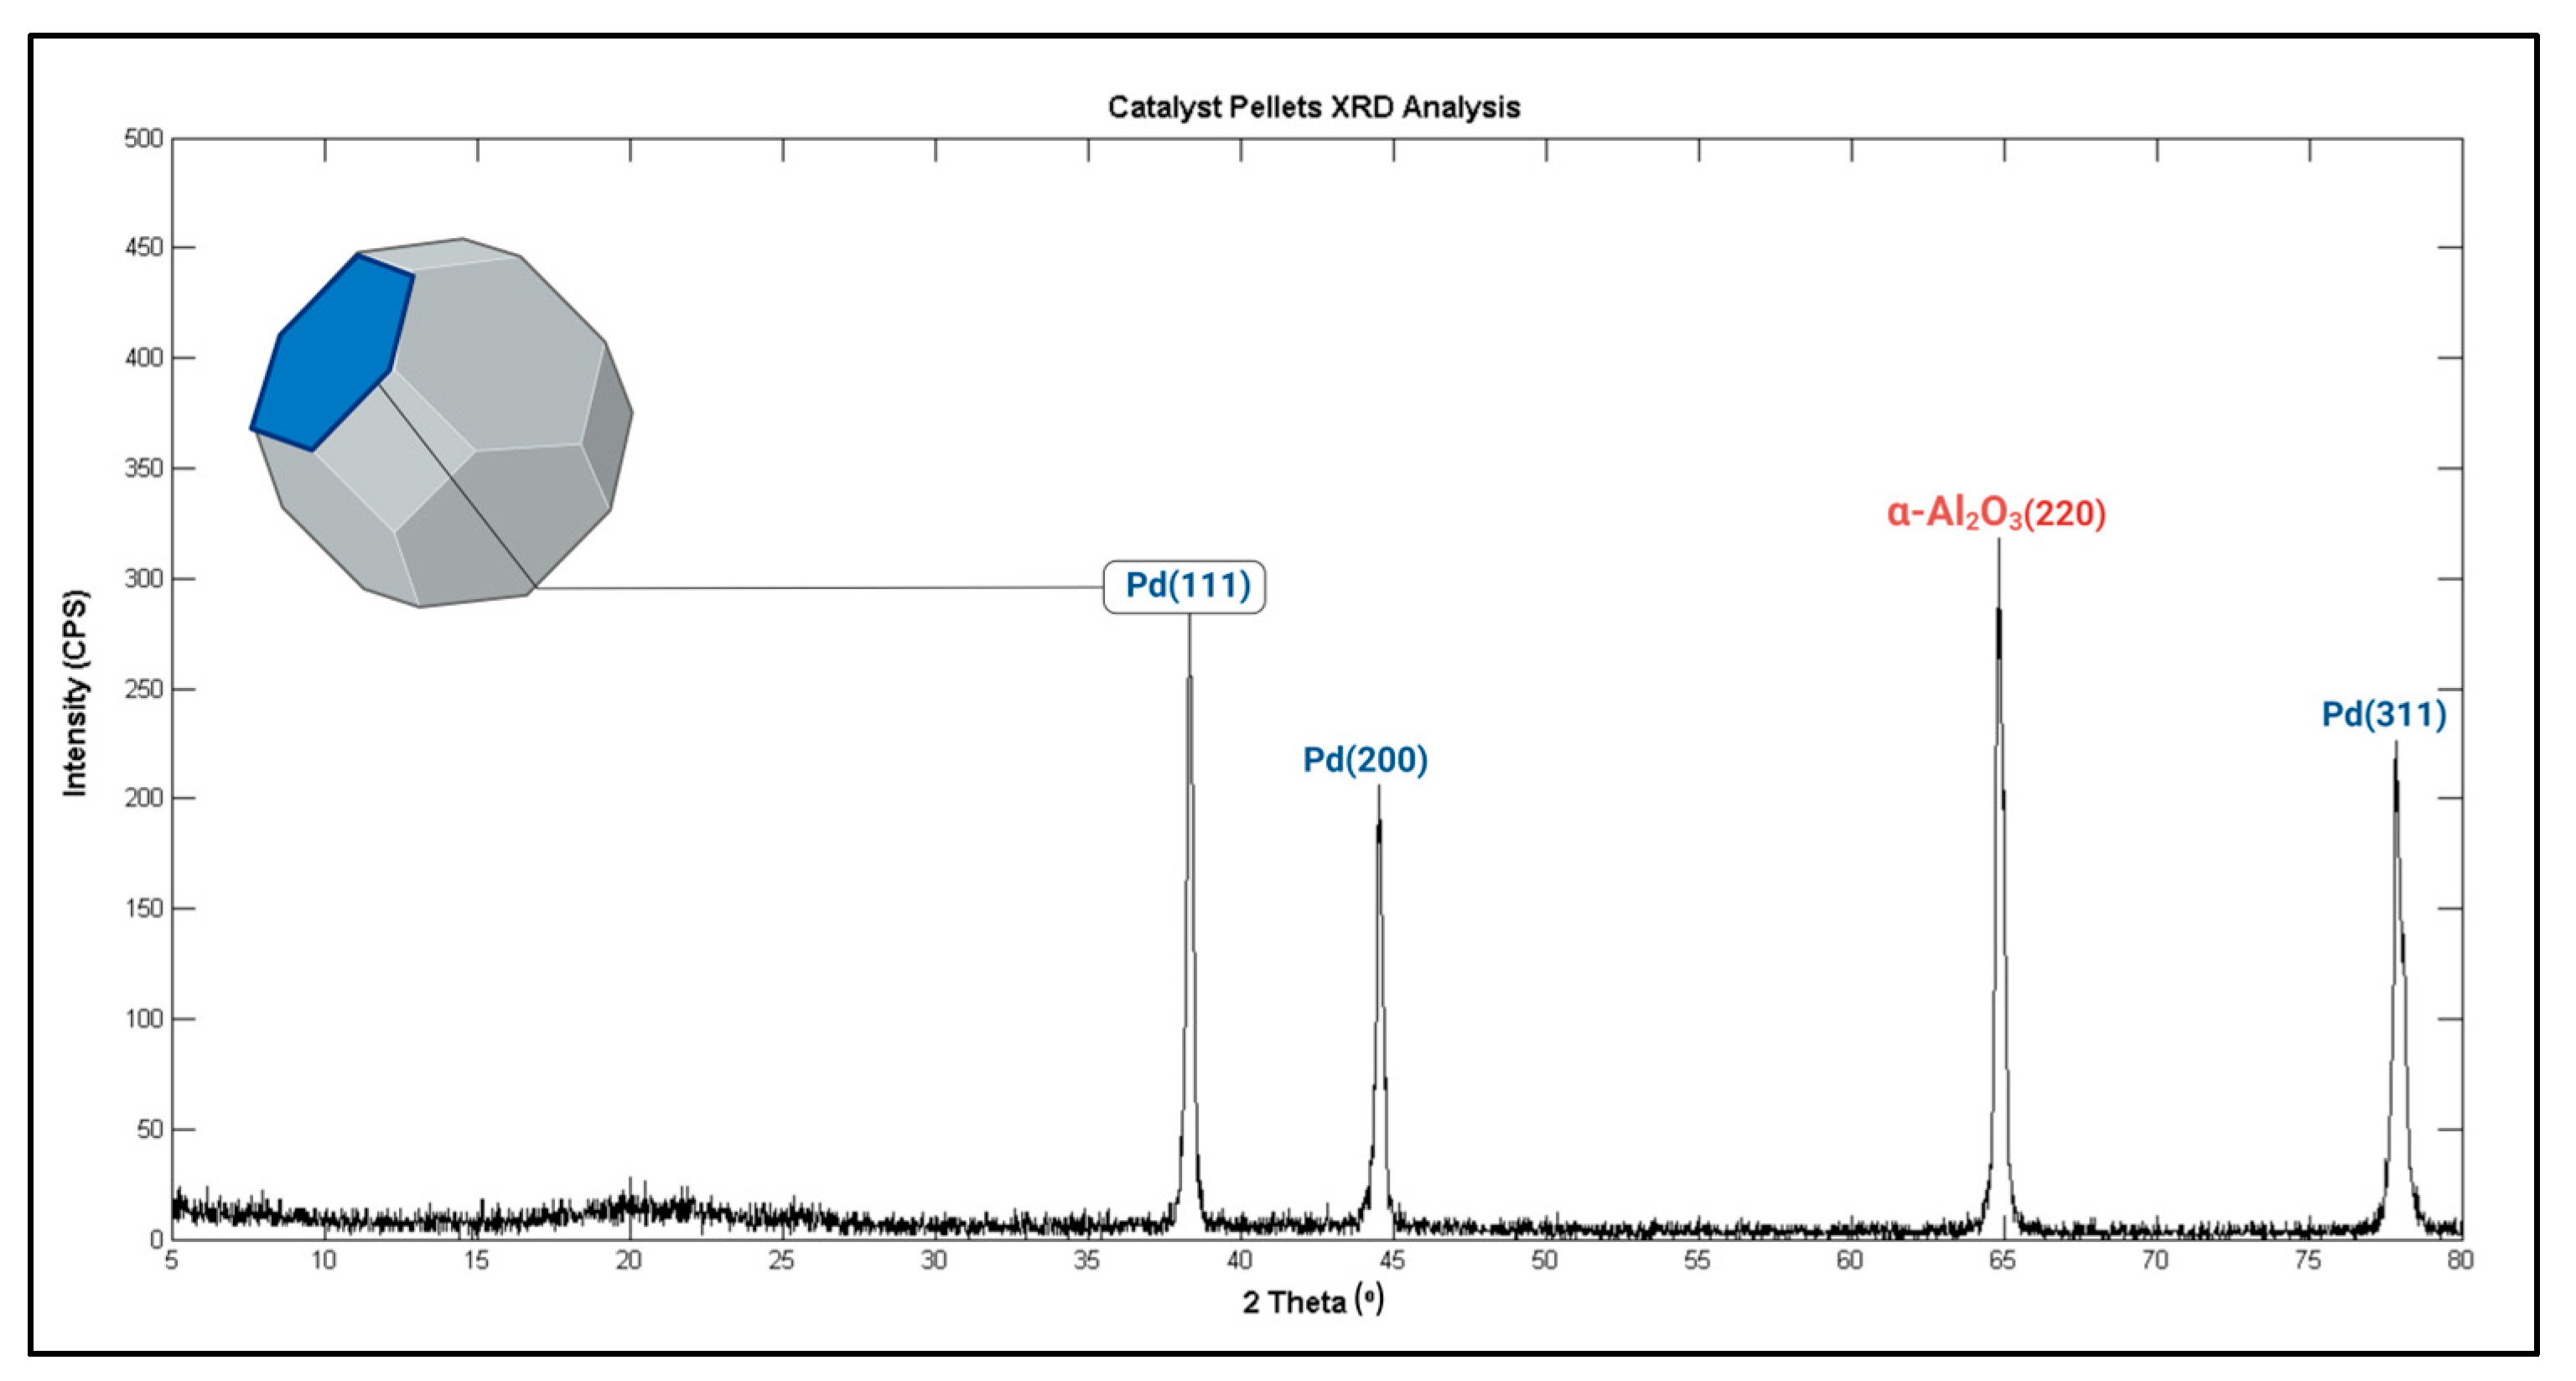
X-Ray Diffraction (XRD) Analysis
3.2.2. Gas Chromatography–Mass Spectrometry (GC/MS) Analysis
3.2.3. Modelling Methodology
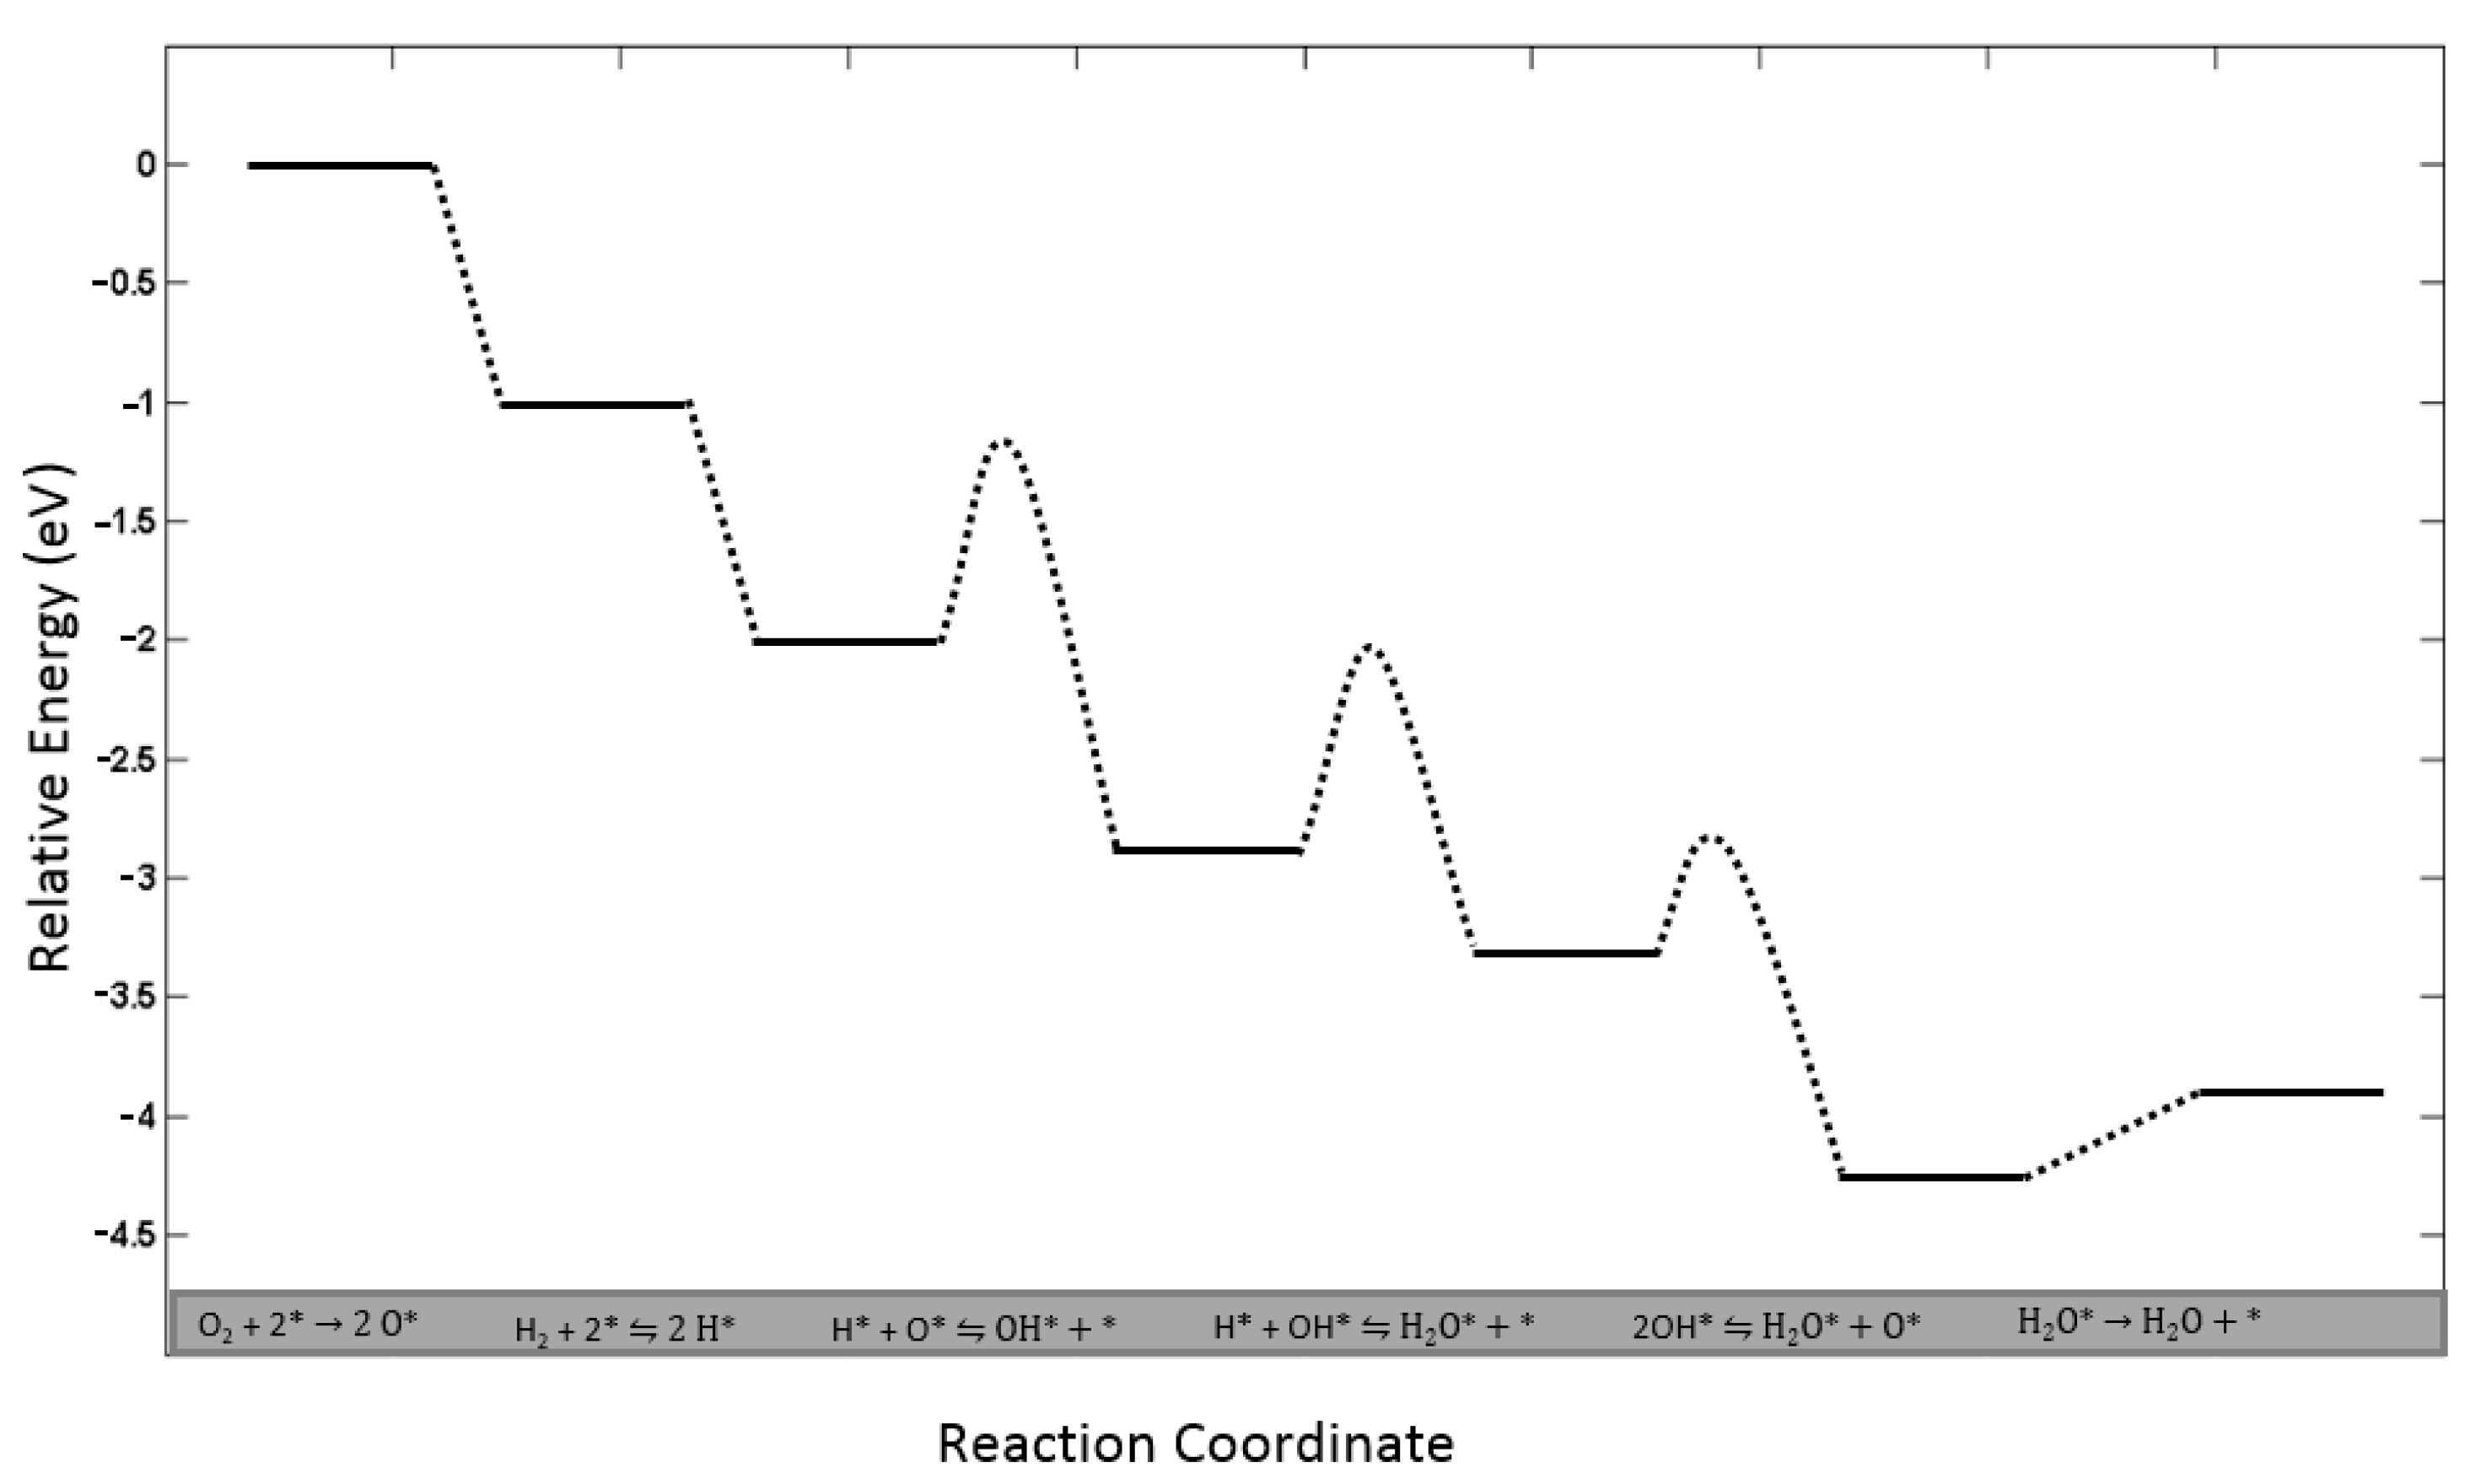
Surface Reaction Scheme
DFT (Density Functional Theory) Calculations
Microkinetic Modeling Details
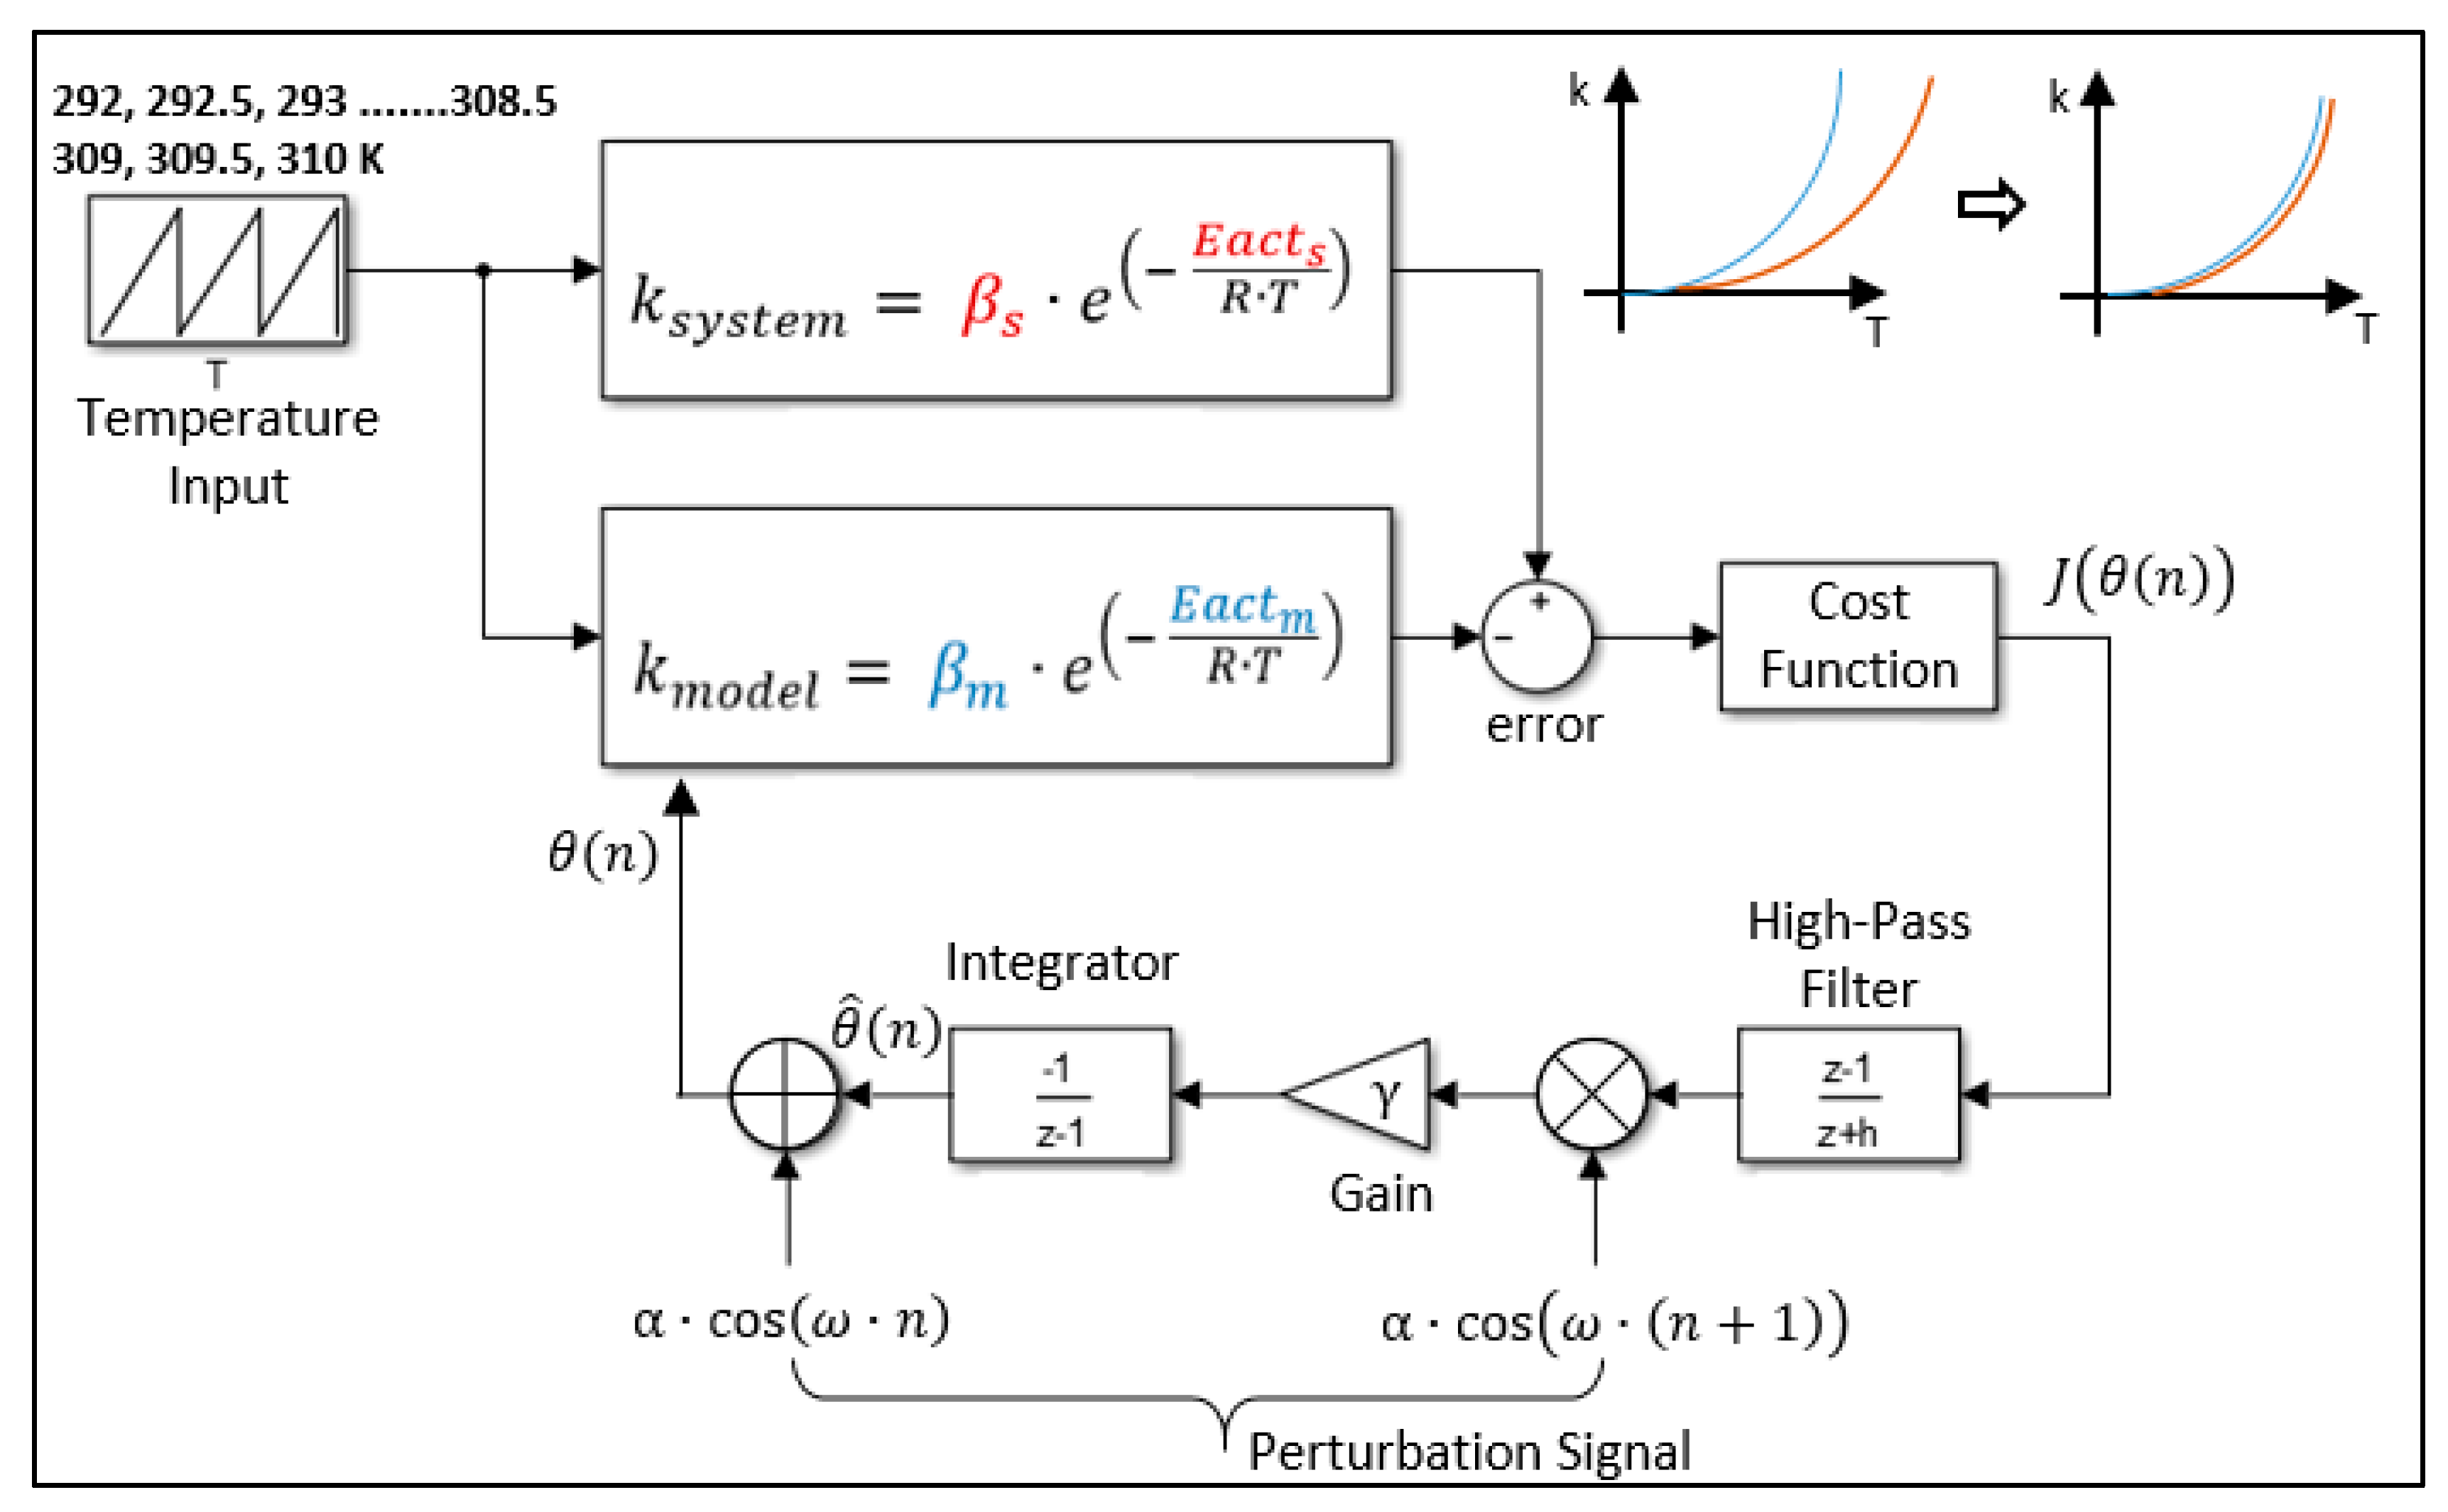
3.3. Proposed Estimation Algorithm
4. Results and Discussion
4.1. Results of Clinical Validation Tests
4.2. Characterization Results
4.2.1. SEM Findings
4.2.2. XRD Findings
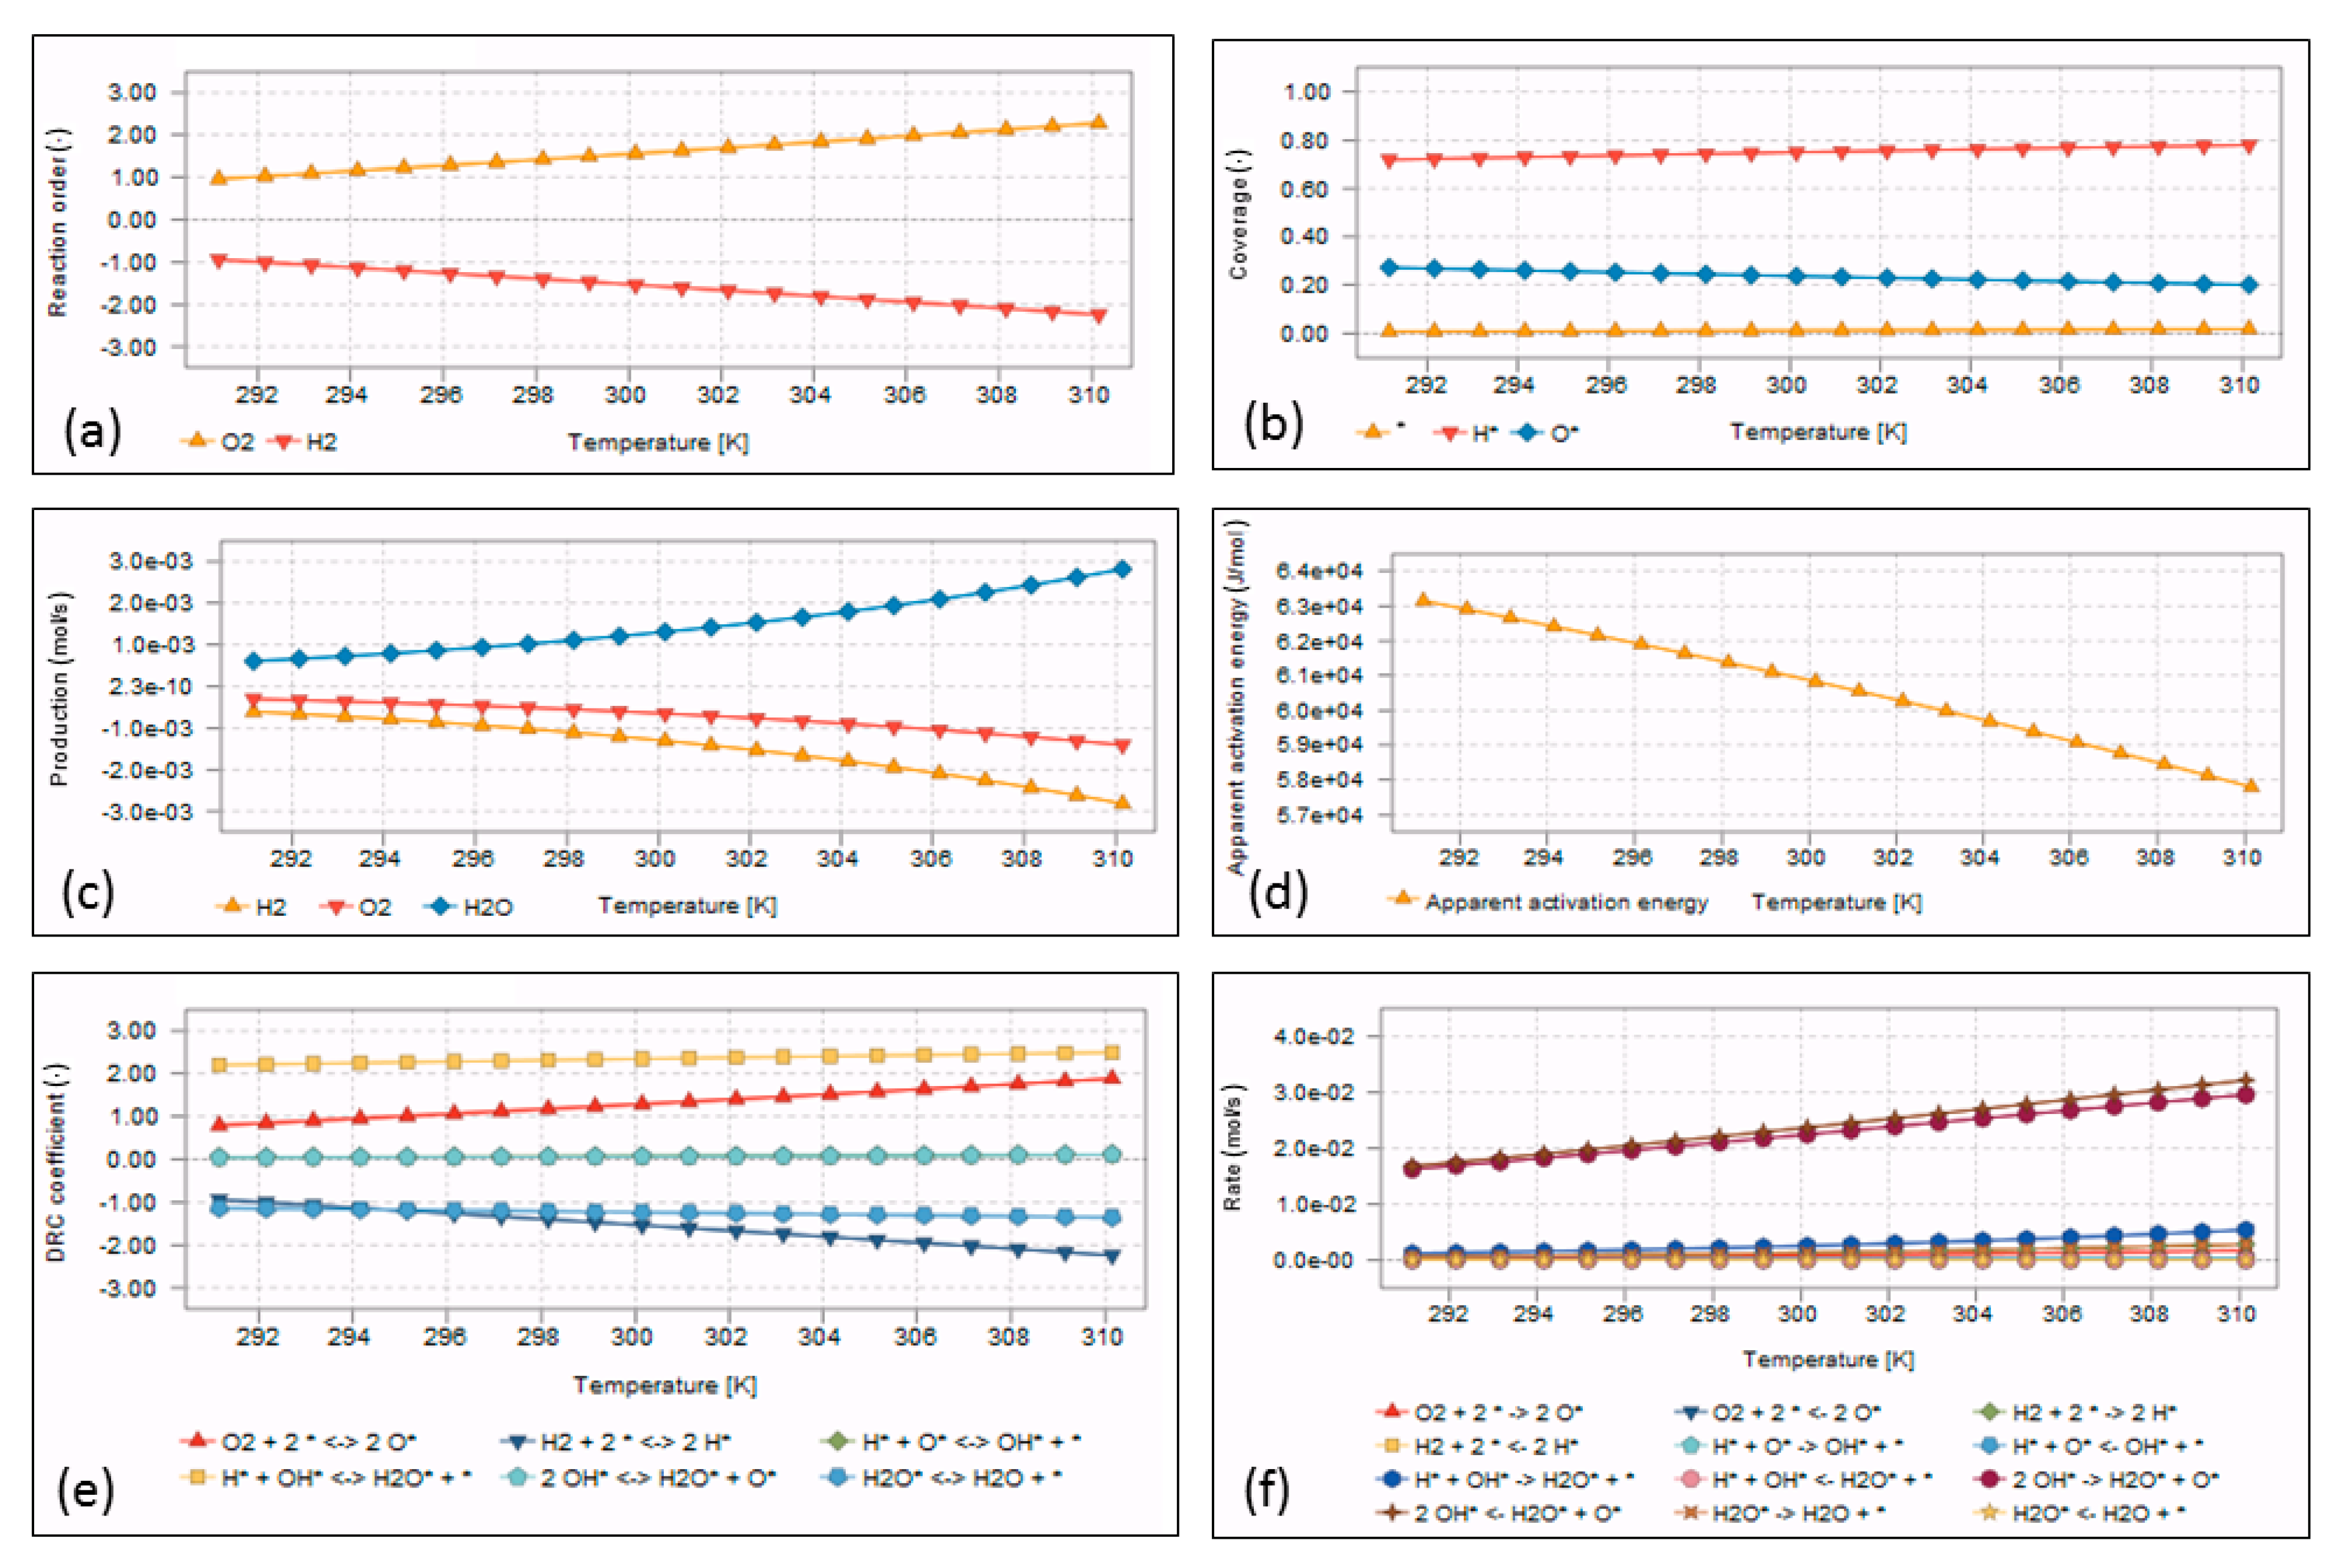
4.3. Microkinetic Model Outputs
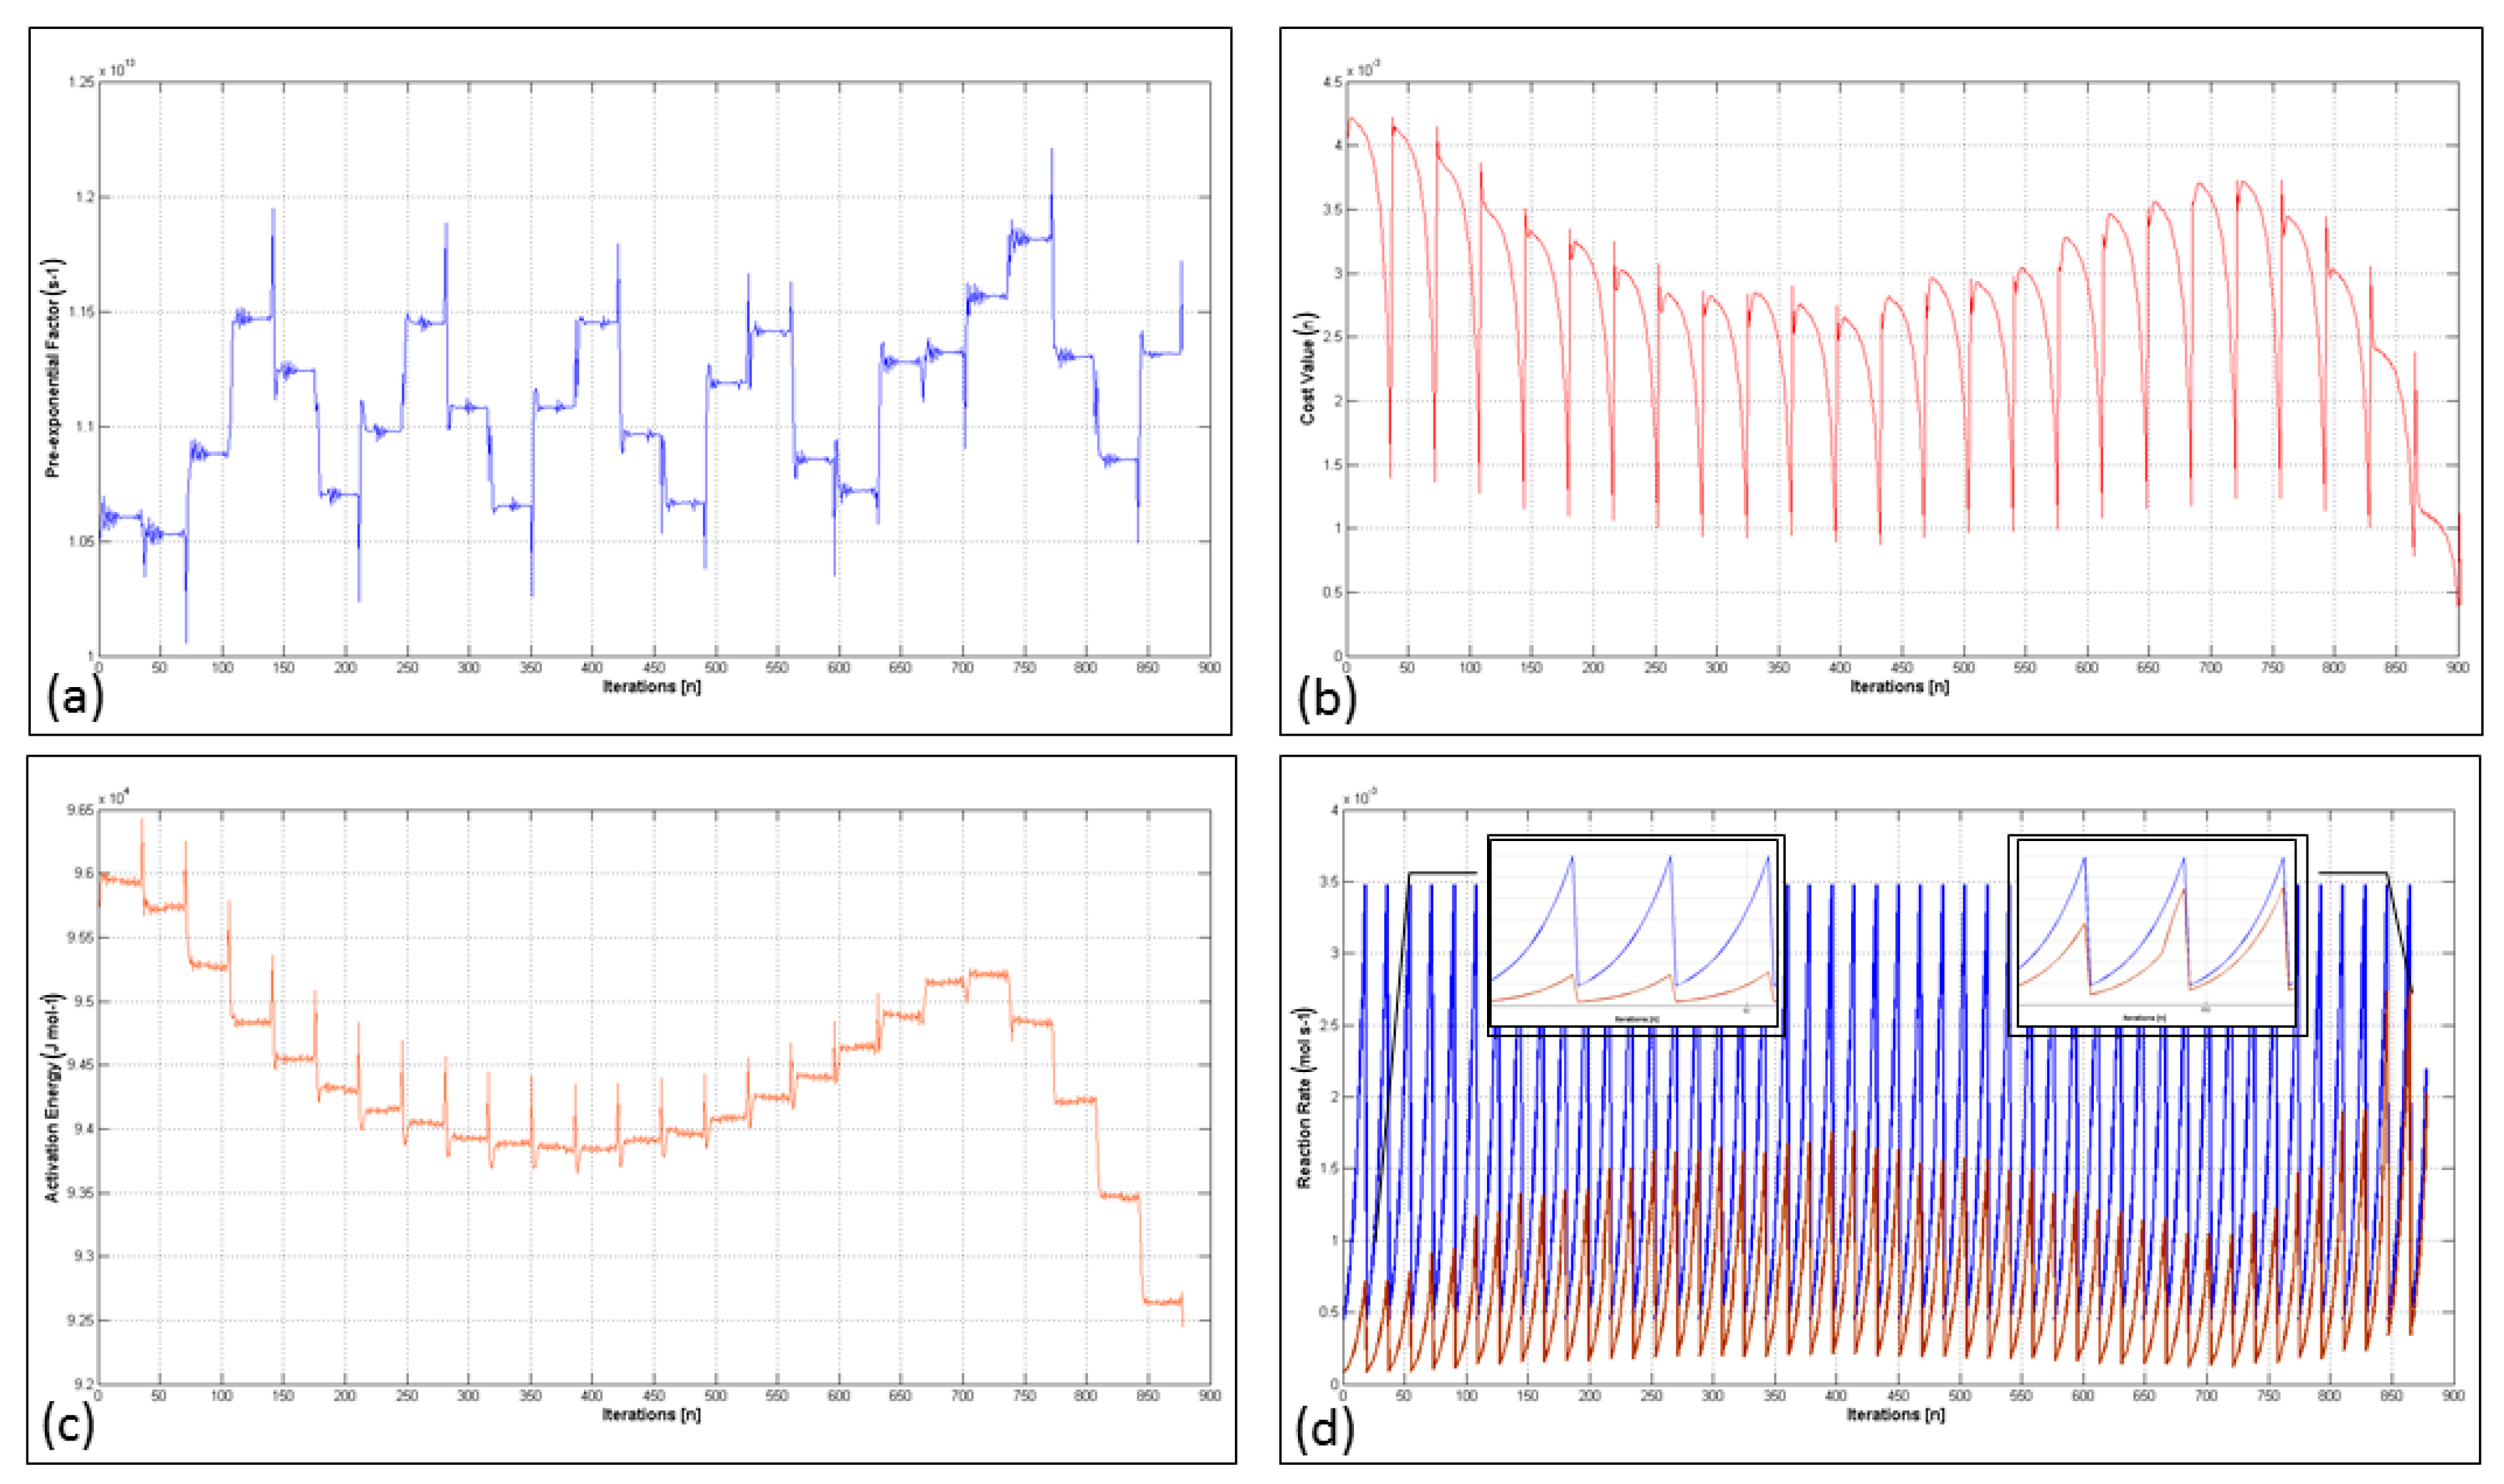
4.4. Analysis of the Extremum Seeking Algorithm
5. Conclusions
Author Contributions
Funding
Institutional Review Board Statement
Informed Consent Statement
Data Availability Statement
Acknowledgments
Conflicts of Interest
References
- Bacic, M.K.; Smith, C.J. Laboratory Maintenance and Cultivation of Bacteroides Species. Curr. Protoc. Microbiol. 2008, 9, 13C.1.1–13C.1.21. [Google Scholar] [CrossRef] [PubMed]
- Hanišáková, N.; Vítězová, M.; Rittmann, S.K.-M.R. The Historical Development of Cultivation Techniques for Methanogens and Other Strict Anaerobes and Their Application in Modern Microbiology. Microorganisms 2022, 10, 412. [Google Scholar] [CrossRef] [PubMed]
- Bulloch, W. The History of Bacteriology; Oxford University Press: London, UK, 1960. [Google Scholar]
- Sebald, M.; Finegold, S.M. Pasteur: The Anaerobic Life and the Anaerobes. Clin. Infect. Dis. 1995, 20, S111. [Google Scholar] [CrossRef]
- Ljungdahl, L.G.; Adams, M.W.; Barton, L.L.; Ferry, J.G.; Johnson, M.K. Biochemistry and Physiology of Anaerobic Bacteria, 1st ed.; Ljungdahl, L.G., Adams, M.W., Barton, L.L., Ferry, J.G., Johnson, M.K., Eds.; Springer: New York, NY, USA, 2003. [Google Scholar]
- Loesche, W.J. Oxygen sensitivity of various anaerobic bacteria. Appl. Microbiol. 1969, 18, 723–727. [Google Scholar] [CrossRef]
- Tally, F.P.; Stewart, P.R.; Sutter, V.L.; Rosenblatt, J.E. Oxygen tolerance of fresh clinical anaerobic bacteria. J. Clin. Microbiol. 1975, 1, 161–164. [Google Scholar] [CrossRef]
- Lu, Z.; Sethu, R.; Imlay, J.A. Endogenous superoxide is a key effector of the oxygen sensitivity of a model obligate anaerobe. Proc. Natl. Acad. Sci. USA 2018, 115, E3266–E3275. [Google Scholar] [CrossRef]
- Hentges, D.J. The anaerobic microflora of the human body. Clin. Infect. Dis. 1993, 16 (Suppl. S4), S175–S180. [Google Scholar] [CrossRef]
- Brook, I. Pericarditis caused by anaerobic bacteria. Int. J. Antimicrob. Agents 2009, 33, 297–300. [Google Scholar] [CrossRef]
- Nagy, E. Anaerobic infections: Update on treatment considerations. Drugs 2010, 70, 841–858. [Google Scholar] [CrossRef]
- Lagier, J.-C.; Edouard, S.; Pagnier, I.; Mediannikov, O.; Drancourt, M.; Raoult, D. Current and Past Strategies for Bacterial Culture in Clinical Microbiology. Clin. Microbiol. Rev. 2015, 28, 208–236. [Google Scholar] [CrossRef]
- Jenkins, S.G. Infections due to anaerobic bacteria and the role of antimicrobial susceptibility testing of anaerobes. Rev. Res. Med. Microbiol. 2001, 12, 1–12. [Google Scholar] [CrossRef]
- Hecht, D.W. Anaerobes: Antibiotic resistance, clinical significance, and the role of susceptibility testing. Anaerobe 2006, 12, 115–121. [Google Scholar] [CrossRef] [PubMed]
- Reissier, S.; Penven, M.; Guérin, F.; Cattoir, V. Recent Trends in Antimicrobial Resistance among Anaerobic Clinical Isolates. Microorganisms 2023, 11, 1474. [Google Scholar] [CrossRef] [PubMed]
- Bei, A.K.; Patel, S.D.; Volkman, S.K.; Ahouidi, A.D.; Ndiaye, D.; Mboup, S.; Wirth, D.F. An Adjustable Gas-Mixing Device to Increase Feasibility of In Vitro Culture of Plasmodium falciparum Parasites in the Field. PLoS ONE 2014, 9, e90928. [Google Scholar] [CrossRef]
- Bonnet, M.; Lagier, J.C.; Raoult, D.; Khelaifia, S. Bacterial culture through selective and non-selective conditions: The evolution of culture media in clinical microbiology. New Microbes New Infect. 2020, 34, 100622. [Google Scholar] [CrossRef]
- Solid Media Used for Isolation. In Clinical Microbiology Procedures Handbook; John Wiley & Sons, Ltd.: Hoboken, NJ, USA, 2016; pp. 7.3.1–7.3.4. ISBN 9781683670766.
- Hungate, R.E. Chapter IV A Roll Tube Method for Cultivation of Strict Anaerobes. In Methods in Microbiology; Norris, J.R., Ribbons, D.W., Eds.; Academic Press: Cambridge, MA, USA, 1969; Volume 3, pp. 117–132. [Google Scholar]
- Wolfe, R.S. Chapter one-Techniques for Cultivating Methanogens. In Methods in Methane Metabolism, Part A; Rosenzweig, A.C., Ragsdale, S.W., Eds.; Methods in Enzymology; Academic Press: Cambridge, MA, USA, 2011; Volume 494, pp. 1–22. [Google Scholar]
- Moissl-Eichinger, C.; Pausan, M.; Taffner, J.; Berg, G.; Bang, C.; Schmitz, R.A. Archaea Are Interactive Components of Complex Microbiomes. Trends Microbiol. 2018, 26, 70–85. [Google Scholar] [CrossRef]
- Pike, L.J.; Forster, S.C. A new piece in the microbiome puzzle. Nat. Rev. Microbiol. 2018, 16, 186. [Google Scholar] [CrossRef]
- van de Pol, J.A.A.; van Best, N.; Mbakwa, C.A.; Thijs, C.; Savelkoul, P.H.; Arts, I.C.W.; Hornef, M.W.; Mommers, M.; Penders, J. Gut Colonization by Methanogenic Archaea Is Associated with Organic Dairy Consumption in Children. Front. Microbiol. 2017, 8, 355. [Google Scholar] [CrossRef]
- Mafra, D.; Ribeiro, M.; Fonseca, L.; Regis, B.; Cardozo, L.F.M.F.; Fragoso dos Santos, H.; Emiliano de Jesus, H.; Schultz, J.; Shiels, P.G.; Stenvinkel, P.; et al. Archaea from the gut microbiota of humans: Could be linked to chronic diseases? Anaerobe 2022, 77, 102629. [Google Scholar] [CrossRef]
- Conway de Macario, E.; Macario, A.J.L. Methanogenic archaea in health and disease: A novel paradigm of microbial pathogenesis. Int. J. Med. Microbiol. 2009, 299, 99–108. [Google Scholar] [CrossRef]
- Al-Fakhrany, O.M.; Elekhnawy, E. Next-generation probiotics: The upcoming biotherapeutics. Mol. Biol. Rep. 2024, 51, 505. [Google Scholar] [CrossRef] [PubMed]
- Garcia-Gutierrez, E.; Mayer, M.J.; Cotter, P.D.; Narbad, A. Gut microbiota as a source of novel antimicrobials. Gut Microbes 2019, 10, 1–21. [Google Scholar] [CrossRef] [PubMed]
- Börner, R.A. Isolation and Cultivation of Anaerobes. In Anaerobes in Biotechnology; Hatti-Kaul, R., Mamo, G., Mattiasson, B., Eds.; Springer International Publishing: Cham, Switzerland, 2016; pp. 35–53. ISBN 978-3-319-45651-5. [Google Scholar]
- Khanal, S.K. Environmental Factors. In Anaerobic Biotechnology for Bioenergy Production; John Wiley & Sons, Ltd.: Hoboken, NJ, USA, 2008; pp. 43–63. ISBN 9780813804545. [Google Scholar]
- Plugge, C.M. Anoxic Media Design, Preparation, and Considerations. In Environmental Microbiology; Methods in Enzymology; Academic Press: Cambridge, MA, USA, 2005; Volume 397, pp. 3–16. [Google Scholar]
- Tille, P.M. Bailey \& Scott’s Diagnostic Microbiology; Elsevier: Amsterdam, The Netherlands, 2017; ISBN 9780323354820. [Google Scholar]
- Imhof, A.; Heinzer, I. Continuous monitoring of oxygen concentrations in several systems for cultivation of anaerobic bacteria. J. Clin. Microbiol. 1996, 34, 1646–1648. [Google Scholar] [CrossRef] [PubMed]
- Mcintosh, J.; Fildes, P.; Bulloch, W. A New Apparatus for the Isolation and Cultivation of Anaerobic Micro-Organ Isms. Lancet 1916, 187, 768–770. [Google Scholar] [CrossRef]
- Fildes, P.; McIntosh, J. An Improved Form of McIntosh and Fildes’ Anaërobic Jar. Br. J. Exp. Pathol. 1921, 2, 153–154. [Google Scholar]
- Wilson, G.S. A modification of McIntosh and Fildes’ anaerobic jar. J. Pathol. Bacteriol. 1928, 31, 113–115. [Google Scholar] [CrossRef]
- Sandeep, K.C.; Bhattacharyya, R.; Warghat, C.; Bhanja, K.; Mohan, S. Experimental investigation on the kinetics of catalytic recombination of hydrogen with oxygen in air. Int. J. Hydrogen Energy 2014, 39, 17906–17912. [Google Scholar] [CrossRef]
- Li, X.; Zhou, S.-Y.; Zhang, J.; Guo, Z.-W.; Guan, M.-Q.; Li, B.; Zhang, D.; Wang, Y.-X.; Xie, L.-F. Kinetics study on the catalytic recombination of non-premixed hydrogen–oxygen system: Effects of initial temperature, oxygen flow rate, and hydrogen diffusion time. Fuel 2023, 350, 128775. [Google Scholar] [CrossRef]
- Zhao, X.; Chang, Y.; Chen, W.-J.; Wu, Q.; Pan, X.; Chen, K.; Weng, B. Recent Progress in Pd-Based Nanocatalysts for Selective Hydrogenation. ACS Omega 2022, 7, 17–31. [Google Scholar] [CrossRef]
- Pan, Y.; Shen, X.; Yao, L.; Bentalib, A.; Peng, Z. Active Sites in Heterogeneous Catalytic Reaction on Metal and Metal Oxide: Theory and Practice. Catalysts 2018, 8, 478. [Google Scholar] [CrossRef]
- Montemore, M.M.; van Spronsen, M.A.; Madix, R.J.; Friend, C.M. O(2) Activation by Metal Surfaces: Implications for Bonding and Reactivity on Heterogeneous Catalysts. Chem. Rev. 2018, 118, 2816–2862. [Google Scholar] [CrossRef] [PubMed]
- Chee, S.W.; Lunkenbein, T.; Schlögl, R.; Roldán Cuenya, B. Operando Electron Microscopy of Catalysts: The Missing Cornerstone in Heterogeneous Catalysis Research? Chem. Rev. 2023, 123, 13374–13418. [Google Scholar] [CrossRef] [PubMed]
- Bruix, A.; Margraf, J.T.; Andersen, M.; Reuter, K. First-principles-based multiscale modelling of heterogeneous catalysis. Nat. Catal. 2019, 2, 659–670. [Google Scholar] [CrossRef]
- Chen, B.W.J.; Xu, L.; Mavrikakis, M. Computational Methods in Heterogeneous Catalysis. Chem. Rev. 2021, 121, 1007–1048. [Google Scholar] [CrossRef]
- Matera, S.; Schneider, W.F.; Heyden, A.; Savara, A. Progress in Accurate Chemical Kinetic Modeling, Simulations, and Parameter Estimation for Heterogeneous Catalysis. ACS Catal. 2019, 9, 6624–6647. [Google Scholar] [CrossRef]
- Langmuir, I. The mechanism of the catalytic action of platinum in the reactions 2CO + O2 = 2CO2 and 2H2 + O2 = 2H2O. Trans. Faraday Soc. 1922, 17, 621–654. [Google Scholar] [CrossRef]
- Dietze, E.M.; Chen, L.; Grönbeck, H. Surface steps dominate the water formation on Pd(111) surfaces. J. Chem. Phys. 2022, 156, 64701. [Google Scholar] [CrossRef]
- Borodin, D.; Schwarzer, M.; Hahn, H.W.; Fingerhut, J.; Wang, Y.; Auerbach, D.J.; Guo, H.; Schroeder, J.; Kitsopoulos, T.N.; Wodtke, A.M. The puzzle of rapid hydrogen oxidation on Pt(111). Mol. Phys. 2021, 119, e1966533. [Google Scholar] [CrossRef]
- Filot, I.A.W.; van Santen, R.A.; Hensen, E.J.M. The Optimally Performing Fischer–Tropsch Catalyst. Angew. Chem. Int. Ed. 2014, 53, 12746–12750. [Google Scholar] [CrossRef]
- Filot, I.A.W. Introduction to Microkinetic Modeling; Technische Universiteit Eindhoven: Eindhoven, The Netherlands, 2018; ISBN 978-90-386-4520-9. [Google Scholar]
- Gokhale, A.A.; Kandoi, S.; Greeley, J.P.; Mavrikakis, M.; Dumesic, J.A. Molecular-level descriptions of surface chemistry in kinetic models using density functional theory. Chem. Eng. Sci. 2004, 59, 4679–4691. [Google Scholar] [CrossRef]
- Reuter, K.; Scheffler, M. First-principles kinetic Monte Carlo simulations for heterogeneous catalysis: Application to the CO oxidation at RuO2(110). Phys. Rev. B 2006, 73, 45433. [Google Scholar] [CrossRef]
- Vannice, M.A. Kinetics of Catalytic Reactions; Springer: New York, NY, USA, 2006; ISBN 9780387259727. [Google Scholar]
- Cortright, R.D.; Dumesic, J.A. Kinetics of heterogeneous catalytic reactions: Analysis of reaction schemes. In Advances in Catalysis; Academic Press: Cambridge, MA, USA, 2001; Volume 46, pp. 161–264. [Google Scholar]
- Yu, W.-Y.; Zhang, L.; Mullen, G.M.; Henkelman, G.; Mullins, C.B. Oxygen Activation and Reaction on Pd–Au Bimetallic Surfaces. J. Phys. Chem. C 2015, 119, 11754–11762. [Google Scholar] [CrossRef]
- Schwarzer, M.; Hertl, N.; Nitz, F.; Borodin, D.; Fingerhut, J.; Kitsopoulos, T.N.; Wodtke, A.M. Adsorption and Absorption Energies of Hydrogen with Palladium. J. Phys. Chem. C 2022, 126, 14500–14508. [Google Scholar] [CrossRef] [PubMed]
- Kandoi, S.; Greeley, J.; Sanchez-Castillo, M.A.; Evans, S.T.; Gokhale, A.A.; Dumesic, J.A.; Mavrikakis, M. Prediction of Experimental Methanol Decomposition Rates on Platinum from First Principles. Top. Catal. 2006, 37, 17–28. [Google Scholar] [CrossRef]
- Ariyur, K.B.; Krstic, M. Discrete Time Extremum Seeking. In Real-Time Optimization by Extremum-Seeking Control; John Wiley & Sons, Ltd.: Hoboken, NJ, USA, 2003; pp. 61–70. ISBN 9780471669784. [Google Scholar]
- Killingsworth, N.; Krstic, M. Auto-tuning of PID controllers via extremum seeking. In Proceedings of the 2005, American Control Conference, Portland, OR, USA, 8–10 June 2005; Volume 4, pp. 2251–2256. [Google Scholar]
- Choi, J.-Y.; Krstic, M.; Ariyur, K.B.; Lee, J.S. Extremum seeking control for discrete-time systems. IEEE Trans. Automat. Contr. 2002, 47, 318–323. [Google Scholar] [CrossRef]
- Shahin, M.; Jamal, W.; Verghese, T.; Rotimi, V.O. Comparative Evaluation of Anoxomat and Conventional Anaerobic GasPak Jar Systems for the Isolation of Anaerobic Bacteria. Med. Princ. Pract. 2003, 12, 81–86. [Google Scholar] [CrossRef]
- Sorbier, L.; Gay, A.-S.; Fécant, A.; Moreaud, M.; Brodusch, N. Measurement of palladium crust thickness on catalysts by optical microscopy and image analysis. Microsc. Microanal. 2013, 19, 293–299. [Google Scholar] [CrossRef]
- Ngwenya, T.; Nombona, N.; Shozi, M. Synthesis and Characterization of Supported Pd Catalysts for Potential Application in Glycerol Electro-Oxidation. Catalysts 2022, 12, 192. [Google Scholar] [CrossRef]
- Chung, J.Y.; Kodama, S.; Sekiguchi, H. Preparation of a Pd/Al(2)O(3) Catalyst with Microwave-Induced Plasma Jet Irradiation under Atmospheric Pressure. Nanomaterials 2019, 9, 1734. [Google Scholar] [CrossRef]
- Johnson, N.J.J.; Lam, B.; MacLeod, B.P.; Sherbo, R.S.; Moreno-Gonzalez, M.; Fork, D.K.; Berlinguette, C.P. Facets and vertices regulate hydrogen uptake and release in palladium nanocrystals. Nat. Mater. 2019, 18, 454–458. [Google Scholar] [CrossRef]
- Tian, P.; Ouyang, L.; Xu, X.; Xu, J.; Han, Y.-F. Density functional theory study of direct synthesis of H2O2 from H2 and O2 on Pd(111), Pd(100), and Pd(110) surfaces. Chin. J. Catal. 2013, 34, 1002–1012. [Google Scholar] [CrossRef]
- An, K.; Somorjai, G.A. Size and Shape Control of Metal Nanoparticles for Reaction Selectivity in Catalysis. ChemCatChem 2012, 4, 1512–1524. [Google Scholar] [CrossRef]
- Johansson, M.; Skúlason, E.; Nielsen, G.; Murphy, S.; Nielsen, R.M.; Chorkendorff, I. Hydrogen adsorption on palladium and palladium hydride at 1bar. Surf. Sci. 2010, 604, 718–729. [Google Scholar] [CrossRef]
- Raja, P.B.; Munusamy, K.R.; Perumal, V.; Ibrahim, M.N.M. 5-Characterization of nanomaterial used in nanobioremediation. In Nano-Bioremediation: Fundamentals and Applications; Iqbal, H.M.N., Bilal, M., Nguyen, T.A., Eds.; Micro and Nano Technologies; Elsevier: Amsterdam, The Netherlands, 2022; pp. 57–83. ISBN 978-0-12-823962-9. [Google Scholar]
- Alshammari, H.M.; Aldosari, O.F.; Alotaibi, M.H.; Alotaibi, R.L.; Alhumaimess, M.S.; Morad, M.H.; Adil, S.F.; Shaik, M.R.; Islam, M.S.; Khan, M.; et al. Facile Synthesis and Characterization of Palladium@Carbon Catalyst for the Suzuki-Miyaura and Mizoroki-Heck Coupling Reactions. Appl. Sci. 2021, 11, 4822. [Google Scholar] [CrossRef]
- Cullity, B.D.; Stock, S.R. Elements of X-Ray Diffraction, 3rd ed.; Prentice-Hall: Hoboken, NJ, USA, 2001. [Google Scholar]
- Decarolis, D.; Lezcano-Gonzalez, I.; Gianolio, D.; Beale, A.M. Effect of Particle Size and Support Type on Pd Catalysts for 1,3-Butadiene Hydrogenation. Top. Catal. 2018, 61, 162–174. [Google Scholar] [CrossRef] [PubMed]
- Chary, K.V.R.; Naresh, D.; Vishwanathan, V.; Sadakane, M.; Ueda, W. Vapour phase hydrogenation of phenol over Pd/C catalysts: A relationship between dispersion, metal area and hydrogenation activity. Catal. Commun. 2007, 8, 471–477. [Google Scholar] [CrossRef]
- Belykh, L.B.; Skripov, N.I.; Sterenchuk, T.P.; Schmidt, F.K. The effect of crystallinity on selectivity of palladium catalysts in hydrogenation of 2-ethyl-9,10-anthraquinone. Catal. Commun. 2020, 146, 106124. [Google Scholar] [CrossRef]
- Roldan Cuenya, B.; Behafarid, F. Nanocatalysis: Size- and shape-dependent chemisorption and catalytic reactivity. Surf. Sci. Rep. 2015, 70, 135–187. [Google Scholar] [CrossRef]
- Dumesic, J.A. The Microkinetics of Heterogeneous Catalysis; ACS Professional Reference Book; Wiley: Hoboken, NJ, USA, 1993; ISBN 9780841221895. [Google Scholar]
- Dill, K.A.; Bromberg, S. Molecular Driving Forces: Statistical Thermodynamics in Biology, Chemistry, Physics, and Nanoscience; Garland Science: New York, NY, USA, 2011; ISBN 9780815344308. [Google Scholar]
- Campbell, C.T. Finding the Rate-Determining Step in a Mechanism: Comparing DeDonder Relations with the “Degree of Rate Control”. J. Catal. 2001, 204, 520–524. [Google Scholar] [CrossRef]
- Fantauzzi, D.; Zhu, T.; Mueller, J.E.; Filot, I.A.W.; Hensen, E.J.M.; Jacob, T. Microkinetic Modeling of the Oxygen Reduction Reaction at the Pt(111)/Gas Interface. Catal. Lett. 2015, 145, 451–457. [Google Scholar] [CrossRef]
- Mitsui, T.; Rose, M.K.; Fomin, E.; Ogletree, D.F.; Salmeron, M. A scanning tunneling microscopy study of the reaction between hydrogen and oxygen to form water on Pd(111). J. Chem. Phys. 2002, 117, 5855–5858. [Google Scholar] [CrossRef]
- Vaidulych, M.; Yeh, L.-Y.; Hoehner, R.; Jašík, J.; Kadam, S.A.; Vorochta, M.; Khalakhan, I.; Hagen, J.; Vajda, Š. Low-Temperature Selective Oxidative Dehydrogenation of Cyclohexene by Titania-Supported Nanostructured Pd, Pt, and Pt–Pd Catalytic Films. J. Phys. Chem. C 2024, 128, 3180–3192. [Google Scholar] [CrossRef] [PubMed]
- Lashina, E.A.; Slavinskaya, E.M.; Boronin, A.I. Low-temperature activity of Pd/CeO2 catalysts: Mechanism of CO interaction and mathematical modelling of TPR-CO kinetic data. Chem. Eng. Sci. 2021, 244, 116812. [Google Scholar] [CrossRef]


| Method (a) | Material Consumption | Clinical Effectiveness | Application Area | Time Consumption for Preparation | Catalyst Requirement |
|---|---|---|---|---|---|
| Anaerobic Chamber | Reusable System | 100% cultivation success (c) | Large scale research or hospital laboratories | Less than 30 min (Ready to use after first run) | Required |
| Anaerobic Bag or Pouch | Disposable | 80% cultivation success (b) | Wide range applicability | Less than 5 min (Periodically) | Not required |
| Anaerobic Jar (Manual gas exchange) | Reusable System | 90% cultivation success (b) | Large and middle scale research or hospital laboratories | Less than 25 min (Periodically) | Required |
| Jar Gassing System (Automatic gas exchange) | Reusable System | 100% cultivation success (b) | Large and middle scale research or hospital laboratories | Less than 15 min (Periodically) | Required |
| Product Code | Pd Ratio [%] | Surface Area [m2 g−1] | Pore Volume [mL g−1] | Application Area |
|---|---|---|---|---|
| Deoxo D–4586 | 0.5 | 100 (a) | 0.35 (a) | Removal of O2 from H2/N2 in anaerobic atmospheres |
| Mixtures | Concentrations (%) | |||
|---|---|---|---|---|
| N2 | O2 | CO2 | H2 | |
| Atmospheric Gas Mixture (a) | 81.051 | 18.949 | 0.000 | 0.000 |
| Anaerobic Gas Mixture (b) | 84.404 | 0.000 | 10.680 | 4.916 |
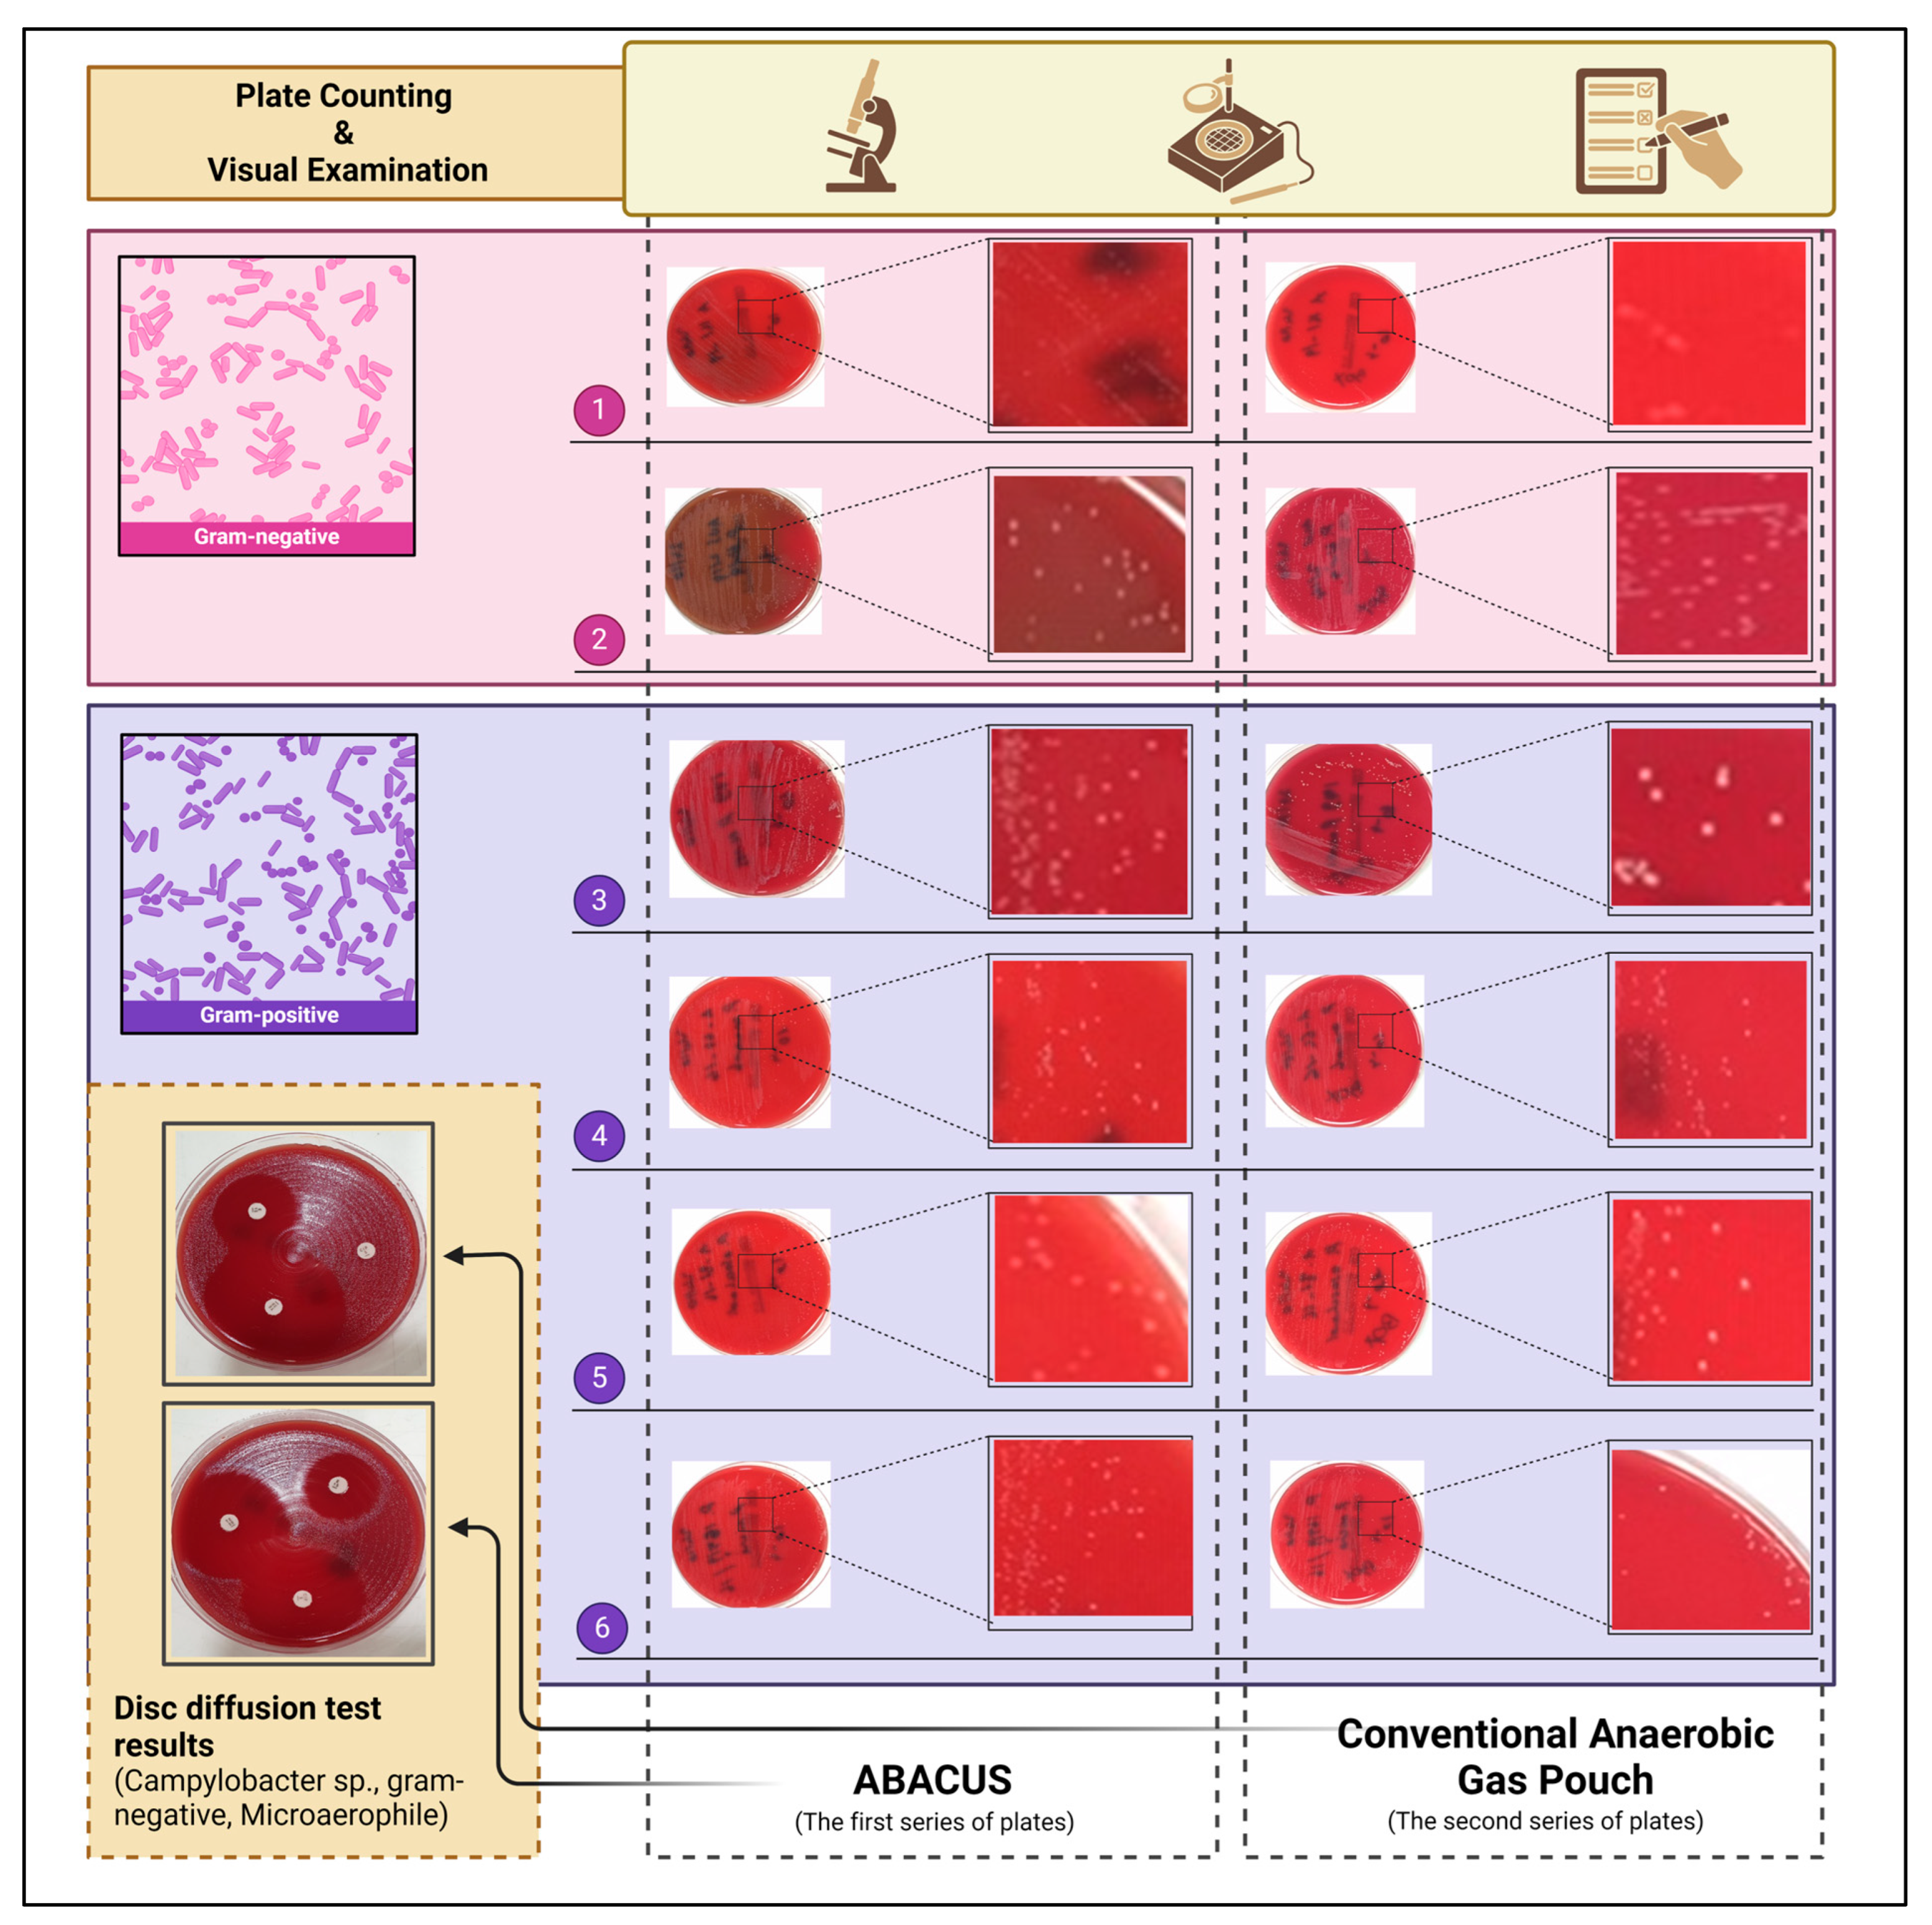
| Bacterial Species | ABACUS (a) | GENBox (b) | Taxonomy (c) | ||
|---|---|---|---|---|---|
| Cell Viability | Colony Counts [CFU mL−1] | Cell Viability | Colony Counts [CFU mL−1] | ||
| Bacteroides fragilis 1 | High | 1.34 × 10⁵ | High | 0.78 × 10⁵ | Obligate Anaerob |
| Prevotella bivia 2 | High | 2.17 × 10⁵ | High | 2.95 × 10⁵ | Obligate Anaerob |
| Cutibacterium acnes 3 | High | 1.77 × 10⁵ | High | 1.43 × 10⁵ | Obligate Anaerob |
| Peptoniphilus asaccharolyticus 4 | High | 1.26 × 10⁵ | High | 1.18 × 10⁵ | Obligate Anaerob |
| Finegoldia magna 5 | High | 2.05 × 10⁵ | High | 2.27 × 10⁵ | Obligate Anaerob |
| Parvimonas micra 6 | High | 1.94 × 10⁵ | High | 2.35 × 10⁵ | Obligate Anaerob |
| 2 Theta [°] | Reflected Planes [hkl] | FHWM [°] | Crystallite Size, L (a) [nm/Å] |
|---|---|---|---|
| 38.3253 | Pd(111) | 0.24310 | 36.149/361.49 |
| 44.5257 | Pd(200) | 0.23150 | 38.476/384.76 |
| 64.8221 | α-Al2O3(220) | 0.25500 | 38.563/385.63 |
| 77.8653 | Pd(311) | 0.27160 | 39.296/392.96 |
| Elementary Reaction Step | βf [s−1] | Ef [J mol−1] | βb [s−1] | Eb [J mol−1] |
|---|---|---|---|---|
| Equation (12) | 1.228 × 10¹³ | 94,570 | 1.66 × 10¹³ | 97,369 |
| Equation (13) | 1.03 × 10¹³ | 47,285 | 1.03 × 10¹³ | 95,535 |
| Equation (14) | 4.97 × 10¹³ | 4825 | 5.166 × 10¹³ | 20,265 |
| Equation (15) | 7.288 × 10¹⁵ | 43,425 | 0.000 | 0.000 |
| Elementary Reaction Step | Asite [m2] | m [g] | θrot (a) [K] | σ (a) [-] | S [-] | Edes [J mol−1] |
|---|---|---|---|---|---|---|
| Equation (10) | 4.37 × 10⁻²⁶ | 32 | 2.1 | 2 | 1 | 77 × 103 |
| Equation (11) | 4.37 × 10⁻²⁶ | 2 | 87.9 | 2 | 0.5 | 96 × 103 |
| Gassing Tests | TOF [mol s−1] | Δtcat_test [s] | ΔPloss [Pa] | Ttof [K] | Pd/Al2O3 Sachet Condition |
|---|---|---|---|---|---|
| Test 1, Sachet 1 | 1.633 × 10⁻⁵ | 90 | 1400 | 296.15 | 1st use |
| Test 2, Sachet 2 | 1.283 × 10⁻⁵ | 90 | 1100 | 295.15 | 1st use |
| Test 3, Sachet 3 | 1.633 × 10⁻⁵ | 90 | 1400 | 296.15 | 1st use |
| Test 4, Sachet 2 | 1.225 × 10⁻⁵ | 180 | 2100 | 295.15 | 2nd use |
| Test 5, Sachet 2 | 5.833 × 10⁻⁶ | 90 | 500 | 296.15 | 3rd use |
| Test 6, Sachet 2 | 9.917 × 10⁻⁶ | 180 | 1700 | 295.65 | 4th use |
Disclaimer/Publisher’s Note: The statements, opinions and data contained in all publications are solely those of the individual author(s) and contributor(s) and not of MDPI and/or the editor(s). MDPI and/or the editor(s) disclaim responsibility for any injury to people or property resulting from any ideas, methods, instructions or products referred to in the content. |
© 2024 by the authors. Licensee MDPI, Basel, Switzerland. This article is an open access article distributed under the terms and conditions of the Creative Commons Attribution (CC BY) license (https://creativecommons.org/licenses/by/4.0/).
Share and Cite
Sayin, F.S.; Erdal, H.; Ulger, N.T.; Aksu, M.B.; Guncu, M.M. A Comprehensive Investigation on Catalytic Behavior of Anaerobic Jar Gassing Systems and Design of an Enhanced Cultivation System. Bioengineering 2024, 11, 1068. https://doi.org/10.3390/bioengineering11111068
Sayin FS, Erdal H, Ulger NT, Aksu MB, Guncu MM. A Comprehensive Investigation on Catalytic Behavior of Anaerobic Jar Gassing Systems and Design of an Enhanced Cultivation System. Bioengineering. 2024; 11(11):1068. https://doi.org/10.3390/bioengineering11111068
Chicago/Turabian StyleSayin, Fatih S., Hasan Erdal, Nurver T. Ulger, Mehmet B. Aksu, and Mehmet M. Guncu. 2024. "A Comprehensive Investigation on Catalytic Behavior of Anaerobic Jar Gassing Systems and Design of an Enhanced Cultivation System" Bioengineering 11, no. 11: 1068. https://doi.org/10.3390/bioengineering11111068
APA StyleSayin, F. S., Erdal, H., Ulger, N. T., Aksu, M. B., & Guncu, M. M. (2024). A Comprehensive Investigation on Catalytic Behavior of Anaerobic Jar Gassing Systems and Design of an Enhanced Cultivation System. Bioengineering, 11(11), 1068. https://doi.org/10.3390/bioengineering11111068