

Use of Surface Electromyography to Estimate End-Point Force in Redundant Systems: Comparison between Linear Approaches
 , , , and
Abstract
1. Introduction
2. Materials and Methods
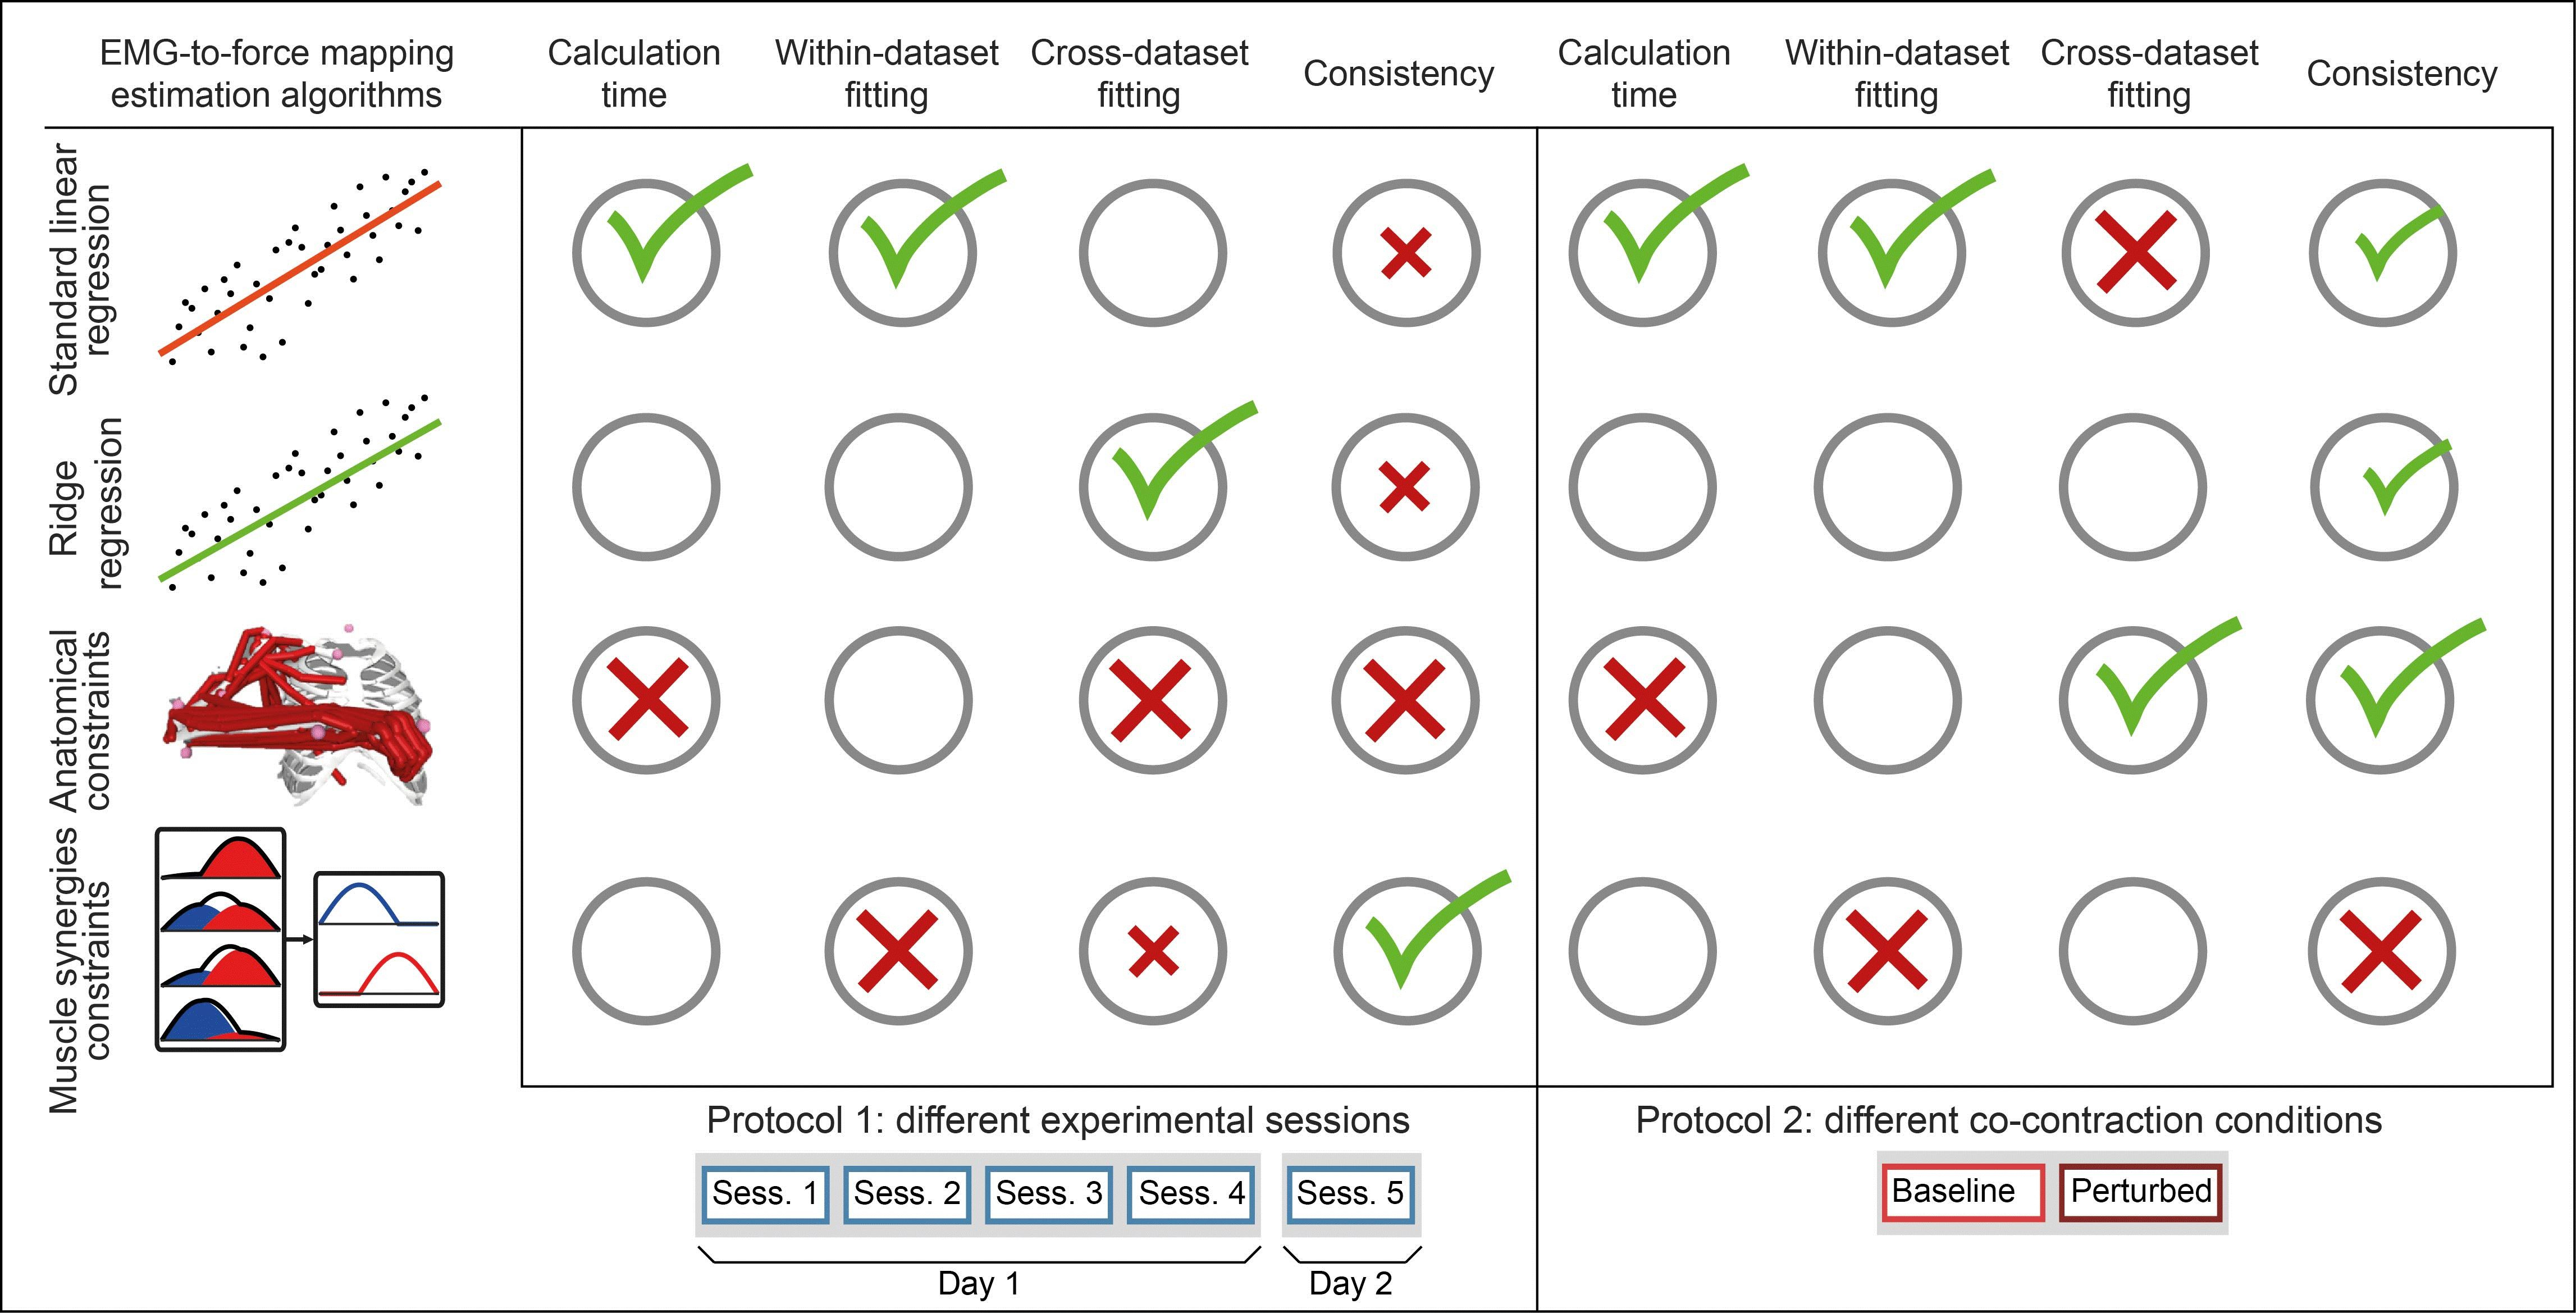
2.1. Participants
2.2. Setup and Protocols
2.2.1. Protocol 1
2.2.2. Protocol 2
2.3. EMG Acquisition
2.4. EMG-to-Force Matrix Estimations
2.4.1. Unconstrained Standard Linear Regression (LR) Approach
2.4.2. Unconstrained Ridge Regression (RR) Approach
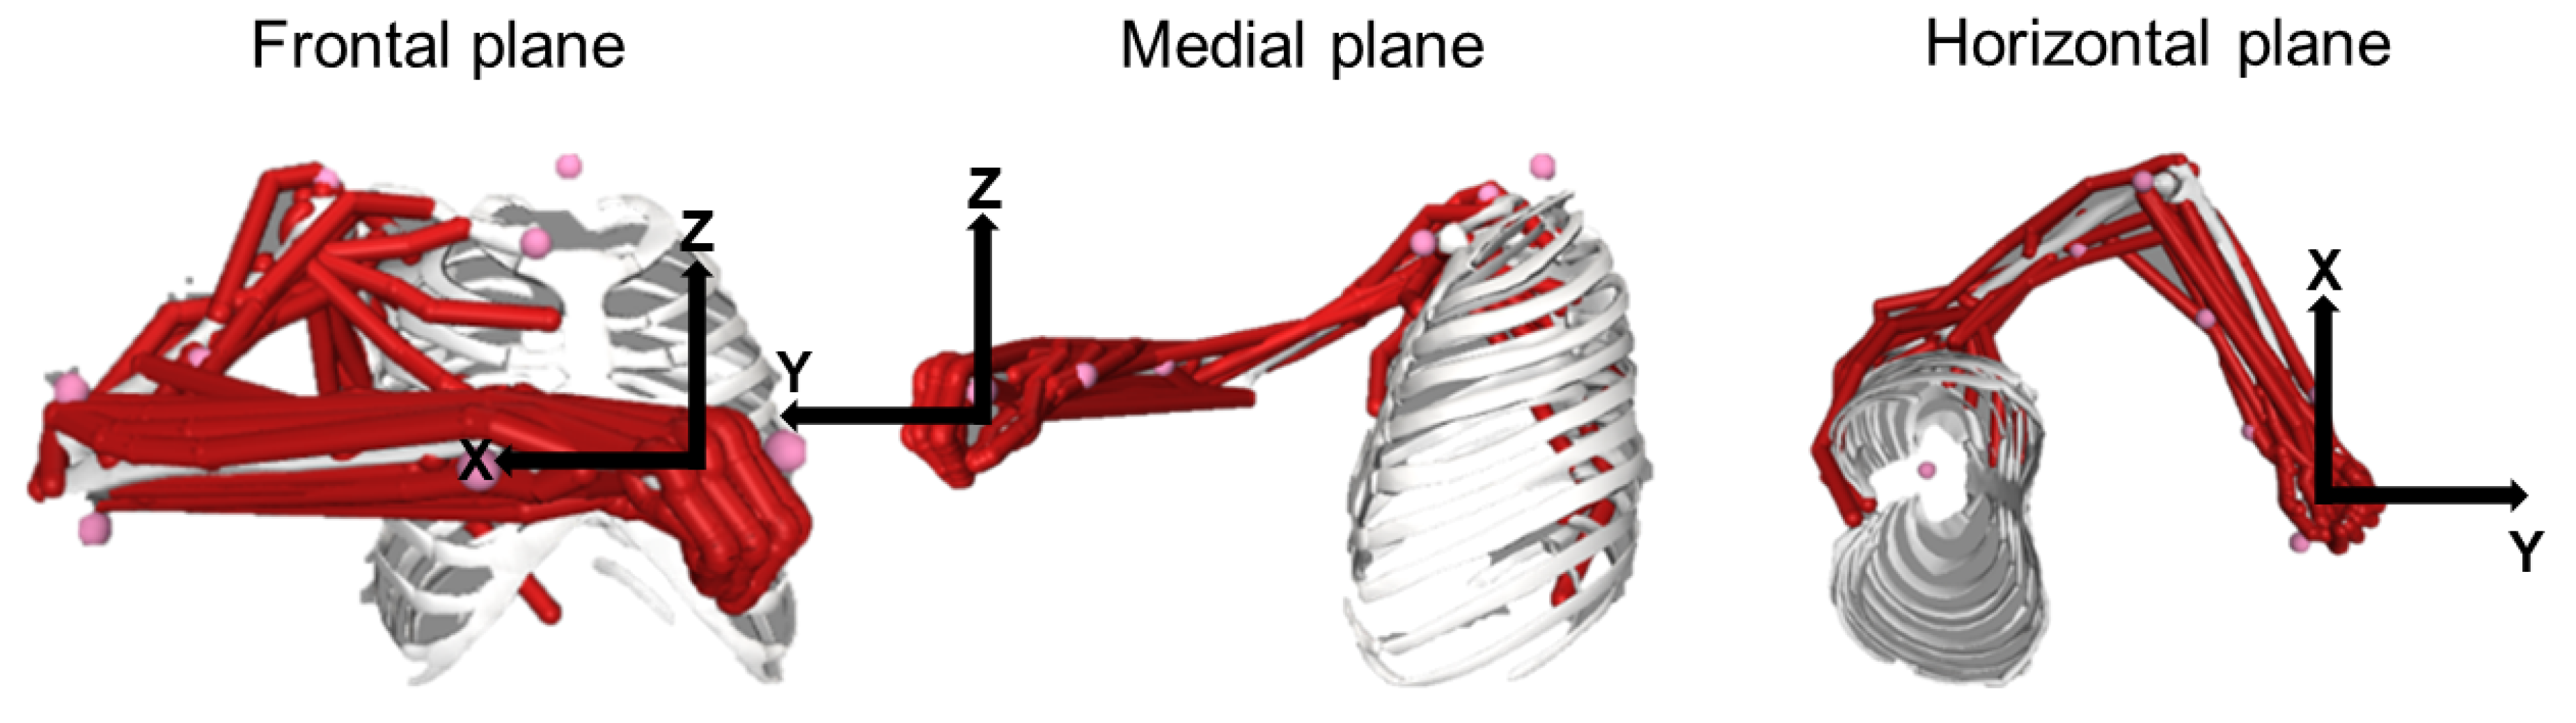
2.4.3. Constrained to Anatomical Musculoskeletal Foreknow Boundaries (Anatomically Constrained, AC) Approach
2.4.4. Degree of Freedom Reduction According to Muscle Synergies (MS) Approach
2.5. Statistics
- Type of fitting,
- Session (protocol 1) or condition (protocol 2),
- Subject
- Type of fitting,
- Session from which the EMG-to-force mapping was extracted,
- Session from which the data were fitted (protocol 1), or whether the mapping was extracted from a perturbed block to fit the baseline block or vice-versa (protocol 2)
- Subject,
- Type of fitting,
- Subject,
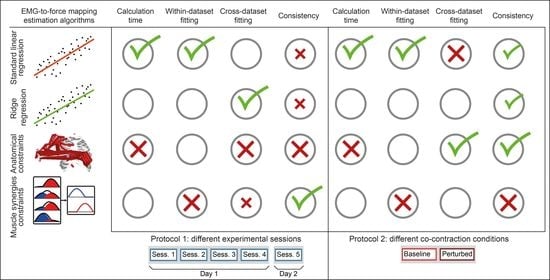
3. Results
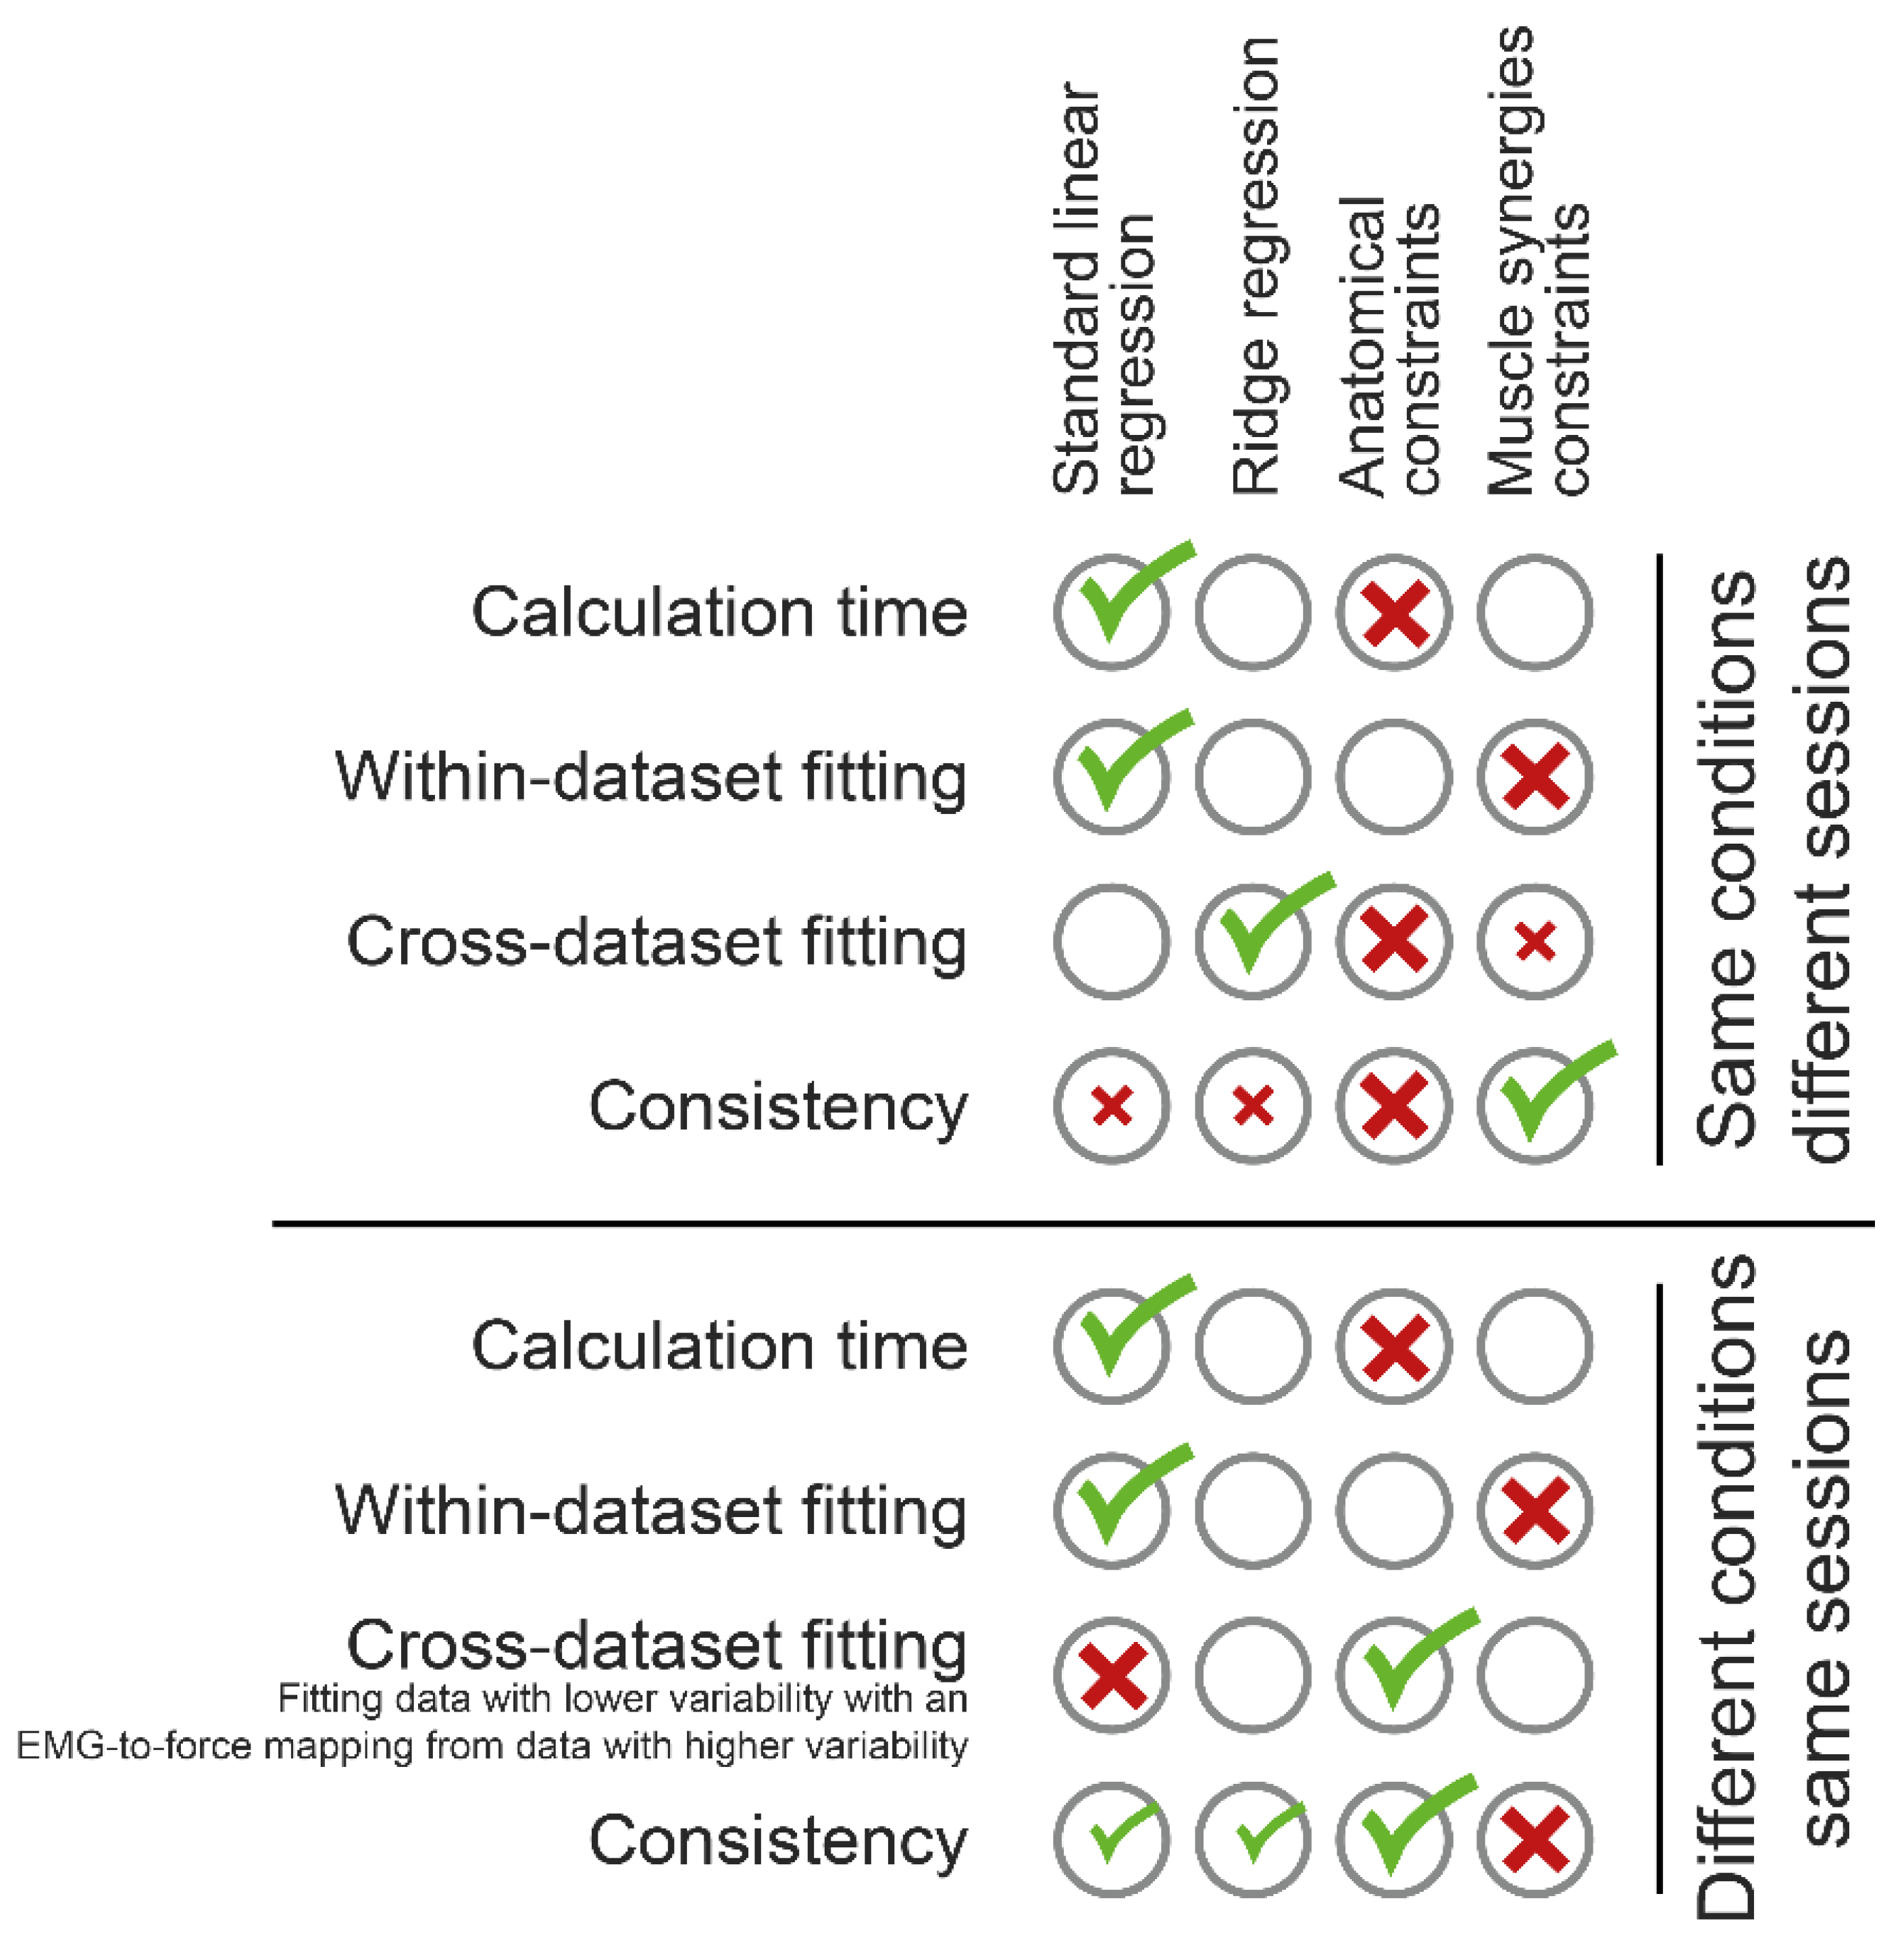
3.1. Computational Time
3.2. Within-Dataset Fitting
3.3. Cross-Dataset Fitting
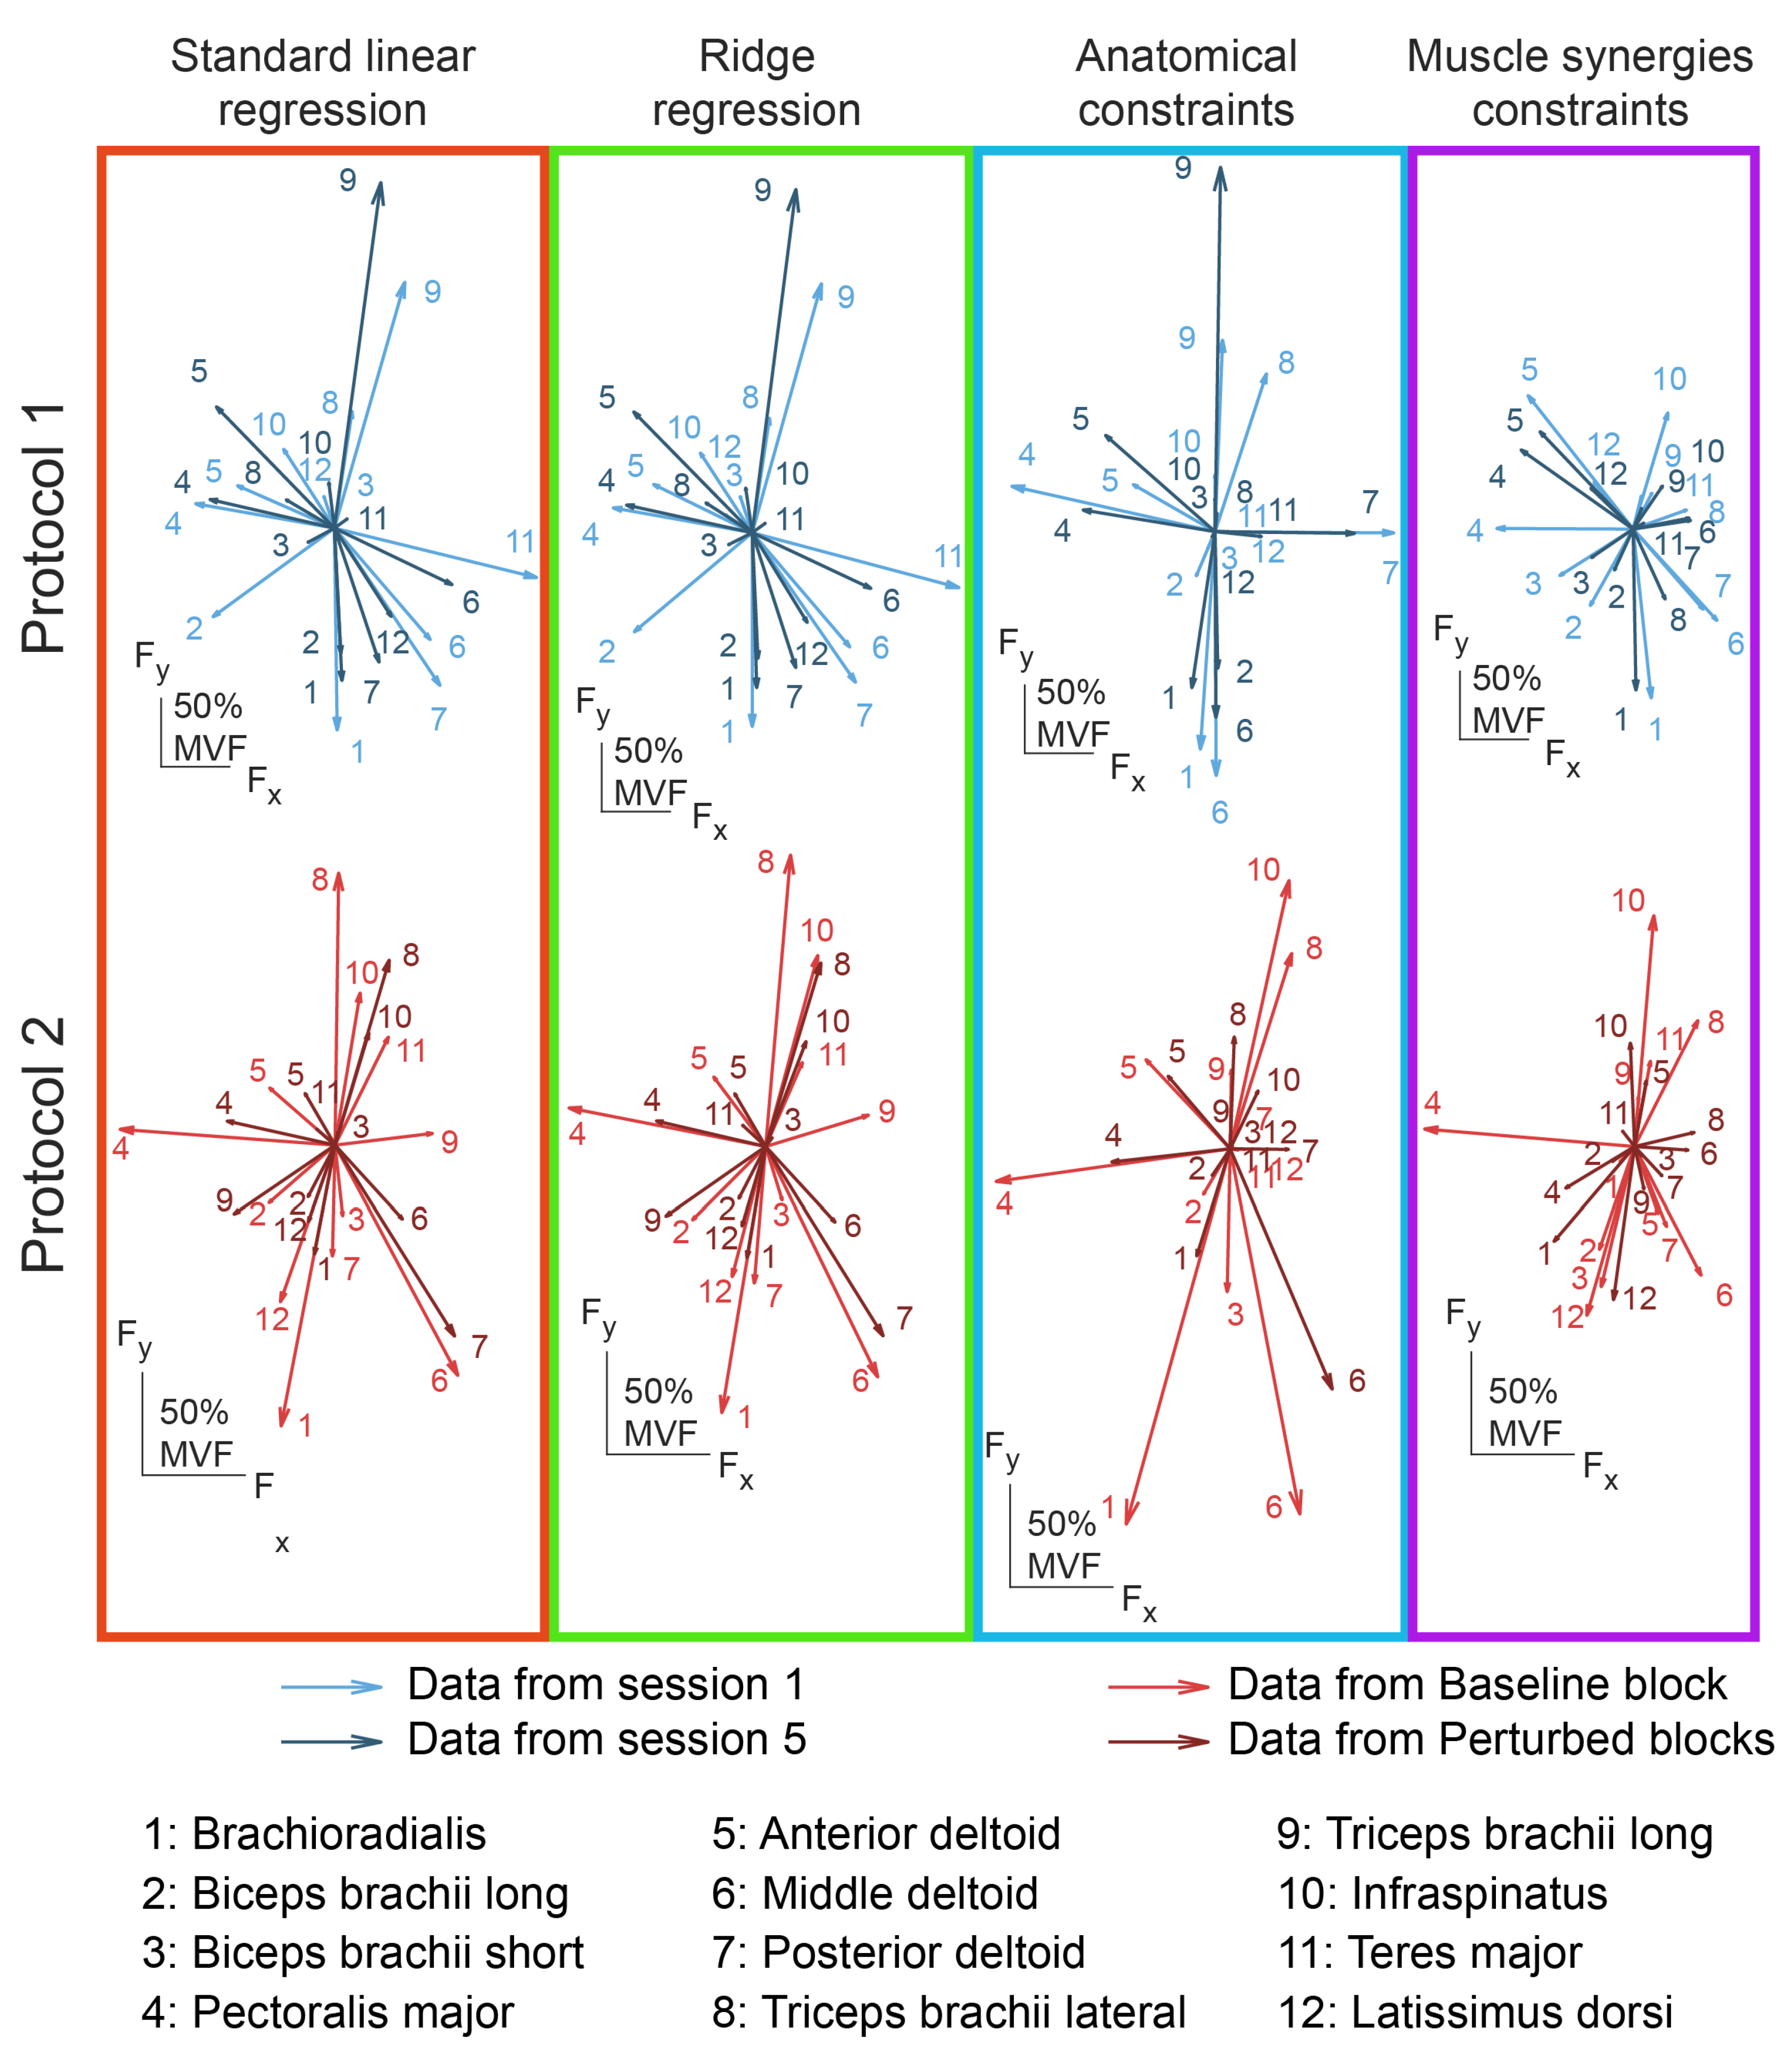
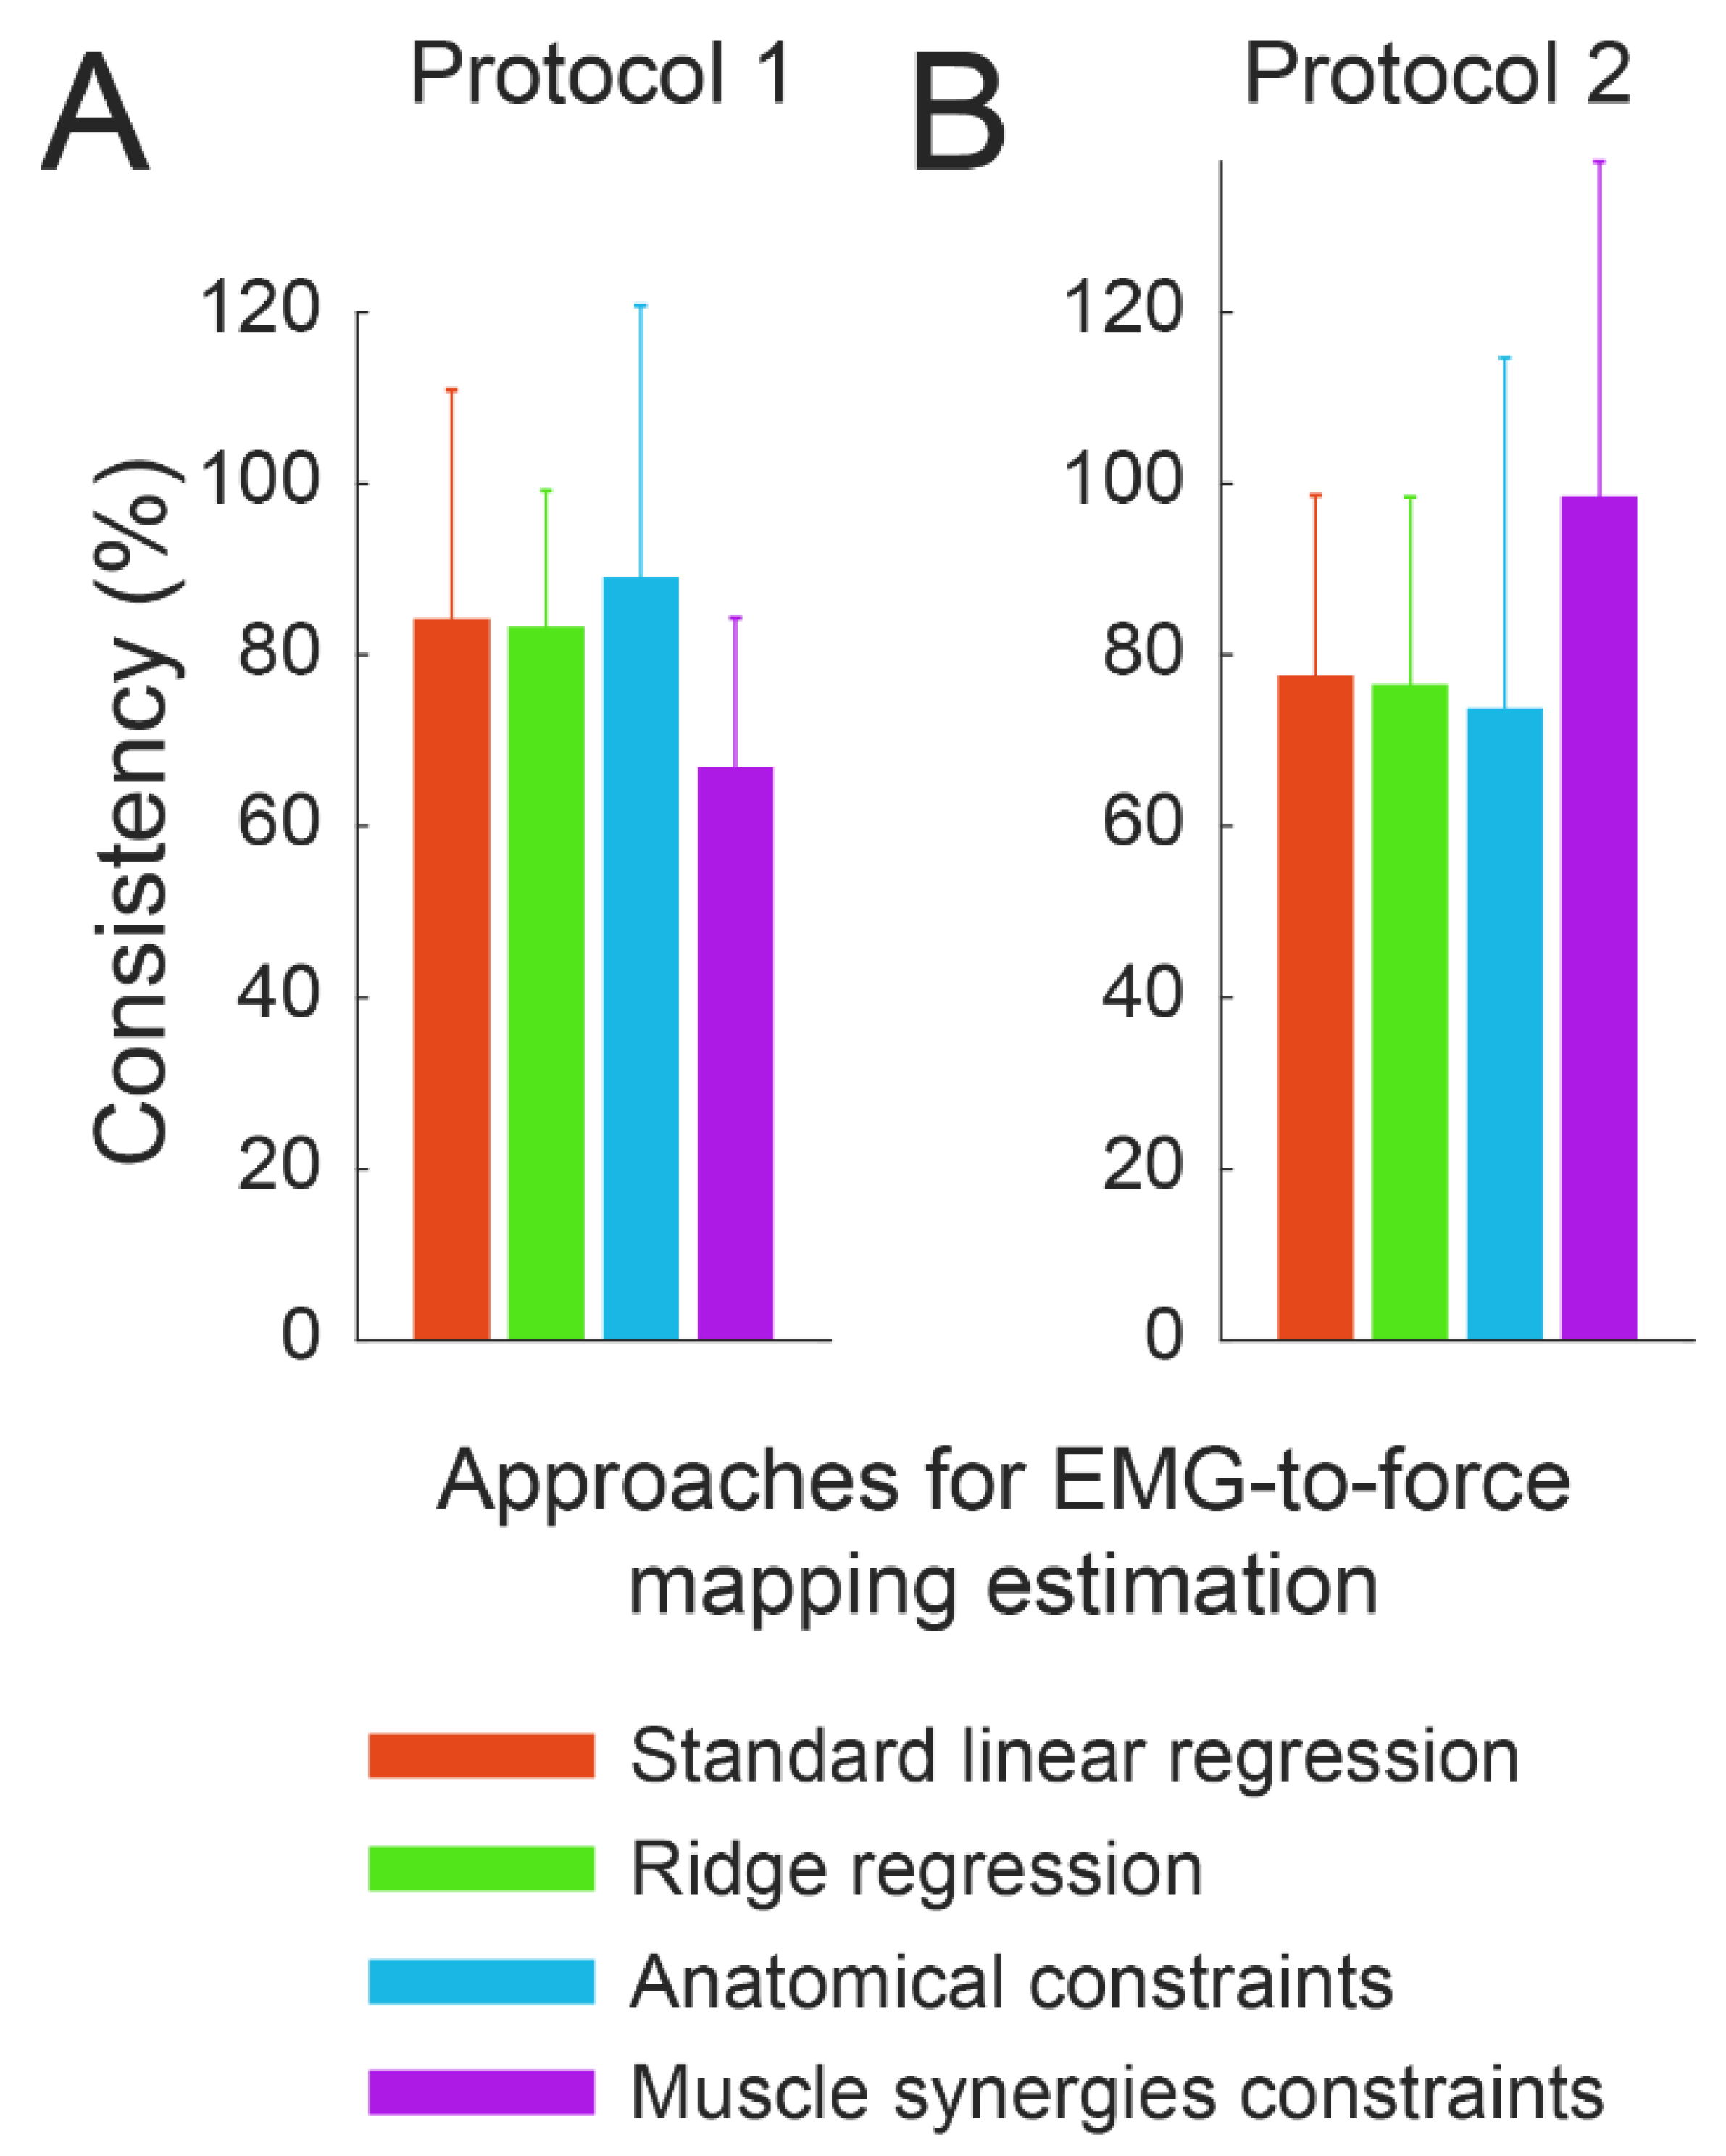
3.4. Consistency
4. Discussion
5. Conclusions
Author Contributions
Funding
Institutional Review Board Statement
Informed Consent Statement
Data Availability Statement
Acknowledgments
Conflicts of Interest
References
- Fernández-Lázaro, D.; Mielgo-Ayuso, J.; Adams, D.P.; González-Bernal, J.J.; Fernández Araque, A.; Cano García, A.; Fernández-Lázaro, C.I. Electromyography: A Simple and Accessible Tool to Assess Physical Performance and Health during Hypoxia Training. A Systematic Review. Sustainability 2020, 12, 9137. [Google Scholar] [CrossRef]
- Howard, B.A.; Dennis, S.P.R.; Harvey, J.P.; William, B.J.; Raymond, T.J. Prosthetic Hand with Improved Control System for Activation by Electromyogram Signals. U.S. Patent No. 3418662, 31 December 1968. [Google Scholar]
- Rosen, J.; Brand, M.; Fuchs, M.B.; Arcan, M. A Myosignal-Based Powered Exoskeleton System. IEEE Trans. Syst. Man Cybern. Part A Syst. Hum. 2001, 31, 210–222. [Google Scholar] [CrossRef]
- Scott, R.N. Myoelectric Control of Prostheses and Orthoses. Bull. Prosthet. Res. 1967, 7, 93. [Google Scholar]
- Toledo-Pérez, D.C.; Rodríguez-Reséndiz, J.; Gómez-Loenzo, R.A. A Study of Computing Zero Crossing Methods and an Improved Proposal for EMG Signals. IEEE Access 2020, 8, 8783–8790. [Google Scholar] [CrossRef]
- Aviles, M.; Sánchez-Reyes, L.-M.; Fuentes-Aguilar, R.Q.; Toledo-Pérez, D.C.; Rodríguez-Reséndiz, J. A Novel Methodology for Classifying EMG Movements Based on SVM and Genetic Algorithms. Micromachines 2022, 13, 2108. [Google Scholar] [CrossRef]
- Toledo-Pérez, D.C.; Rodríguez-Reséndiz, J.; Gómez-Loenzo, R.A.; Jauregui-Correa, J.C. Support Vector Machine-Based EMG Signal Classification Techniques: A Review. Appl. Sci. 2019, 9, 4402. [Google Scholar] [CrossRef]
- Farina, D.; Holobar, A.; Merletti, R.; Enoka, R.M. Decoding the Neural Drive to Muscles from the Surface Electromyogram. Clin. Neurophysiol. 2010, 121, 1616–1623. [Google Scholar] [CrossRef]
- Lunardini, F.; Casellato, C.; d’Avella, A.; Sanger, T.D.; Pedrocchi, A. Robustness and Reliability of Synergy-Based Myocontrol of a Multiple Degree of Freedom Robotic Arm. IEEE Trans. Neural Syst. Rehabil. Eng. 2016, 24, 940–950. [Google Scholar] [CrossRef]
- Hug, F. Can Muscle Coordination Be Precisely Studied by Surface Electromyography? J. Electromyogr. Kinesiol. 2011, 21, 1–12. [Google Scholar] [CrossRef]
- Durandau, G.; Farina, D.; Sartori, M. Robust Real-Time Musculoskeletal Modeling Driven by Electromyograms. IEEE Trans. Biomed. Eng. 2018, 65, 556–564. [Google Scholar] [CrossRef]
- Lotti, N.; Xiloyannis, M.; Missiroli, F.; Bokranz, C.; Chiaradia, D.; Frisoli, A.; Riener, R.; Masia, L. Myoelectric or Force Control? A Comparative Study on a Soft Arm Exosuit. IEEE Trans. Robot. 2022, 38, 1363–1379. [Google Scholar] [CrossRef]
- Gastaldi, L.; Panero, E.; Rosso, V.; Pastorelli, S.; Vieira, T.; Botter, A. Upper Limbs Musculoskeletal OpenSim Model: Customization and Assessment. Mech. Mach. Sci. 2021, 91, 162–170. [Google Scholar] [CrossRef]
- Joshi, S.; Gupta, A. Conceptual Design of an Active Transtibial Prosthesis Based on Expected Joint and Muscle Forces in a Unilateral Transtibial Amputee: A Modelling Study; American Society of Mechanical Engineers Digital Collection: Maynooth, Ireland, 2016. [Google Scholar]
- Raveendranathan, V.; Carloni, R. Musculoskeletal Model of an Osseointegrated Transfemoral Amputee in OpenSim. In Proceedings of the 2020 8th IEEE RAS/EMBS International Conference for Biomedical Robotics and Biomechatronics (BioRob), New York, NY, USA, 29 November–1 December 2020; pp. 1196–1201. [Google Scholar]
- Berger, D.J.; Gentner, R.; Edmunds, T.; Pai, D.K.; D’Avella, A. Differences in Adaptation Rates after Virtual Surgeries Provide Direct Evidence for Modularity. J. Neurosci. 2013, 33, 12384–12394. [Google Scholar] [CrossRef]
- Laursen, B.; Jensen, B.R.; Németh, G.; Sjøgaard, G. A Model Predicting Individual Shoulder Muscle Forces Based on Relationship between Electromyographic and 3D External Forces in Static Position. J. Biomech. 1998, 31, 731–739. [Google Scholar] [CrossRef] [PubMed]
- Lotti, N.; Sanguineti, V. EMG-Driven Force Fields: Toward a Myoprocessor for ‘Virtual Biomechanics’. In Proceedings of the International Conference on NeuroRehabilitation, Pisa, Italy, 16–20 October 2018; Springer: Cham, Switzerland, 2018; pp. 1161–1165. [Google Scholar]
- Markovic, M.; Schweisfurth, M.A.; Engels, L.F.; Farina, D.; Dosen, S. Myocontrol Is Closed-Loop Control: Incidental Feedback Is Sufficient for Scaling the Prosthesis Force in Routine Grasping. J. Neuroeng. Rehabil. 2018, 15, 81. [Google Scholar] [CrossRef]
- Berger, D.J.; Borzelli, D.; d’Avella, A. Task Space Exploration Improves Adaptation after Incompatible Virtual Surgeries. J. Neurophysiol. 2022, 127, 1127–1146. [Google Scholar] [CrossRef]
- Borzelli, D.; Berger, D.J.; Pai, D.K.; D’Avella, A. Effort Minimization and Synergistic Muscle Recruitment for Three-Dimensional Force Generation. Front. Comput. Neurosci. 2013, 7, 186. [Google Scholar] [CrossRef] [PubMed]
- Merletti, R.; Farina, D. Surface Electromyography: Physiology, Engineering and Applications; John Wiley & Sons: Hoboken, NJ, USA, 2016; ISBN 9781119082934. [Google Scholar]
- Slinker, B.K.; Glantz, S.A. Multiple Regression for Physiological Data Analysis: The Problem of Multicollinearity. Am. J. Physiol.-Regul. Integr. Comp. Physiol. 1985, 249, R1–R12. [Google Scholar] [CrossRef] [PubMed]
- Mesin, L. Crosstalk in Surface Electromyogram: Literature Review and Some Insights. Phys. Eng. Sci. Med. 2020, 43, 481–492. [Google Scholar] [CrossRef]
- D’Avella, A.; Portone, A.; Fernandez, L.; Lacquaniti, F. Control of Fast-Reaching Movements by Muscle Synergy Combinations. J. Neurosci. 2006, 26, 7791–7810. [Google Scholar] [CrossRef]
- Overduin, S.A.; D’Avella, A.; Roh, J.; Bizzi, E. Modulation of Muscle Synergy Recruitment in Primate Grasping. J. Neurosci. Off. J. Soc. Neurosci. 2008, 28, 880–892. [Google Scholar] [CrossRef] [PubMed]
- Tresch, M.C.; Bizzi, E. Responses to Spinal Microstimulation in the Chronically Spinalized Rat and Their Relationship to Spinal Systems Activated by Low Threshold Cutaneous Stimulation. Exp. Brain Res. 1999, 129, 401–416. [Google Scholar] [CrossRef] [PubMed]
- De Luca, C.J.; Erim, Z. Common Drive in Motor Units of a Synergistic Muscle Pair. J. Neurophysiol. 2002, 87, 2200–2204. [Google Scholar] [CrossRef]
- Laine, C.M.; Martinez-Valdes, E.; Falla, D.; Mayer, F.; Farina, D. Motor Neuron Pools of Synergistic Thigh Muscles Share Most of Their Synaptic Input. J. Neurosci. 2015, 35, 12207–12216. [Google Scholar] [CrossRef]
- Martinez-Valdes, E.; Negro, F.; Falla, D.; De Nunzio, A.M.; Farina, D. Surface Electromyographic Amplitude Does Not Identify Differences in Neural Drive to Synergistic Muscles. J. Appl. Physiol. 2018, 124, 1071–1079. [Google Scholar] [CrossRef]
- De Luca, C.J.; Mambrito, B. Voluntary Control of Motor Units in Human Antagonist Muscles: Coactivation and Reciprocal Activation. J. Neurophysiol. 1987, 58, 525–542. [Google Scholar] [CrossRef] [PubMed]
- Del Vecchio, A.; Germer, C.M.; Elias, L.A.; Fu, Q.; Fine, J.; Santello, M.; Farina, D. The Human Central Nervous System Transmits Common Synaptic Inputs to Distinct Motor Neuron Pools during Non-synergistic Digit Actions. J. Physiol. 2019, 597, 5935–5948. [Google Scholar] [CrossRef]
- Ohtsuka, H.; Nakajima, T.; Komiyama, T.; Suzuki, S.; Irie, S.; Ariyasu, R. Execution of Natural Manipulation in the Air Enhances the Beta-Rhythm Intermuscular Coherences of the Human Arm Depending on Muscle Pairs. J. Neurophysiol. 2022, 127, 946–957. [Google Scholar] [CrossRef] [PubMed]
- Borzelli, D.; Vieira, T.M.M.; Botter, A.; Gazzoni, M.; Lacquaniti, F.; d’Avella, A. Independent Synaptic Inputs to Motor Neurons Driving Antagonist Muscles. bioRxiv 2022. [Google Scholar] [CrossRef]
- Tu, Y.-K.; Clerehugh, V.; Gilthorpe, M.S. Collinearity in Linear Regression Is a Serious Problem in Oral Health Research. Eur. J. Oral Sci. 2004, 112, 389–397. [Google Scholar] [CrossRef]
- Hoerl, A.E.; Kennard, R.W. Ridge Regression: Biased Estimation for Nonorthogonal Problems. Technometrics 1970, 12, 55–67. [Google Scholar] [CrossRef]
- Borzelli, D.; d’Avella, A.; Gurgone, S.; Gastaldi, L. Unconstrained and Constrained Estimation of a Linear EMG-to-Force Mapping during Isometric Force Generation. In Proceedings of the 2022 IEEE International Symposium on Medical Measurements and Applications (MeMeA), Giardini Naxos, Taormina, Italy, 22–24 June 2022; pp. 1–6. [Google Scholar]
- Dormann, C.F.; Elith, J.; Bacher, S.; Buchmann, C.; Carl, G.; Carré, G.; Marquéz, J.R.G.; Gruber, B.; Lafourcade, B.; Leitão, P.J.; et al. Collinearity: A Review of Methods to Deal with It and a Simulation Study Evaluating Their Performance. Ecography 2013, 36, 27–46. [Google Scholar] [CrossRef]
- Delp, S.L.; Anderson, F.C.; Arnold, A.S.; Loan, P.; Habib, A.; John, C.T.; Guendelman, E.; Thelen, D.G. OpenSim: Open-Source Software to Create and Analyze Dynamic Simulations of Movement. IEEE Trans. Biomed. Eng. 2007, 54, 1940–1950. [Google Scholar] [CrossRef] [PubMed]
- Borzelli, D.; Gurgone, S.; De Pasquale, P.; Berger, D.J.; d’Avella, A. Consistency of Myoelectric Control Across Multiple Sessions. In Proceedings of the Converging Clinical and Engineering Research on Neurorehabilitation III, Pisa, Italy, 16–20 October 2018; Masia, L., Micera, S., Akay, M., Pons, J.L., Eds.; Springer International Publishing: Cham, Switzerland, 2019; pp. 1166–1170. [Google Scholar]
- Borzelli, D.; Cesqui, B.; Berger, D.J.; Burdet, E.; D’Avella, A. Muscle Patterns Underlying Voluntary Modulation of Co-Contraction. PLoS ONE 2018, 13, e0205911. [Google Scholar] [CrossRef] [PubMed]
- Borzelli, D.; Pastorelli, S.; d’Avella, A.; Gastaldi, L. Virtual Stiffness: A Novel Biomechanical Approach to Estimate Limb Stiffness of a Multi-Muscle and Multi-Joint System. Sensors 2023, 23, 673. [Google Scholar] [CrossRef] [PubMed]
- Borzelli, D.; Pastorelli, S.P.; Gastaldi, L. A Novel Model for Estimating the Endpoint Stiffness of a Limb. In Proceedings of the 2022 IEEE International Symposium on Medical Measurements and Applications (MeMeA), Giardini Naxos, Taormina, Italy, 22–24 June 2022; pp. 1–6. [Google Scholar]
- Saul, K.R.; Hu, X.; Goehler, C.M.; Vidt, M.E.; Daly, M.; Velisar, A.; Murray, W.M. Benchmarking of Dynamic Simulation Predictions in Two Software Platforms Using an Upper Limb Musculoskeletal Model. Comput. Methods Biomech. Biomed. Eng. 2015, 18, 1445–1458. [Google Scholar] [CrossRef]
- Hermens, H.J.; Freriks, B.; Merletti, R.; Stegeman, D.; Blok, J.; Rau, G.; Disselhorst-Klug, C.; Hägg, G. European Recommendations for Surface ElectroMyoGraphy Results of the SENIAM Project; Roessingh Research and Development b.v.: Enschede, The Netherlands, 1999. [Google Scholar]
- Kendall, F.P.; Kendall McCreary, E.; Geise Provance, P.; McIntyre Rodgers, M.; Romani, W.A. Muscles: Testing and Function with Posture and Pain; Lippincott, Williams & Wilkins: Baltimore, MD, USA, 2005; Volume 5. [Google Scholar]
- Hof, A.L. The Relationship between Electromyogram and Muscle Force. Sport. Sportschaden 1997, 11, 79–86. [Google Scholar] [CrossRef]
- Woods, J.J.; Bigland-Ritchie, B. Linear and Non-Linear Surface Emg/Force Relationships in Human Muscles: An Anatomical/Functional Argument for the Existence of Both. Am. J. Phys. Med. Rehabil. 1983, 62, 287–299. [Google Scholar]
- Hilt, D.E.; Seegrist, D.W. Ridge, a Computer Program for Calculating Ridge Regression Estimates; Department of Agriculture, Forest Service, Northeastern Forest Experiment Station: New York, NY, USA, 1977. [Google Scholar]
- Hoerl, A.E.; Kennard, R.W. Ridge Regression: Applications to Nonorthogonal Problems. Technometrics 1970, 12, 69–82. [Google Scholar] [CrossRef]
- Guilkey, D.K.; Murphy, J.L. Directed Ridge Regression Techniques in Cases of Multicollinearity. J. Am. Stat. Assoc. 1975, 70, 769–775. [Google Scholar] [CrossRef]
- Schreiber-Gregory, D.N. Ridge Regression and Multicollinearity: An in-Depth Review. Model Assist. Stat. Appl. 2018, 13, 359–365. [Google Scholar] [CrossRef]
- Barre, A.; Armand, S. Biomechanical ToolKit: Open-Source Framework to Visualize and Process Biomechanical Data. Comput. Methods Programs Biomed. 2014, 114, 80–87. [Google Scholar] [CrossRef] [PubMed]
- Chapman, M.P.; Rotella, M.F.; Okamura, A.M. Position and Velocity Cursor Mappings Contribute to Distinct Muscle Forces in Simulated Isometric and Movement Reaching. In Proceedings of the IEEE RAS and EMBS International Conference on Biomedical Robotics and Biomechatronics, Sao Paulo, Brazil, 12–15 August 2014; pp. 597–603. [Google Scholar] [CrossRef]
- Holzbaur, K.R.S.; Murray, W.M.; Delp, S.L. A Model of the Upper Extremity for Simulating Musculoskeletal Surgery and Analyzing Neuromuscular Control. Ann. Biomed. Eng. 2005, 33, 829–840. [Google Scholar] [CrossRef] [PubMed]
- Torres-Oviedo, G.; Ting, L.H. Muscle Synergies Characterizing Human Postural Responses. J. Neurophysiol. 2007, 98, 2144–2156. [Google Scholar] [CrossRef] [PubMed]
- Ting, L.H.; Macpherson, J.M. A Limited Set of Muscle Synergies for Force Control during a Postural Task. J. Neurophysiol. 2005, 93, 609–613. [Google Scholar] [CrossRef]
- Ivanenko, Y.P.; Poppele, R.E.; Lacquaniti, F. Five Basic Muscle Activation Patterns Account for Muscle Activity during Human Locomotion. J. Physiol. 2004, 556, 267–282. [Google Scholar] [CrossRef]
- Dominici, N.; Ivanenko, Y.P.; Cappellini, G.; d’Avella, A.; Mondì, V.; Cicchese, M.; Fabiano, A.; Silei, T.; Di Paolo, A.; Giannini, C.; et al. Locomotor Primitives in Newborn Babies and Their Development. Science 2011, 334, 997–999. [Google Scholar] [CrossRef]
- Rimini, D.; Agostini, V.; Knaflitz, M. Intra-Subject Consistency during Locomotion: Similarity in Shared and Subject-Specific Muscle Synergies. Front. Hum. Neurosci. 2017, 11, 586. [Google Scholar] [CrossRef]
- Gentner, R.; Edmunds, T.; Pai, D.K.; d’Avella, A. Robustness of Muscle Synergies during Visuomotor Adaptation. Front. Comput. Neurosci. 2013, 7, 120. [Google Scholar] [CrossRef]
- Bizzi, E.; Cheung, V.C.K. The Neural Origin of Muscle Synergies. Front. Comput. Neurosci. 2013, 7, 51. [Google Scholar] [CrossRef]
- Cheung, V.C.K.; Seki, K. Approaches to Revealing the Neural Basis of Muscle Synergies: A Review and a Critique. J. Neurophysiol. 2021, 125, 1580–1597. [Google Scholar] [CrossRef] [PubMed]
- Overduin, S.A.; d’Avella, A.; Carmena, J.M.; Bizzi, E. Microstimulation Activates a Handful of Muscle Synergies. Neuron 2012, 76, 1071–1077. [Google Scholar] [CrossRef] [PubMed]
- Tresch, M.C.; Jarc, A. The Case for and against Muscle Synergies. Curr. Opin. Neurobiol. 2009, 19, 601–607. [Google Scholar] [CrossRef]
- Borzelli, D.; Pastorelli, S.; Gastaldi, L. Elbow Musculoskeletal Model for Industrial Exoskeleton with Modulated Impedance Based on Operator’s Arm Stiffness. Int. J. Autom. Technol. 2017, 11, 442–449. [Google Scholar] [CrossRef]
- Borzelli, D.; Burdet, E.; Pastorelli, S.; d’Avella, A.; Gastaldi, L. Identification of the Best Strategy to Command Variable Stiffness Using Electromyographic Signals. J. Neural Eng. 2020, 17, 016058. [Google Scholar] [CrossRef] [PubMed]
- Kawamoto, H.; Kanbe, S.; Sankai, Y. Power Assist Method for HAL-3 Estimating Operator’s Intention Based on Motion Information. In Proceedings of the 12th IEEE International Workshop on Robot and Human Interactive Communication (ROMAN), Millbrae, CA, USA, 2 November 2003; pp. 67–72. [Google Scholar]
- Osu, R.; Gomi, H. Multijoint Muscle Regulation Mechanisms Examined by Measured Human Arm Stiffness and EMG Signals. J. Neurophysiol. 1999, 81, 1458–1468. [Google Scholar] [CrossRef]
- Lee, D.D.; Seung, H.S. Learning the Parts of Objects by Non-Negative Matrix Factorization. Nature 1999, 401, 788–791. [Google Scholar] [CrossRef]
- Gallegos-Duarte, M.; Mendiola-Santibañez, J.D.; Ibrahimi, D.; Paredes-Orta, C.; Rodríguez-Reséndiz, J.; González-Gutiérrez, C.A. A Novel Method for Measuring Subtle Alterations in Pupil Size in Children With Congenital Strabismus. IEEE Access 2020, 8, 125331–125344. [Google Scholar] [CrossRef]
- Zamora-Antuñano, M.A.; Cruz-Salinas, J.; Rodríguez-Reséndiz, J.; González-Gutiérrez, C.A.; Méndez-Lozano, N.; Paredes-García, W.J.; Altamirano-Corro, J.A.; Gaytán-Díaz, J.A. Statistical Analysis and Data Envelopment Analysis to Improve the Efficiency of Manufacturing Process of Electrical Conductors. Appl. Sci. 2019, 9, 3965. [Google Scholar] [CrossRef]
- Artemiadis, P. EMG-Based Robot Control Interfaces: Past, Present and Future. Adv. Robot. Autom. 2012, 1, e107. [Google Scholar] [CrossRef]
- Igual, C.; Pardo, L.A.; Hahne, J.M.; Igual, J. Myoelectric Control for Upper Limb Prostheses. Electronics 2019, 8, 1244. [Google Scholar] [CrossRef]
- Parajuli, N.; Sreenivasan, N.; Bifulco, P.; Cesarelli, M.; Savino, S.; Niola, V.; Esposito, D.; Hamilton, T.J.; Naik, G.R.; Gunawardana, U.; et al. Real-Time EMG Based Pattern Recognition Control for Hand Prostheses: A Review on Existing Methods, Challenges and Future Implementation. Sensors 2019, 19, 4596. [Google Scholar] [CrossRef]
- Parker, P.A.; Scott, R.N. Myoelectric Control of Prostheses. Crit. Rev. Biomed. Eng. 1986, 13, 283–310. [Google Scholar] [PubMed]
- Nasr, A.; Laschowski, B.; McPhee, J. Myoelectric Control of Robotic Leg Prostheses and Exoskeletons: A Review. In Proceedings of the ASME 2021 International Design Engineering Technical Conferences and Computers and Information in Engineering Conference, Virtual, Online, 17–19 August 2021; American Society of Mechanical Engineers Digital Collection: New York, NY, USA, 2021. [Google Scholar]
- Singh, R.M.; Chatterji, S.; Kumar, A. A Review on Surface EMG Based Control Schemes of Exoskeleton Robot in Stroke Rehabilitation. In Proceedings of the 2013 International Conference on Machine Intelligence Research and Advancement, ICMIRA 2013, Katra, India, 21–23 December 2013; pp. 310–315. [Google Scholar]
- Gurgone, S.; Borzelli, D.; de Pasquale, P.; Berger, D.J.; Baldi, T.L.; D’Aurizio, N.; Prattichizzo, D.; d’Avella, A. Simultaneous Control of Natural and Extra Degrees of Freedom by Isometric Force and Electromyographic Activity in the Muscle-to-Force Null Space. J. Neural Eng. 2022, 19, 016004. [Google Scholar] [CrossRef] [PubMed]
- Gurgone, S.; Borzelli, D.; De Pasquale, P.; Berger, D.J.; Lisini Baldi, T.; D’Aurizio, N.; Prattichizzo, D.; D’Avella, A. Simultaneous Control of Natural and Extra Degrees-of-Freedom by Isometric Force and EMG Null Space Activation. In Converging Clinical and Engineering Research on Neurorehabilitation IV; Torricelli, D., Akay, M., Pons, J.L., Eds.; Springer International Publishing: Cham, Switzerland, 2022; pp. 863–868. [Google Scholar]
- Ying, X. An Overview of Overfitting and Its Solutions. J. Phys. Conf. Ser. 2019, 1168, 022022. [Google Scholar] [CrossRef]
- Bizzi, E.; Cheung, V.C.K.; d’Avella, A.; Saltiel, P.; Tresch, M. Combining Modules for Movement. Brain Res. Rev. 2008, 57, 125–133. [Google Scholar] [CrossRef]
- Haruno, M.; Ganesh, G.; Burdet, E.; Kawato, M. Differential Neural Correlates of Reciprocal Activation and Cocontraction Control in Dorsal and Ventral Premotor Cortices. J. Neurophysiol. 2012, 107, 126–133. [Google Scholar] [CrossRef]
- Nielsen, J.; Petersen, N.; Deuschl, G.; Ballegaard, M. Task-Related Changes in the Effect of Magnetic Brain Stimulation on Spinal Neurones in Man. J. Physiol. 1993, 471, 223–243. [Google Scholar] [CrossRef]
- Coscia, M.; Tropea, P.; Monaco, V.; Micera, S. Chapter 23—Muscle Synergies Approach and Perspective on Application to Robot-Assisted Rehabilitation. In Rehabilitation Robotics; Colombo, R., Sanguineti, V., Eds.; Academic Press: Cambridge, MA, USA, 2018; pp. 319–331. ISBN 978-0-12-811995-2. [Google Scholar]
- Hong, Y.N.G.; Ballekere, A.N.; Fregly, B.J.; Roh, J. Are Muscle Synergies Useful for Stroke Rehabilitation? Curr. Opin. Biomed. Eng. 2021, 19, 100315. [Google Scholar] [CrossRef]
- Berger, D.J.; Masciullo, M.; Molinari, M.; Lacquaniti, F.; d’Avella, A. Does the Cerebellum Shape the Spatiotemporal Organization of Muscle Patterns? Insights from Subjects with Cerebellar Ataxias. J. Neurophysiol. 2020, 123, 1691–1710. [Google Scholar] [CrossRef]
- Jonsdottir, J.; Lencioni, T.; Gervasoni, E.; Crippa, A.; Anastasi, D.; Carpinella, I.; Rovaris, M.; Cattaneo, D.; Ferrarin, M. Improved Gait of Persons With Multiple Sclerosis After Rehabilitation: Effects on Lower Limb Muscle Synergies, Push-Off, and Toe-Clearance. Front. Neurol. 2020, 11, 668. [Google Scholar] [CrossRef] [PubMed]
- Cheung, V.C.K.; Zheng, X.-C.; Cheung, R.T.H.; Chan, R.H.M. Modulating the Structure of Motor Variability for Skill Learning Through Specific Muscle Synergies in Elderlies and Young Adults. IEEE Open J. Eng. Med. Biol. 2020, 1, 33–40. [Google Scholar] [CrossRef] [PubMed]
- Kargo, W.J.; Nitz, D.A. Early Skill Learning Is Expressed through Selection and Tuning of Cortically Represented Muscle Synergies. J. Neurosci. 2003, 23, 11255–11269. [Google Scholar] [CrossRef] [PubMed]
- Latash, M.L. Stages in Learning Motor Synergies: A View Based on the Equilibrium-Point Hypothesis. Hum. Mov. Sci. 2010, 29, 642–654. [Google Scholar] [CrossRef]
- Zeng, A.; Song, S.; Welker, S.; Lee, J.; Rodriguez, A.; Funkhouser, T. Learning Synergies Between Pushing and Grasping with Self-Supervised Deep Reinforcement Learning. In Proceedings of the 2018 IEEE/RSJ International Conference on Intelligent Robots and Systems (IROS), Madrid, Spain, 1–5 October 2018; pp. 4238–4245. [Google Scholar]
- Nissler, C.; Nowak, M.; Connan, M.; Büttner, S.; Vogel, J.; Kossyk, I.; Márton, Z.-C.; Castellini, C. VITA—An Everyday Virtual Reality Setup for Prosthetics and Upper-Limb Rehabilitation. J. Neural Eng. 2019, 16, 026039. [Google Scholar] [CrossRef]
- Hug, F.; Turpin, N.A.; Couturier, A.; Dorel, S. Consistency of Muscle Synergies during Pedaling across Different Mechanical Constraints. J. Neurophysiol. 2011, 106, 91–103. [Google Scholar] [CrossRef]
- Saito, A.; Tomita, A.; Ando, R.; Watanabe, K.; Akima, H. Muscle Synergies Are Consistent across Level and Uphill Treadmill Running. Sci. Rep. 2018, 8, 5979. [Google Scholar] [CrossRef] [PubMed]
- Torres-Oviedo, G.; Ting, L.H. Subject-Specific Muscle Synergies in Human Balance Control Are Consistent Across Different Biomechanical Contexts. J. Neurophysiol. 2010, 103, 3084–3098. [Google Scholar] [CrossRef]
- Kutch, J.J.; Valero-Cuevas, F.J. Challenges and New Approaches to Proving the Existence of Muscle Synergies of Neural Origin. PLoS Comput. Biol. 2012, 8, e1002434. [Google Scholar] [CrossRef]
- Inouye, J.M.; Valero-Cuevas, F.J. Muscle Synergies Heavily Influence the Neural Control of Arm Endpoint Stiffness and Energy Consumption. PLoS Comput. Biol. 2016, 12, e1004737. [Google Scholar] [CrossRef]
- Kutch, J.J.; Kuo, A.D.; Bloch, A.M.; Rymer, W.Z. Endpoint Force Fluctuations Reveal Flexible Rather Than Synergistic Patterns of Muscle Cooperation. J. Neurophysiol. 2008, 100, 2455–2471. [Google Scholar] [CrossRef] [PubMed]
- Hikosaka, O.; Nakamura, K.; Sakai, K.; Nakahara, H. Central Mechanisms of Motor Skill Learning. Curr. Opin. Neurobiol. 2002, 12, 217–222. [Google Scholar] [CrossRef] [PubMed]
- Ivanenko, Y.P.; Dominici, N.; Daprati, E.; Nico, D.; Cappellini, G.; Lacquaniti, F. Locomotor Body Scheme. Hum. Mov. Sci. 2011, 30, 341–351. [Google Scholar] [CrossRef] [PubMed]
- Krakauer, J.W.; Hadjiosif, A.M.; Xu, J.; Wong, A.L.; Haith, A.M. Motor Learning. Compr. Physiol. 2019, 9, 613–663. [Google Scholar] [CrossRef]
- Mitchell, A.W. Theories of Body Scheme Development. Phys. Occup. Ther. Pediatr. 1998, 17, 25–45. [Google Scholar] [CrossRef]
- Schwartz, R.K.; Reilly, M.A. Learning Tool Use: Body Scheme Recalibration and the Development of Hand Skill. Occup. Ther. J. Res. 1981, 1, 13–29. [Google Scholar] [CrossRef]
- Ranaldi, S.; Corvini, G.; De Marchis, C.; Conforto, S. The Influence of the SEMG Amplitude Estimation Technique on the EMG–Force Relationship. Sensors 2022, 22, 3972. [Google Scholar] [CrossRef]


Disclaimer/Publisher’s Note: The statements, opinions and data contained in all publications are solely those of the individual author(s) and contributor(s) and not of MDPI and/or the editor(s). MDPI and/or the editor(s) disclaim responsibility for any injury to people or property resulting from any ideas, methods, instructions or products referred to in the content. |
© 2023 by the authors. Licensee MDPI, Basel, Switzerland. This article is an open access article distributed under the terms and conditions of the Creative Commons Attribution (CC BY) license (https://creativecommons.org/licenses/by/4.0/).
Share and Cite
Borzelli, D.; Gurgone, S.; De Pasquale, P.; Lotti, N.; d’Avella, A.; Gastaldi, L. Use of Surface Electromyography to Estimate End-Point Force in Redundant Systems: Comparison between Linear Approaches. Bioengineering 2023, 10, 234. https://doi.org/10.3390/bioengineering10020234
Borzelli D, Gurgone S, De Pasquale P, Lotti N, d’Avella A, Gastaldi L. Use of Surface Electromyography to Estimate End-Point Force in Redundant Systems: Comparison between Linear Approaches. Bioengineering. 2023; 10(2):234. https://doi.org/10.3390/bioengineering10020234
Chicago/Turabian StyleBorzelli, Daniele, Sergio Gurgone, Paolo De Pasquale, Nicola Lotti, Andrea d’Avella, and Laura Gastaldi. 2023. "Use of Surface Electromyography to Estimate End-Point Force in Redundant Systems: Comparison between Linear Approaches" Bioengineering 10, no. 2: 234. https://doi.org/10.3390/bioengineering10020234
APA StyleBorzelli, D., Gurgone, S., De Pasquale, P., Lotti, N., d’Avella, A., & Gastaldi, L. (2023). Use of Surface Electromyography to Estimate End-Point Force in Redundant Systems: Comparison between Linear Approaches. Bioengineering, 10(2), 234. https://doi.org/10.3390/bioengineering10020234