Article

Exploring the Impact of Delivery Robots on Last-Mile Delivery Capacity Planning Using Simulation

by
Raghavan Srinivasan
1,* and
Joseph Szmerekovsky
2
1
Department of Marketing, Supply Chain Management and International Business, College of Business and Management, Metro State University, Minneapolis, MN 55403, USA
2
Transportation, Logistics, and Finance Department, College of Business, North Dakota State University, Fargo, ND 58108, USA
*
Author to whom correspondence should be addressed.
Logistics 2025, 9(4), 156; https://doi.org/10.3390/logistics9040156 (registering DOI)
Submission received: 30 August 2025 / Revised: 14 October 2025 / Accepted: 27 October 2025 / Published: 31 October 2025
(This article belongs to the Section Last Mile, E-Commerce and Sales Logistics)

Abstract

Background: Over the past decade, the growth of ecommerce and omnichannel order fulfillment has led to a spike in last-mile delivery services. Last-mile delivery being the most expensive portion of the supply chain has resulted in process improvement initiatives by industry and academia targeting lower operational costs. Methods: In this study, we use simulation to account for the daily randomness regarding order quantities with missed deliveries being rolled over to the next period and attrition of the capacities used to meet the demand for each period. Further, to alleviate the impact on operations due to attrition, we consider the use of automation as a replacement for permanent capacity. Results: From the simulation results, we observe that the negative operational impact of employee turnover can be overcome with a combination of delivery robots and crowdsourcing with a payback period as short as 1.55 years. Conclusions: Optimal resource allocation is further refined by the use of simulation. The use of advanced automation such as robots seems to be a viable option for businesses to lower operational costs for some scenarios.

1. Introduction

Movement of goods is a significant factor in modern supply chains. Rising fuel and labor costs contribute to the overall operational costs of an organization when moving goods from one location to another. Within this movement of goods, last-mile delivery is considered the most expensive portion of the entire supply chain [1]. The growth in ecommerce, specifically with regards to last-mile delivery [2,3] and the end-consumer preference for cheap and fast shipping, has led to businesses and academia focusing on various improvement strategies to lower last-mile delivery costs [4,5] and provide more value to end users, i.e., customers within a supply chain.
Most of the studies observed in the literature focus on operational efficiency improvements by considering optimal transportation routes, equipment, or providing optimal schedules. Very few studies focus on an aggregate delivery capacity plan considering a hybrid structure of permanent and/or seasonal and/or crowdsourcing capacity and/or robots. In this research, we expand this adoption of a hybrid capacity structure while accounting for the daily nuances related to employee attrition, which impact capacity, leading to deliveries being missed. Monte Carlo simulation is used to determine the optimal capacity plan to meet the demand.
Lowering last-mile delivery costs has been extensively studied based on route analysis [6], type of vehicle used [7,8], public vs. private transport [9], scheduling enhancements [10], and automation such as drones or robots [11]. In this pursuit, most of the studies are either focused on optimization, simulation at an operational level, or environmental sustainability. Among these improvement strategies, one avenue that was explored was the utilization of crowd capacity for last-mile delivery services [12]. In this concept, the existing traffic is used to deliver goods, thereby lowering the burden on transportation companies to increase delivery capacity meeting ever-increasing consumer demand. This gives a delivery services company an opportunity to pool its capacity to handle varying demands.
This study considers a combination of capacities, such as permanent, seasonal, and crowdsourcing, along with the opportunity to use advanced automation such as robots for last-mile delivery. Simulation is used to address the attrition of permanent and seasonal capacities. Thus, an aggregate capacity plan is explored considering the variations that a business might face with regards to crowdsourcing capacity, crowdsourcing cost, employee attrition (permanent and seasonal), and end-consumer demand. Along with these variations, the benefits of automation are also studied.
The rest of the paper is organized as follows. The related literature is reviewed in Section 2. Section 3 provides the materials and method used, and Section 4 provides the results, followed by the related discussion in Section 5. Lastly, Section 6 concludes this research with future research directions.

2. Literature Review

This work is related to two streams of research: studies which use simulation to optimize the utilization of crowdsourcing capacity and studies that consider aggregate capacity planning for last-mile delivery.
The use of crowdsourcing for last-mile delivery has been studied to lower operational costs. In a review paper [13], it has been highlighted that there is an increase in last-mile delivery due to the changing needs of the retail and ecommerce sectors. This growth and efforts to maintain operational efficiencies emphasize the need for innovative solutions [10] to optimize the last-mile delivery process. In their study, they highlighted crowdsourcing as a viable option for reducing last-mile delivery costs. Also, e-retailers have adopted crowdsourcing logistics [14] to fulfill deliveries in a cost-effective manner, and one other study shows that crowdsourcing for last-mile delivery can be used to be cost effective and sustainable [15]. On the same note, a study has reviewed challenges associated with the use of crowdsourcing [16], specifically with the aspect of capacity building. This is one of our motivations, where crowdsourcing is an uncertain aspect, guaranteeing that it does not impact service levels.
A simulation exploring how same-day delivery services can be improved using crowdsourcing considering time windows and daily demand was performed [17], where on-time deliveries and total number of deliveries were taken into consideration for the simulation model. In other research [12], the authors explored how crowdsourcing capacity (considering ecommerce, trust, and technology) would help last-mile delivery lower operational costs. To achieve this, the authors performed a simulation considering the inputs of population size, online vs. supermarkets, deliverers, order arrival, delivery time, and associated costs. They concluded that although crowdsourcing shows significant savings, a hybrid delivery network balances the challenges of each approach. A multi-stage stochastic model was proposed and solved using a simulation–optimization strategy [18] investigating dynamic and stochastic vehicle routing. Their findings showed economic as well as environmental benefits. Simulating benefits of crowdsourcing with different types of fleets used for delivery purposes, bike, car, or both was also observed [19]. A bike or bicycle-based mode of transport was found to be economical. A study also focused on the fresh produce sector to assign crowd-based capacity [20]. Their approach used an optimization package accounting for time and space considerations with verification from experiments using simulation. Use of simulation is also widely observed, where it could be used to explore the adoption of hybrid fleets for last-mile delivery services [21] or to put more focus on the routes and transportation along with crowdsourcing [22].
Most of the studies that use simulation focus on the operational level, leading to a gap in using simulation to set permanent, seasonal, and crowdsourcing capacities for last-mile delivery services. One particular study [23] simulated the online food ordering methods, considering the behaviors of customers, merchants, dispatchers, and couriers towards a multiagent model. Their experiments led to an understanding that a larger load capacity of couriers is more of an advantage towards order completion rate.
Along with simulation exercises, it is intriguing to observe the use of automation and how it can assist in determining optimal capacities for low operational costs while maintaining service levels. The use of trucks and autonomous robots for last-mile delivery [11] has also been explored. The authors work on a scheduling problem to assess the merits of this concept. In this study, decentralized robot depots were found to be efficient. A similar type of combination of truck and autonomous robots [7] but with consideration of multiple trucks delivering robots to drop-off points from which the robots make the final delivery step was studied. It was observed that transportation costs could be reduced. Aerial automation has also been explored for last-mile deliveries [24]. Here, they have both drones and ground delivery robots under consideration. Drones were found to be economical in less dense and larger service regions, while ground delivery robots were found to be profitable in denser neighborhoods. Benefits of using autonomous robots for last-mile delivery have been well explored [25]. Combinations of trucks and robots are used for last-mile delivery. It was observed that the use of a combination of trucks and robots led to cost savings when compared to truck-only delivery.
Another study [26] has acknowledged the growth of ecommerce deliveries and the use of automated robots for delivery. Their research focuses on this increased adoption of robots and the increased regulations by local agencies. A study [27] that explored the use of autonomous vehicles for last-mile delivery compared their results with traditional services. Here, it is observed that the introduction of autonomous vehicles saves operational time. With parking time being considered, higher savings could be realized. Similarly, authors [28] have presented a two-echelon van-based robot last-mile pickup-and-delivery system. They compared their results with two classical models and found their results to be competitive. Based on these studies, it could be well perceived that economic benefits are observed when using automation for last-mile delivery services. Another study on the application of robots to last-mile delivery services leading to a truck–robot [29] system found that robot-assisted last-mile delivery is efficient. This depends on how dense the area is and how much storage can be accommodated by the robots.
For any new technology, stakeholder acceptance is key for successful adoption. There are studies that focus on such acceptance, such as exploring the impact of autonomous vehicle acceptance by end consumers. Their findings suggest that price sensitivity is the strongest point when it comes to user acceptance [30]. Another study [31] focused on the public acceptance of use of autonomous delivery robots for last-mile delivery. Their objective was to facilitate the mass adoption of delivery robots while ensuring the public acceptance of such delivery methods.
There is an emphasis on the need for innovative solutions, and [32] proposed a mixed truck and robot delivery concept. Their research leads to a conclusion that such innovative solutions lead to a better return when compared to a traditional delivery method of using trucks for last-mile delivery. In this pursuit, various combinations of vehicles have been explored. One such approach [33], where a vehicle would carry parcels from a central depot to facilities, from which robots would be used to make last-mile deliveries, is used as a reference in our study in terms of using a combination of vans and robots to determine the optimal capacity plan. The use of robots for e-grocery delivery was also explored [34], where the primary objective was to minimize unfulfilled customer demand. It was concluded that considering the uncertainties, a broad time delivery window, and a moderate speed ratio of robots/vans, robots do assist in reducing unmet demand. A review study [35] also emphasizes the merits of using such automation technologies for last-mile delivery.
Previous works that studied the combination of capacities were either analytical, with capacity and cost of crowdsourcing being fixed [36], or used a stochastic program to account for the uncertainties of crowdsourcing capacity and costs [37]. The optimal business solutions were obtained in each of the situations. However, these studies did not account for random employee attrition, a factor that simulation can capture to provide refined insights for an optimal strategy for last-mile delivery services. Another recent technological advancement is the ability to use robots for daily operations and how they would add value to operations for developing an aggregate capacity plan.
Though robots and crowdsourcing have been extensively studied in the literature, a model which combines both these options remains a research gap. Further, no studies considering these new innovations have yet accounted for employee attrition in more traditional approaches to last-mile delivery and its impact on unfilled deliveries. This identifies a second gap in the literature. To address these gaps, we propose a simulation model which allows for traditional or robot delivery combined with a crowdsourcing option while accounting for attrition in traditional delivery.
To summarize, our work is the first to use simulation for an aggregate delivery capacity plan with robots, permanent, seasonal, and crowdsourcing capacities. Further, we study the impact of the attrition rate and undelivered units rolling over to the next period for delivery while optimizing the operational costs for the last-mile delivery services. A key question is how the adoption of robots may alleviate this situation.
These innovative aspects of our work allow us to answer the following research questions:
  • Can the flexibility of crowdsourcing assist with the challenges caused by attrition? And does the on-demand nature of crowdsourcing capacity mitigate the impact of attrition?
  • When attrition is in place, do these automated technologies alleviate the problems of missed deliveries and higher operational costs due to attrition?
  • What are the managerial implications of adopting such automated technologies like robots alongside traditional permanent and seasonal capacities that face such attrition rates and the on-demand nature of crowdsourcing capacity?

3. Materials and Methods

Previous studies have explored the use of analytical modeling [36] and stochastic programming [37] to understand the optimal combination of capacities needed for deliveries. The stochastic program considered the variability in availability and cost of crowdsourcing capacity for which the analytical model did not account. In those two approaches, one aspect that was not considered was the attrition rate of the permanent and seasonal employees and use of automation. Thus, in this section, simulation is used to capture the attrition of employees, for both permanent and seasonal capacities. Further, we also simulate a scenario where automation, like robots, is used for last-mile delivery services.

3.1. Simulation with Traditional Capacities

We use simulation to further investigate the impact of crowdsourcing capacity on cost, considering additional aspects of the variations that will take place. Variations regarding employee attrition rate, missed deliveries and rollovers from one period to the next will be accounted for in the simulation. Any delivery which is not fulfilled will be rolled over to the next period for delivery. How these additional variations will impact daily delivery performance and the operating costs of the organization will be investigated.
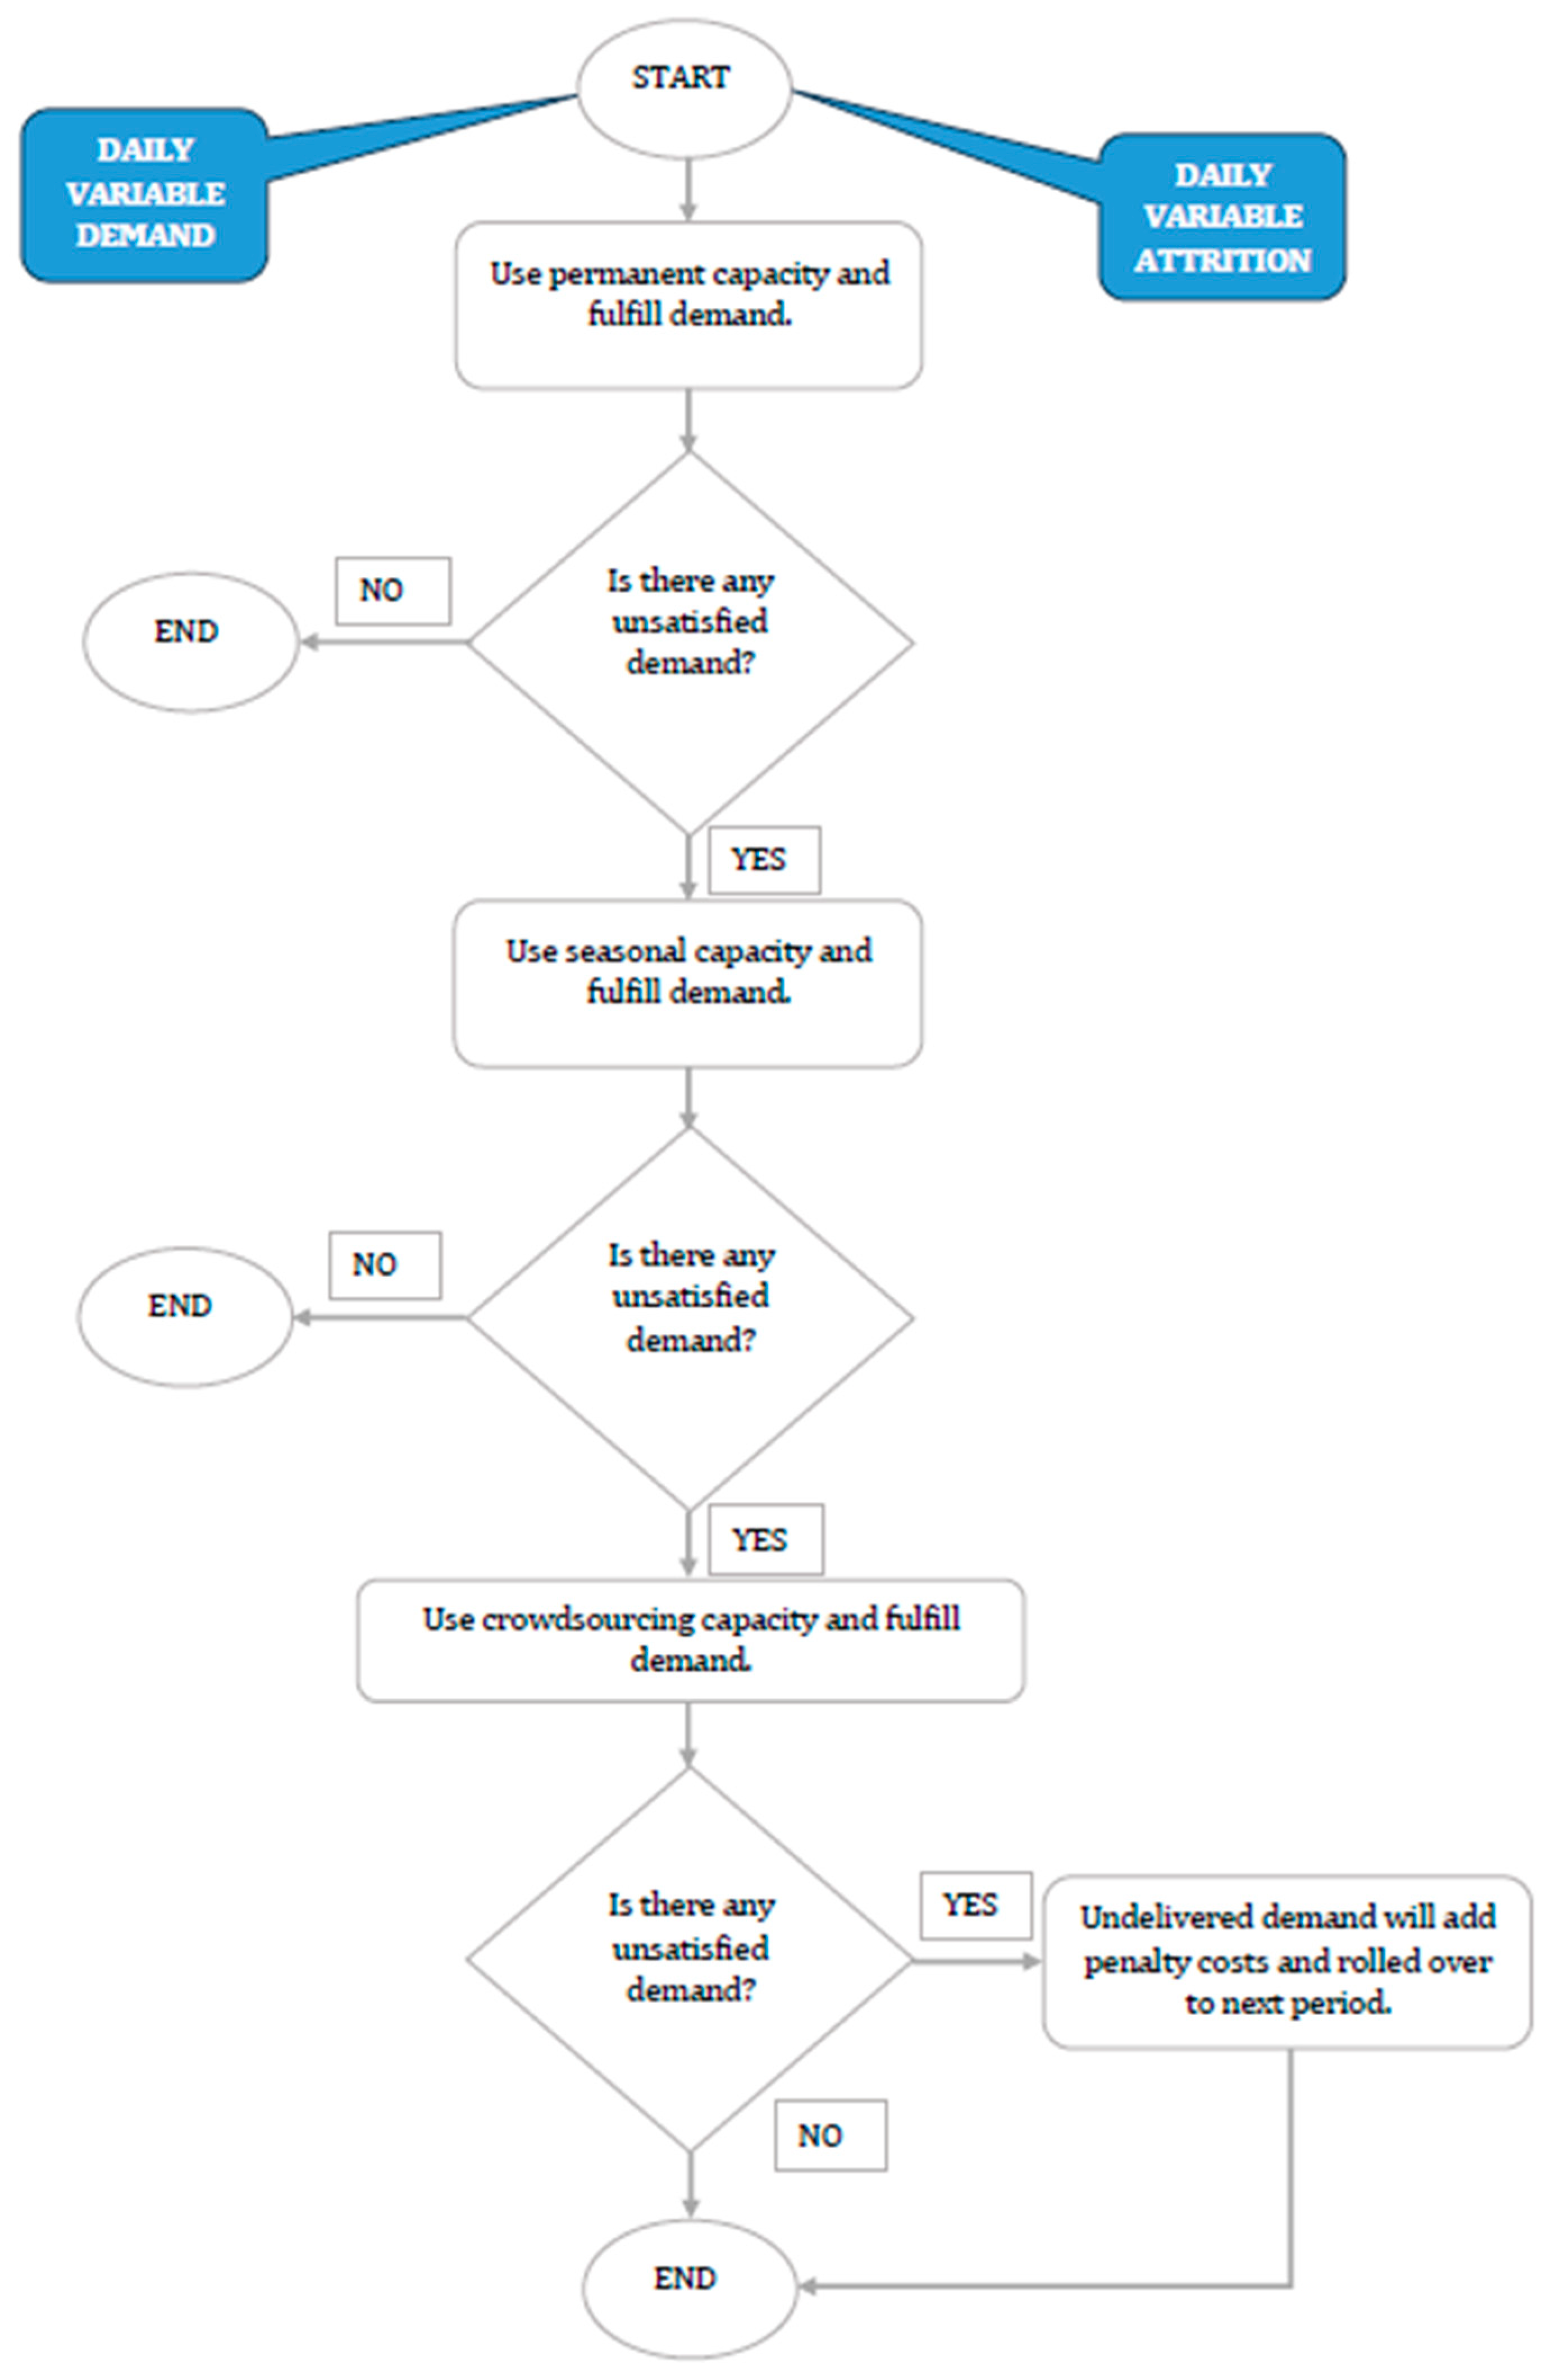
Variations in employee attrition rate and delivery rate will be applied and simulated in each of the scenarios to study the impact on the costs to meet daily demand. Figure 1 shows the logic of the simulation model incorporating employee attrition and rollover of orders to the next period.
Figure 1 shows the structure of the simulation; for each period, the daily variable demand and attrition are considered by the model. Once demand is observed, if permanent capacity can fulfill the order, then the permanent employees are given the first preference, and the orders are fulfilled. If demand exceeds permanent capacity, then seasonal capacity is utilized, and lastly, for any remaining demand, crowdsourcing capacity is utilized. Within this flow, both permanent and seasonal capacities are subject to employee attrition. Due to this impact of attrition, capacity is reduced, and the resulting demand will be fulfilled by the available crowdsourcing capacity. Demand that is not fulfilled will incur a penalty and roll over into the next period’s demand. To describe the simulation in detail, we make use of the parameters listed in Table 1 and decision variables listed in Table 2.
In addition, we have the random parameters defined in Table 3.
In the simulation model, we have assumed that rollovers will incur a penalty cost and be added to the next period’s demand for deliveries. Employee attrition is randomly generated for each period. This results in the updated permanent and seasonal capacities and associated costs for hiring more workers to restore capacities to their desired levels. To determine the lowest possible operating cost, various combinations of permanent and seasonal capacities are tested in the simulation depicted in Figure 1, with the best combination being selected as the solution.
Equation (1) is used to account for attrition in the available permanent capacity, and Equation (2) performs the same for seasonal capacity.
T ~ a c t j = T A ~ p j   f o r   j = 1 J  
T ~ k a c t j = T k A ~ s j   f o r   j = 1 J
Once the impact on the capacity is determined, unsatisfied demand from period j 1 is rolled over to period j using Equation (3).
D n ~ j = W ~ j 1 + D ~ j   f o r   j = 1 J   a n d   W 0 = 0
Once the new demand is determined for period j using Equation (3), capacity is allocated to satisfy demand following the sequence of permanent, seasonal, and crowdsourcing. These calculations are shown in Equations (4)–(8).
For   j = 1 J         If     D n ~ j   T ~ a c t j   t h e n   P ~ j = T ~ a c t j   e l s e   P ~ j = D n ~ j  
For   j = 1 J If     D n ~ j   T ~ a c t j + T ~ k a c t j   t h e n   S k ~ j = T ~ k a c t j   e l s e   S k ~ j = D n ~ j P ~ j  
i f   P ~ j + S k ~ j < D n ~ j   t h e n   X D ~ j = D n ~ j P ~ j   S k ~ j   e l s e   X D ~ j = 0   f o r   i = 1 I   a n d   j = 1 J  
i f   b ~ i j   X D ~ j   t h e n   X C ~ i j = b ~ i j   f o r   i = 1 I   a n d   j = 1 J    
i f   b ~ i j > X D ~ j   t h e n   X C ~ i j = X D ~ i j   f o r   i = 1 I   a n d   j = 1 J  
Equations (9) and (10) are used to calculate the unsatisfied demand for period j.
i f   b ~ i j < X D ~ j   t h e n   W j = X D ~ j b ~ i j   f o r   i = 1 I   a n d   j = 1 J    
i f   b i j h   X D ~ j   t h e n   W j = 0   f o r   i = 1 I   a n d   j = 1 J
Equations (11) and (12) are used to calculate the hiring costs for each of permanent and seasonal capacities considering the hiring cost H r and the variable impact on capacity due to attrition.
H C P j = T T ~ a c t j C T H r   f o r   j = 1 J
H C S j = T k T ~ k a c t j C T k H r   f o r   j = 1 J
Finally, for each period, we use Equation (13) to calculate the total cost.
  T C j = T ~ a c t j F + P ~ j E F + H C P j + T ~ k a c t j S + S k ~ j E S + H C S j + X C ~ i j   m i n { C ~ i j } + ( W ~ j θ )

3.2. Simulation with Automation (Robots) Used for Last-Mile Delivery

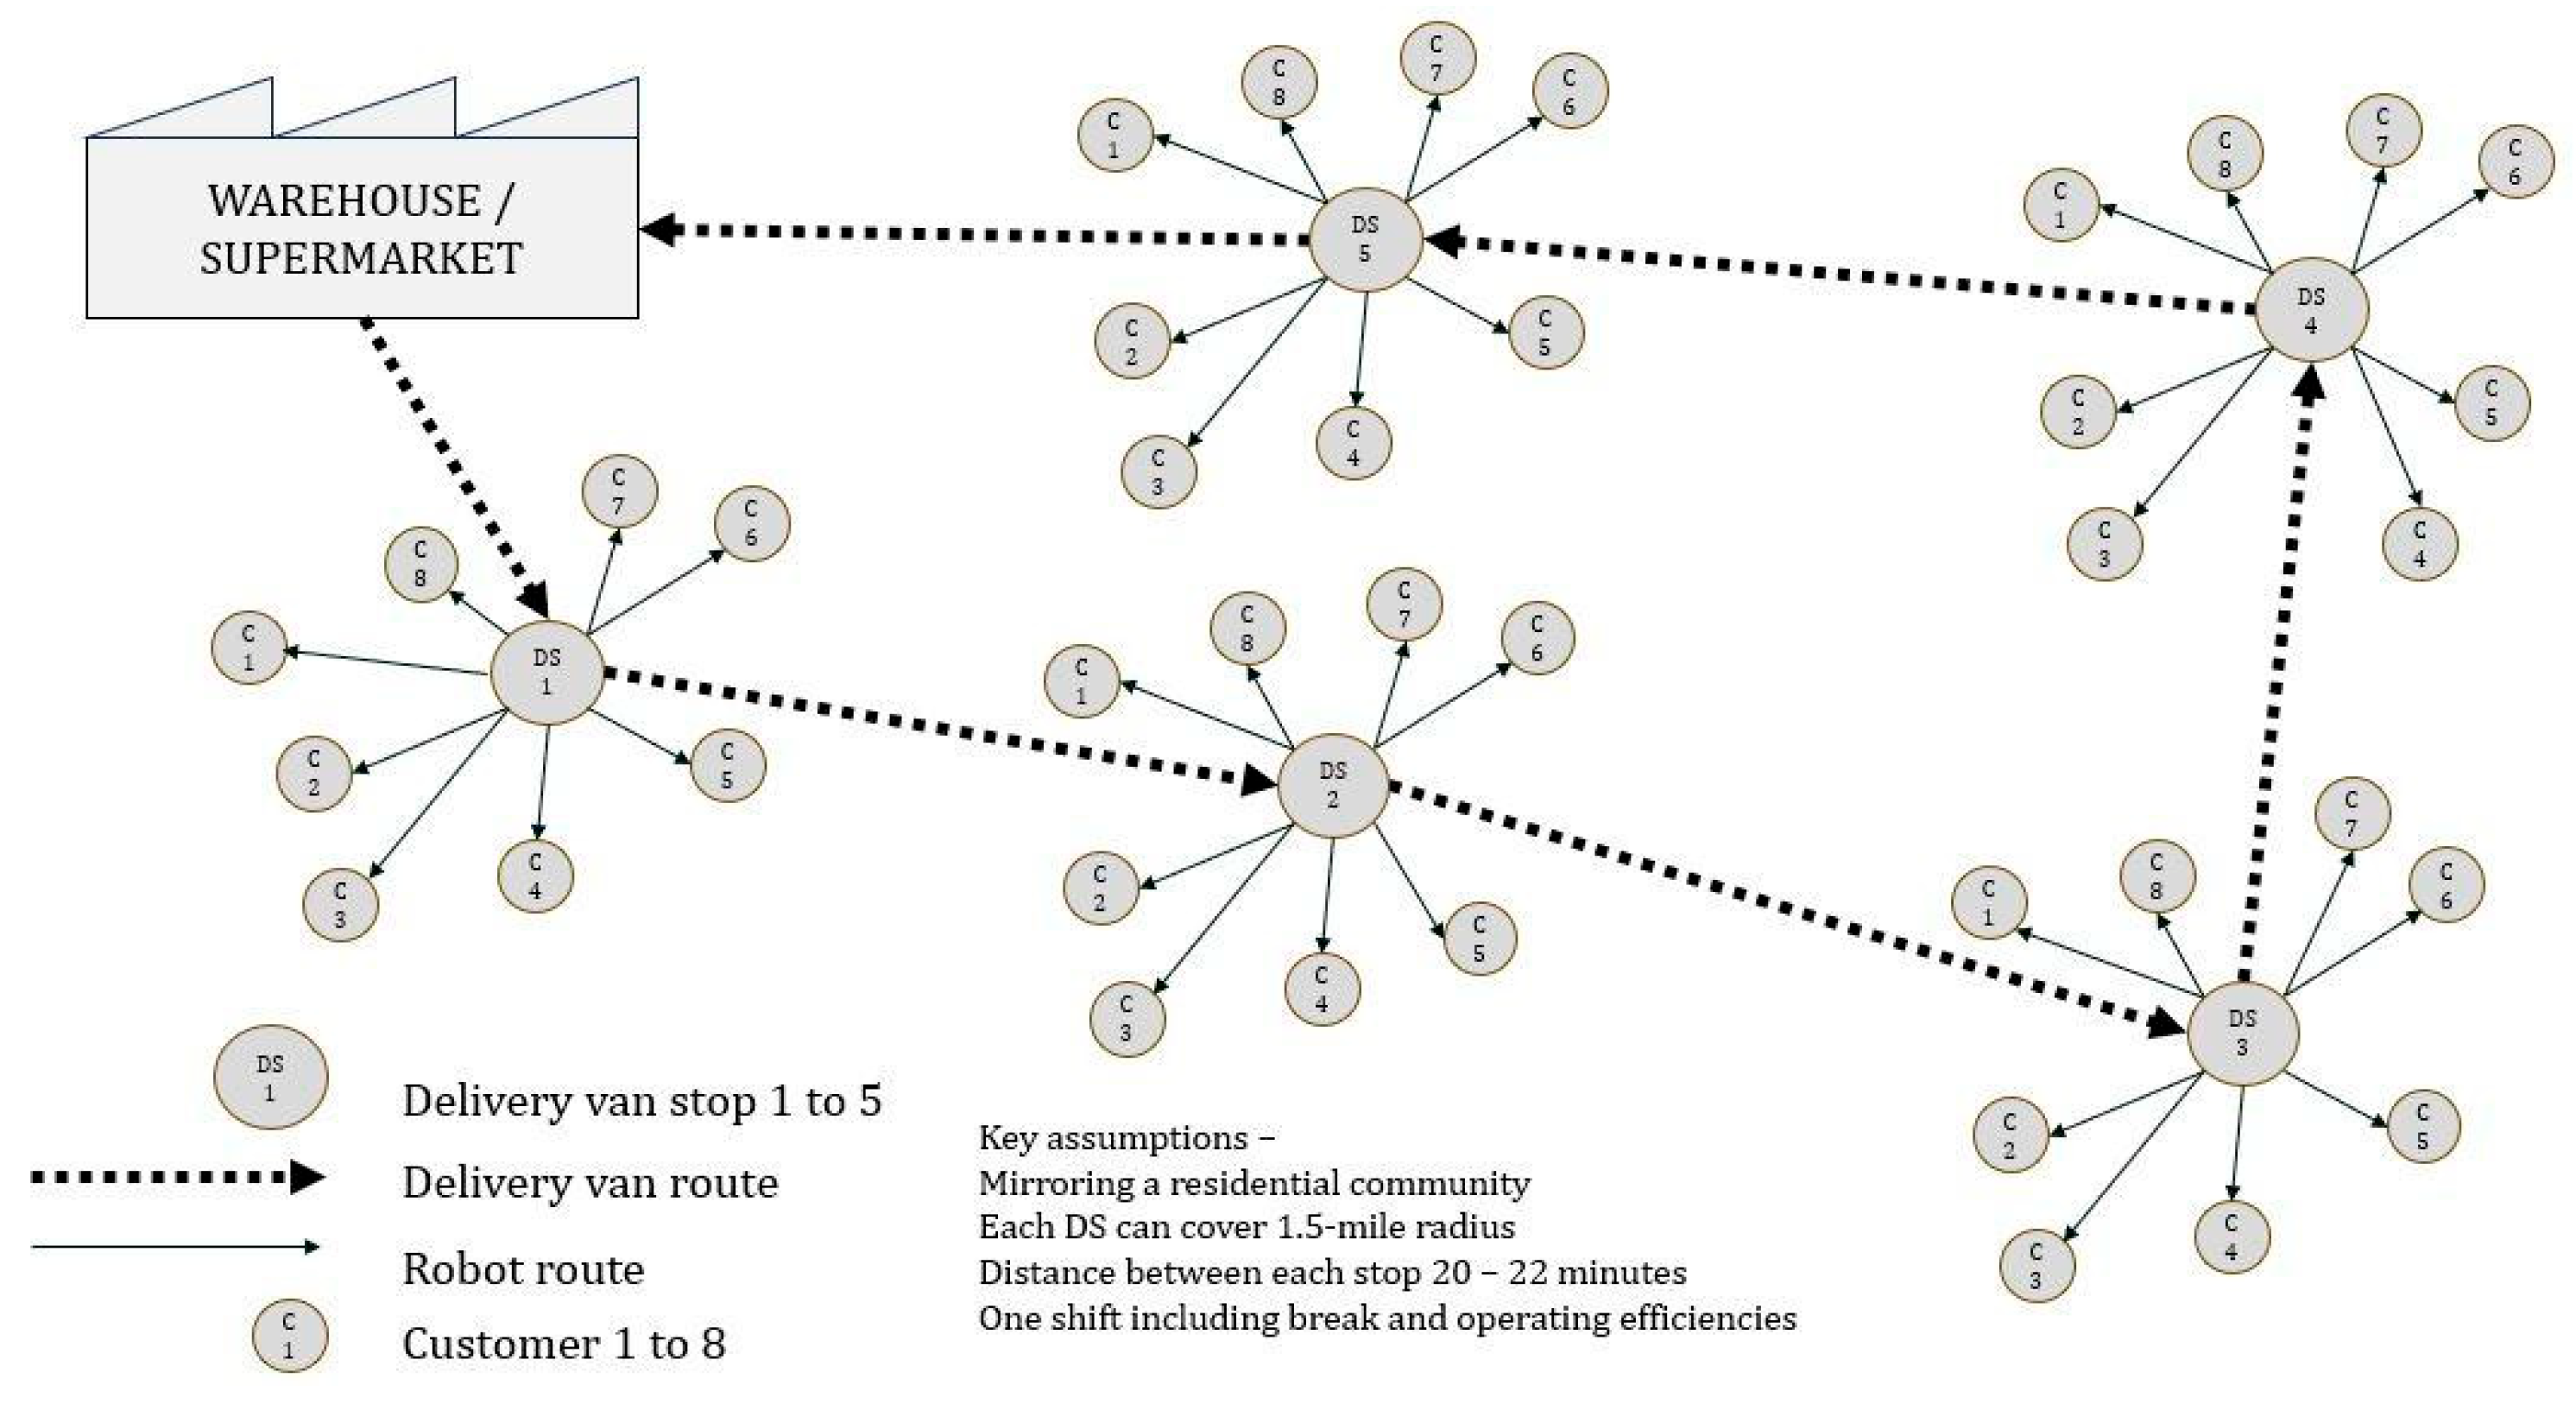
Figure 2 shows the scope of the last-mile delivery flow considered for the analysis of the use of robots. A delivery van robot combination is assumed, where each delivery van contains robots that will deliver the packages to end users. The flow starts with the delivery van leaving the local warehouse or supermarket and reaching a pre-determined stop to serve community number 1, known as a delivery van stop. At this stop, the robots will be dispatched to individual households in community number 1, and then the delivery van proceeds to the next stop to perform the same activity for community number 2 and so on until it reaches the final community for which it has packages to deliver. The time spent driving to a stop, refilling robots, and taking breaks are accounted for, as indicated in Appendix B.1.

3.3. Numerical Experiments

3.3.1. Numerical Experiments with Traditional Capacities

The numerical experiments used the parameter values from [36,37]. The following parameter values are referenced from [36]: F = 7.49, E F   = 0.15, S = 11.23, E S   = 0.45, and θ = 59.88. Parameter values are listed in Table A1 in Appendix A.1. The impact of attrition per period is assumed to consist of costs incurred due to the number of deliveries that are missed and the costs involved in hiring back the respective type of capacity. Here, the number of deliveries missed will add to penalty costs, and the cost to rehire is assumed to be equivalent to a period’s salary per capacity type. This hiring cost for permanent and seasonal capacities is calculated as H C P j and H C S j per Equation (11) and Equation (12), respectively.
The randomly generated C ~ i j   values were assumed to follow a uniform distribution, where the parameter P indicates the maximum percentage deviation from the expected value. The uniform distribution is used for daily (single period) demand as it has thick tails; note that sums or averages of these values over multiple days will follow a more normal distribution. The randomly generated b ~ i j values were assumed to follow a Poisson distribution, while employee attritions, A ~ p j and A ~ s j , are assumed to follow a binomial distribution. For crowdsourcing capacity, a Poisson distribution was used assuming that the availability of crowdsourced workers would follow a process similar to an arrival process where the number of arrivals within a fixed time window follows a Poisson distribution. For employee attrition, we use a binomial distribution, which follows from each employee leaving being an independent event with the same probability. We use U = 13.67, 10.03, and 6.29 for scenarios 1–3, respectively [36]. For P , we use values of 25% and 50%. Next, for each price point, the corresponding capacity b ~ i j   is randomly generated using a Poisson distribution with mean C a / I . Here, C a represents the crowdsourcing capacities used in the analytical experiments [36]. The crowdsourcing capacities are 25%, 50%, 75%, and 100% (corresponding to C a   = 2, 3, 4, and 5, respectively) of the maximum demand with the uniform distribution (1032 units). In this analytical study, the crowdsourcing capacity and costs are kept fixed for each interval; however, in reality, it is expected that there would be variations, and this stochastic nature of the crowdsourcing capacity and costs is addressed, where the inputs from the analytical study are used in the stochastic program runs [37]. The output of this stochastic program is the optimal value of permanent ( T ) and seasonal ( T k ) capacities, which is given in Table A2 in Appendix A.1. The averages of these T and T k values are then varied by +/− 50 to obtain the range of values over which the simulation will run to determine optimal T and T k values.
The attrition rate is from the US Bureau of Labor Statistics website [38], and the average value of 2.17% for the last three months (May 2024, June 2024, and July 2024) for the transportation, warehousing, and utilities industry is used. For the simulation, it is assumed that permanent employees have a lower attrition rate when compared to seasonal employees. Thus, attrition rates of 2% and 3% are used for permanent and seasonal capacity, respectively. Using Equations (1)–(13), the total cost for each combination of permanent and seasonal capacity is then computed. Equation (13) gives the total cost per period for each combination. The sum of this combination for the entire planning horizon leads to an understanding of the costs and provides a combination with the lowest total cost. This is categorized as an optimum configuration of permanent and seasonal capacity along with the utilization of crowdsourcing capacity to meet demand.

3.3.2. Numerical Experiments with Traditional Capacities with Automation

The simulation logic is similar to Section 3.1, Figure 1, but with the adoption of robots for last-mile delivery services. The cost analysis is based on a capital expenditures period of 5 years; thus, the robot purchase price is spread over 5 years. In addition to this, a 50% markup is added to account for maintenance and electricity consumption. This hourly cost of robot is added to the operator cost. This leads to the per delivery cost with an error cost assumed to be at 2%. The values used for the automation are listed in Table A3 in Appendix B.1. For this analysis, it is assumed that the robots fill the role of permanent capacity with no attrition. The analysis considers the capital costs of the robots including operational expenses along with maintenance. The robot specifications in terms of payload and distances travelled during shift time are also adapted to meet the needs of last-mile delivery services.

3.3.3. Sensitivity Analysis with Robot Cost and Capacity

To understand the impact of the robot cost and capacity on the model, we perform a sensitivity analysis by varying the costs and capacities of the robot. One cost point used is lower than the value used for the numerical experiment and the second is higher. For capacity, we have taken 2× and 3× times the capacity used for the numerical experiments. Parameter values are listed in Table A4 in Appendix B.2.

4. Results

The stochastic program and simulations were run in SAS 9.4 on a computer with windows 10 enterprise, a 64-bit operating system, an 11th-generation intel i7 300 GHz processor, and 32 GB of ram. The results were obtained for each combination of permanent and seasonal capacity for every combination considering the variations in U ,   P ,   C a ,   and I . The results obtained from the SAS program simulation runs were analyzed for the various combinations.

4.1. Traditional Capacities Only

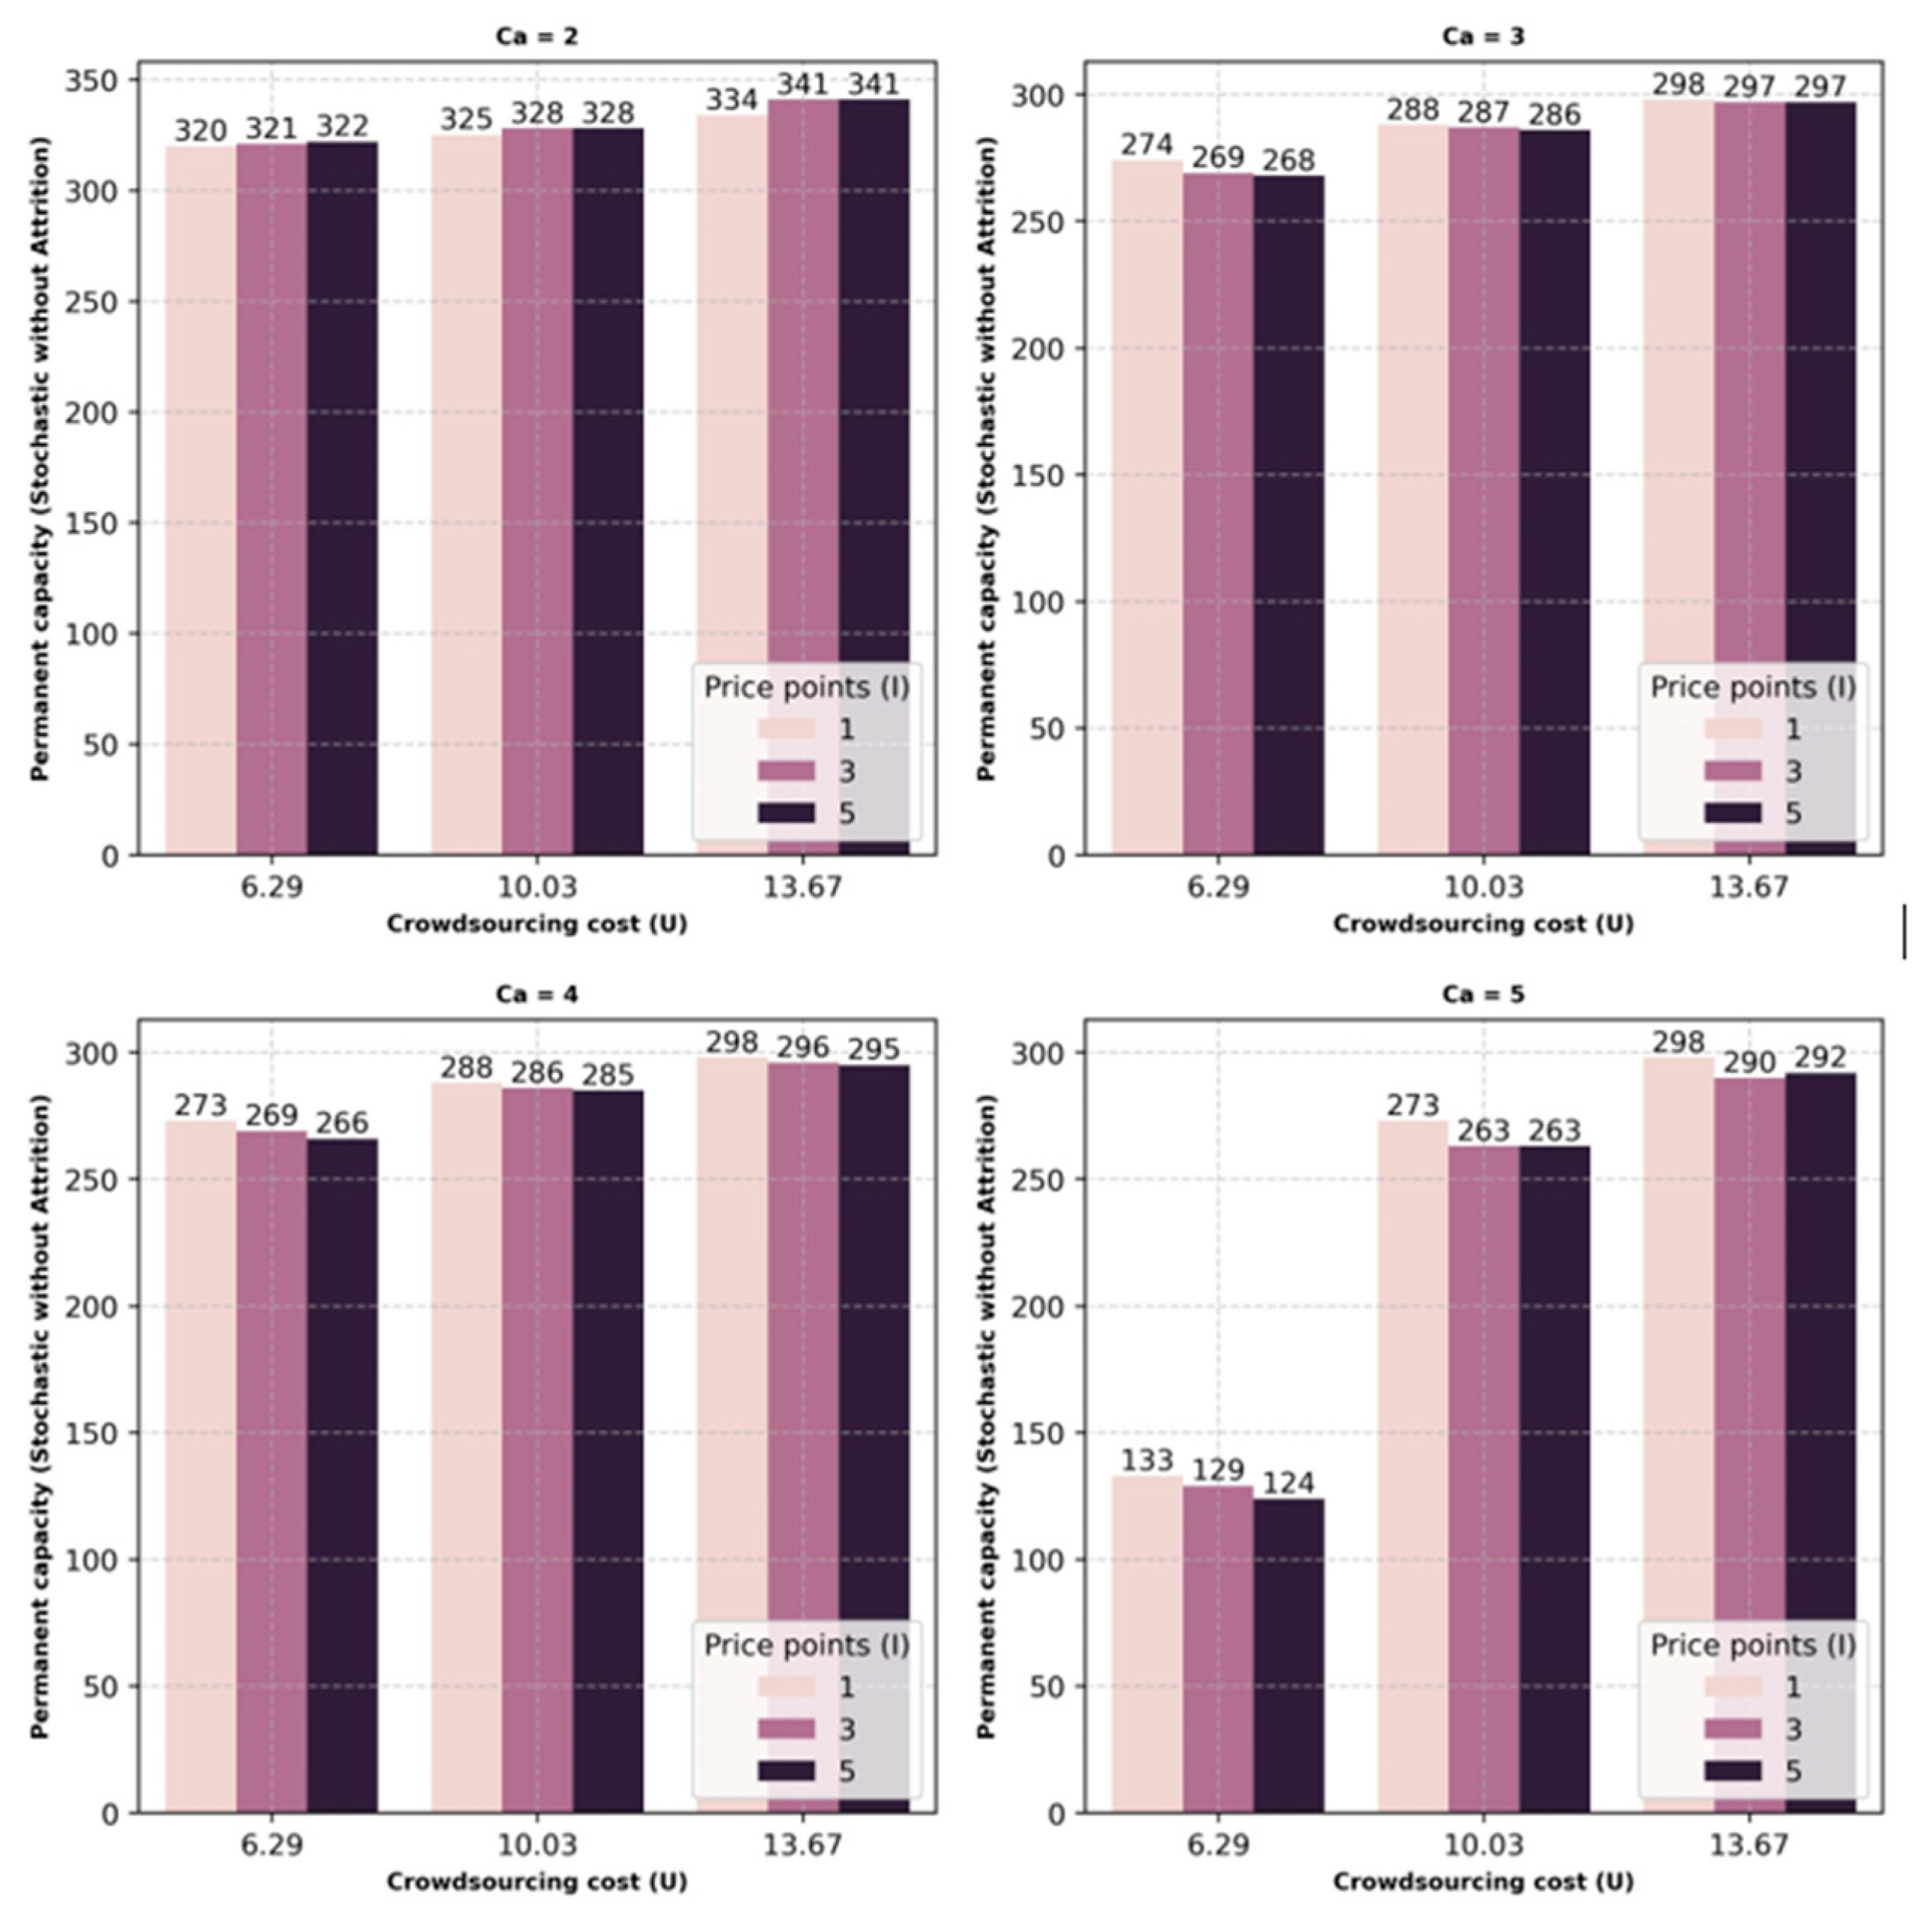
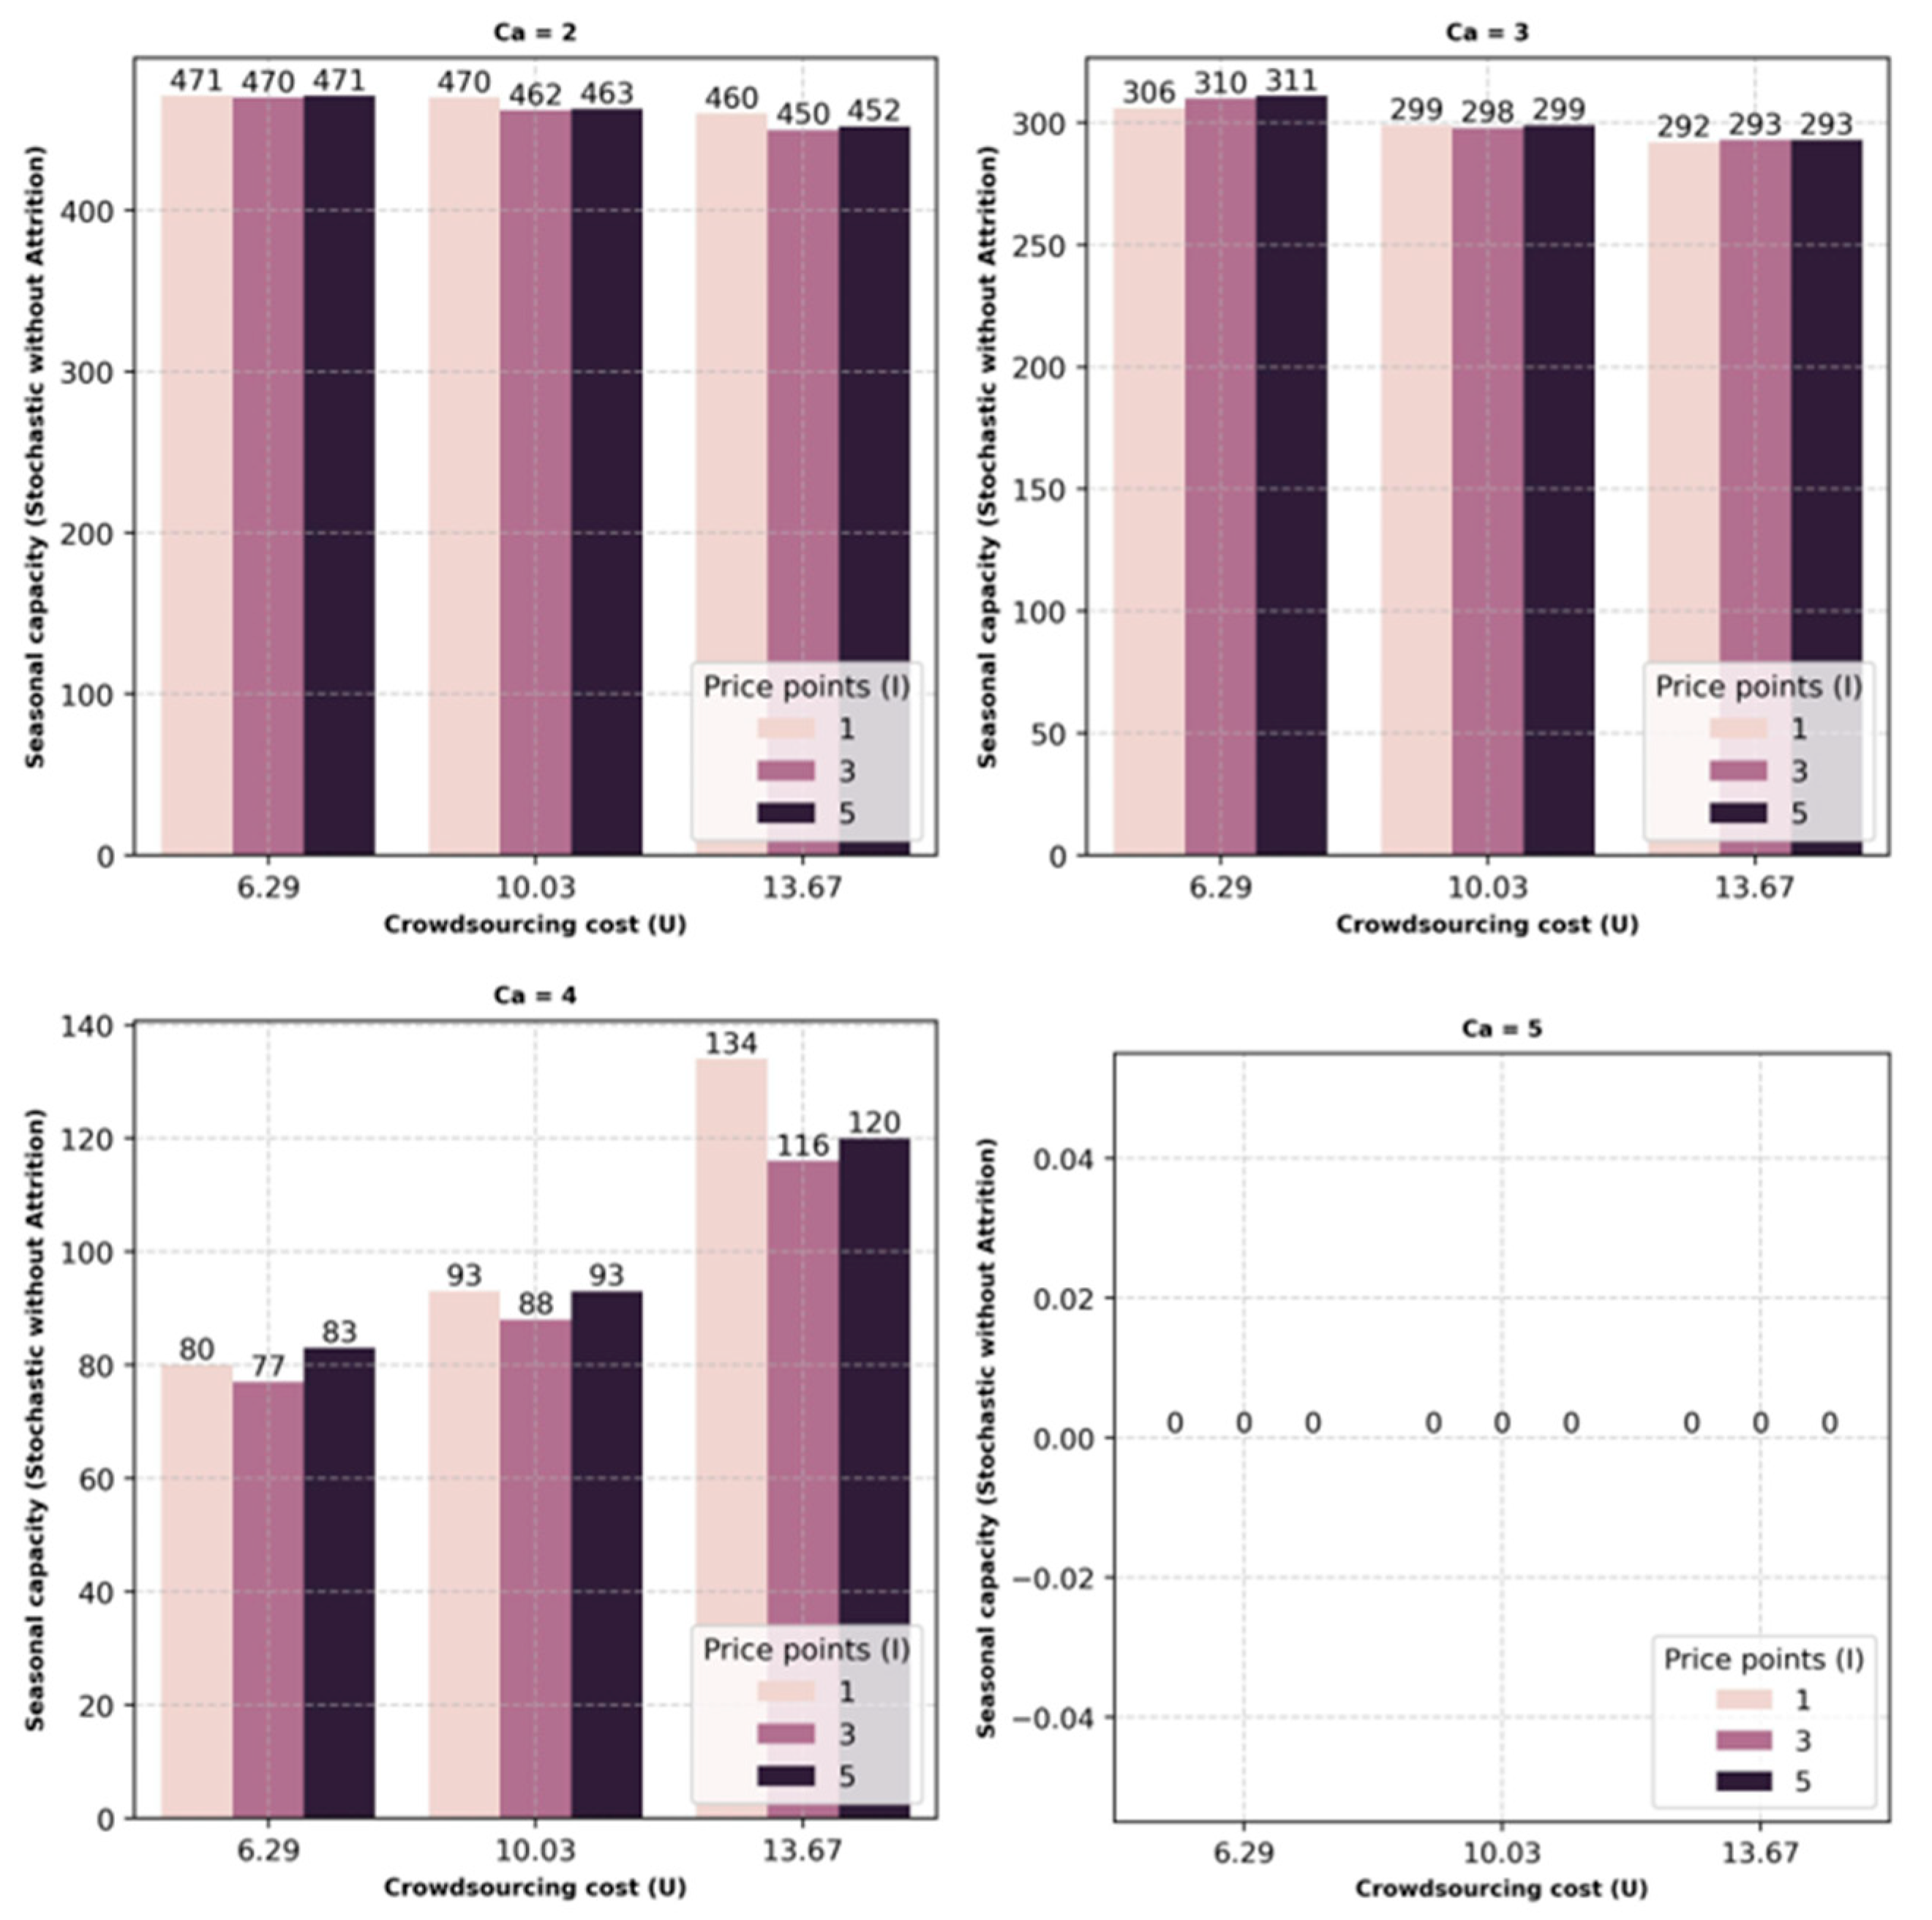
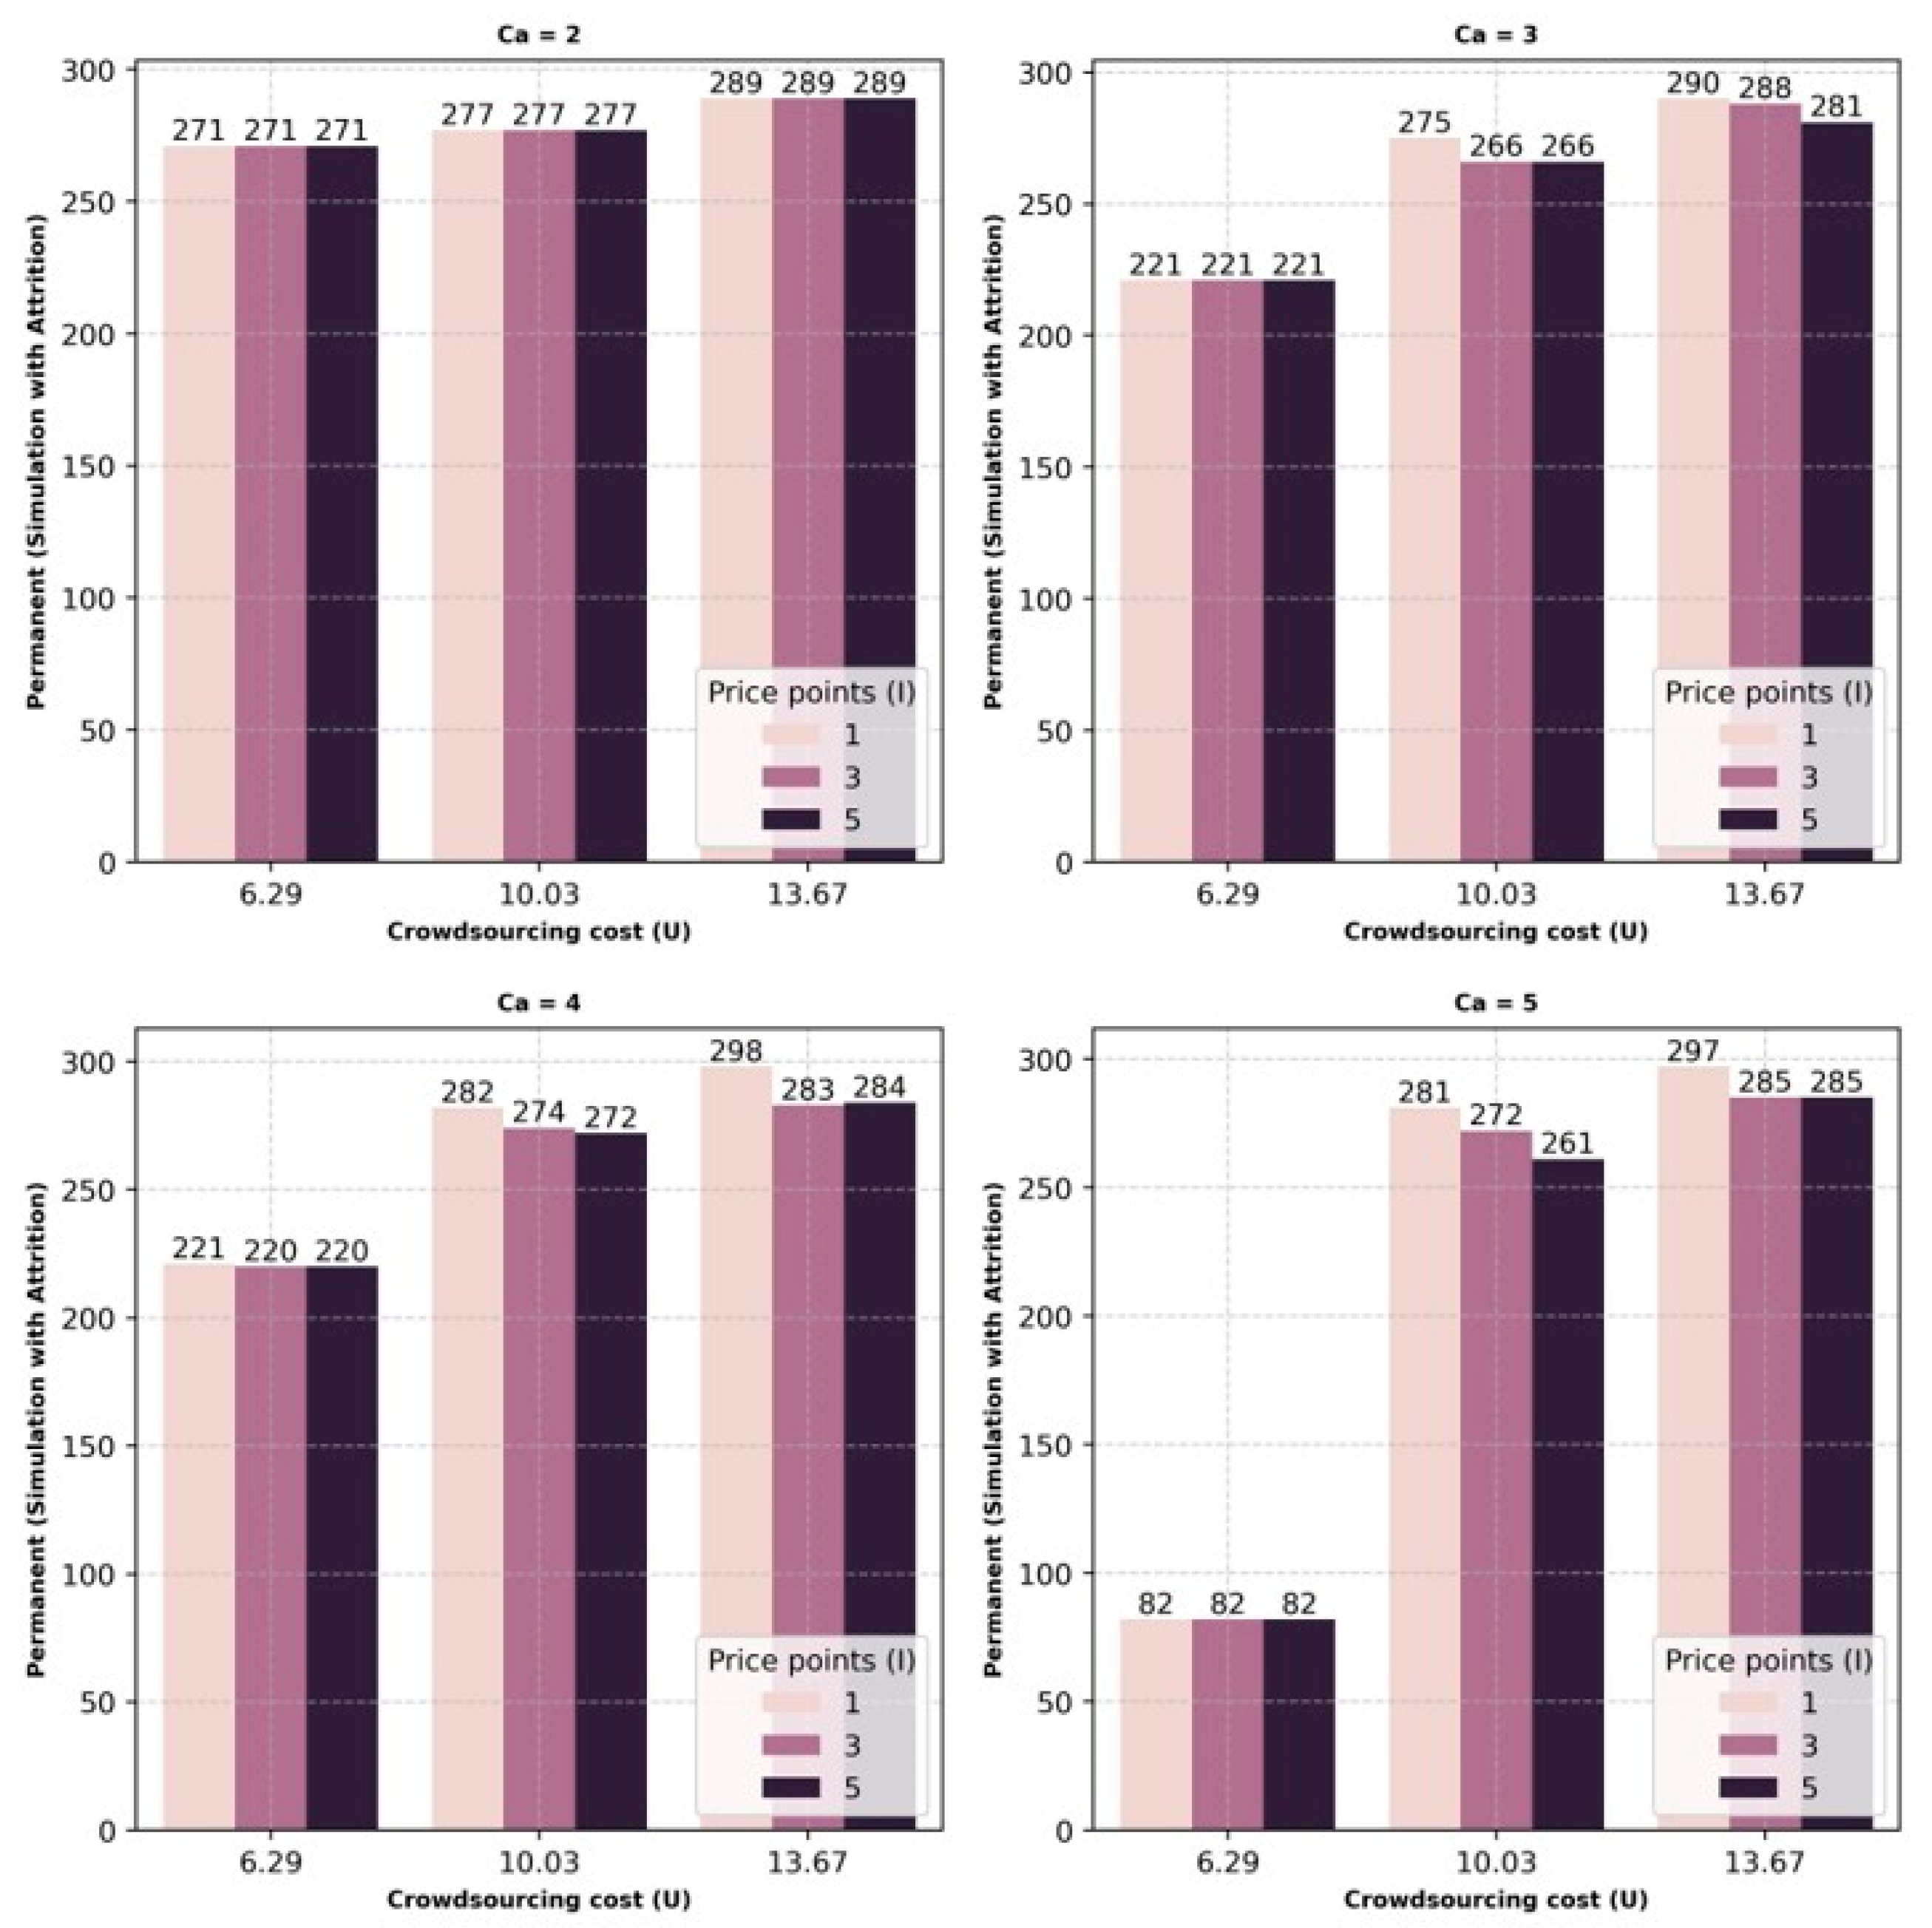
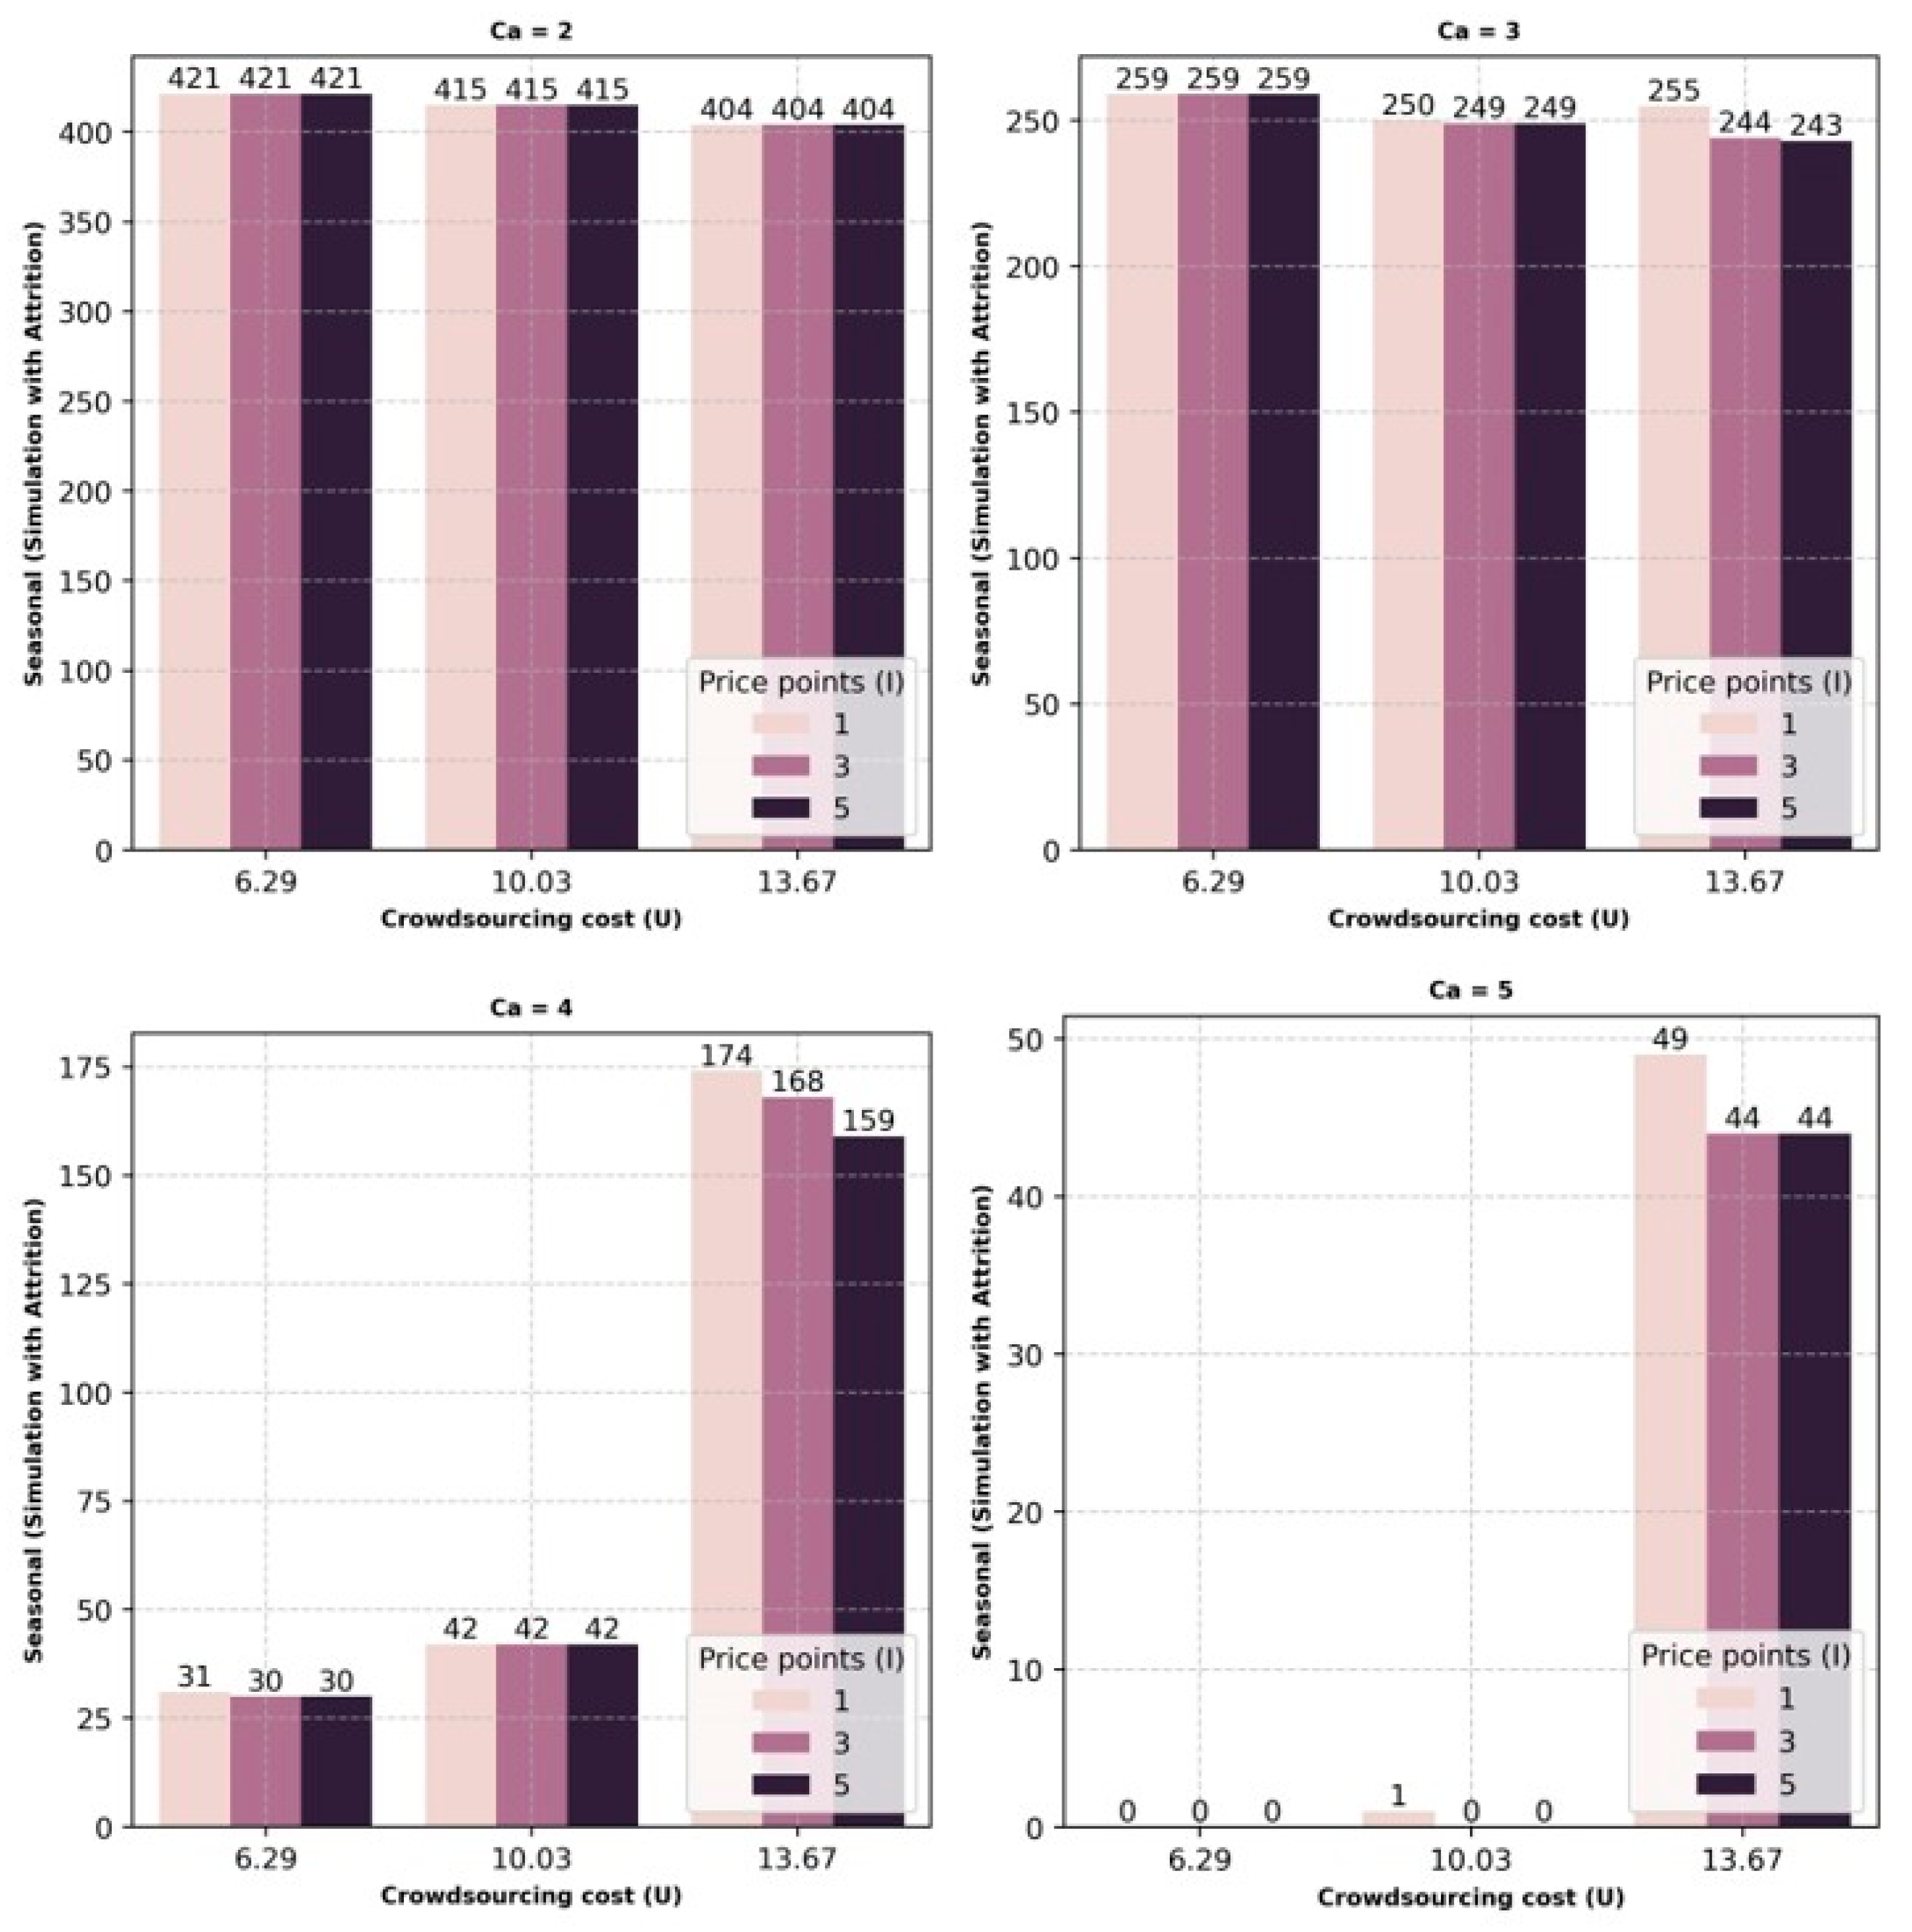
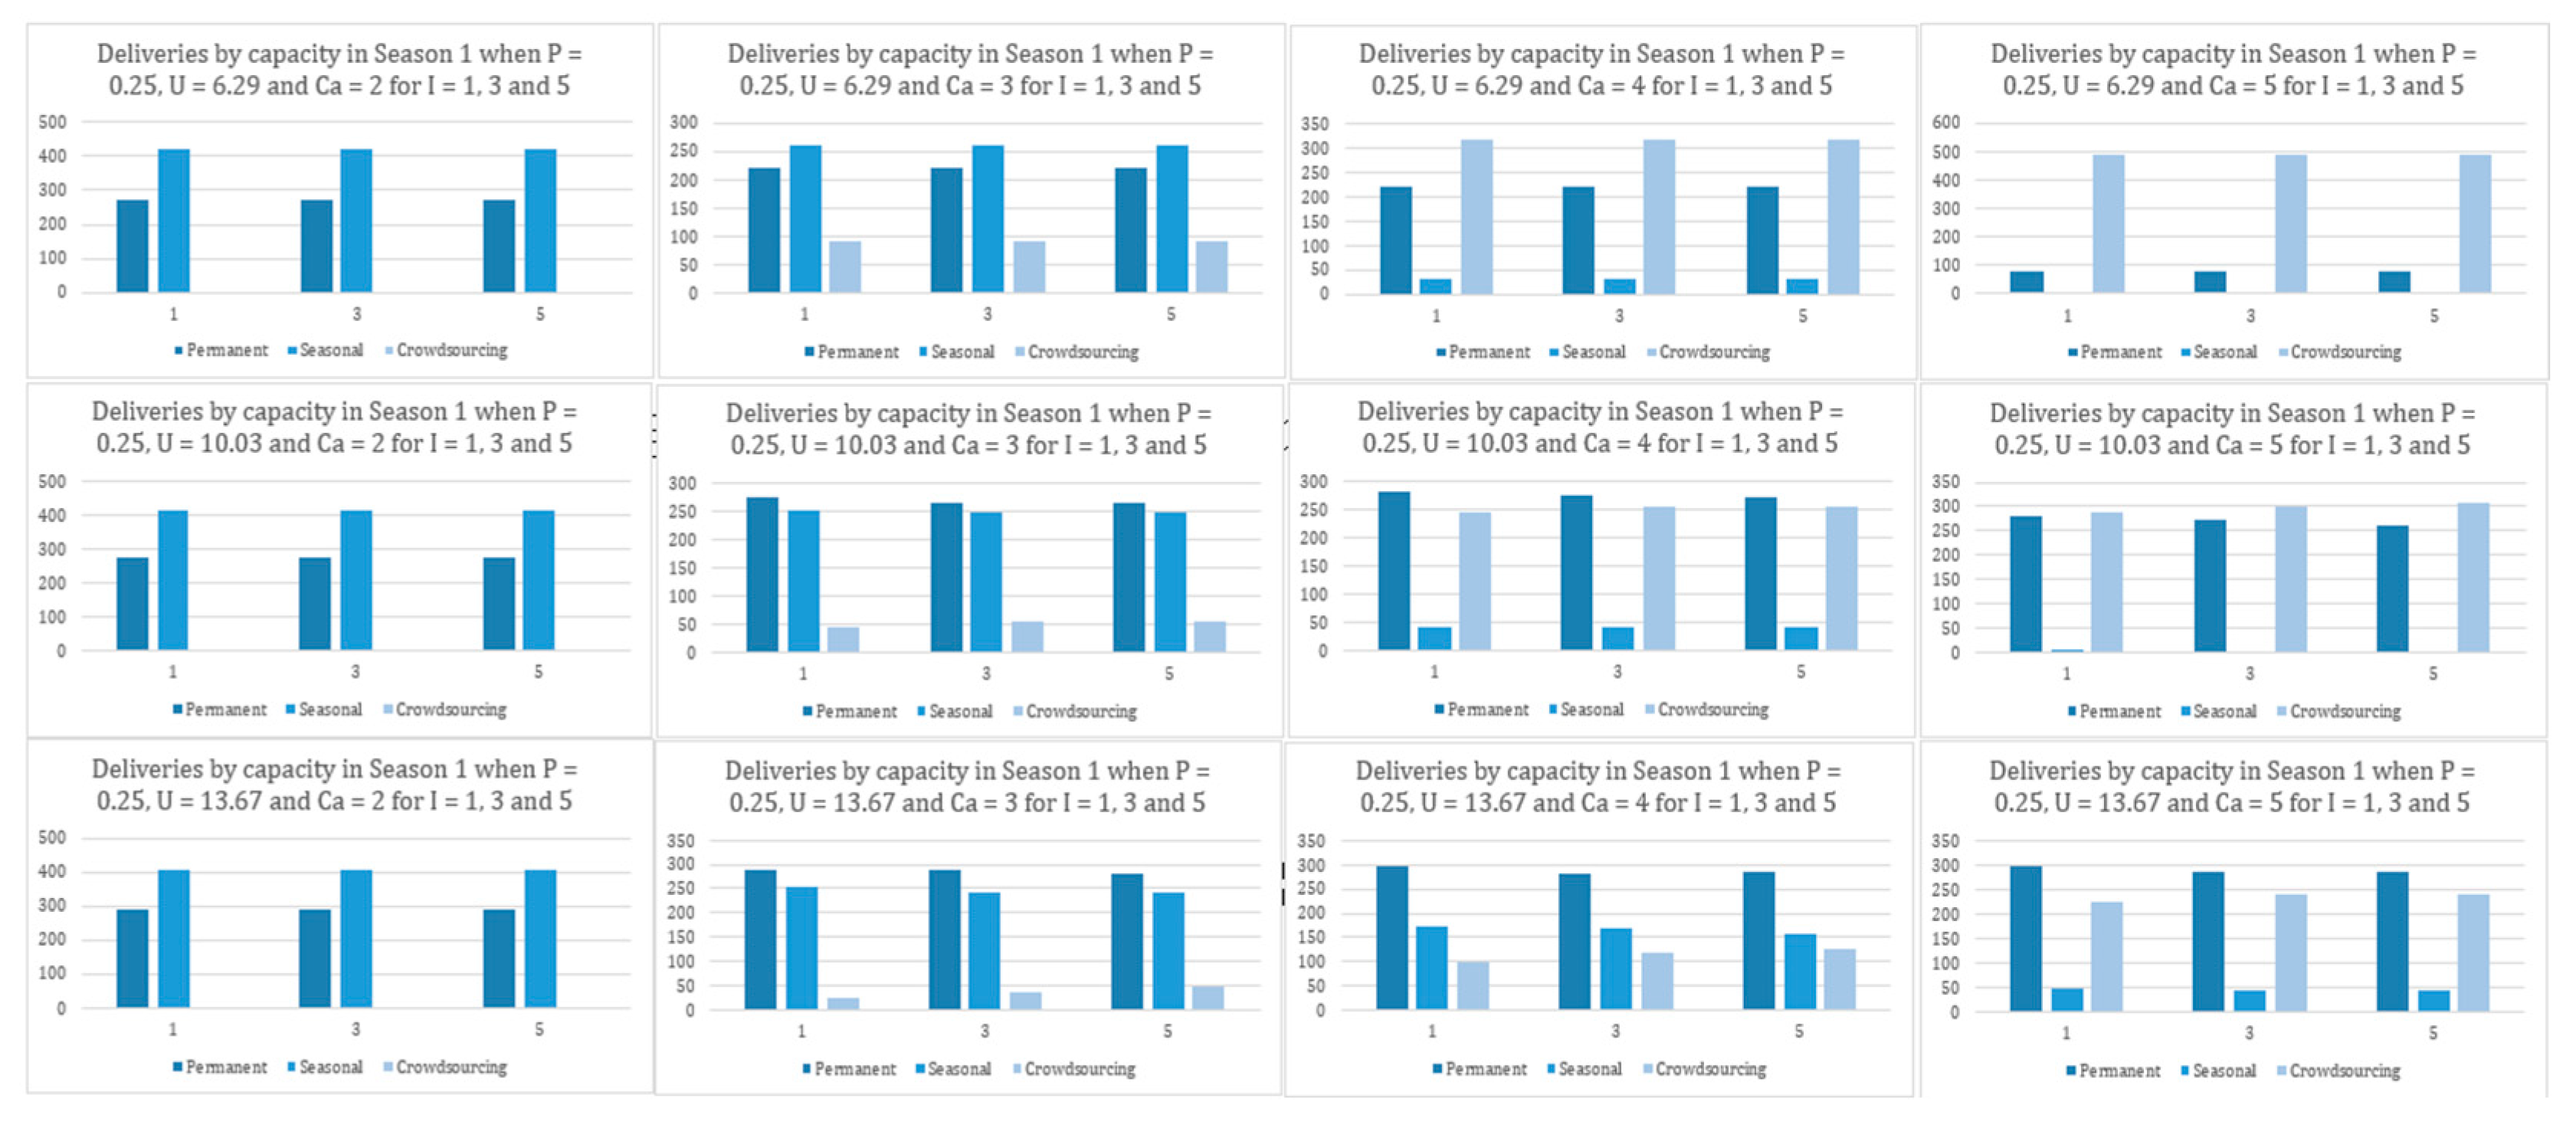
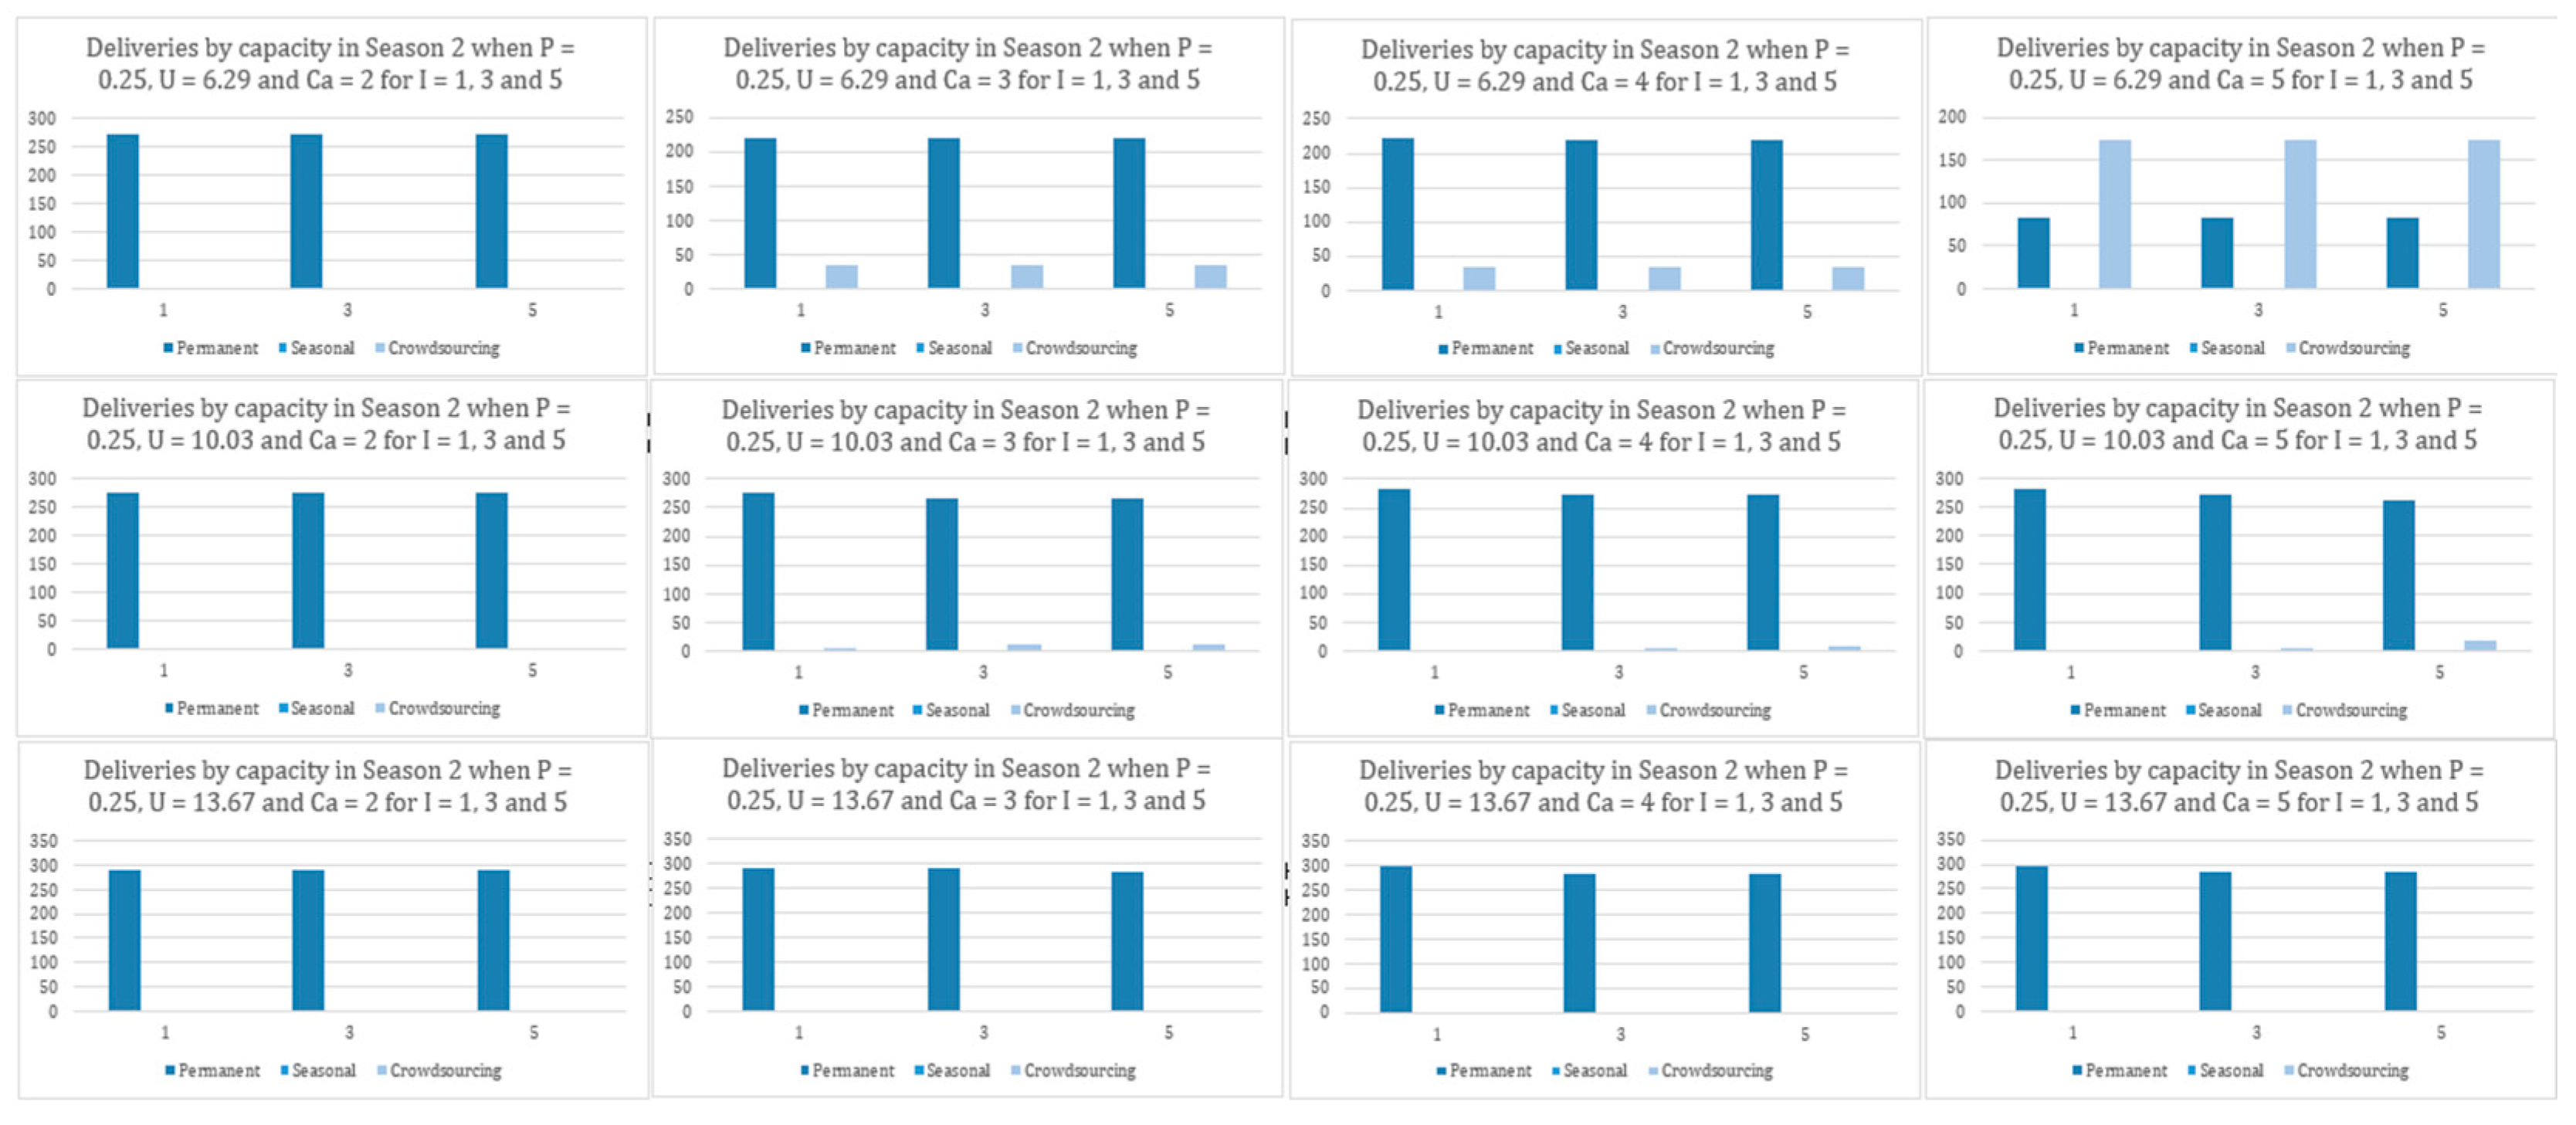
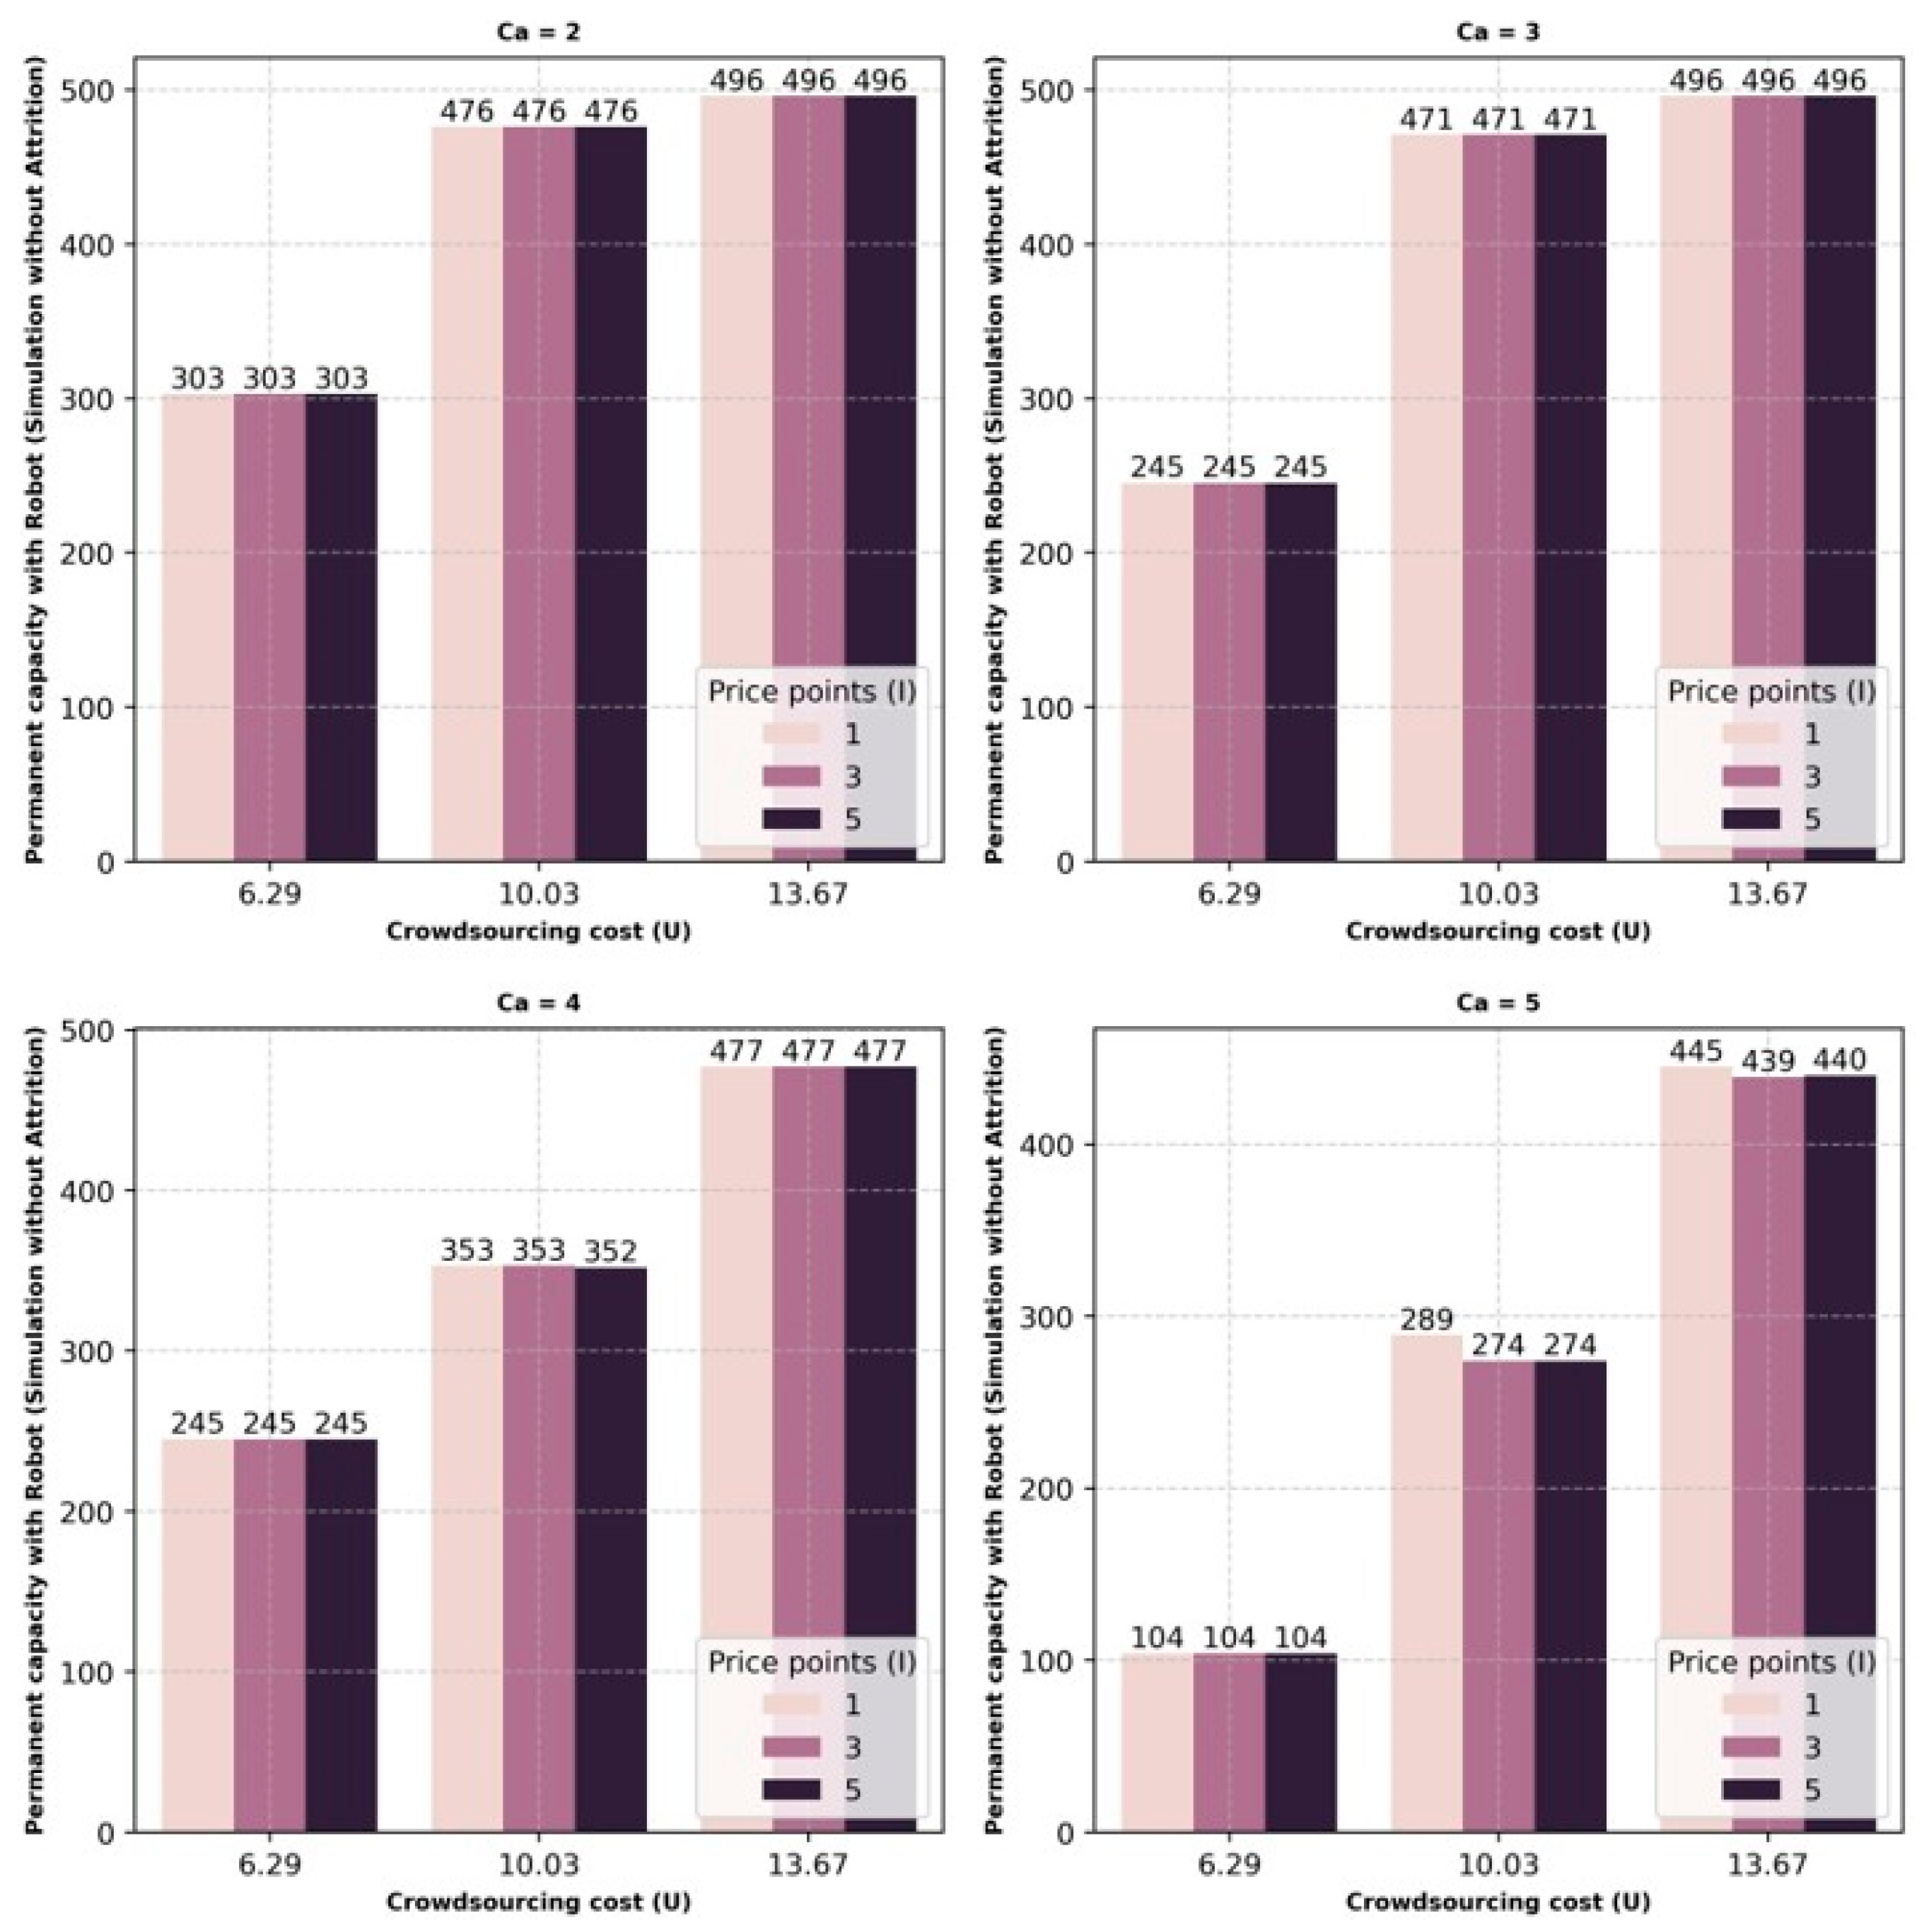
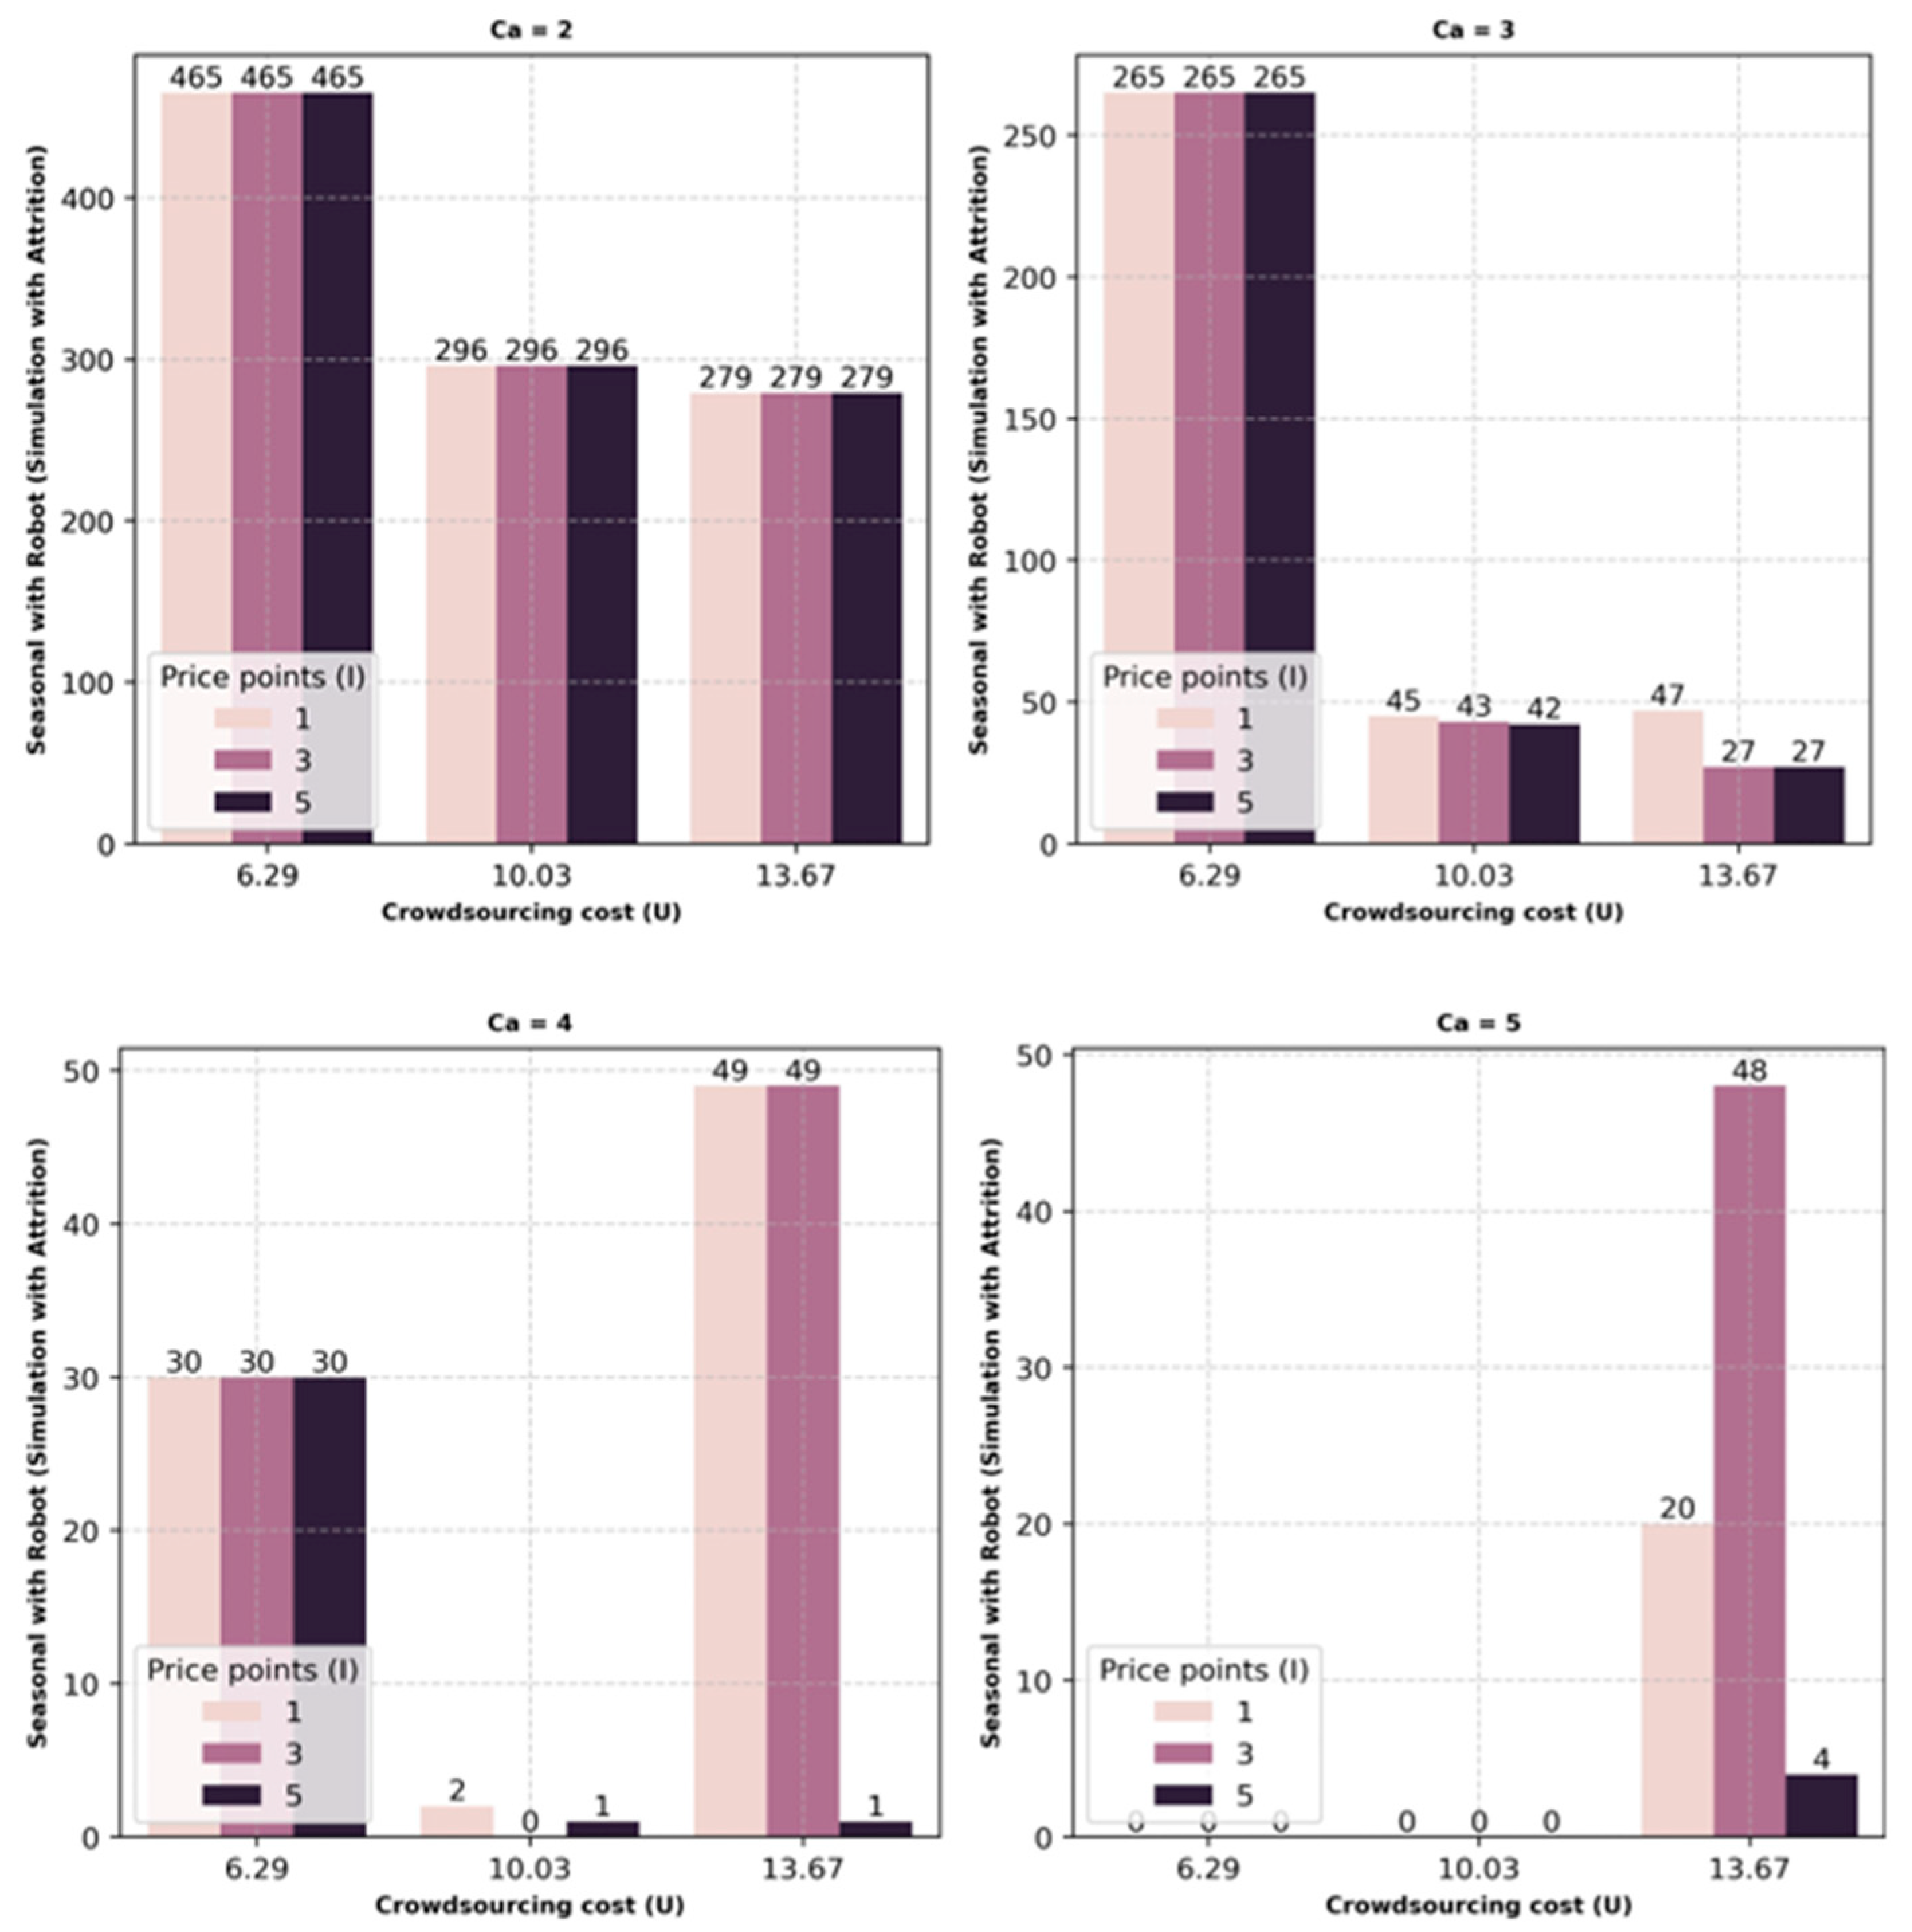
For this section of the Results, we present one set (for P = 0.25) of the results for Section 3.3.1 displayed in Figure 3, Figure 4, Figure 5, Figure 6, Figure 7 and Figure 8. These figures give the optimal combination of resources to be used considering permanent, seasonal, and crowdsourcing. The results are average values for each scenario considering the percentage variation P , capacity of crowdsourcing C a , and the number of cost intervals I for each of the three costs U . The permanent capacity is for the entire planning horizon, whereas the seasonal capacity is for the peak season. As observed in Figure 3, Figure 4, Figure 5, Figure 6, Figure 7 and Figure 8, with an increase in the expected capacity of crowdsourcing, there is an increase in the utilization of crowdsourcing capacity as well, for each case of U . With the increase in utilization of the crowdsourcing capacity, the seasonal capacity first starts to decrease with an average of 17.87% (with the exception of the scenario when U = 13.67 and C a = 5), and then finally, the permanent capacity is reduced by an average of 11.17%.
Figure 3 and Figure 4 give the trend of the optimal values of permanent and seasonal capacities when P = 0.25. It is interesting to note that as crowdsourcing capacity increases, the reliance on seasonal capacity first reduces, as in the case when C a increases and U reduces. As C a increases from 2 to 5, the percentage drop for seasonal average ranges from 35.22% to 100%, whereas permanent average ranges from 13.41% to 20.07%.
On the other hand, when attrition is considered, Figure 5 and Figure 6 show a similar trend but with lower permanent and seasonal capacities. As C a increases from 2 to 5, the percentage drop for seasonal average ranges from 39.06% to 100%, whereas for permanent capacity, averages range from 7.42% to 21.41%. This scenario motivates the use of available crowdsourcing capacity to meet the demand lost due to attrition.
As with an increase in crowdsourcing capacity C a and the variation in cost of the crowdsourcing capacity, it is observed that the utilization of crowdsourcing capacity is preferred, especially in cases where capacity is at maximum and the cost of crowdsourcing capacity is lowest, which is less than permanent and seasonal, as shown in Figure 7 and Figure 8. In addition, when crowdsourcing cost is high and capacity is low, seasonal capacity is preferred to keep the operational costs lower. Season 2 is observed to be fulfilled by the use of permanent capacity for the entire planning horizon. Overall, it is observed that attrition leads to lower permanent and seasonal capacity levels, which is in line with the fact that attrition reduces operational capacity.
With demand being seasonal in nature, where season 2 experiences lower expected demand, it is observed that the seasonal resources are only utilized in season 1, and in season 2, permanent capacity and crowdsourcing capacity are utilized. Another aspect to note is that as the utilization of crowdsourcing increases, the undelivered units also reduce, thereby improving the service level. This leads to the goal of achieving higher service levels while mitigating the impact due to employee attrition.

4.2. Traditional Capacities and Automation

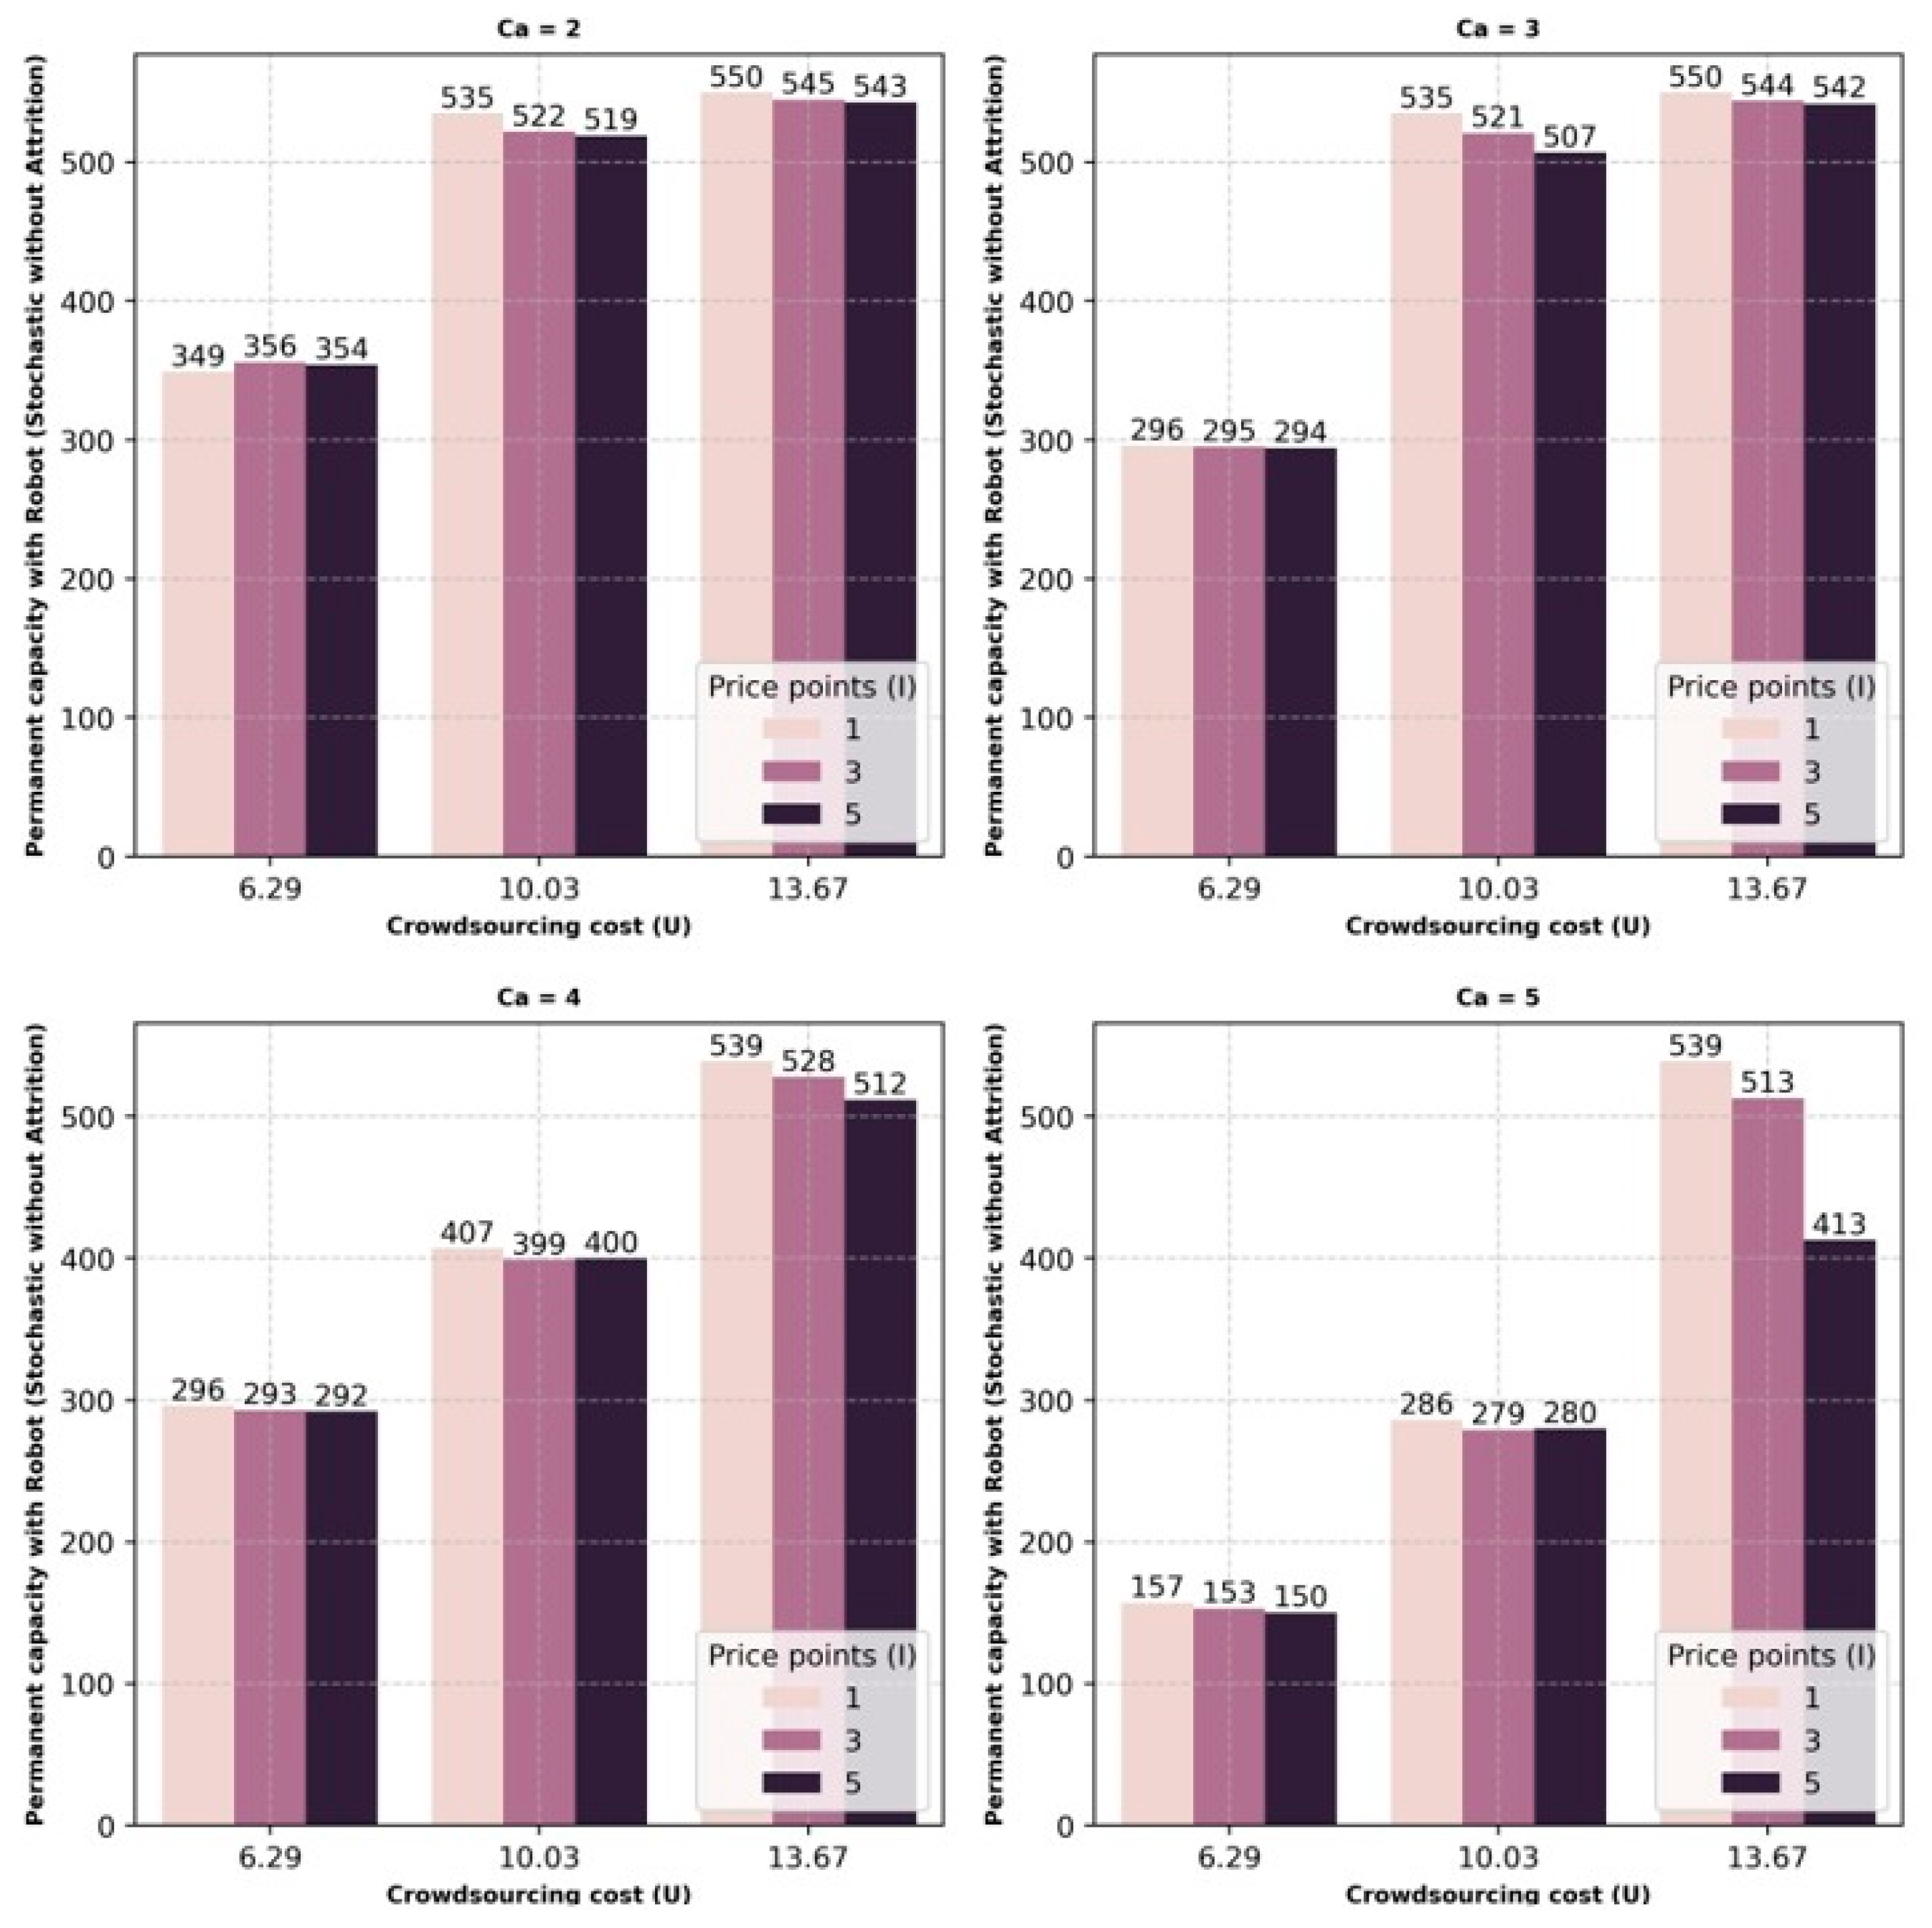
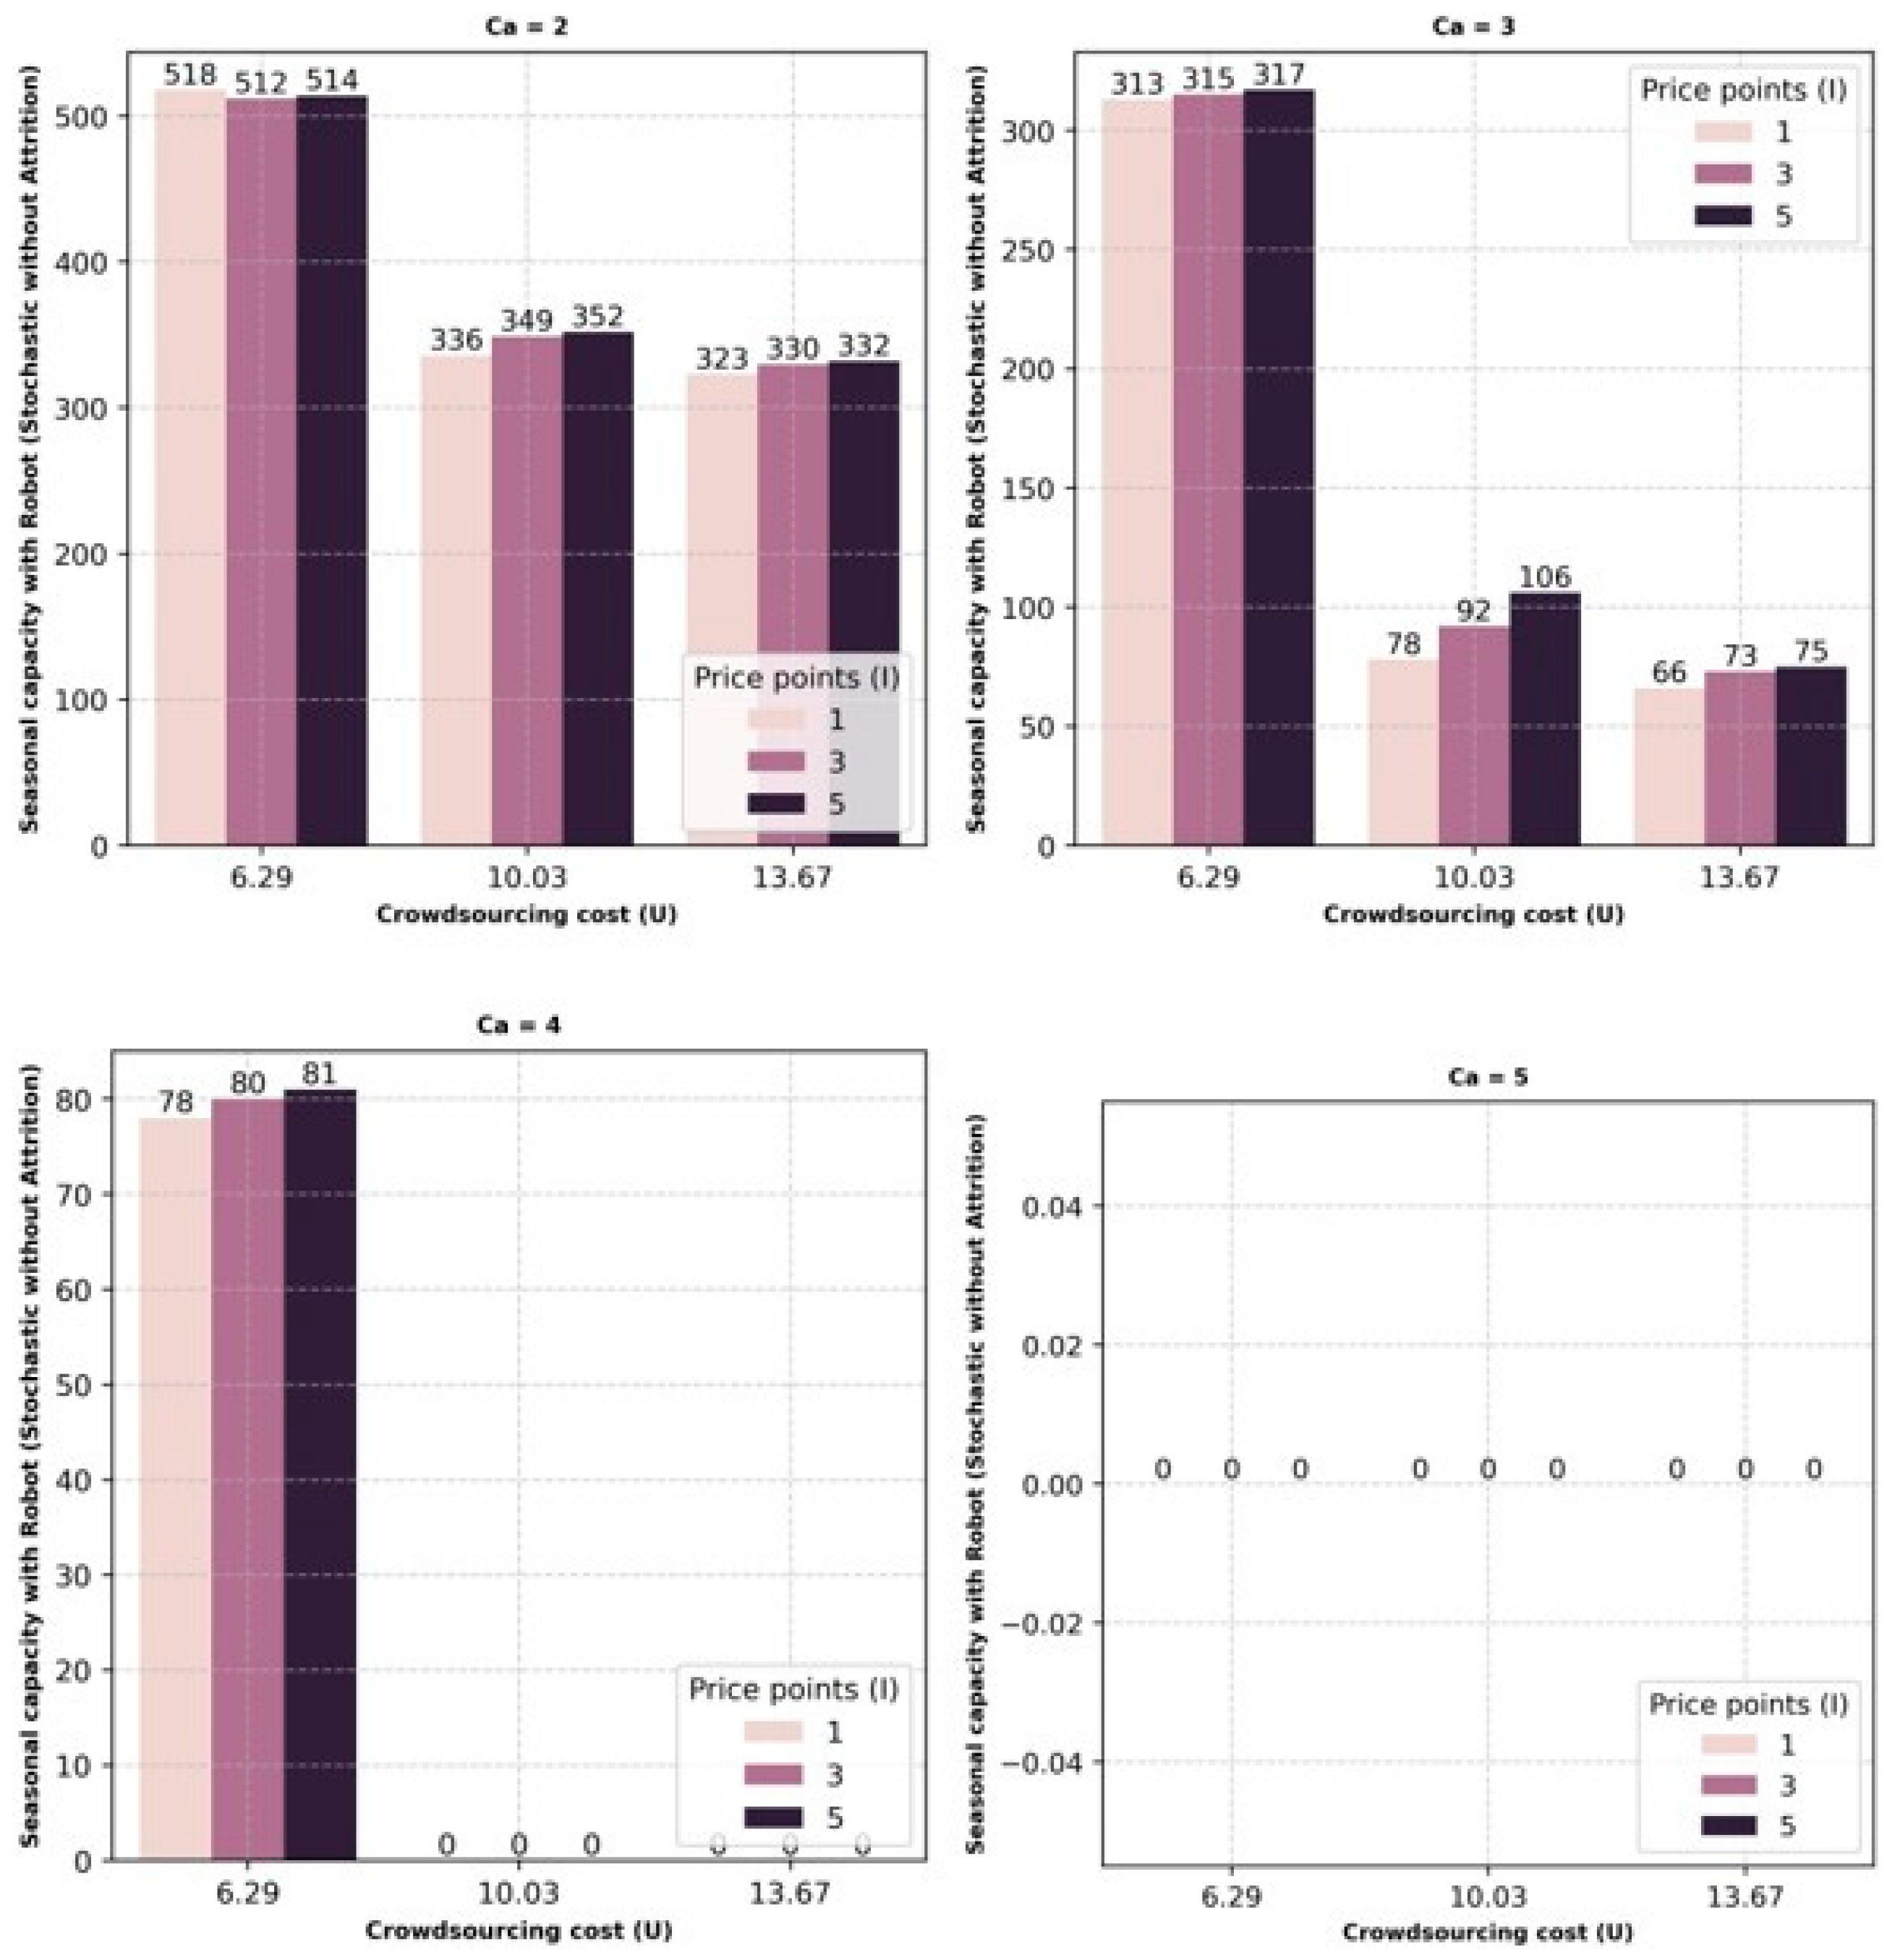
For this section of the Results, we present one set (for P = 0.25) of results for Section 3.3.2, displayed in Figure 9, Figure 10, Figure 11, Figure 12, Figure 13 and Figure 14. As observed in Figure 9, Figure 10, Figure 11, Figure 12, Figure 13 and Figure 14, with an increase in the expected capacity of crowdsourcing, there is an increase in the utilization of crowdsourcing capacity as well, for each case of U . With the increase in utilization of the crowdsourcing capacity, the seasonal capacity first starts to decrease with an average of 31.59% (with the exception of the scenario when U = 13.67 and C a = 5), and then finally, the permanent capacity is reduced by an average of 12.33%.
Figure 9 and Figure 10 are the output of the stochastic program with robots considered for last-mile delivery. As C a increases from 2 to 5, the percentage drop for seasonal average ranges from 63.48% to 100%, whereas permanent capacity averages range from 5.79% to 28.31%. The results show more dependence on robots with permanent capacity and less for seasonal capacity when compared with the case of no automation.
Simulation using robot delivery further refines the optimal combination considering attrition, as shown in Figure 11 and Figure 12. As C a increases from 2 to 5, the percentage drop for seasonal on average ranges from 72.10% to 100%, whereas permanent averages range from 6.73% to 28.64%. Here, it is observed that seasonal capacity drops out after considerable crowdsourcing capacity becomes available. The remaining surplus demand for a period is fulfilled using crowdsourcing capacity.
When the output with robot delivery is compared with traditional delivery, we see that robots tend to become the first choice, as they lower operational costs and improve service levels by mitigating the impact due to attrition. The utilization of seasonal capacity drastically reduces due to the significant cost benefits due to utilization of robots for various cases of C a .
Figure 13 and Figure 14 show deliveries by capacity types for seasons 1 and 2, respectively. Here, the preference for using robots can be observed. Seasonal capacity is reduced due to the merits of using robots and crowdsourcing capacity.
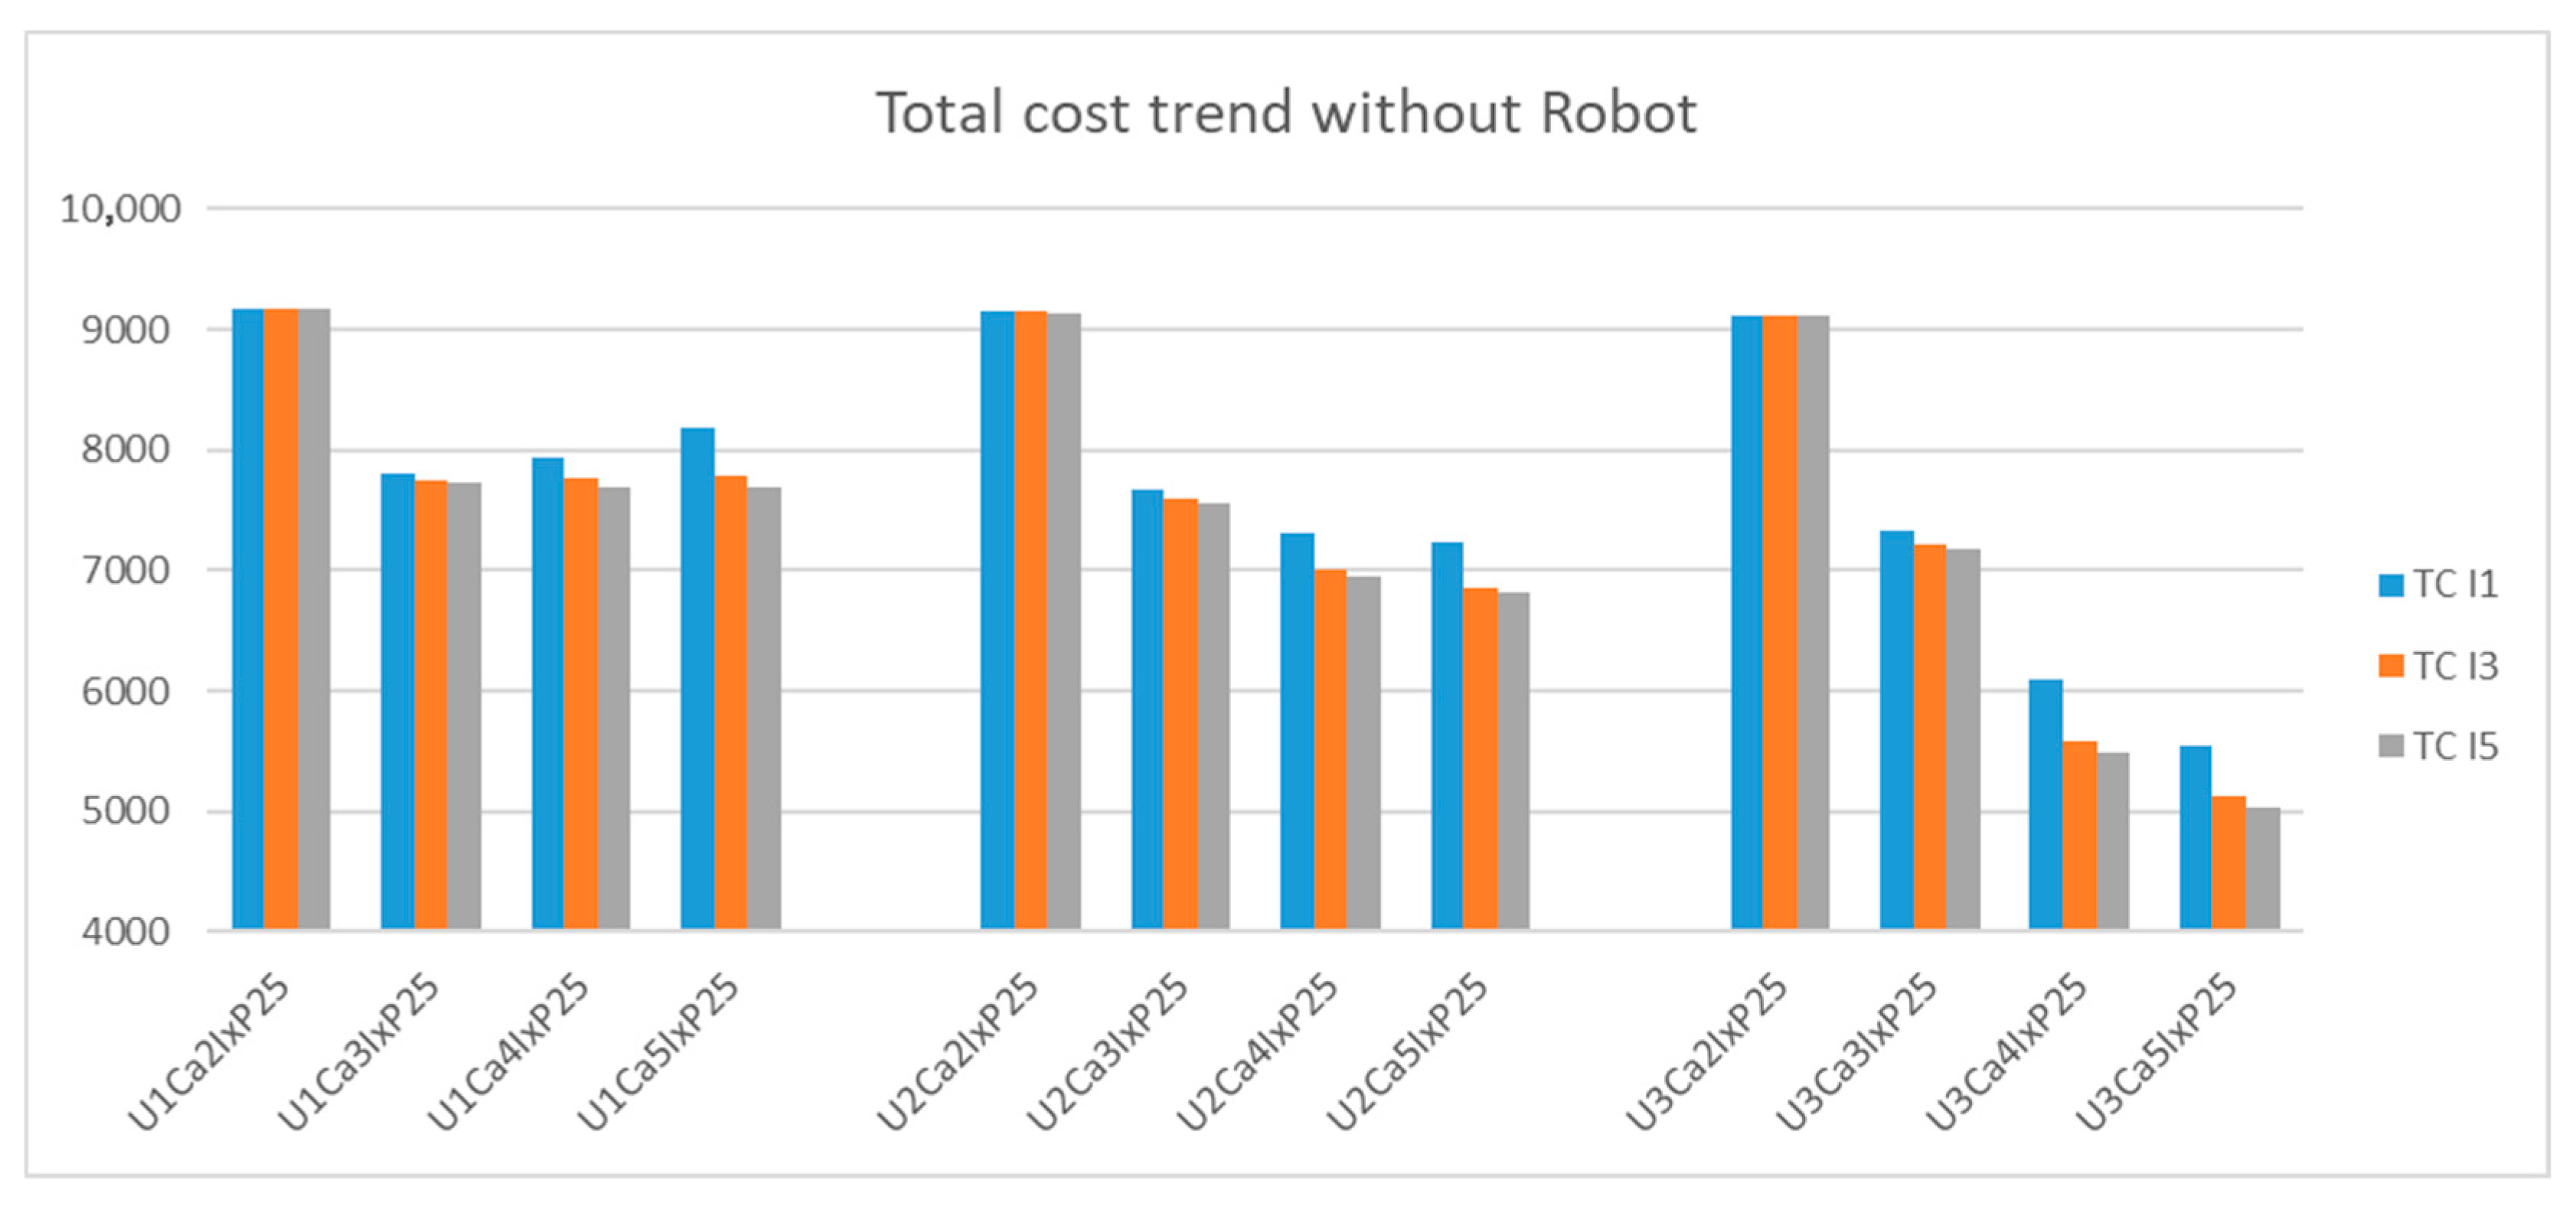
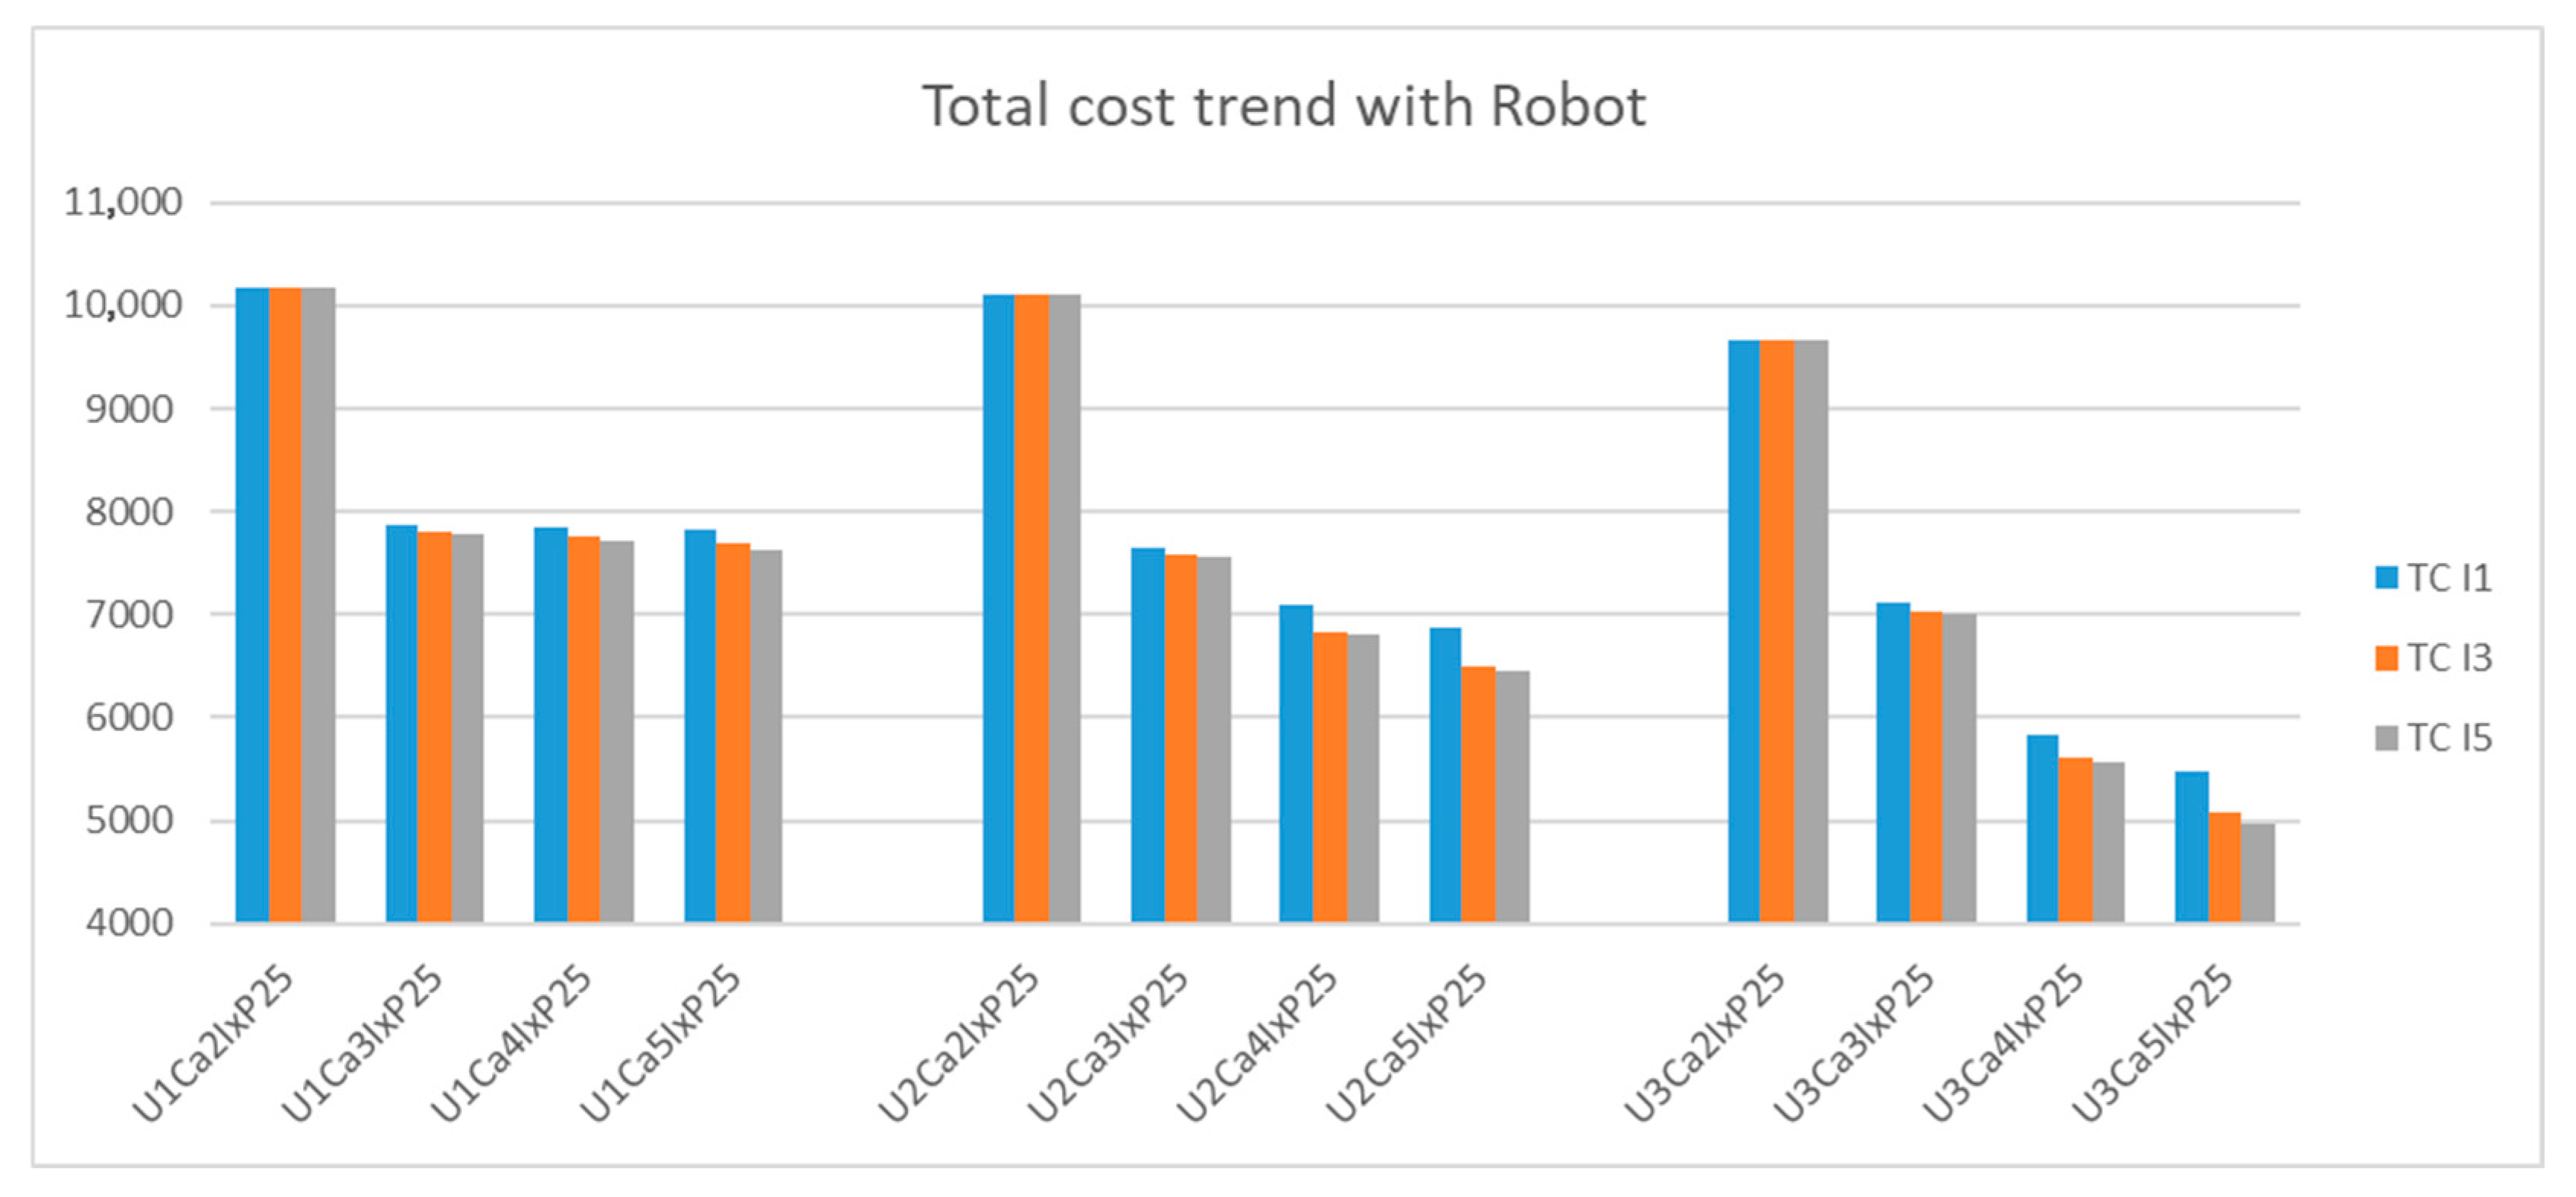
Figure 15 and Figure 16 give us the total cost trend with and without the use of robots for the various scenarios of crowdsourcing costs and capacity. It is interesting to note that not all situations lead to being profitable, but certain events with the crowdsourcing capacity and costs lead to the optimal solution with the lowest costs. Furthermore, the price variation I exhibits the same pattern for both the plots, i.e., the greater the price variation, the lower the operational costs, with an exception of the case of C a = 2, which is the lowest available crowdsourcing capacity. For C a > 2 and for I = 1, 3, and 5, as shown in Figure 15 and Figure 16, the total cost is observed to decrease as the number of price points increases. On average, when I moves from 1 to 3, there is an average reduction of 3.43% and a further reduction of 0.81% when I is at 5. This aligns with the expectation that the lowest-cost crowdsourcing capacities will be utilized first from the available pool for the respective scenario. Thus, the number of price points helps in lowering the total cost, which is dependent on the expected crowdsourcing capacity and the variation in the price points. The higher the variation in random crowdsourcing capacity price points, the lower the expected operational cost.
Finally, based on the cost savings observed in Figure 15 and Figure 16, the Return on Investment (ROI) also varied for each combination. The best ROI observed was 1.55 years, while the worst one was 6.18 years for the case of I = 1. For the case when C a = 2, there are no savings observed; thus, ROIs for these situations were not considered.

4.3. Sensitivity Analysis Results with Robot Cost and Capacity

In this section, the output of the sensitivity analyses with robot costs and capacities being varied is shown in Table 4. When comparing the results with Figure 11, Figure 12 and Figure 16 for the case of U = 13.67 and C a = 2, we observe that the total cost changes correspondingly with robot costs and capacities. That is, a lower robot cost or higher capacity leads to lower operational costs.

5. Discussion

This simulation study focused on assessing the impact of attrition of permanent and seasonal capacities and how advanced automation such as the use of robots might help in lowering operational costs.
The results from the simulation generated an optimal combination of permanent, seasonal, and crowdsourcing capacity that would lower operational costs or provide an optimal combination for last-mile delivery services. This combination was determined for each scenario, percentage variations, number of price points for crowdsourcing capacity costs, various capacities of crowdsourcing, and considering attrition for permanent and seasonal capacities. Within each scenario, as the capacity of crowdsourcing increases, the utilization of permanent and seasonal capacity reduces. Between permanent and seasonal capacity, a drastic decrease in seasonal capacity is observed, whereas the utilization of permanent capacity shows only a minor rate of decrease. With this drastic decrease in seasonal capacity, the utilization of crowdsourcing capacity is observed to increase, implying that a drop in the utilization of seasonal capacity is compensated for by crowdsourcing.
Based on the results, we refer to our three research questions and provide some managerial insights for aggregate capacity planning.
  • The biggest threat for delivery companies is that any loss of capacity will lead to dissatisfaction among customers from the impact on service levels. Flexible crowdsourcing capacity can support this organizational need by filling in whenever there is loss of capacity due to attrition. The on-demand nature of crowdsourcing capacity does indeed help overcome employee absence on short notice. This is a positive sign for businesses that can avoid lost revenue. The one caveat might be the capacity of crowdsourcing during a given period. As observed in the results, the reduction in seasonal or permanent capacities was lower when the crowdsourcing capacity was at its lowest and increased as the crowdsourcing capacity increased. Alternatively, this would imply that the optimum cost profile changes with the increase or decrease in the flexible crowdsourcing capacity. This information could be used to emphasize permanent or seasonal resources for regions or periods where it is expected that the crowdsourcing capacity will be low or high, for example, an urban versus rural environment or a holiday versus regular season.
  • The output of the numerical experiments considering the use of van–robot delivery provides us with some valuable insights for managerial decisions. Specifically, with regards to robots, they assist in lowering the service level impact as attrition is reduced. Addition of robots in last-mile delivery operations show cost savings opportunities in certain scenarios. With this van–robot combination, the preference for permanent capacity is higher due to the operation costs of automation. Crowdsourcing capacity is used to fill the gap only when permanent capacity becomes exhausted.
  • As observed in this simulation, the demand being random and the flexibility of the crowdsourcing considered assists in determining an optimal combination of capacities. This is carried out considering the crowdsourcing cost points and capacities. For businesses, this type of analysis will be beneficial in case of providing an aggregate capacity plan for the upcoming operational year. Having an understanding of the forecasted demand, costs of permanent and seasonal capacities, and expected capital investments for automation will be imperative. In addition, the costs and capacities of crowdsourcing available in a region will further motivate decision-makers to plan for optimal capacities where one can ensure that there is no expenditure for surplus capacity when demand is low and use crowdsourcing when the demand spikes. This analysis serves as an input point for decision-making. Managerial insights obtained from such studies will definitely be an added advantage for businesses providing last-mile delivery services.

6. Conclusions

In this study, we considered the impact of attrition to determine the optimal aggregate delivery capacity plan. In addition, we explored the use of automation to assist in further optimizing the operational costs and service levels. Through numerical experiments we observe cost savings for certain scenarios and opportunities for businesses to improve service levels.
Overall, this study provides businesses with insights needed for aggregate capacity planning when dealing with attrition, an option for automation, and an option for crowdsourcing. This analysis answered the fundamental questions necessary for capacity planning by determining an optimal capacity plan. Specifically, a business should have a solid understanding of the crowdsourcing capacity landscape, as crowdsourcing can provide added flexibility and the volume of demand, which is essential for justifying the ROI for automation projects. This is demonstrated in the results by available crowdsourcing capacity reducing the amount of seasonal capacity as opposed to permanent capacity. For automation projects, it was seen that project ROI was highly dependent on crowdsourcing costs and capacities, demonstrating the need to analyze a wide range of scenarios to identify the potential benefit of automation.
As for further research, it would be worthwhile to explore the stochastic nature of automation or examine the positive impact on the environment by easing traffic in a dense city scenario or reducing emissions. This has tremendous potential to lower operational costs and reduce environmental impact. Thus, more research can be carried out to understand the challenges and benefits new technologies will provide in the long run. Empirical case data or applying a business case to derive managerial insights is another direction for future research that can further test the validity of our results. The insights from this type of analysis are anticipated to assist with policy formulations regarding the use of automation in public spaces and business decisions.
Author Contributions

Conceptualization, R.S.; Methodology, R.S. and J.S.; Validation, J.S.; Formal analysis, R.S.; Writing—original draft, R.S.; Writing—review & editing, J.S.; Supervision, J.S. All authors have read and agreed to the published version of the manuscript.

Funding

This research received no external funding.

Institutional Review Board Statement

Not applicable.

Informed Consent Statement

Not applicable.

Data Availability Statement

The original contributions presented in this study are included in the article or through references. Further inquiries can be directed to the corresponding author.

Conflicts of Interest

The authors declare no conflicts of interest.

Abbreviations

The following abbreviations are used in this manuscript:
SPStochastic Program
SIMSimulation

Appendix A

Appendix A.1

Table A1. Parameter values used for this study.
ParameterValueReference
J 264[36]
K 2[36]
I 1, 3 and 5[37]
U U 1 = 13.67 ,   U 2 = 10.03   a n d   U 3 = 6.29 [36]
P 25% and 50%[37]
F 7.49[36]
E F 0.15[36]
S 11.23[36]
E S 0.45[36]
θ 59.88[36]
A ~ p j 2%[38] and Assumption
A ~ s j 3%[38] and Assumption

Appendix A.2

Table A2. Optimal permanent and seasonal capacity [37].
P U C a I Permanent ( T )Seasonal ( T k ) T Min T Max T k Min T k Max
0.2513.6721334460289389404504
0.2513.6723341450
0.2513.6725341452
0.2513.6731298292248348243343
0.2513.6733297293
0.2513.6735297293
0.2513.674129813424734774174
0.2513.6743296116
0.2513.6745295120
0.2513.67512980244344050
0.2513.67532900
0.2513.67552920
0.2510.0321325470277377415515
0.2510.0323328462
0.2510.0325328463
0.2510.0331288299237337249349
0.2510.0333287298
0.2510.0335286299
0.2510.03412889323733742142
0.2510.034328688
0.2510.034528593
0.2510.03512730217317050
0.2510.03532630
0.2510.03552630
0.256.2921320471271371421521
0.256.2923321470
0.256.2925322471
0.256.2931274306221321259359
0.256.2933269310
0.256.2935268311
0.256.29412738022032030130
0.256.294326977
0.256.294526683
0.256.2951133079179050
0.256.29531290
0.256.29551240

Appendix B

Appendix B.1

Table A3. Parameters for robot utilization for last-mile delivery services.
Robot Parameters/SpecificsValueUnitReference
Robot purchase priceUSD 3750.00USD[39]
Amortization time5YearsAssumption
Operating days per year264 [36]
Hours per day8 Assumption
Robot cost per hourUSD 0.36 Calculated
Markup (maintenance and electricity)50% Assumption
Robot cost per hour with markupUSD 0.53 Calculated
Max speed3.1Miles/HourAssumption [40]
Operating time12HoursAssumption [40]
Max load10KgAssumption [40]
Travel capacity of a robot in 8 h shift17.36MilesAssumption with idle and break time considered
One round trip from van to residence3MilesAssumption [40]
Delivery per robot on an 8 h shift5OrdersCalculated
Total robots in van8 Assumption [27]
Total deliveries on an 8 h shift40 Calculated
Robot cost with markup per dayUSD 34.09 Calculated
Cost of permanent capacity including vehicle costsUSD 239.68 [34]
Per order cost for a permanent capacity (F)USD 6.84 Calculated
Per order error cost for a permanent capacity (EF)USD 0.14 Calculated

Appendix B.2

Table A4. Parameter values for sensitivity analysis 1 and 2.
Sensitivity Analysis 1—Robot Cost
RunRobot cost per hour with markupFEF
10.436.680.13
20.6370.14
Sensitivity Analysis 2—Robot Capacity
RunTotal deliveries in an 8 h shiftFEF
1103.420.07
2152.280.05

References

  1. Ghaderi, H.; Tsai, P.-W.; Zhang, L.; Moayedikia, A. An integrated crowdshipping framework for green last mile delivery. Sustain. Cities Soc. 2022, 78, 103552. [Google Scholar] [CrossRef]
  2. Muñoz-Villamizar, A.; Velazquez-Martínez, J.C.; Caballero-Caballero, S. A large-scale last-mile consolidation model for e-commerce home delivery. Expert Syst. Appl. 2024, 235, 121200. [Google Scholar] [CrossRef]
  3. Snoeck, A.; Merchán, D.; Winkenbach, M. Revenue management in last-mile delivery: State-of-the-art and future research directions. Transp. Res. Procedia 2020, 46, 109–116. [Google Scholar] [CrossRef]
  4. Mohammad, W.A.; Diab, Y.N.; Elomri, A.; Triki, C. Innovative solutions in last mile delivery: Concepts, practices, challenges, and future directions. Supply Chain. Forum Int. J. 2023, 24, 151–169. [Google Scholar] [CrossRef]
  5. Fatehi, S.; Wagner, M.R. Crowdsourcing last-mile deliveries. Manuf. Serv. Oper. Manag. 2022, 24, 791–809. [Google Scholar] [CrossRef]
  6. Chu, H.; Zhang, W.; Bai, P.; Chen, Y. Data-driven optimization for last-mile delivery. Complex Intell. Syst. 2023, 9, 2271–2284. [Google Scholar] [CrossRef]
  7. Ostermeier, M.; Heimfarth, A.; Hübner, A. The multi-vehicle truck-and-robot routing problem for last-mile delivery. Eur. J. Oper. Res. 2023, 310, 680–697. [Google Scholar] [CrossRef]
  8. Pahwa, A.; Jaller, M. A cost-based comparative analysis of different last-mile strategies for e-commerce delivery. Transp. Res. Part E Logist. Transp. Rev. 2022, 164, 102783. [Google Scholar] [CrossRef]
  9. Donne, D.D.; Alfandari, L.; Archetti, C.; Ljubić, I. Freight-on-Transit for urban last-mile deliveries: A strategic planning approach. Transp. Res. Part B Methodol. 2023, 169, 53–81. [Google Scholar] [CrossRef]
  10. Mangiaracina, R.; Perego, A.; Seghezzi, A.; Tumino, A. Innovative solutions to increase last-mile delivery efficiency in B2C e-commerce: A literature review. Int. J. Phys. Distrib. Logist. Manag. 2019, 49, 901–920. [Google Scholar] [CrossRef]
  11. Boysen, N.; Schwerdfeger, S.; Weidinger, F. Scheduling last-mile deliveries with truck-based autonomous robots. Eur. J. Oper. Res. 2018, 271, 1085–1099. [Google Scholar] [CrossRef]
  12. Guo, X.; Jaramillo, Y.J.L.; Bloemhof-Ruwaard, J.; Claassen, G. On integrating crowdsourced delivery in last-mile logistics: A simulation study to quantify its feasibility. J. Clean. Prod. 2019, 241, 118365. [Google Scholar] [CrossRef]
  13. Lyons, T.; McDonald, N.C. Last-mile strategies for urban freight delivery: A systematic review. Transp. Res. Rec. 2023, 2677, 1141–1156. [Google Scholar] [CrossRef]
  14. Alnaggar, A.; Gzara, F.; Bookbinder, J.H. Crowdsourced delivery: A review of platforms and academic literature. Omega 2021, 98, 102139. [Google Scholar] [CrossRef]
  15. Pourrahmani, E.; Jaller, M. Crowdshipping in last mile deliveries: Operational challenges and research opportunities. Socio-Econ. Plan. Sci. 2021, 78, 101063. [Google Scholar] [CrossRef]
  16. Savelsbergh, M.W.; Ulmer, M.W. Challenges and opportunities in crowdsourced delivery planning and operations. 4OR 2022, 20, 1–21. [Google Scholar] [CrossRef]
  17. Castillo, V.E.; Bell, J.E.; Rose, W.J.; Rodrigues, A.M. Crowdsourcing last mile delivery: Strategic implications and future research directions. J. Bus. Logist. 2018, 39, 7–25. [Google Scholar] [CrossRef]
  18. Perboli, G.; Rosano, M.; Wei, Q. A simulation-optimization approach for the management of the on-demand parcel delivery in sharing economy. IEEE Trans. Intell. Transp. Syst. 2021, 23, 10570–10582. [Google Scholar] [CrossRef]
  19. Dupljanin, D.; Mirkovic, M.; Dumnic, S.; Culibrk, D.; Milisavljevic, S.; Sarac, D. Urban crowdsourced last mile delivery: Mode of transport effects on fleet performance. Int. J. Simul. Model. 2019, 18, 441–452. [Google Scholar] [CrossRef]
  20. Huang, B.; Zhu, H.; Liu, D.; Wu, N.; Qiao, Y.; Jiang, Q. Solving last-mile logistics problem in spatiotemporal crowdsourcing via role awareness with adaptive clustering. IEEE Trans. Comput. Soc. Syst. 2021, 8, 668–681. [Google Scholar] [CrossRef]
  21. Castillo, V.E.; Bell, J.E.; Mollenkopf, D.A.; Stank, T.P. Hybrid last mile delivery fleets with crowdsourcing: A systems view of managing the cost-service trade-off. J. Bus. Logist. 2022, 43, 36–61. [Google Scholar] [CrossRef]
  22. Simoni, M.D.; Marcucci, E.; Gatta, V.; Claudel, C.G. Potential last-mile impacts of crowdshipping services: A simulation-based evaluation. Transportation 2020, 47, 1933–1954. [Google Scholar] [CrossRef]
  23. Zou, G.; Gao, M.; Tang, J.; Yilmaz, L. Simulation of online food ordering delivery strategies using multi-agent system models. J. Simul. 2023, 17, 297–311. [Google Scholar] [CrossRef]
  24. Lemardelé, C.; Estrada, M.; Pagès, L.; Bachofner, M. Potentialities of drones and ground autonomous delivery devices for last-mile logistics. Transp. Res. Part E Logist. Transp. Rev. 2021, 149, 102325. [Google Scholar] [CrossRef]
  25. Ostermeier, M.; Heimfarth, A.; Hübner, A. Cost-optimal truck-and-robot routing for last-mile delivery. Networks 2022, 79, 364–389. [Google Scholar] [CrossRef]
  26. Jennings, D.; Figliozzi, M. Study of sidewalk autonomous delivery robots and their potential impacts on freight efficiency and travel. Transp. Res. Rec. 2019, 2673, 317–326. [Google Scholar]
  27. Reed, S.; Campbell, A.M.; Thomas, B.W. The value of autonomous vehicles for last-mile deliveries in urban environments. Manag. Sci. 2022, 68, 280–299. [Google Scholar] [CrossRef]
  28. Yu, S.; Puchinger, J.; Sun, S. Van-based robot hybrid pickup and delivery routing problem. Eur. J. Oper. Res. 2022, 298, 894–914. [Google Scholar] [CrossRef]
  29. Simoni, M.D.; Kutanoglu, E.; Claudel, C.G. Optimization and analysis of a robot-assisted last mile delivery system. Transp. Res. Part E Logist. Transp. Rev. 2020, 142, 102049. [Google Scholar] [CrossRef]
  30. Kapser, S.; Abdelrahman, M. Acceptance of autonomous delivery vehicles for last-mile delivery in Germany–Extending UTAUT2 with risk perceptions. Transp. Res. Part C Emerg. Technol. 2020, 111, 210–225. [Google Scholar] [CrossRef]
  31. Pani, A.; Mishra, S.; Golias, M.; Figliozzi, M. Evaluating public acceptance of autonomous delivery robots during COVID-19 pandemic. Transp. Res. Part D Transp. Environ. 2020, 89, 102600. [Google Scholar] [CrossRef]
  32. Heimfarth, A.; Ostermeier, M.; Hübner, A. A mixed truck and robot delivery approach for the daily supply of customers. Eur. J. Oper. Res. 2022, 303, 401–421. [Google Scholar] [CrossRef]
  33. Alfandari, L.; Ljubić, I.; Da Silva, M.D.M. A tailored Benders decomposition approach for last-mile delivery with autonomous robots. Eur. J. Oper. Res. 2022, 299, 510–525. [Google Scholar] [CrossRef]
  34. Liu, D.; Kaisar, E.I. Enhancing E-Grocery-Delivery-Network Resilience with Autonomous Delivery Robots. Appl. Sci. 2023, 13, 10659. [Google Scholar] [CrossRef]
  35. Engesser, V.; Rombaut, E.; Vanhaverbeke, L.; Lebeau, P. Autonomous Delivery Solutions for Last-Mile Logistics Operations: A Literature Review and Research Agenda. Sustainability 2023, 15, 2774. [Google Scholar] [CrossRef]
  36. Szmerekovsky, J.G.; Srinivasan, R.; Wadhwa, S.S. Aggregate delivery capacity planning with a crowdsourcing option. Comput. Ind. Eng. 2023, 185, 109609. [Google Scholar] [CrossRef]
  37. Szmerekovsky, J.; Srinivasan, R. Strategic Decision-making Tool for The Last Mile Delivery Using Stochastic Programming. In Proceedings of the Informs Annual Conference 2022, Indianapolis, IN, USA, 16–19 October 2022. [Google Scholar]
  38. U.S. Bureau of Labor Statistics. Economic News Release. Table 4. Quits Levels and Rates by Industry and Region, Seasonally Adjusted 2024. Available online: https://www.bls.gov/news.release/jolts.t04.htm#jolts_table4.f.2 (accessed on 8 August 2024).
  39. Hossain, M. Self-Driving Robots: A Revolution in the Local Delivery. 2022. Available online: https://cmr.berkeley.edu/2022/04/self-driving-robots-a-revolution-in-the-local-delivery/ (accessed on 8 August 2024).
  40. Available online: https://www.starship.xyz/our-robots/ (accessed on 8 August 2024).
Figure 1. Simulation flow chart.
Logistics 09 00156 g001
Figure 2. Example last-mile delivery flow with a van–robot combination and five communities.
Logistics 09 00156 g002
Figure 3. Optimal permanent capacity when P = 0.25, U = 6.29–13.67, C a = 2 to 5, and I = 1, 3, and 5.
Logistics 09 00156 g003
Figure 4. Optimal seasonal capacity trend when P = 0.25, U = 6.29–13.67, C a = 2 to 5, and I = 1, 3, and 5.
Logistics 09 00156 g004
Figure 5. Optimal permanent capacity when P = 0.25, U = 6.29–13.67, C a = 2 to 5, and I = 1, 3, and 5.
Logistics 09 00156 g005
Figure 6. Optimal seasonal capacity trend when P = 0.25, U = 6.29–13.67, C a = 2 to 5, and I = 1, 3, and 5.
Logistics 09 00156 g006
Figure 7. Deliveries by capacity for season 1 when P = 0.25, U = 6.29–13.67, C a = 2 to 5, and I = 1, 3, and 5.
Logistics 09 00156 g007
Figure 8. Deliveries by capacity for season 2 when P = 0.25, U = 6.29–13.67, C a = 2 to 5, and I = 1, 3, and 5.
Logistics 09 00156 g008
Figure 9. Permanent capacity with robot delivery for the stochastic program with van–robot delivery when P = 0.25, U = 6.29–13.67, C a = 2 to 5, and I = 1, 3, and 5.
Logistics 09 00156 g009
Figure 10. Seasonal capacity with robot delivery for the stochastic program with van–robot delivery when P = 0.25, U = 6.29–13.67, C a = 2 to 5, and I = 1, 3, and 5.
Logistics 09 00156 g010
Figure 11. Permanent capacity with robot delivery for simulation with van–robot delivery when P = 0.25, U = 6.29–13.67, C a = 2 to 5, and I = 1, 3, and 5.
Logistics 09 00156 g011
Figure 12. Seasonal capacity with robot delivery for simulation with van–robot delivery when P = 0.25, U = 6.29–13.67, C a = 2 to 5, and I = 1, 3, and 5.
Logistics 09 00156 g012
Figure 13. Deliveries by capacity for season 1 when P = 0.25, U = 6.29–13.67, C a = 2 to 5, and I = 1, 3, and 5.
Logistics 09 00156 g013
Figure 14. Deliveries by capacity for season 2 when P = 0.25, U = 6.29–13.67, C a = 2 to 5, and I = 1, 3, and 5.
Logistics 09 00156 g014
Figure 15. Total cost trend without robots.
Logistics 09 00156 g015
Figure 16. Total cost trend with robots.
Logistics 09 00156 g016
Table 1. Constant parameters.
ParameterDefinition
J Number of periods in the planning horizon
K Number of seasons in the planning horizon
I Number of different cost points for crowdsourcing capacity
H Number of instances used to model random variables
U Expected value of a crowdsourcing cost point
P Percentage variation in the cost points generated for crowdsourcing capacity costs
F Per period cost of permanent capacity to make one delivery
E F Variable cost of one unit of demand being satisfied by permanent capacity
S Per period cost of seasonal capacity to make one delivery
E S Variable cost of one unit of demand being satisfied by seasonal capacity
θ Cost per unit of demand over capacity
σ ( j )Season in which period j occurs
H r Hiring cost of an employee
C T Deliveries per employee when permanent capacity is used
C T k Deliveries per employee when seasonal capacity is used
Table 2. Decision variables for simulation.
Decision VariableDefinition
T Permanent capacity
T k Seasonal capacity in season k
Table 3. Random parameters.
Random ParameterDefinition
D ~ j Demand in period j
C ~ i j Cost per unit of demand (including expected error cost) satisfied by crowdsourcing capacity in period j at cost point i
b ~ i j Available crowdsourcing capacity in period j at cost C ~ i j
A ~ p j Permanent employee attrition for period j
A ~ s j Seasonal employee attrition for period j
T ~ a c t j Permanent capacity in period j after attrition
P ~ j Units of demand satisfied by permanent capacity on day j
T ~ k a c t j Seasonal capacity in period j season k after attrition
S k ~ j Units of demand satisfied by seasonal capacity on day j
H ~ C P j Hiring cost for permanent capacity loss in period j
H ~ C S j Hiring cost for seasonal capacity loss in period j
X D ~ j Demand available for crowdsourcing at cost C ~ i j
X C ~ i j Units of demand satisfied by crowdsourcing at cost C ~ i j
W ~ j Unsatisfied demand in period j
D n ~ j New demand for period j including unsatisfied demand ( W ~ j ) rolled over from period j − 1
T C ~ j Total cost in period j
Table 4. Output of sensitivity analysis 1 and 2 for U = 13.67 and C a = 2.
Sensitivity Analysis 1—Robot CostPermanentSeasonalTotal Cost
1Decreased49627910,014.7
2Increased49627910,341.7
Sensitivity Analysis 2—Robot CapacityPermanentSeasonalTotal Cost
1104962796724.2
2154962795574.6
Disclaimer/Publisher’s Note: The statements, opinions and data contained in all publications are solely those of the individual author(s) and contributor(s) and not of MDPI and/or the editor(s). MDPI and/or the editor(s) disclaim responsibility for any injury to people or property resulting from any ideas, methods, instructions or products referred to in the content.